Article

Performance Study of Booster-Driven Hybrid Cooling Units for Free Cooling in Data Centers

1
State Key Laboratory of Air-Conditioning Equipment and System Energy Conservation, Zhuhai 519070, China
2
Gree Electric Appliances, Inc. of Zhuhai, Zhuhai 519000, China
3
Department of Refrigeration and Cryogenics Engineering, Beijing University of Technology, Beijing 100124, China
*
Author to whom correspondence should be addressed.
Sustainability 2023, 15(19), 14558; https://doi.org/10.3390/su151914558
Submission received: 16 August 2023 / Revised: 25 September 2023 / Accepted: 27 September 2023 / Published: 7 October 2023
(This article belongs to the Topic Clean and Low Carbon Energy)

Abstract

:
In the data center, using ambient energy cooling technology can effectively reduce the average power use efficiency, and the heat pipe as an effective use of ambient energy device has attracted much attention. For the dynamic heat pipe, reducing the power consumption of the pump effectively is the key to improving the efficiency. In this paper, the rotary booster is selected as the gas phase booster device of the heat pipe unit, the standard unit of the rotary booster is improved, and three types of boosters are obtained, including two improved boosters and one standard unit. Comparative test studies are conducted on three different types of boosters, and the power of the booster shows a downward trend with the increase in indoor and outdoor temperature differences (outdoor temperature decreases). With the increase in indoor and outdoor temperature differences, the cooling capacity increases first and then decreases. When the indoor and outdoor temperature difference is greater than 20 °C, the suction pressure of the booster is greater than the saturated condensing pressure force under outdoor ambient temperature, and the work of the booster decreases. Among the three types of boosters, the medium pressure ratio booster energy efficiency ratio (EER) is the largest. After throttling the standard unit, results show that its cooling capacity unit increases, but the booster power also increases, and the EER is still smaller than that of the improved unit.

1. Introduction

With the development of big data, data centers are widely used. The energy flow density of data centers is high, and the unit energy consumption increases rapidly, so reducing the energy consumption of the computer room is urgent [1]. Among the computer room equipment, the energy consumption of the air conditioning system accounts for a large proportion of about 30–50% [2], so reducing the air conditioning energy consumption is a technical route to save energy in the computer room. Using natural cooling sources to cool down the data centers is another way to reduce air conditioning energy consumption. The heat pipe as a device that can effectively utilize the natural cold source is widely studied and applied by scholars. Li et al. [3] studied the performance of heat pipe composite machine room air conditioning; when the outdoor ambient temperature is 7 °C, the separated heat pipe cooling capacity reaches a maximum value of 4575 W, and the energy efficiency ratio (EER) can reach 17.99. Shi et al. [4] combined the separated heat pipe unit with the vapor compression refrigeration unit to make a year-round machine room composite air conditioning system. Compared to the conventional base station air conditioning in the same conditions, it can save 30–45% energy in the experiments [5]. However, the separation of heat pipe as an auxiliary cooling equipment for computer room air conditioning occupies a large space in the computer room and has high requirements for unit installation. In the unit of the long pipeline or the machine room under the density of large heat flow, if the kinetic energy of the unit is low, a portion of the condenser may be in the “useless” state, the device increases the temperature difference, and the unit heat dissipation effect deteriorates [6]. Wang et al. [7] proposed a series of heat exchanger vapor compression and heat pipe composite system, heat pipe loop in the plate heat exchanger, and air-cooled heat exchanger. To overcome the flow resistance, the pump drive is added to the heat pipe loop [8]. The results showed that the addition of a pump to the liquid loop could solve the problems of underpowered split heat pipe units and excessive installation requirements.
Wang et al. [9] studied a shielded pump-driven loop heat pipe to cool the data room. The EER was 15.4 when the indoor and outdoor temperature difference was 20 °C, which is 3–5 times the EER than the ordinary vapor compression refrigeration. Zhou et al. [10] designed a shielded pump and magnetic pump-driven loop heat pipe unit based on the loop heat pipe, conducted experimental studies on start-up characteristics, heat transfer performance, and circulation characteristics, and applied the unit to a small data room in Beijing; the results showed that compared with the use of air-conditioning heat dissipation, 20.18% of electrical energy could be saved. The liquid pump vaporizes during operation, and the flow may be broken in some experiments and applications [11]. Therefore, Wei et al. [12] designed a gas-phase-driven heat pipe cycle using a sliding vane compressor and tested its cycle performance under different charging volumes, height differences, and temperature differences. The results showed that the experimental prototype reached an EER of 7.705 when the temperature difference was 30 °C. Wang et al. [13] investigated the gas- and liquid-powered separated heat pipes for the natural cooling needs of data centers and designed a 10 kW three-mode composite air-conditioning prototype. The performance tests were conducted in the standard enthalpy difference method laboratory. The results showed that when the indoor and outdoor temperature differences reached 20 °C, the gas-powered split heat pipe could be used to replace the vapor compression refrigeration system (under the same cooling capacity), which can save about 8–10% of energy. Shi et al. [14] used a DC speed-regulated compressor as a gas booster to drive the loop heat pipe, and the results showed that when the indoor and outdoor temperature differences were more than 20 °C, the EER of heat pipe circulation with gas pressurization separation reached 3.9, and the energy saving rate was about 8%. When the indoor and outdoor temperature differences were 30 °C, the EER reached 7.6, with an energy-saving rate of 70%.
As mentioned above, for the complex system with long pipelines or high heat flux dissipation needs, the conventional heat pipe assisted with gravity cannot work in many fields because of its essential height difference and weak driving force. The liquid pump-driven heat pipe can fix the insufficient driving force problem, but new challenges are emerging, including efficiency improvement under small temperature differences and system stability threats from cavitation. And for the booster-driven heat pipe (cooling unit), the performance deterioration or flow cutoff from cavitation of the liquid-driven heat pipe can be avoided. Moreover, the power consumption of vapor gets small under the same volume flow rate due to the compressibility. Then, the system performance can be enhanced because of the liquid mitigation in the evaporator and condenser.
Moreover, considering the indispensable vapor-compressed refrigeration in summer, the thermodynamic cycle is similar between booster-driven circulation and compressor circulation, which are both used to circulate vapor and present a good matching relationship. However, the key special component, booster, is still rare and is mostly the compressor working with low frequency. The development and improvement of the special booster and matching booster-driven system should be studied further to obtain good performance and high efficiency for good energy savings.
In this paper, to address these problems, the rotary booster is used as the power device of the booster-driven hybrid cooling unit to verify the working range as well as the safety and stability of the booster. The pressure difference between the inlet and outlet of the booster is reduced, the rotary booster is improved, and the power can be reduced while guaranteeing the cooling capacity to provide a reference for the design, research, and development of the booster-driven hybrid cooling unit.

2. Booster-Driven Hybrid Cooling Unit System

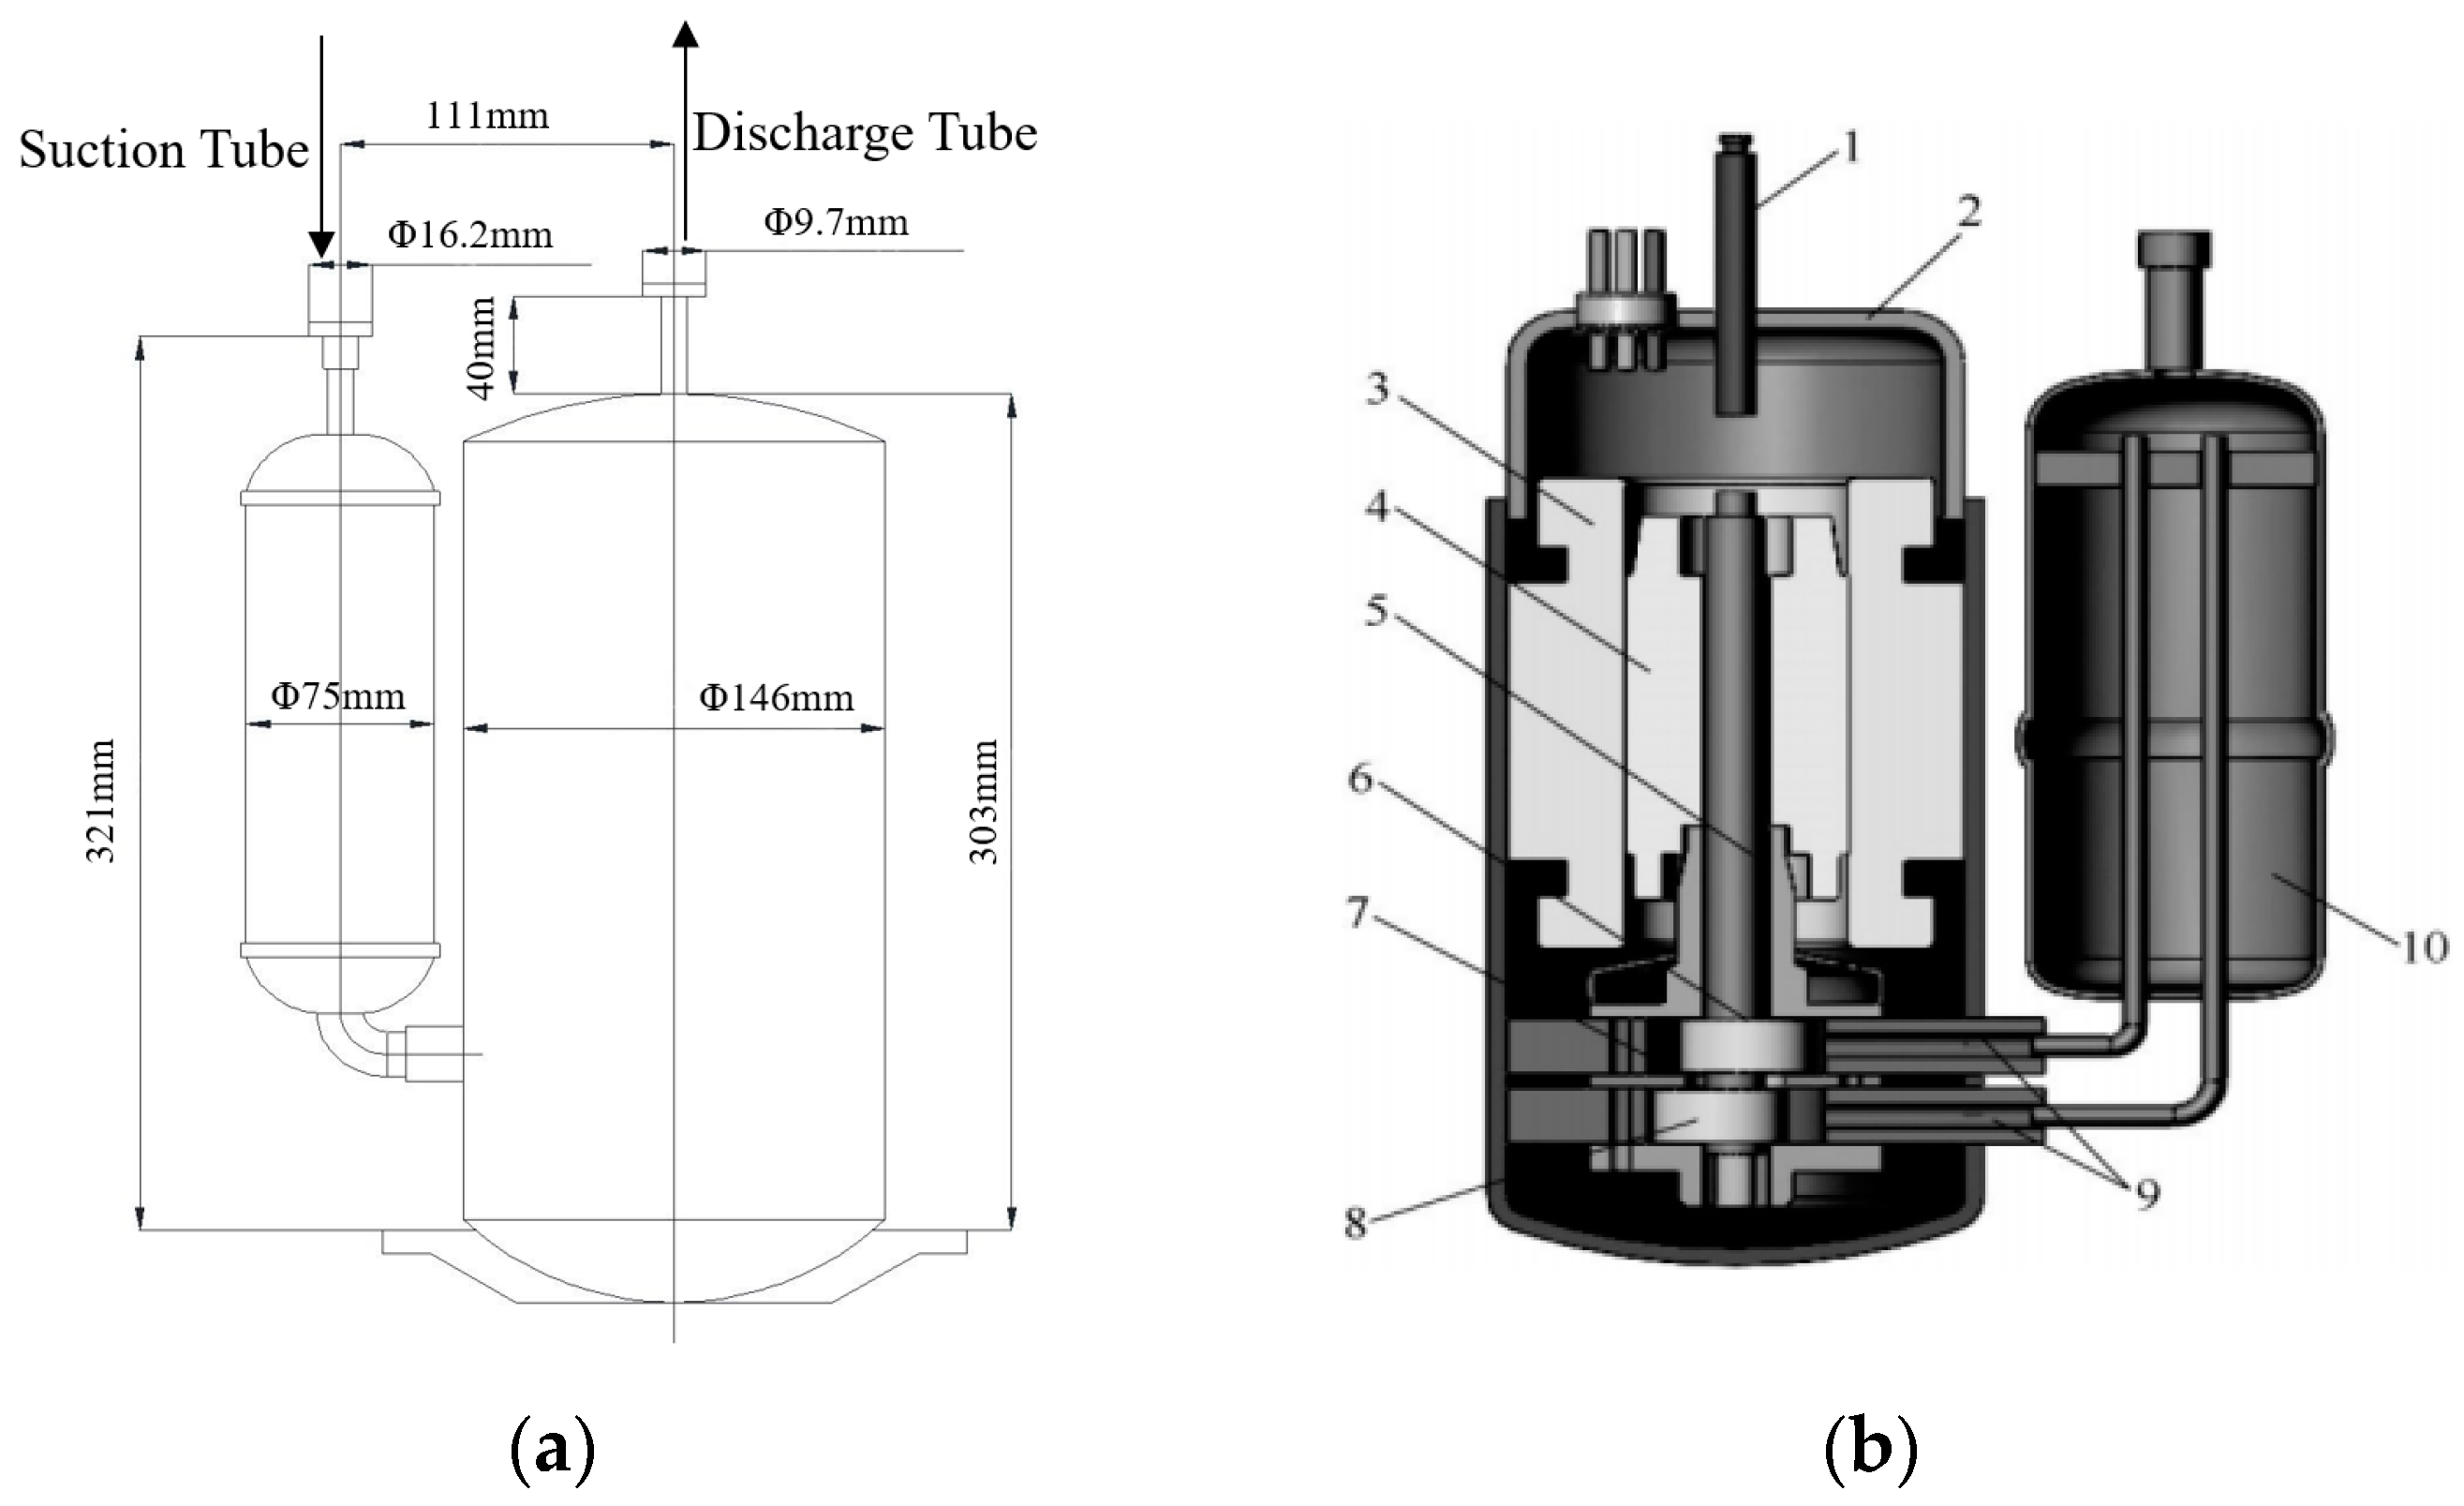
2.1. Booster Selection and Improvement

In this paper, the rotary booster is selected as the booster to drive the loop cooling unit. The rotary booster belongs to the volumetric booster, and R22 is selected as the refrigerant of the unit. The frequency of the booster is always 50 Hz, the speed of the booster is 2880 r/min, and the exhaust volume of the booster is 36 cm3. The structure of the booster is shown in Figure 1.
For the booster-driven hybrid cooling units, the role of the rotary booster is to pressurize and supplement power. The booster-driven hybrid cooling unit can increase the temperature of the refrigerant to boost the pressure by using the evaporator heat transfer. So, the booster is not the only method to boost the pressure. In this context, the fixed pressure ratio of the booster is reduced, which can effectively reduce the power of the booster. Thus, the booster is improved to obtain two different improved units: rotary booster number 1 with a large torque and rotary booster number 2 with a small torque. The two kinds of improved units, as well as the unimproved standard unit, are used for comparison experiments in this paper.

2.2. Heat Exchangers and Piping

The heat exchanger of the unit is divided into an evaporative heat exchanger and a condensing heat exchanger. The two evaporative heat exchangers are connected in parallel in the unit. The condensing heat exchanger is also present in two parallel connections. The evaporation heat exchanger and the condensing heat exchanger use a copper tube–aluminum finned heat exchanger. These two heat exchangers have the same structural dimensions and are placed at the same height. The material of the copper tube is red copper, tube cluster arrangement for the positive triangle fork row, fins for the corrugated shape of the whole sheet of aluminum sets, and heat exchanger structural parameters, as shown in Table 1, and its design diagram is shown in Figure 2.

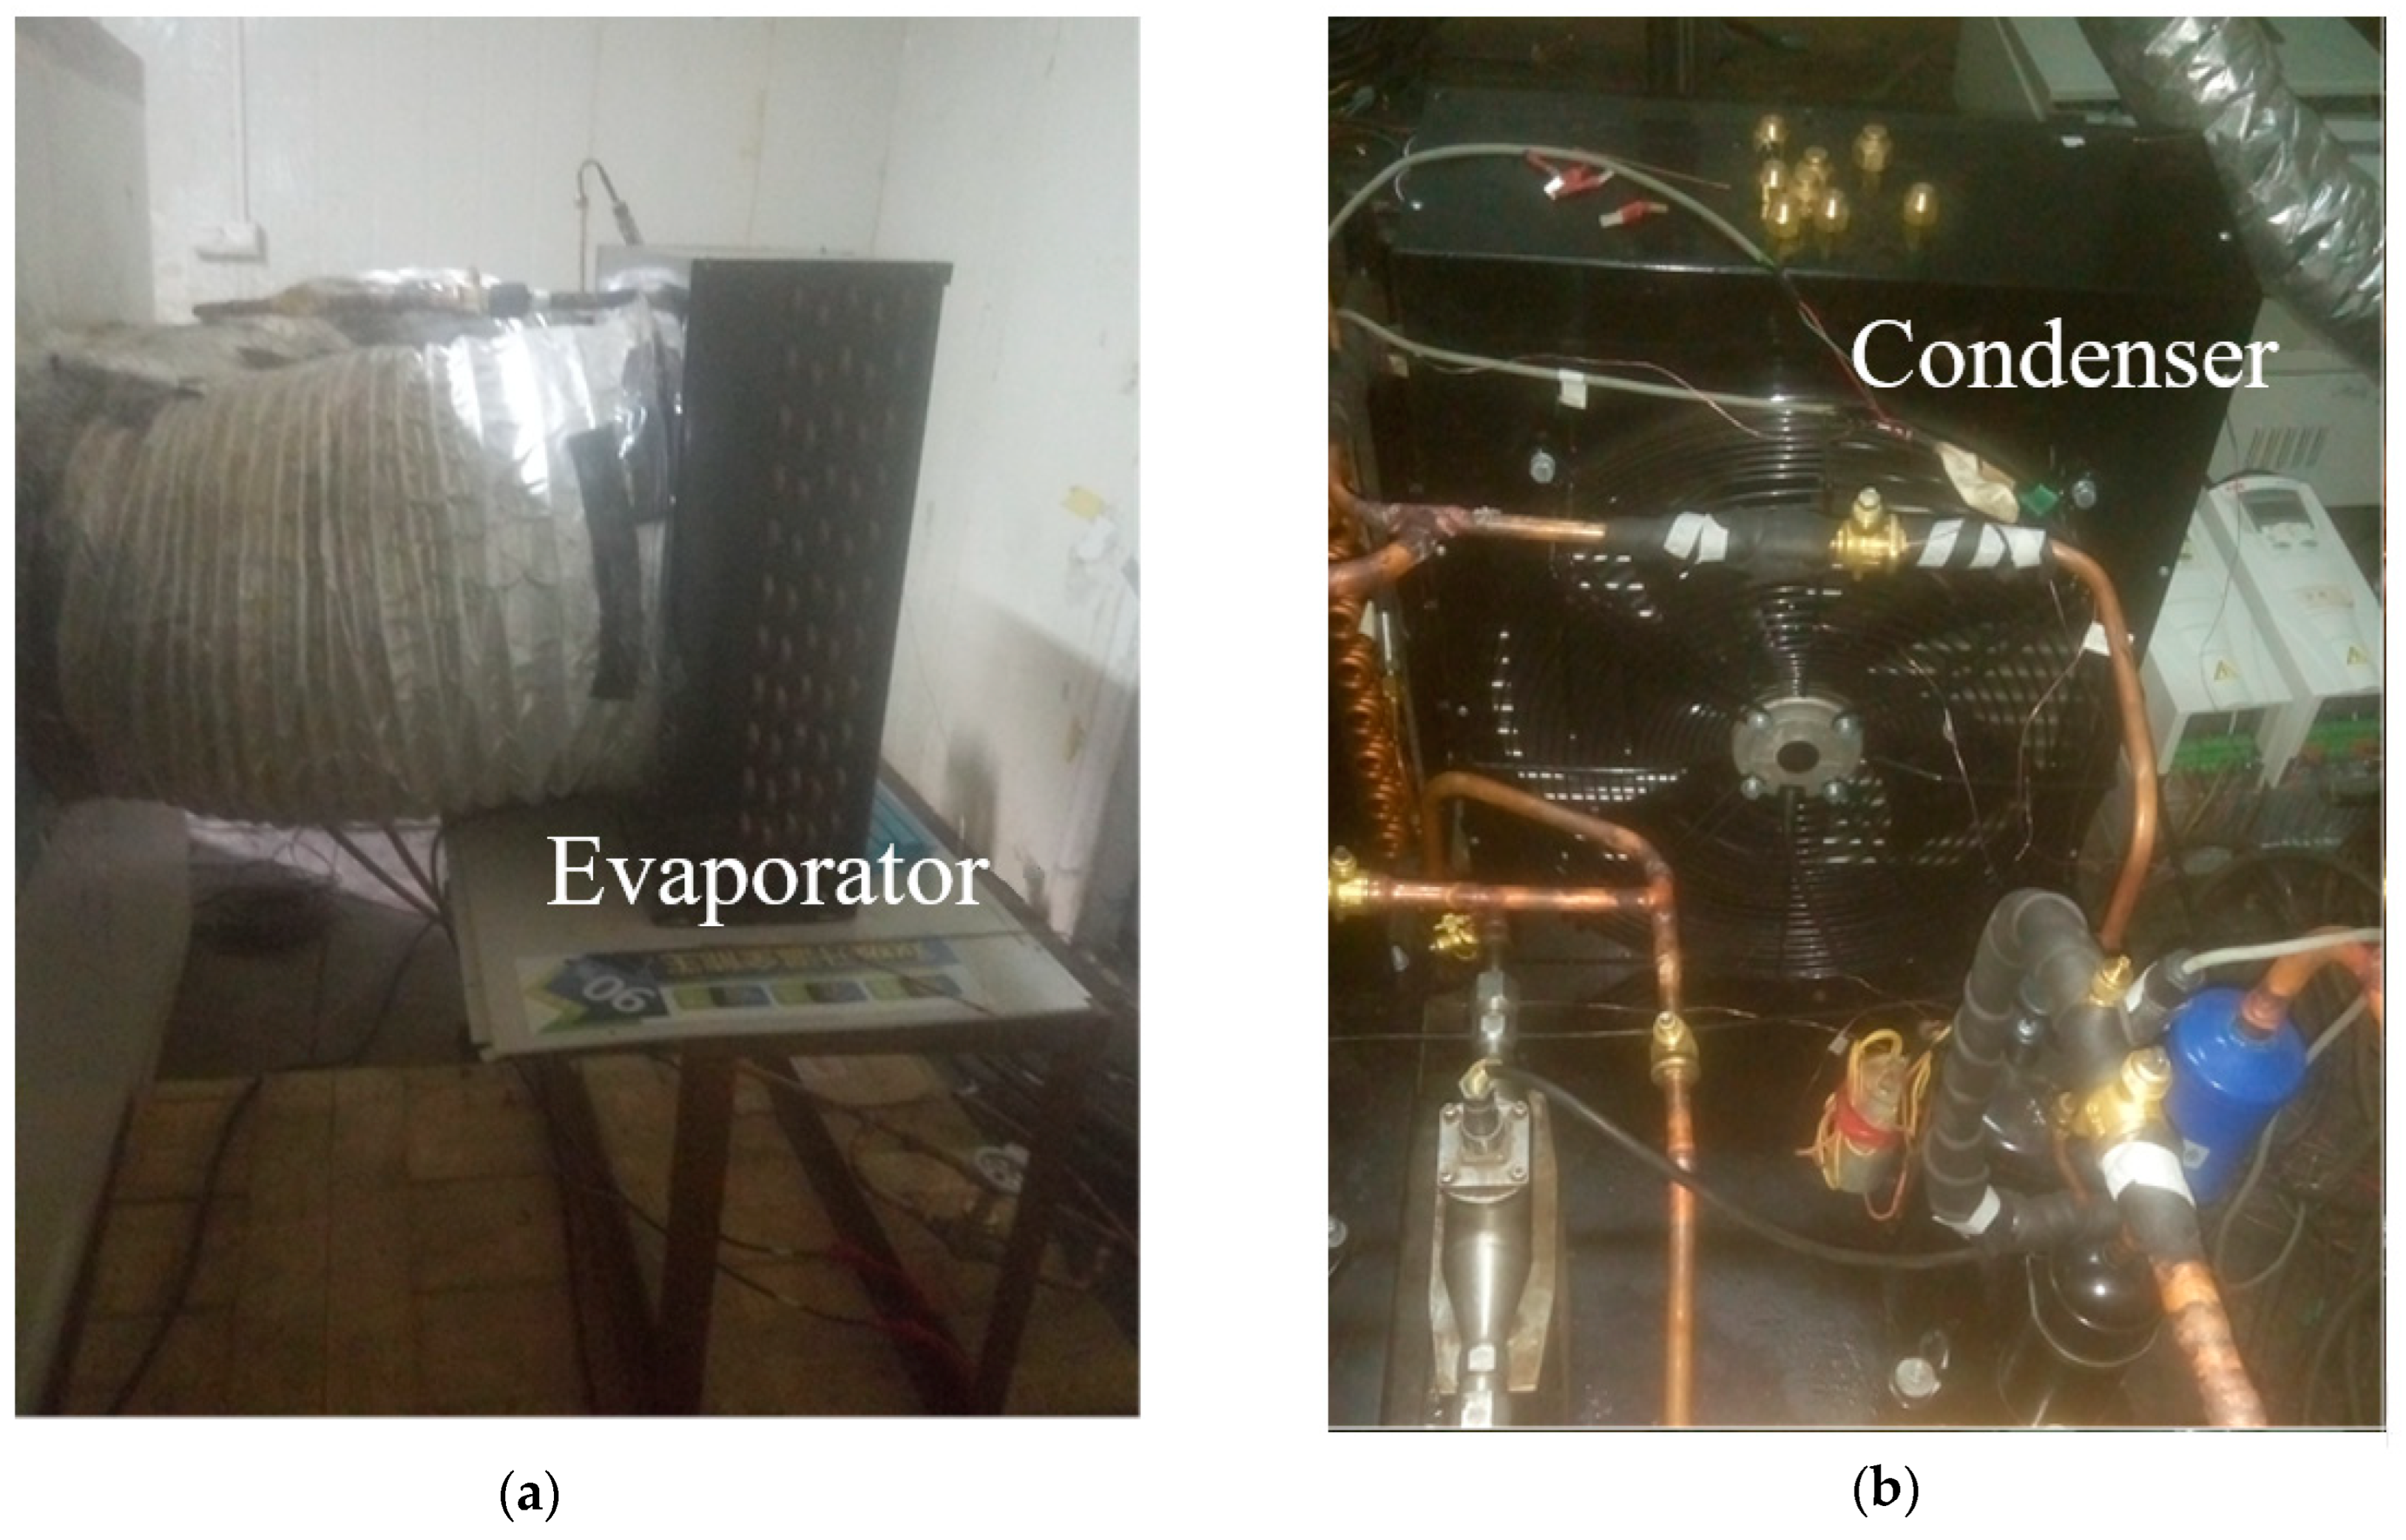
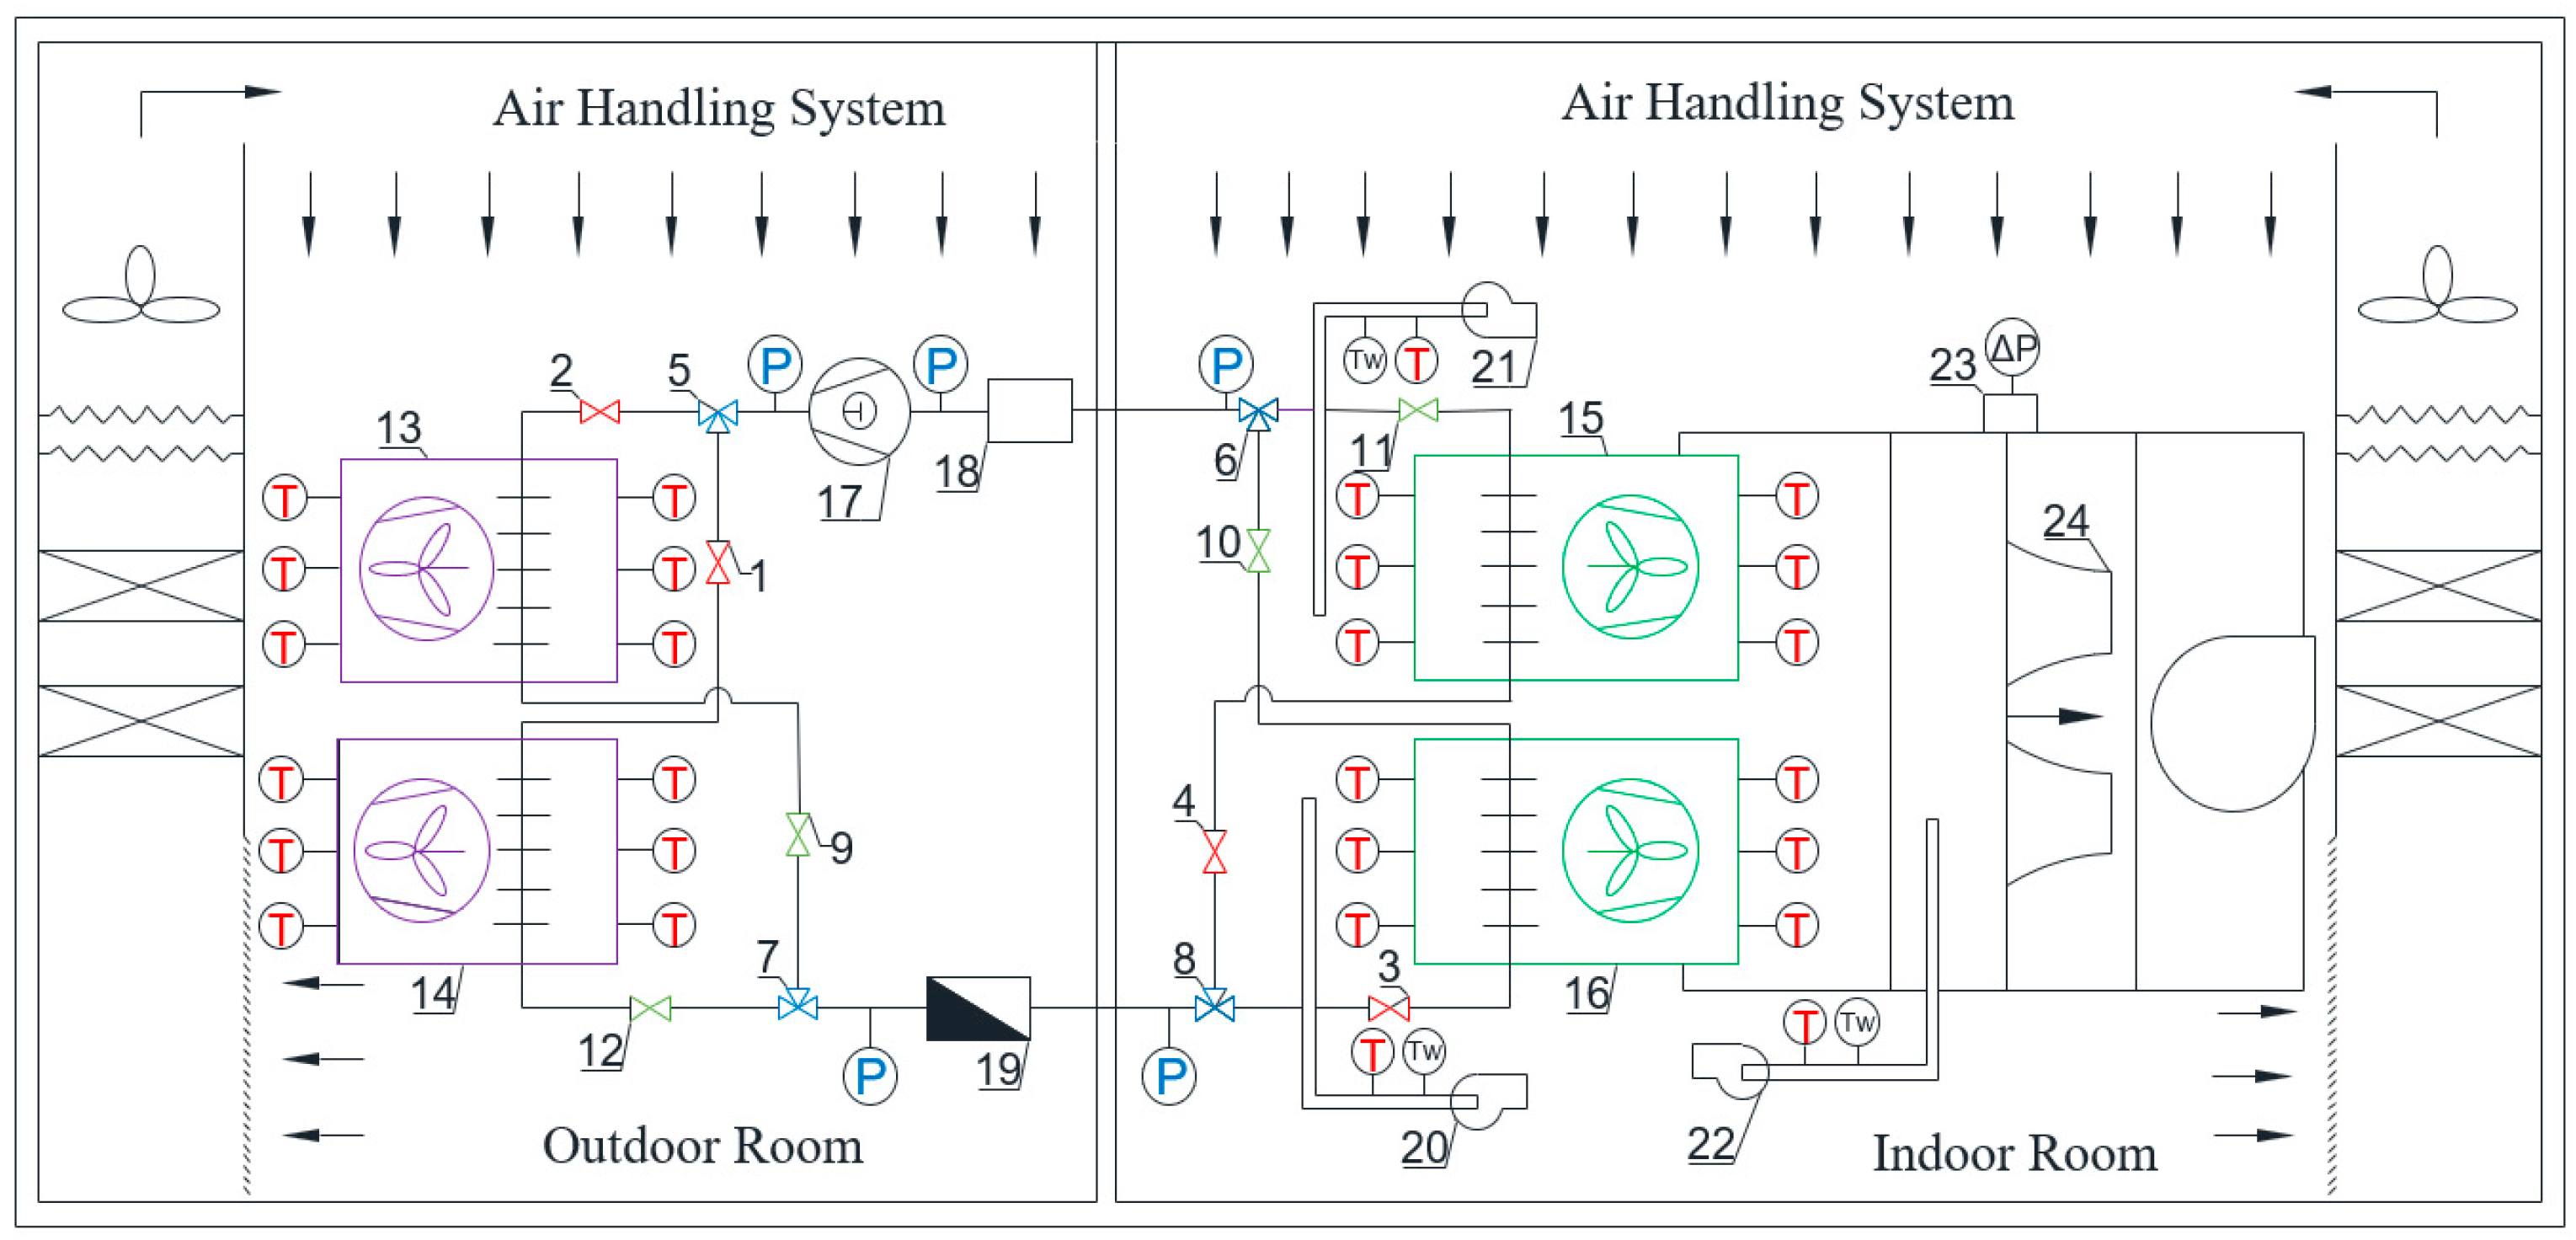
2.3. Experimental Setup

The booster-driven hybrid cooling unit is built, and its experimental arrangement is shown in Figure 3. The experimental test platform and the unit are divided into four parts: control system, indoor unit system, outdoor unit system, and measurement system. The system mainly consists of an evaporator, condenser, rotary booster separator, rotary booster, shut-off valve, three-way valve, and connecting piping. The evaporator and other components are placed in the indoor test room and connected to the static pressure box through the air duct. The condenser, gas–liquid separator, and rotary booster are placed in the outdoor test room.
Figure 3 shows that for the heat exchange area as an influencing factor, the unit uses a double heat exchanger program, and each heat exchanger is equipped with a variable-frequency fan. The unit is arranged in a way that the evaporator and the condenser are on the same level. The main components outside the unit include the gas pump and the gas–liquid separator. The liquid side includes a flow meter. The condenser arrangement is placed in parallel, where shut-off valves 1 and 2 control the condensers 1 and 2 of the inlets, respectively, shut-off valves 9 and 12 control the condenser of the discharge, the shut-off valve opening and closing mode is open or closed. The unit indoor measurement evaporator is also placed in parallel. The shut-off valves 3 and 4 control evaporators 3 and 4 of the liquid inlets, respectively; the shut-off valves 10 and 11 control the exhaust of the evaporator. The shut-off valve opening and closing mode is open or closed.

2.4. Test Instrument

The data needed for the unit are condenser inlet and outlet air dry bulb temperature, evaporator inlet and outlet air dry and wet bulb temperature, rotary booster inlet and outlet pressure, condenser inlet and outlet pressure, evaporator inlet and outlet pressure, liquid side flow rate, pressure difference before and after the nozzle, actual area of each nozzle, dry and wet bulb temperature before the nozzle, power of condenser fan, power of evaporator fan, and power of air pump. The equipment used for the measurements of the rotary booster-driven hybrid cooling unit is shown in Table 2.
Figure 4 shows the arrangement of measurement points for the condenser inlet and outlet air dry bulb temperature measured by four T-type thermocouples. The evaporator inlet and outlet air dry bulb temperature are measured by four T-type thermocouples and an RTD platinum resistance. The evaporator inlet and outlet air wet bulb temperature are measured by a wet bulb thermometer. The pressures of the rotary booster, condenser, and evaporator are measured by a pressure sensor (where the outlet of the rotary booster and condenser inlet distance is short, so the pressure measurement point is one). The liquid side flow rate is measured by an ultrasonic mass flow meter. The pressure difference before and after the nozzle is measured by a pressure difference meter. The evaporator air dry and wet bulb temperatures represent the dry and wet bulb temperatures before the nozzle, and the nozzle area uses the calibration value. All data are collected and exported by a data acquisition instrument. The power of the rotary booster and fans of the two devices is measured by a power meter.
Measurement errors are evaluated using the class B method of standard uncertainty [15], and the uncertainties of the experimental data are ±1.45% for the cooling capacity Q, ±0.02% for the electrical power P, and ±3.75% for the EER.

2.5. Performance Evaluation Indicators

In this paper, the performance of the rotary booster-driven hybrid cooling unit is mainly evaluated by three performance indicators: cooling capacity Q, power P, and EER.
  • Cooling capacity
The cooling capacity of the rotary booster-driven hybrid cooling unit is calculated by the product of the enthalpy difference between the inlet and outlet of the evaporator and the air volume. The enthalpy of the evaporator inlet and outlet and the enthalpy difference are determined from the dry bulb and wet bulb temperatures of the air inlet and outlet of the evaporator, and the air volume of the evaporator air can be calculated from the nozzle flow meter. The formula is as follows:
q v = K × C d × A nozzle × 1000 × Δ p × V n ,
where qv is the air volume at the measurement point inside the unit, m3/s; K is the nozzle coefficient; Cd is the nozzle flow coefficient; Anozzle is the nozzle area, m2; Δp is the static pressure difference before and after the nozzle, Pa; and Vn is the specific volume of air at the nozzle inlet, m3/kg.
A stronger cooling capacity means improved heat transfer performance of the unit. Conversely, the heat transfer performance of the unit is poor. In addition, the cooling capacity can be seen as the multiplication of the enthalpy difference between the evaporator inlet and outlet and the mass flow rate of the unit.
2.
Power
The power consumption of the evaporator fan, the condenser fan, and the rotary booster can be measured by a digital power meter. The total power of the unit is obtained by adding the power of the rotary booster, Pbooster, the power of the evaporator fan, Pfan,evap, and the power of the condenser fan, Pfan,cond. At the same frequency, the power of the rotary booster and the fan can be considered constant. A lower power of the rotary booster indicates that the rotary booster does lesser work and the rotary booster is more suitable for the rotary booster-drive loop cooling cycle. The formula is as follows:
P = P booster + P fan , evap + P fan , cond ,
where P is the total power of the unit, kW; Pbooster is the rotary booster power, kW; Pfan,cond is the condenser fan power, kW; and Pfan,evap is the evaporator fan power, kW.
If the power of the rotary booster is lower, it cannot ensure the unit cooling capacity is maintained above a certain level, so the energy efficiency ratio index is proposed.
3.
Energy efficiency ratio
EER is the ratio of the cooling capacity to the effective input power when the unit operates under the rated working condition and specified conditions, and its unit is W/W. The higher the EER value, the less power is spent to achieve a higher cooling capacity and the better the performance of the unit.
EER = Q / P ,
where EER is the energy efficiency ratio; Q is the cooling capacity, kW; and P is the total power of the unit, kW.

3. Results and Discussion

3.1. Operating Temperature Range of the Unit

3.1.1. Limit Outdoor Operating Temperature of Improved Unit Number 1

When improved unit number 1 is turned on and running, shutdown occurs when the outdoor ambient temperature increases from 30 °C to 35 °C and the indoor ambient temperature is 25 °C. The system parameters are shown in Figure 5. The outdoor temperature is stabilized at 35 °C, and the system pressure and temperature are relatively stable within 40 s. The suction pressure of the rotary booster is about 0.76 MPa, the suction temperature is 19 °C, the exhaust pressure is about 1.7 MPa, and the exhaust temperature is 61 °C. The horizontal coordinate after 50 s shows the system mass flow rate declines sharply during 50–60 s and is finally maintained at about 50 kg/h. At the same time, the system pressure and the temperature begin to change, and the rotary booster inlet and outlet pressure and temperature overlap. The current also exhibits irregular jumping. Regular analysis shows the rotary booster inlet and outlet pressures tend to coincide because the rotary booster inlet and outlet string gas or exhaust valve piece cannot be closed properly, which is the reason for the temperature change from the pressure change. The mass flow rate dropped twice; the reason for the first decline in the first 15 and 50–60 s is the outdoor ambient temperature from 30 °C to 35 °C, and the throttle valve opening is reduced, resulting in a decline in the mass flow rate. The second mass flow rate drop is accompanied by irregular jumps in the rotary booster current. Therefore, the unit cannot run stably in an environment above 35 °C.
Thus, the outdoor environment control temperature is best set at 35 °C or below, or the indoor and outdoor temperature difference is less than 10 °C.

3.1.2. Limit Outdoor Operating Temperature of Improved Unit Number 1

For improved unit number 2, the outdoor ambient temperature is first kept at 40 °C. When the indoor ambient temperature is 25 °C, the unit is turned on, the unit runs for a period of time, and the same phenomenon of shutdown occurs. The specific parameters are shown in Figure 6.
At 35 s in the horizontal coordinate, the unit is turned on, the mass flow rate rises, the suction pressure and temperature fall, and the exhaust temperature and pressure rise. However, the unit is suddenly shut down at 50 s, when the pressure and temperature of the rotary booster begin to change. However, the unit is restarted at 60 s and has been repeatedly shut down and started up. At 150 s, the unit is shut down for experimental safety reasons. At 220 s, the same problem still occurs when the unit is restarted. The reason for this phenomenon is that the rotary booster is under high temperature and high pressure. If the rotary booster is overheated or under high pressure, the unit starts overheating protection, and the improved rotary booster is not suitable for long-term operation in an outdoor high-temperature environment above 40 °C. Improved unit number 2 cannot complete the refrigeration work under the condition of 40 °C in an outdoor environment. Thus, the working range of the outdoor temperature is better below 40 °C.
Therefore, the experiment determines the subsequent operating temperature range, mainly for the data center in the winter operating conditions of the unit operation, that is, the outdoor temperature of −5 °C–20 °C with every 5 °C as a unit of change.
The experimental results show that the test operating temperature of the unit is controlled at outdoor temperatures of −5 °C–20 °C and indoor ambient temperature of 25 °C. In this paper, the analysis and research on the system pressure variation in different rotary booster-driven hybrid cooling units and the evaluation of the unit performance indexes in the range of indoor and outdoor temperature differences from 5 °C to 30 °C are discussed.

3.2. Pressure

An analytical study of the system pressure variation in different rotary booster-driven hybrid cooling units, as well as an evaluation of the unit performance indexes within the range of indoor and outdoor temperature differences from 5 °C to 30 °C, are performed.

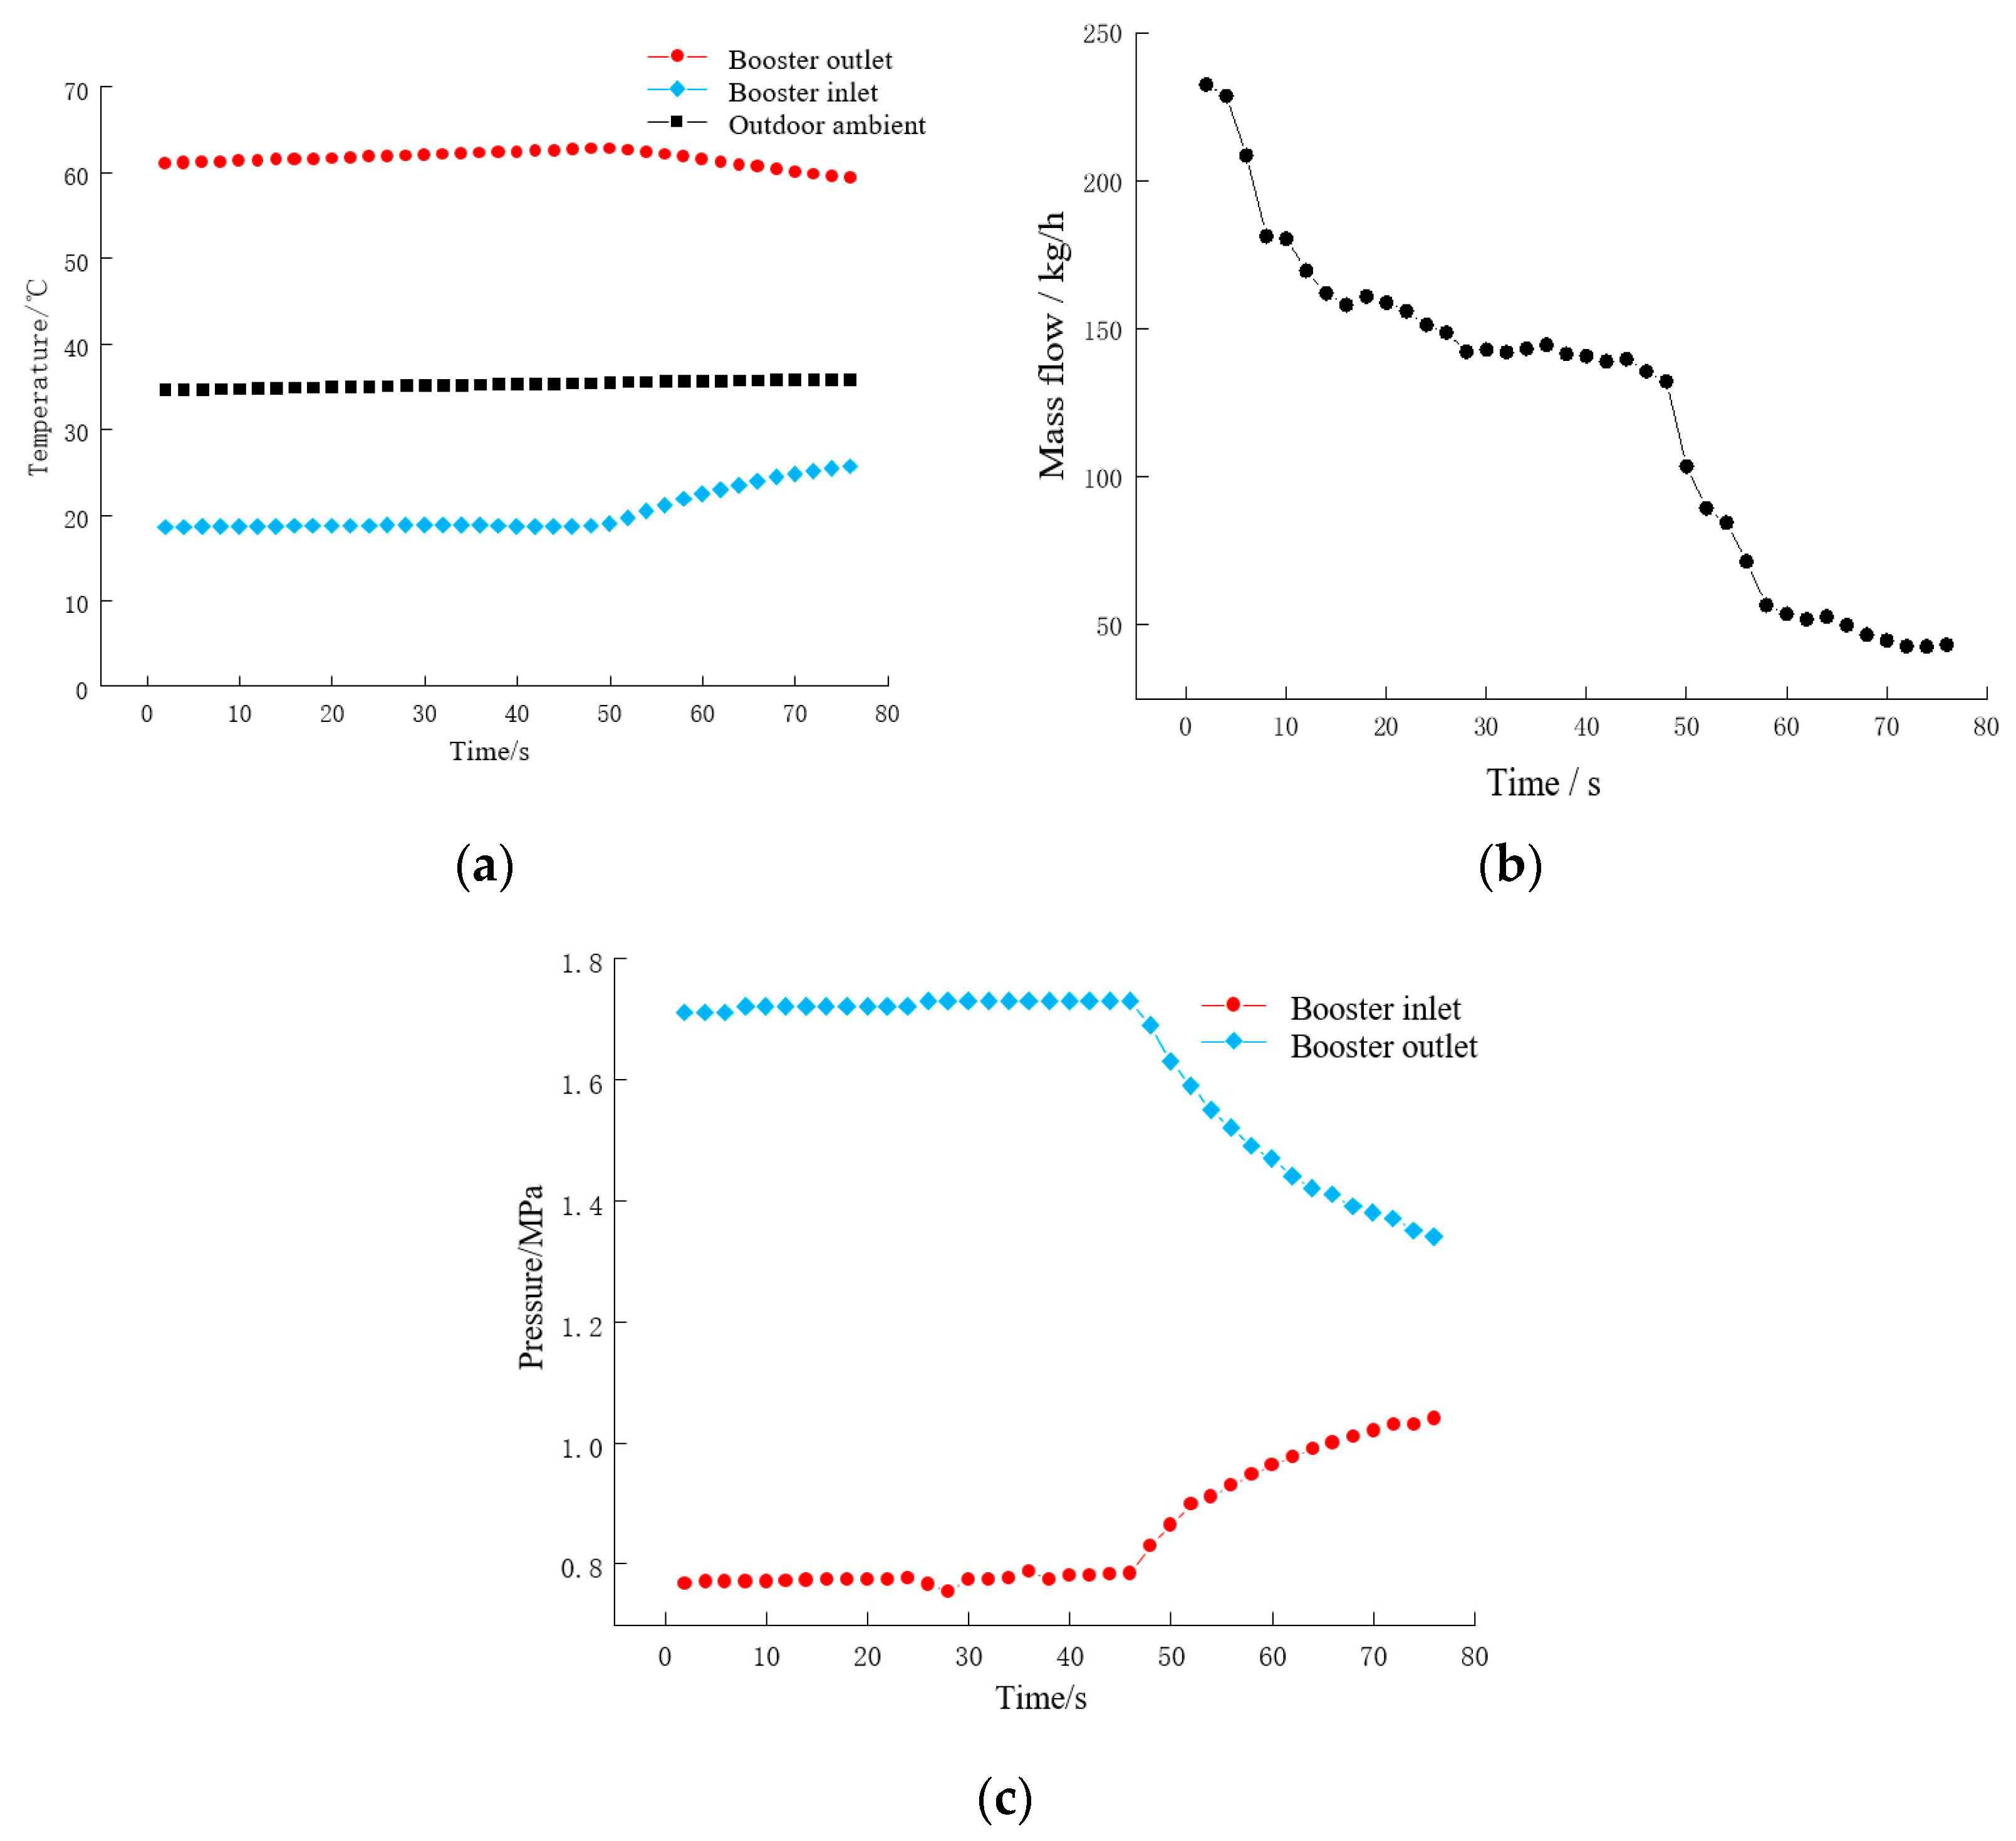
3.2.1. Rotary Booster Pressure

Figure 7 shows the curves of the suction and exhaust pressure of the rotary booster and the pressure difference between the inlet and outlet of the rotary booster with indoor and outdoor temperature differences. Figure 7a,b show a curve of saturation pressure of refrigerant at outdoor ambient temperature.
Figure 7a reveals that the four exhaust pressure curves show a decreasing trend with the increase in indoor and outdoor temperature difference, the exhaust pressure curves of the standard unit in the throttled condition and the unthrottled condition are coincident, and the exhaust pressure curves of improved units numbers 1 and 2 coincide as well. The difference between the two curves is maintained at 0.04–0.05 MPa due to the exhaust pressure and the structure of the rotary booster. The condensing pressure of the curve gradually decreases with the increase in indoor and outdoor temperature differences, and the slope is the same as the four exhaust pressure lines. Thus, the difference between the two parts of the exhaust pressure curve reflects the difference between the improved unit and the standard unit.
Figure 7b shows the variation in the four suction pressure curves, with 20 °C as the boundary. When the between indoor and outdoor temperature difference is more than 20 °C, the suction pressure of the rotary booster decreases with increasing indoor and outdoor temperature differences, and the decreases are the same. When the indoor and outdoor temperature differences are less than 20 °C, all the slopes of the curves are less than the slopes when the indoor and outdoor temperature difference is more than 20 °C. The suction pressure at the throttle on the standard units is lower than the other curves. This result is consistent with the characteristics of throttling. Comparing the suction pressure curve with the saturated condensing pressure curve shows that when the indoor and outdoor temperature difference is more than 20 °C, all the curves of the suction pressure are more than the saturated condensing pressure, and the difference is more than 0.02 MPa. After the completion of the suction of the booster, the refrigerant does not need to be compressed and pressurized. It can directly complete the exhaust, and the pressure only needs to be greater than the spring force of the booster exhaust valve piece.
Figure 7c shows that the trend of the rotary booster pressure difference curve is generally decreasing with the increase in the indoor and outdoor temperature difference, but the decrease is slowing down. The rotary booster pressure difference in improved unit number 1 is always the smallest, from the highest point of 0.32 MPa to the lowest point of 0.07 MPa. Improved unit number 2 is the second one, from the highest point of 0.38 MPa to the lowest point of 0.12 MPa. When the indoor and outdoor temperature difference is more than 20 °C, no change is observed in the pressure difference in the rotary booster before and after throttling of the standard unit. When the indoor and outdoor temperature difference is less than 20 °C, the standard unit increases the pressure difference in the rotary booster after throttling, and it reaches the highest point of 0.62 MPa. The pressure difference curve of improved unit number 2 is always larger than that of improved unit number 1, which is smaller than the standard unit. The fixed pressure ratio relationship between the three follows the order of improved unit number 1 < improved unit number 2 < standard unit. Moreover, the pressure behavior with varying indoor and outdoor temperature differences indicates the working status in the cylinder of the developed booster, which provides changes in discharge and suction pressure ratio and indoor and outdoor temperature difference. Then, the pressure can be adjusted accordingly to match the temperature difference for high energy efficiency. When the temperature difference is large, the discharge and suction pressure ratio should be reduced to maintain the constant cooling capacity with small power consumption. Then, high efficiency can be obtained for meeting the same cooling load need. The relative statements have been marked in red in the manuscript.

3.2.2. Rotary Booster System Pressure

When different rotary boosters drive the cooling loop unit operation, the pressure changes in each position of the system are shown in Figure 8, Figure 9, Figure 10, Figure 11 and Figure 12 below, including rotary booster inlet pressure, rotary booster outlet pressure, condenser inlet pressure, condenser outlet pressure, evaporator inlet pressure, and evaporator outlet pressure.
The graphs in Figure 8, Figure 9 and Figure 10 depict the pressure distribution within the system at different temperature variances for diverse types of rotary booster operations. Four modes of operation are included for the three types of units: the unthrottled operation and throttled operation of improved unit number 1, improved unit number 2, and standard unit. Figure 8 includes the indoor and outdoor temperature differences from 5 °C to 30 °C with six solid lines in each panel. As for the standard unit after throttling, the test is conducted at indoor and outdoor temperature differences from 5 °C to 15 °C because of the very poor results at large temperature differences, as shown in the three dashed lines in Figure 9.
Figure 8, Figure 9 and Figure 10 show the same indoor and outdoor temperature differences between the curve of the variation is the same. From the suction to the exhaust, the pressure rises rapidly. From the exhaust to the condenser inlet and then to the condenser outlet, the pressure drops slightly. From the condenser outlet to the evaporator inlet, the pressure drops rapidly, but the magnitude of the drop is less than the magnitude between the suction and exhaust. From the evaporator inlet to the evaporator outlet, the pressure drops; the magnitude of the drop is less but greater than the condenser pressure drops. Finally, from the evaporator outlet to the inlet, the pressure drops. Taking the standard unit in the unthrottled condition, for example, the indoor and outdoor temperature difference of 5 °C from the suction pressure to the exhaust pressure rises mainly due to the rotary booster rotary pressurization, which is the only pressure rise in the system, that is, the source of the system power. From the exhaust to the condenser inlet and then to the condenser outlet, the pressure drops slightly mainly due to the manifold resistance from the rotary booster to the condenser inlet and the condenser heat transfer of the pressure drop generated in the process of the condenser and the condenser process resistance. From the condenser outlet to the evaporator inlet, the pressure drops mainly due to pipeline resistance, and the refrigerant is condensed even subcooled, which causes the pressure drop, as well as outdoor temperature changes; these make the liquid tube flow state changes and then causes the pressure loss. From the evaporator inlet to the evaporator outlet, the pressure drops mainly due to the evaporator along the pipeline process loss and the evaporator heat exchanger process of the pressure drops. From the evaporator outlet to the booster inlet, the pressure drops mainly due to the booster inlet along the pipeline process loss and the pressure loss of the gas–liquid separator.
Figure 9 shows that with the increase in the indoor temperature difference, the achievable maximum and minimum pressures of the unit decrease, and the difference between the maximum and minimum pressures also decreases. This result is mainly due to the decrease in outdoor temperature that leads to a decrease in saturated condensing pressure and a decrease in rotary booster exhaust pressure. The decrease in outdoor temperature makes the condensing temperature decrease, the condensing pressure decrease, and the evaporating pressure decrease, leading to a decrease in the suction pressure of the rotary booster.
After the standard unit throttling, the suction pressure and evaporator inlet and outlet pressure drop. When the indoor and outdoor temperature difference is 15 °C and 10 °C, the exhaust pressure is equal to that of the standard unit in the unthrottled condition, but when the indoor and outdoor temperature difference is 5 °C, the exhaust pressure is higher than that of the standard unit in the unthrottled condition. This result is mainly because after throttling, the evaporator inlet pressure plummets, resulting in a drop in the suction pressure of the rotary booster and an increase in the pressure difference.

3.3. Analysis of System Performance Indicators
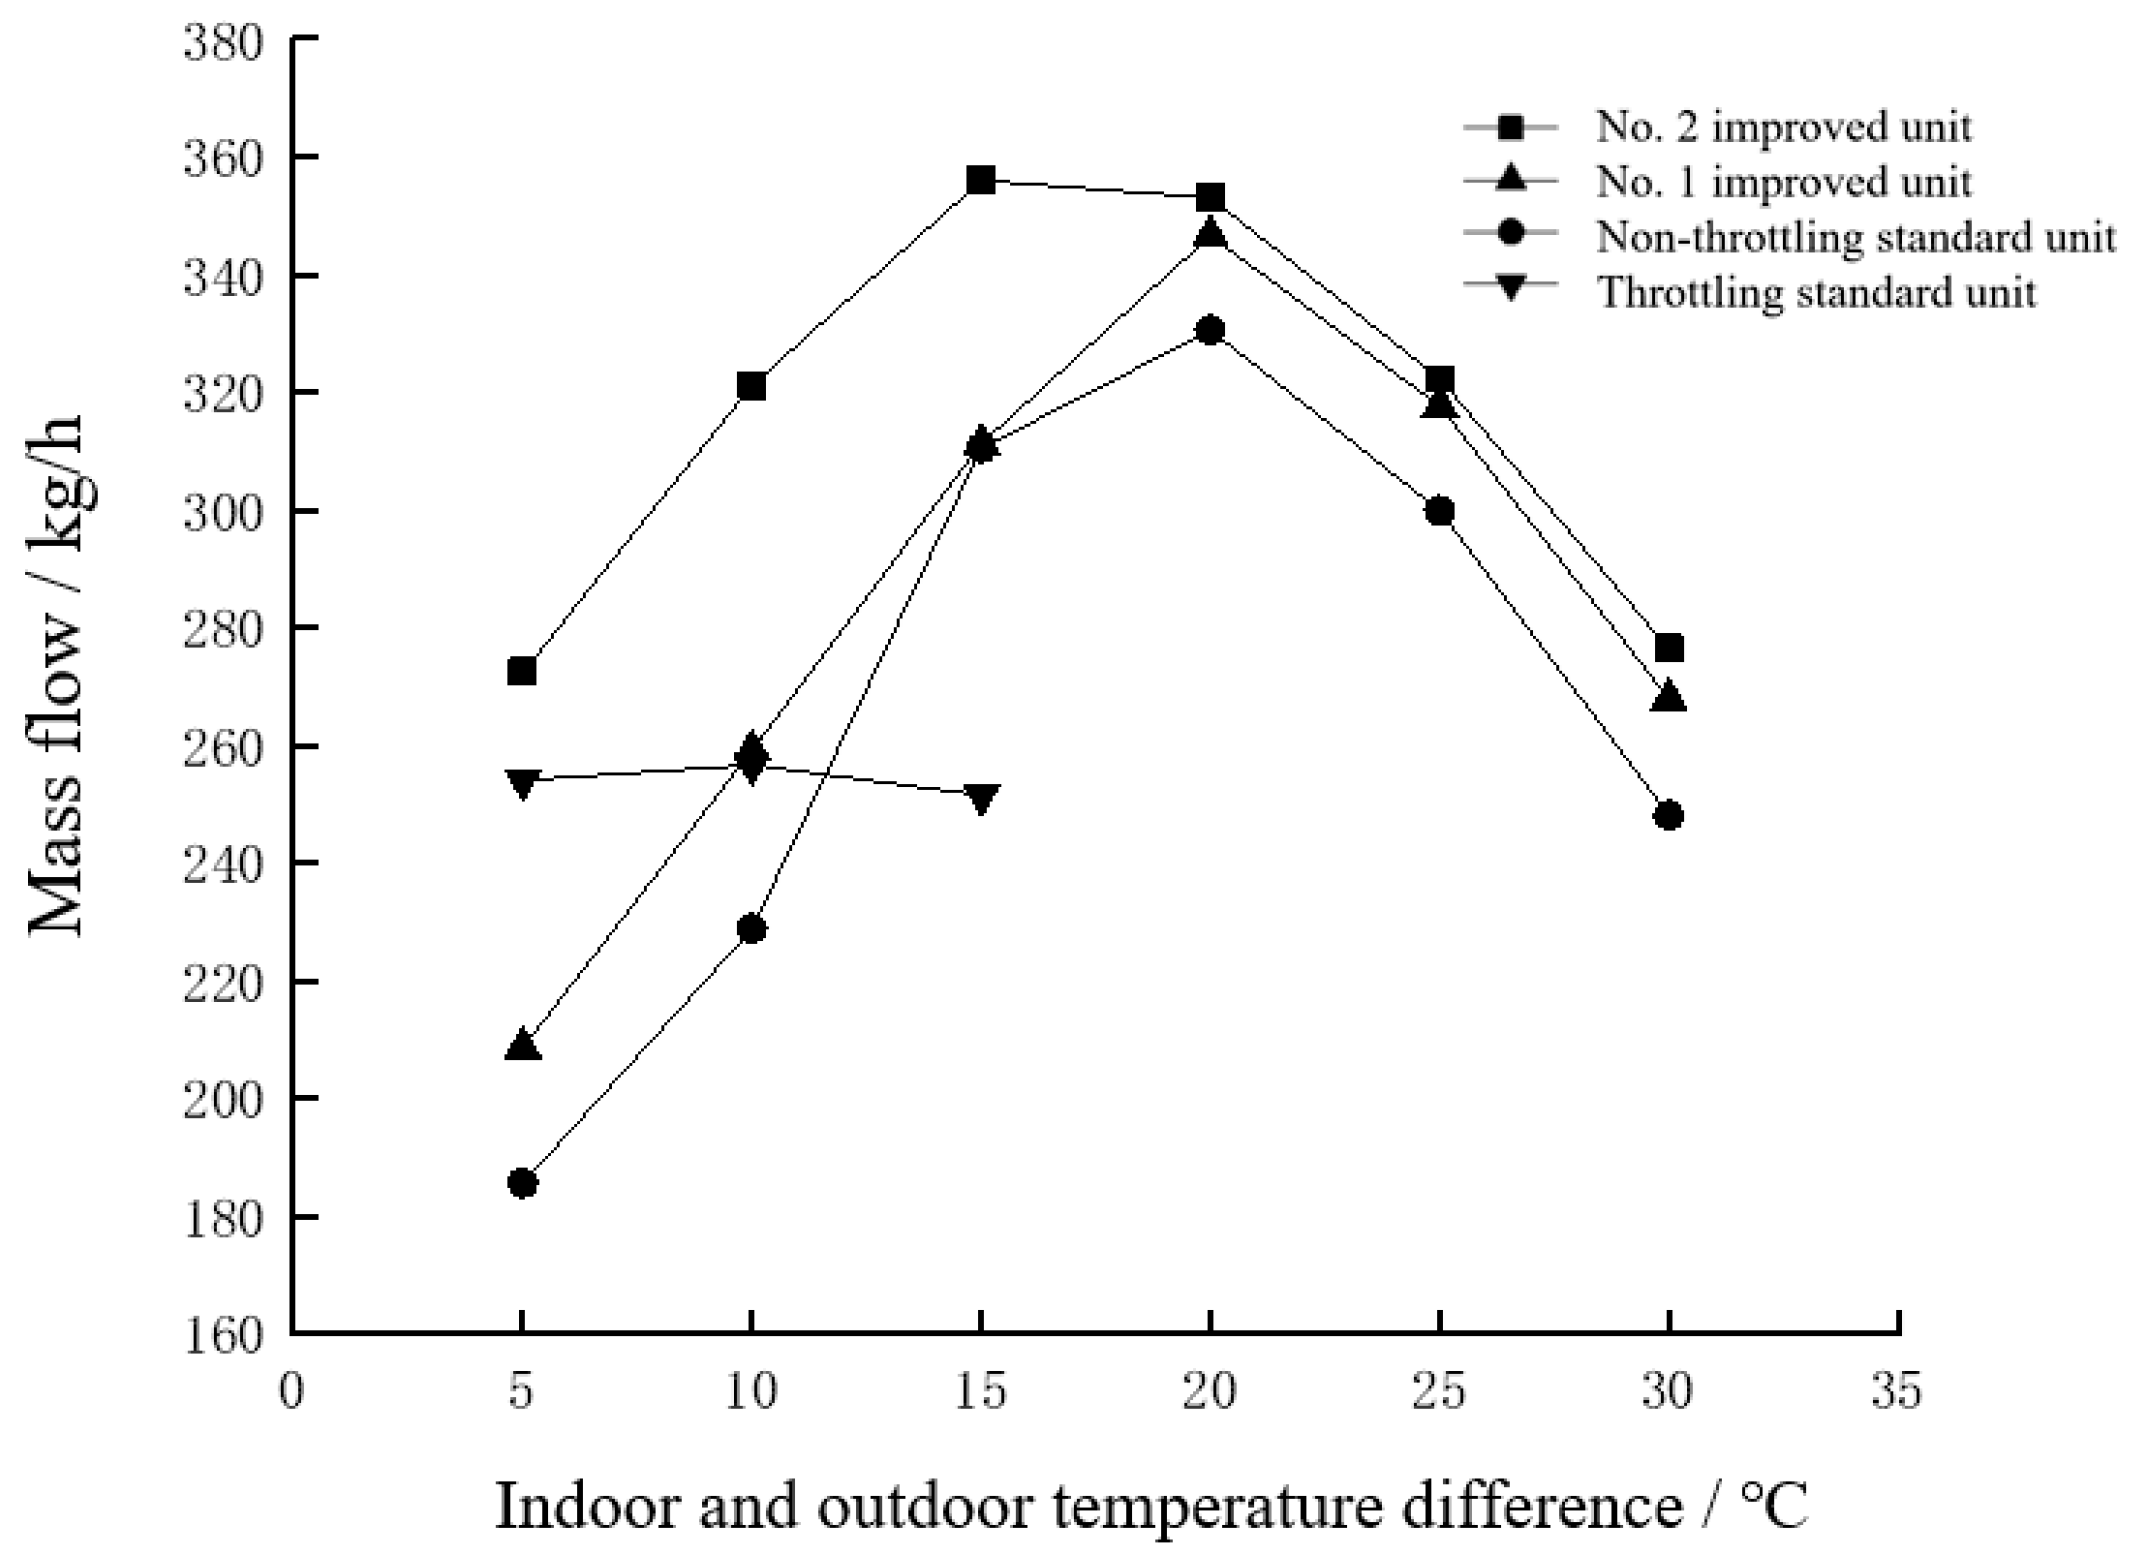
3.3.1. Mass Flow

Figure 11 shows the mass flow rate of different rotary booster-driven loop units with the increase in indoor and outdoor temperature difference variation. For improved units numbers 1 and 2 and the standard unit unthrottled condition-driven loop unit, the mass flow rates with the indoor and outdoor temperature difference in the variation are the same. With the increase in the indoor and outdoor temperature difference, the mass flow rates all appear to increase and then decrease. The mass flow rate of each unit is minimized when the indoor and outdoor temperature difference is 5 °C. With the increase in the indoor and outdoor temperature difference (i.e., the decrease in the outdoor temperature), the mass flow rate starts to increase and reaches its respective peak when the indoor and outdoor temperature difference is 20 °C. After that, the indoor and outdoor temperature difference is further increased, but the mass flow rate starts to decrease. After the indoor and outdoor temperature differences exceed 20 °C, the mass flow rate starts to decrease because as the outdoor temperature decreases, the degree of subcooling starts to increase, resulting in a decrease in the suction pressure of the unit, at which time the specific volume of the rotary booster inlet increases and the mass flow rate decreases.

3.3.2. Cooling Capacity

Figure 12 shows the cooling capacity of different rotary booster-driven loop units with different indoor and outdoor temperature difference variations. The cooling capacity with the indoor and outdoor temperature difference is the same as the variation in the loop unit driven by improved unit number 1, improved unit number 2, and the standard unit in the unthrottled condition. The cooling capacity of all the units appears to increase and then decrease with the increasing indoor and outdoor temperature difference. The cooling capacity of each unit is the smallest when the indoor and outdoor temperature difference is 5 °C. The cooling capacities of improved unit number 1, improved unit number 2, and the standard unit in the unthrottled condition are 11.1, 14.6, and 9.87 kW, respectively. With the increase in the indoor and outdoor temperature difference (i.e., the drop of the outdoor temperature), the cooling capacity starts to increase and reaches its respective peaks at a temperature difference of 20 °C between indoor and outdoor temperatures. The cooling capacities of improved unit number 1, improved unit number 2, and the standard unit in unthrottled condition are 18.8, 19.6, and 18.6 kW, respectively. After that, the temperature indoor and outdoor temperature difference increases further, but the cooling capacity starts to decrease. When the indoor and outdoor temperature difference is 30 °C, the cooling capacities of improved unit number 2, improved unit number 1, and the standard unit are 16.8, 16.3, and 15.2 kW, respectively.
The unthrottled condition of the standard unit is compared with that of the improved unit. The cooling capacity of improved unit number 1 and improved unit number 2 is better than that of the standard unit over most of the range of indoor and outdoor temperature differences. Then, throttling the standard unit loop, the cooling capacity changes, and the cooling capacity stabilizes at 14.9 kW in the range of indoor and outdoor temperature differences from 5 °C to 15 °C. Compared with the standard unit in the unthrottled condition, the change rates of the cooling capacity are 49.1%, 21.5%, and −14.9%, which means the throttling of the standard unit enhances the cooling capacity in a certain range. However, when the indoor and outdoor temperature differences continue to increase, the cooling capacity of the standard unit after throttling is not as good as that of the unthrottled condition, so the experiments on the standard unit throttled with large temperature differences are not continued.
The cooling capacity curve of improved unit number 2 is always higher than the three other curves. The difference in cooling capacity between improved unit number 1 and improved unit number 2 is large at indoor and outdoor temperature differences of up to 20 °C. After the rotary booster of the unit is changed from improved unit number 1 to improved unit number 2, the growth rates of the cooling capacity when the indoor and outdoor temperature difference is from 5 °C to 15 °C are 30.7%, 24.2%, and 15.7%. However, when the indoor and outdoor temperature difference is up to 20 °C, the growth rate is below 5%. The difference between the standard unit and improved unit number 2 is even greater. The growth rate of the cooling capacity is above 40% for indoor and outdoor temperature differences of 5 °C and 10 °C. The growth rate of the cooling capacity for the rest of the working conditions is also around 10%.

3.3.3. Power

Figure 13 shows the variation in the power in different rotary booster-driven loop units with different indoor and outdoor temperature differences. For improved unit number 1, improved unit number 2, and the standard unit in the unthrottled condition-driven loop, the variations in power with temperature difference in different boosters are the same, which decreases with the increasing indoor and outdoor temperature difference.
Considering the rotary booster power, when the indoor and outdoor temperature difference is 5 °C, the rotary booster power of each unit is the largest. The rotary booster power of improved unit number 1, improved unit number 2, and the standard unit in the unthrottled condition are 1.17, 1.16, and 1.15 kW, respectively. With the increase in the indoor and outdoor temperature difference (i.e., the decrease in the outdoor temperature), the unit power begins to decline, and after the indoor and outdoor temperature difference of 15 °C, the decline of the booster power slows down in an indoor and outdoor temperature difference of 30 °C. At 30 °C, the booster power of improved unit number 1, improved unit number 2, and the standard unit are 0.46, 0.56, and 0.69 kW, respectively. The rotary booster power decreases mainly due to the decrease in the rotary booster pressure difference. At indoor and outdoor temperature differences from 5 °C to 15 °C, the mass flow rate increases, but it cannot compensate for the decrease in the pressure difference, so the power of the rotary booster decreases. At indoor and outdoor temperature differences from 20 °C to 30 °C, the mass flow rate and the rotary booster pressure difference decrease, so the rotary booster power also decreases. According to the relationship between suction pressure and saturation pressure at outdoor ambient temperature, the pressurization role of the rotary booster weakens.
The unthrottled case of the standard unit compared with the improved units: The rotary booster power of improved unit number 1 and improved unit number 2 are less than that of the standard unit in most of the indoor and outdoor temperature difference ranges. Then, after throttling the standard unit loop unit, the rotary booster power changes and becomes higher than the three other curves in the range of indoor and outdoor temperature differences from 5 °C to 15 °C. In the full range of indoor and outdoor temperature differences, the rotary booster power follows the order of standard unit throttled condition > standard unit unthrottled condition > improved unit number 2 > improved unit number 1.

3.3.4. EER

Figure 14 shows the variation in EER of different booster units with indoor and outdoor temperature differences. EER is the ratio of cooling capacity and unit power as Equation (3). The cooling capacity of improved unit number 2 is greater than that of improved unit number 1, the improved unit is greater than the standard unit unthrottled condition, the power of improved unit number 1 is less than that of improved unit number 2, and the improved unit is less than the standard unit for the throttled condition.
Figure 14 shows the loop cooling units driven by improved unit number 1, improved unit number 2, and the unthrottled condition of the standard unit. The variations in EER with the indoor and outdoor temperature difference are the same. When the indoor and outdoor temperature difference is 5 °C, the EER of each unit is the smallest. The EER of improved unit number 1, improved unit number 2, and the standard unit in unthrottled condition are 6.14, 8.1, and 5.44, respectively. With the increase in the indoor and outdoor temperature difference (i.e., the drop in the outdoor temperature), the EER begins to increase. When the indoor and outdoor temperature difference is 20 °C, the unthrottled condition of the standard unit reaches the peak, and the unthrottled condition of the standard unit is 13.2. When the indoor and outdoor temperature difference is 25 °C, the EER of improved unit number 1 and improved unit number 2 reach the peak; the EER of improved unit number 1 is 15.6, and that of improved unit number 2 is 16.0. After that, the indoor and outdoor temperature differences increase further, but the EER starts to decline. At the indoor and outdoor temperature differences of 30 °C, the EERs of improved unit number 2, improved unit number 1, and the standard unit are 14.4, 14.6, and 11.0, respectively.
After throttling the standard unit, cooling capacity increases in the 5 °C–10 °C range. When the power of the unit rises as well, the EER does not exceed that of improved unit number 2, but it is better than that of improved unit number 1 and the unthrottled condition of the standard unit.
Finally, a comprehensive comparison of the EER curves reveals that improved unit number 2 owns the largest EER and the best performance, considering the higher suction pressure and cooling capacity due to the larger torque. Then, it is selected for the subsequent experiments.

4. Conclusions

In this paper, comparison experiments of different rotary booster-driven loop cooling systems are carried out without changing the system components, the outdoor temperature change is controlled to carry out the comparison experiment between different rotary booster units, and the limit working temperature of different air pumps and their operating performance under diverse indoor and outdoor temperature differences are studied. The following conclusions are drawn:
(1)
When the standard unit is running, the temperature working range is from 40 °C to −5 °C in the outdoor environment for normal, stable operation; the temperature working range of improved unit number 1 rotary booster-driven hybrid cooling unit is from 30 °C to −5 °C in the outdoor ambient temperature for stable operation; and the temperature working range of improved unit number 2 rotary booster-driven hybrid cooling unit is from 35 °C to −5 °C in the outdoor environment for normal, stable operation. The temperature below −5 °C is not in the research scope of this paper, so no experimental verification is performed to determine whether the operation is normal. Combined with the data center’s year-round operating variations and characteristics, the outdoor temperature operating range is set between −5 °C and 20 °C and the indoor temperature is controlled at 25 °C.
(2)
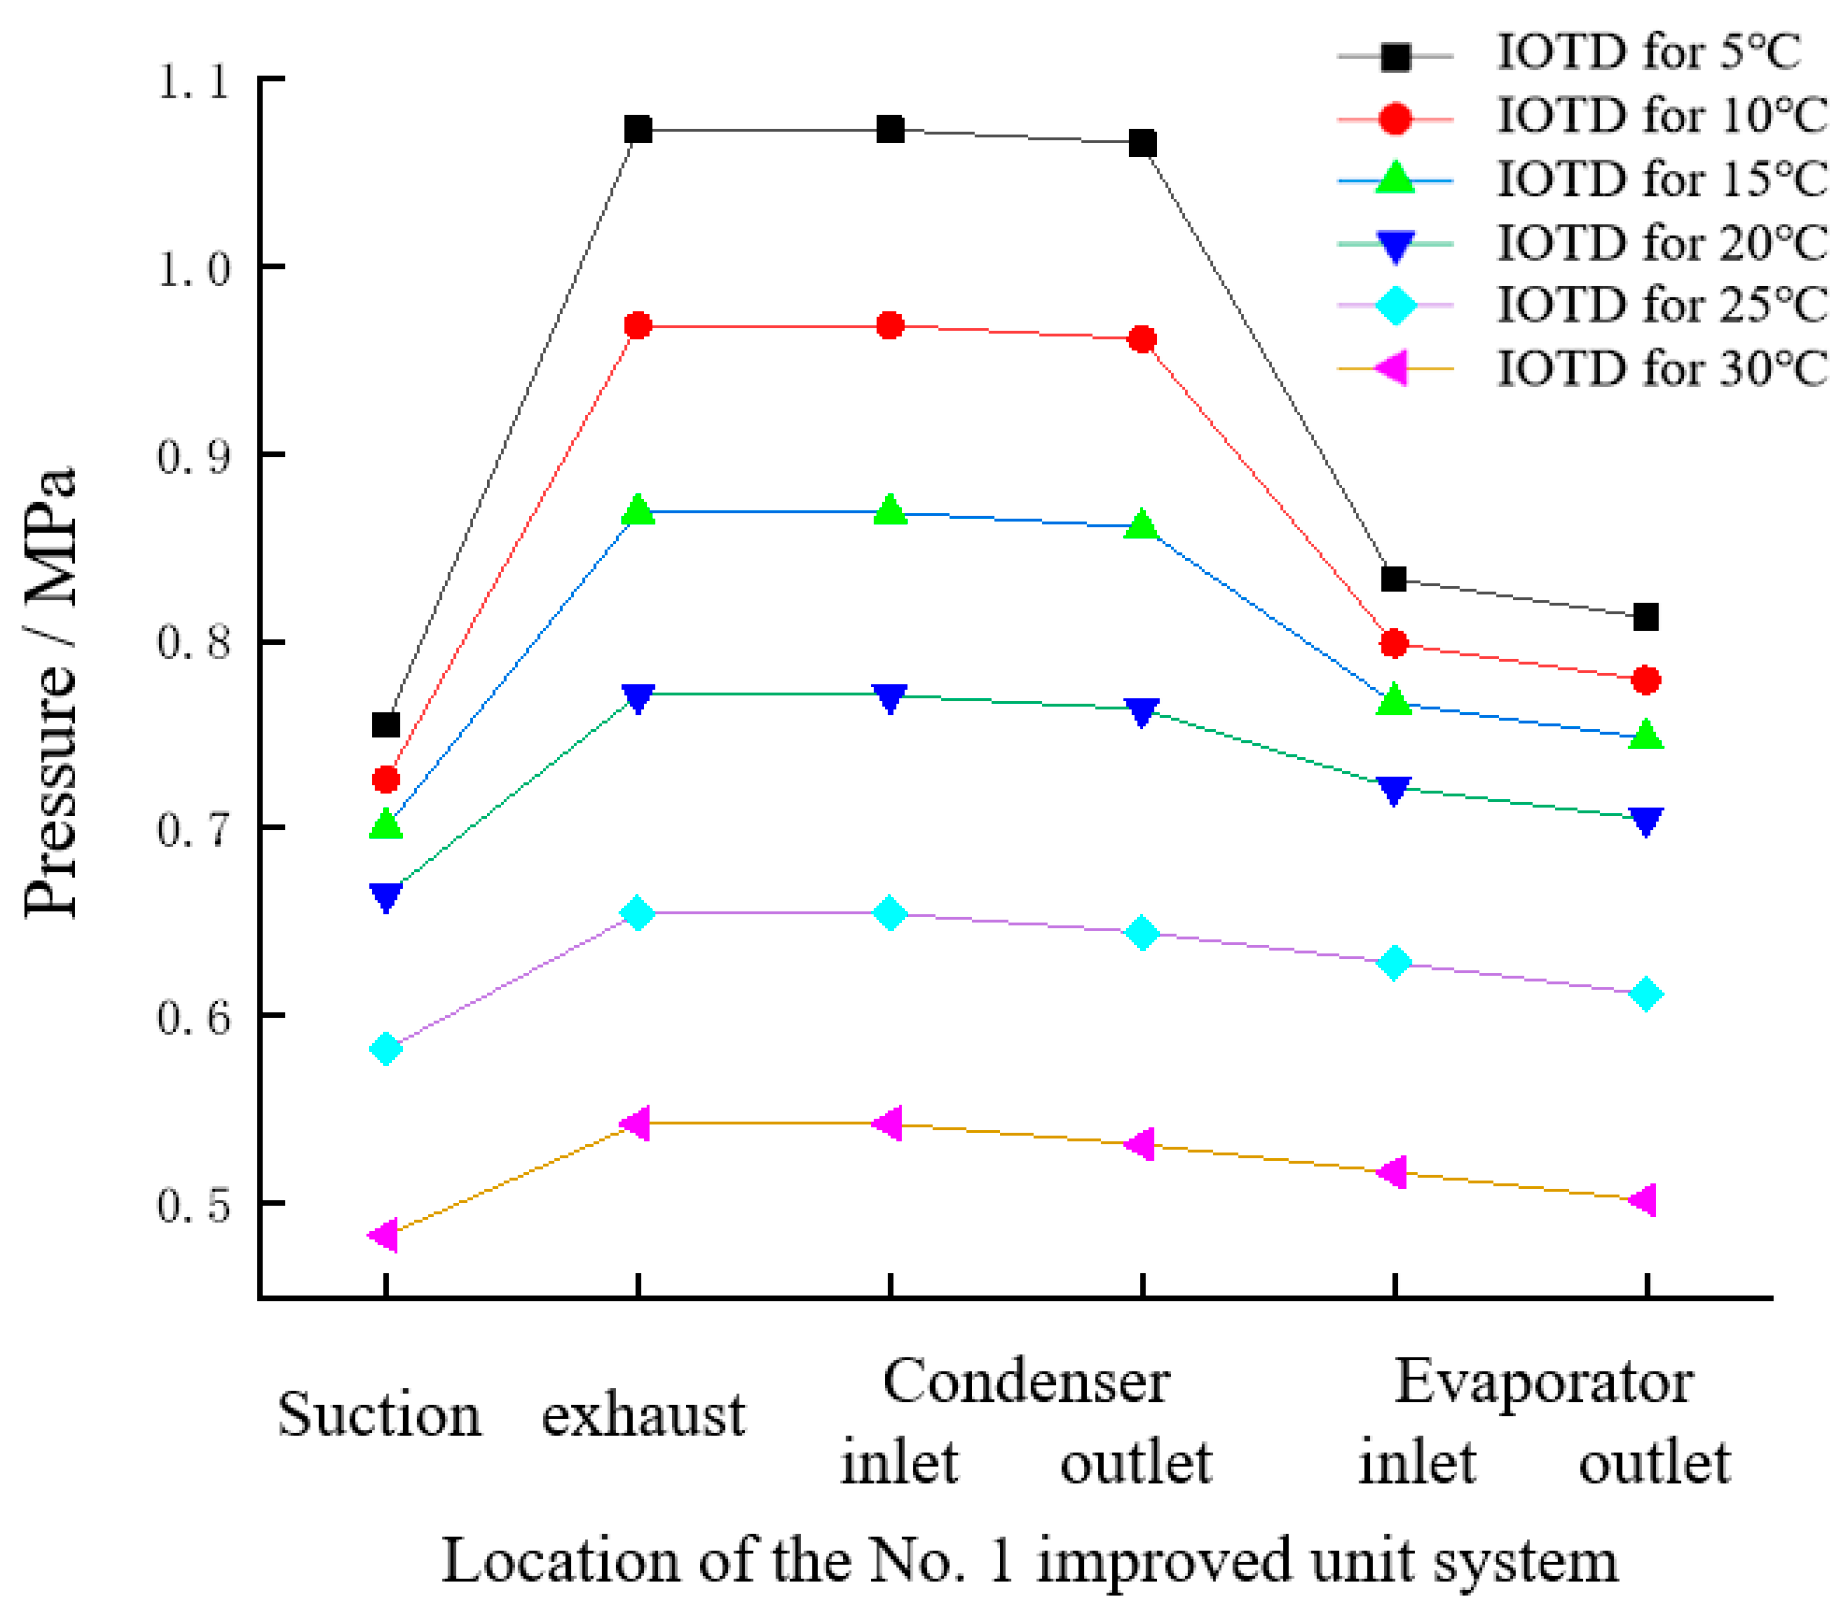
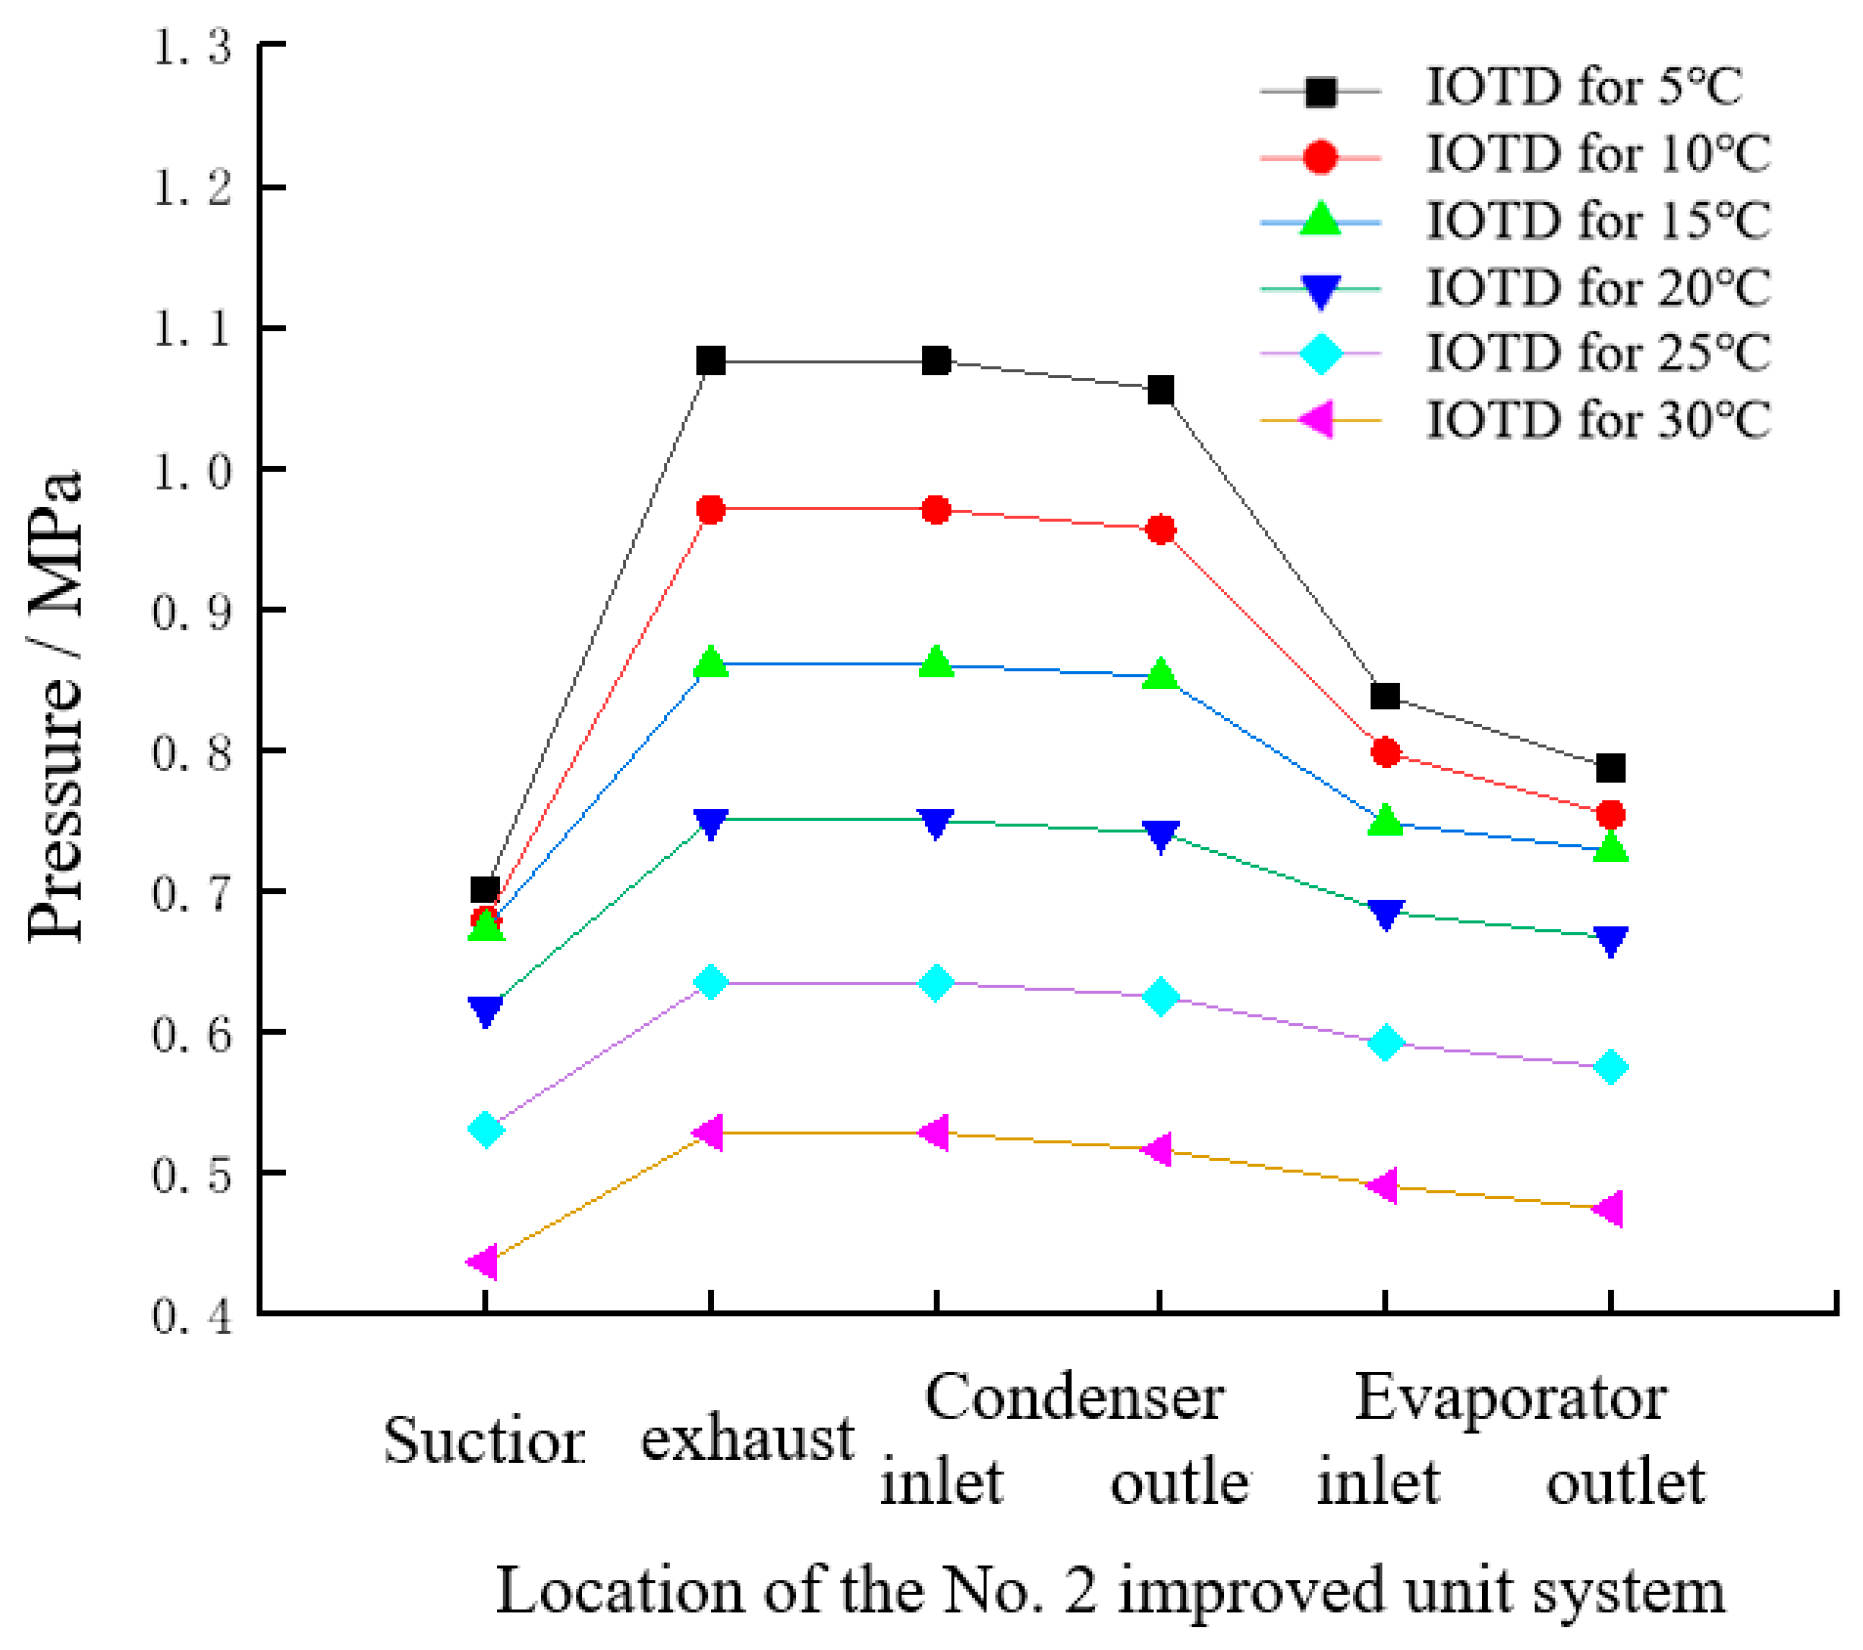
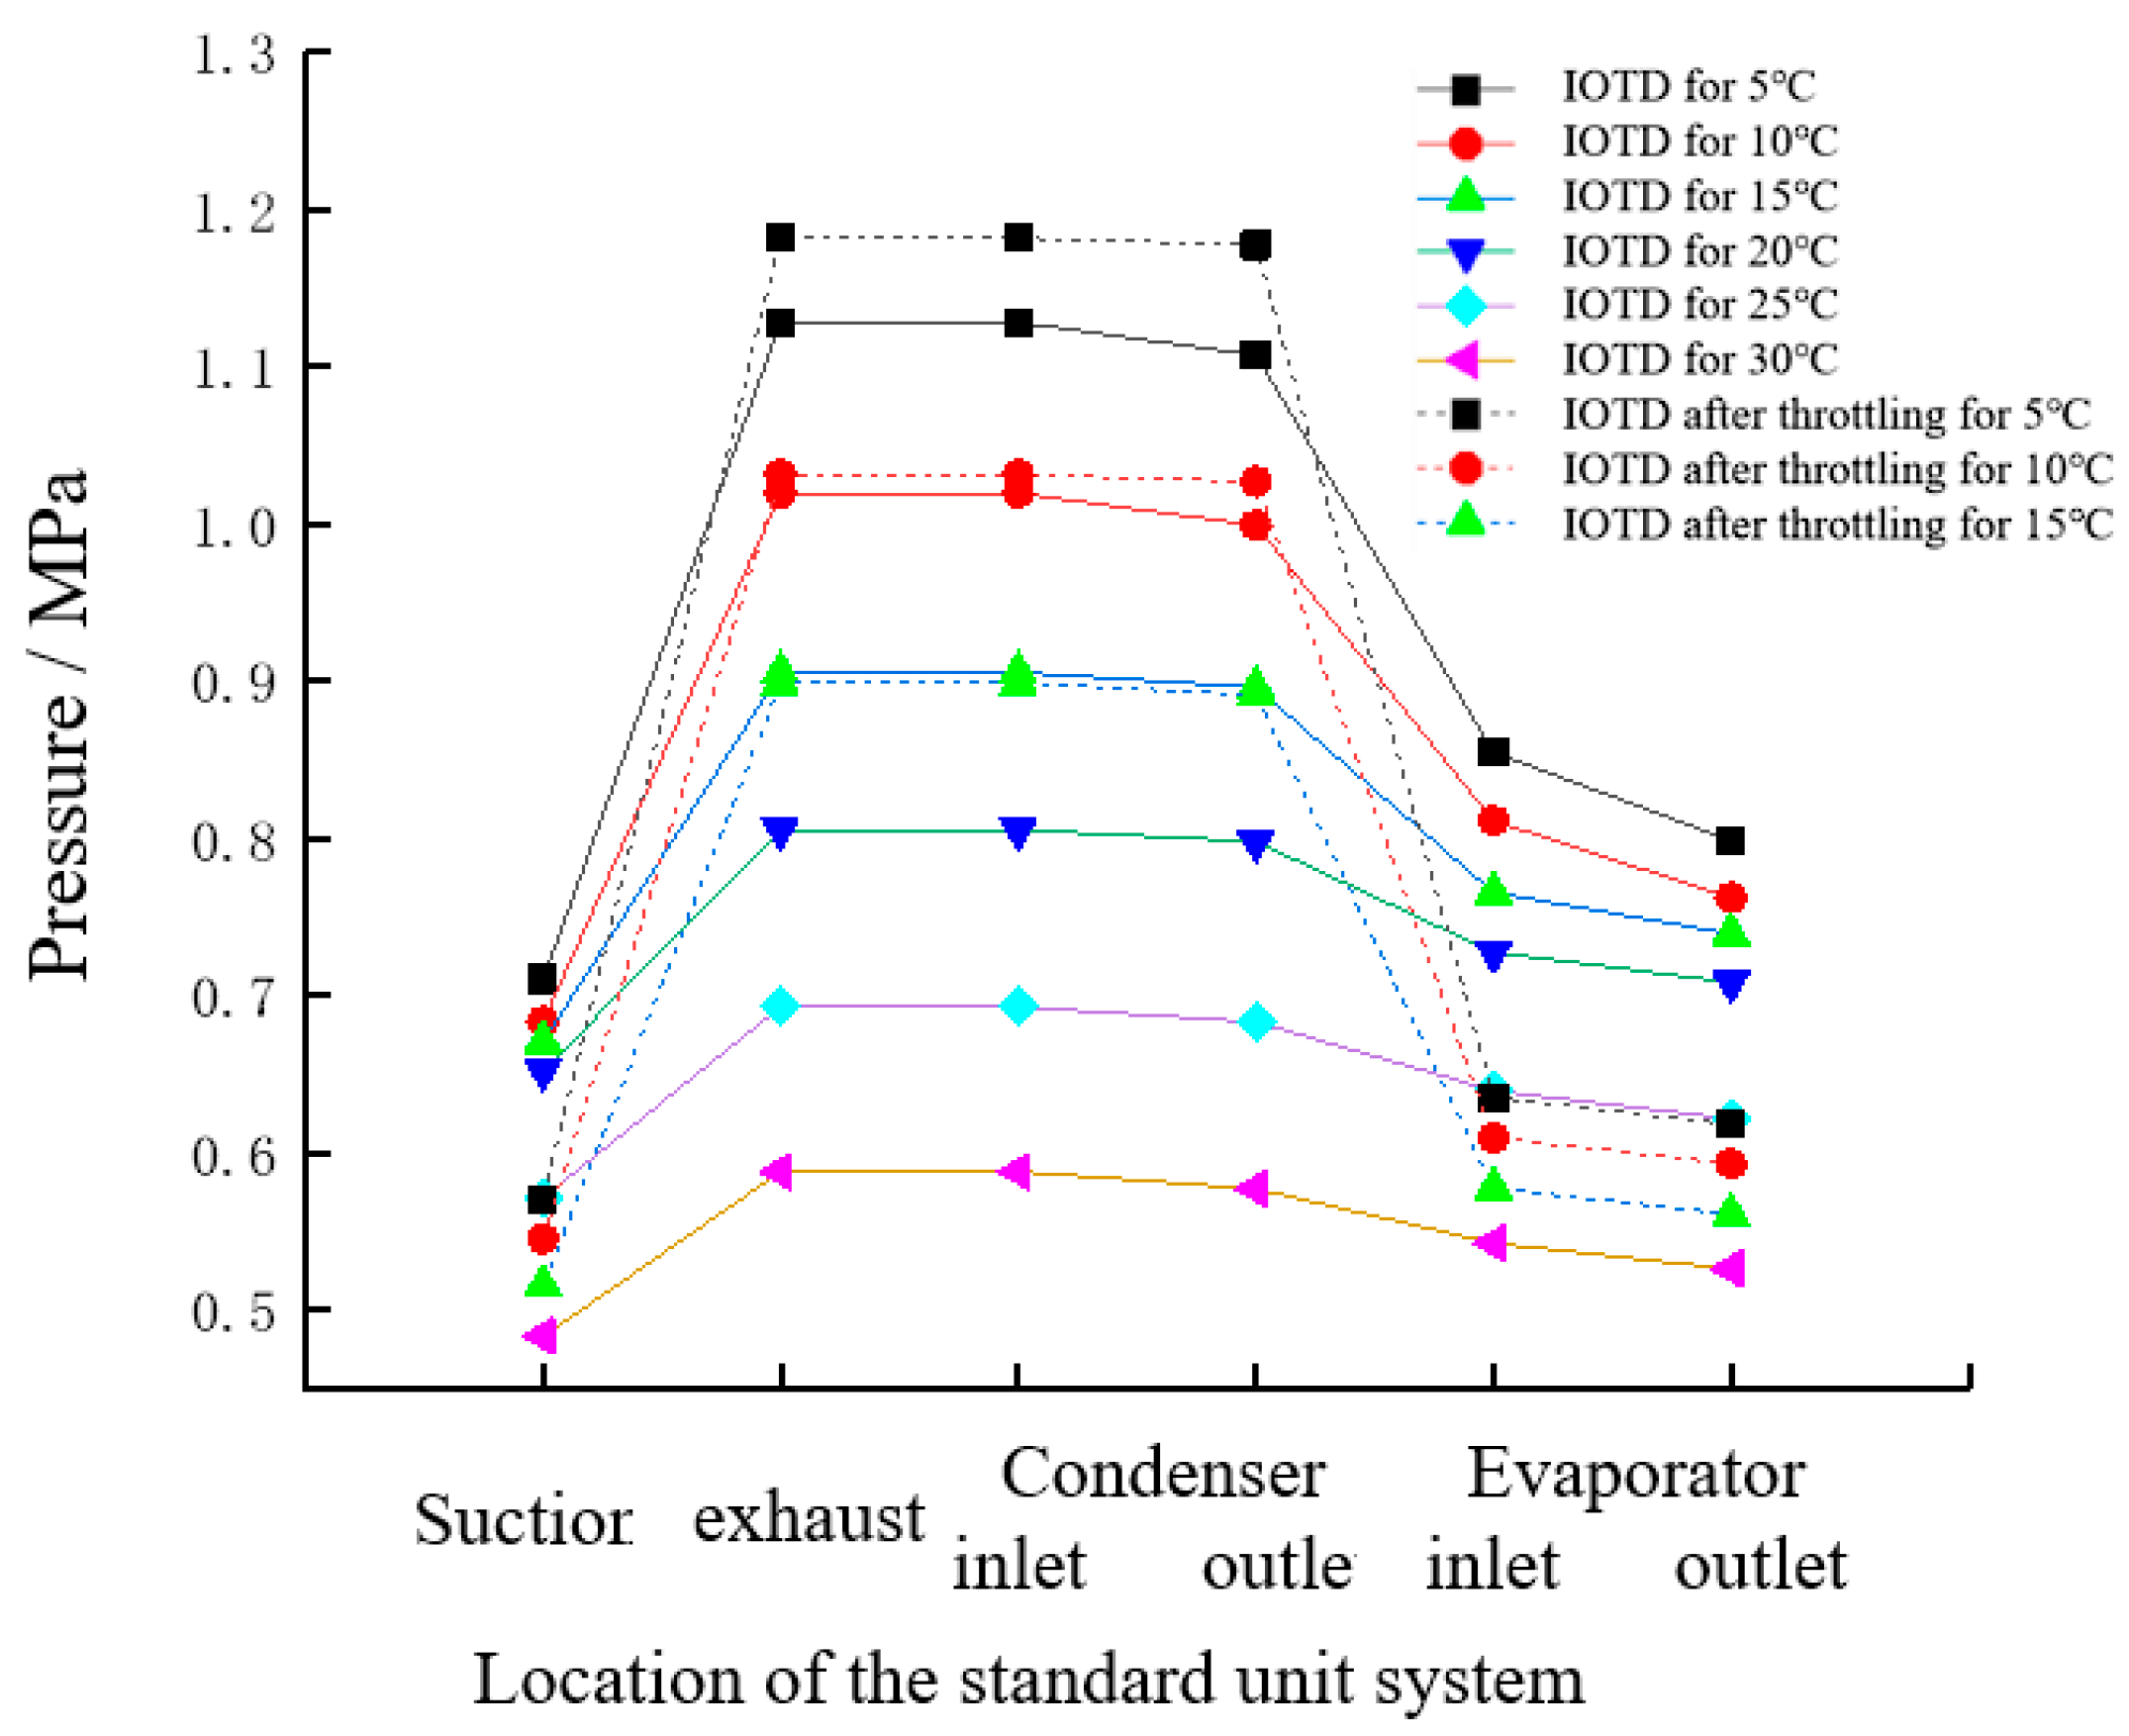
The three kinds of rotary booster system pressure variations are the same. From the suction port to the exhaust, the pressure rises rapidly. From the exhaust to the condenser inlet to the condenser outlet, the pressure drops slightly. From the condenser outlet to the evaporator inlet, the pressure drops rapidly, but the magnitude of the drop is less than the magnitude between the suction and exhaust. From the evaporator inlet to the evaporator outlet, the pressure drops, and the magnitude of the pressure drop is small but greater than the pressure drop of the condenser. Finally, the pressure drops from the evaporator outlet to the suction port.
(3)
The pressure curve of the rotary booster shows that with the increase in the indoor and outdoor temperature differences, the suction pressure, the exhaust pressure, as well as the pressure difference in the rotary booster show a decreasing trend. Comparison with the saturated condensation pressure curves at the outdoor ambient temperature reveals that the suction pressure exhibits a different variation with the indoor and outdoor temperature differences of 20 °C as the boundary. When the indoor and outdoor temperature difference is less than 20 °C (small temperature difference), the suction pressure is less than the saturated condensation pressure at the outdoor ambient temperature. When the indoor and outdoor temperature difference is more than 20 °C (large temperature difference), the suction pressure is more than the saturated condensation pressure at the outdoor ambient temperature. This outcome indicates that the pressurizing effect of the rotary booster weakens under a large temperature difference.
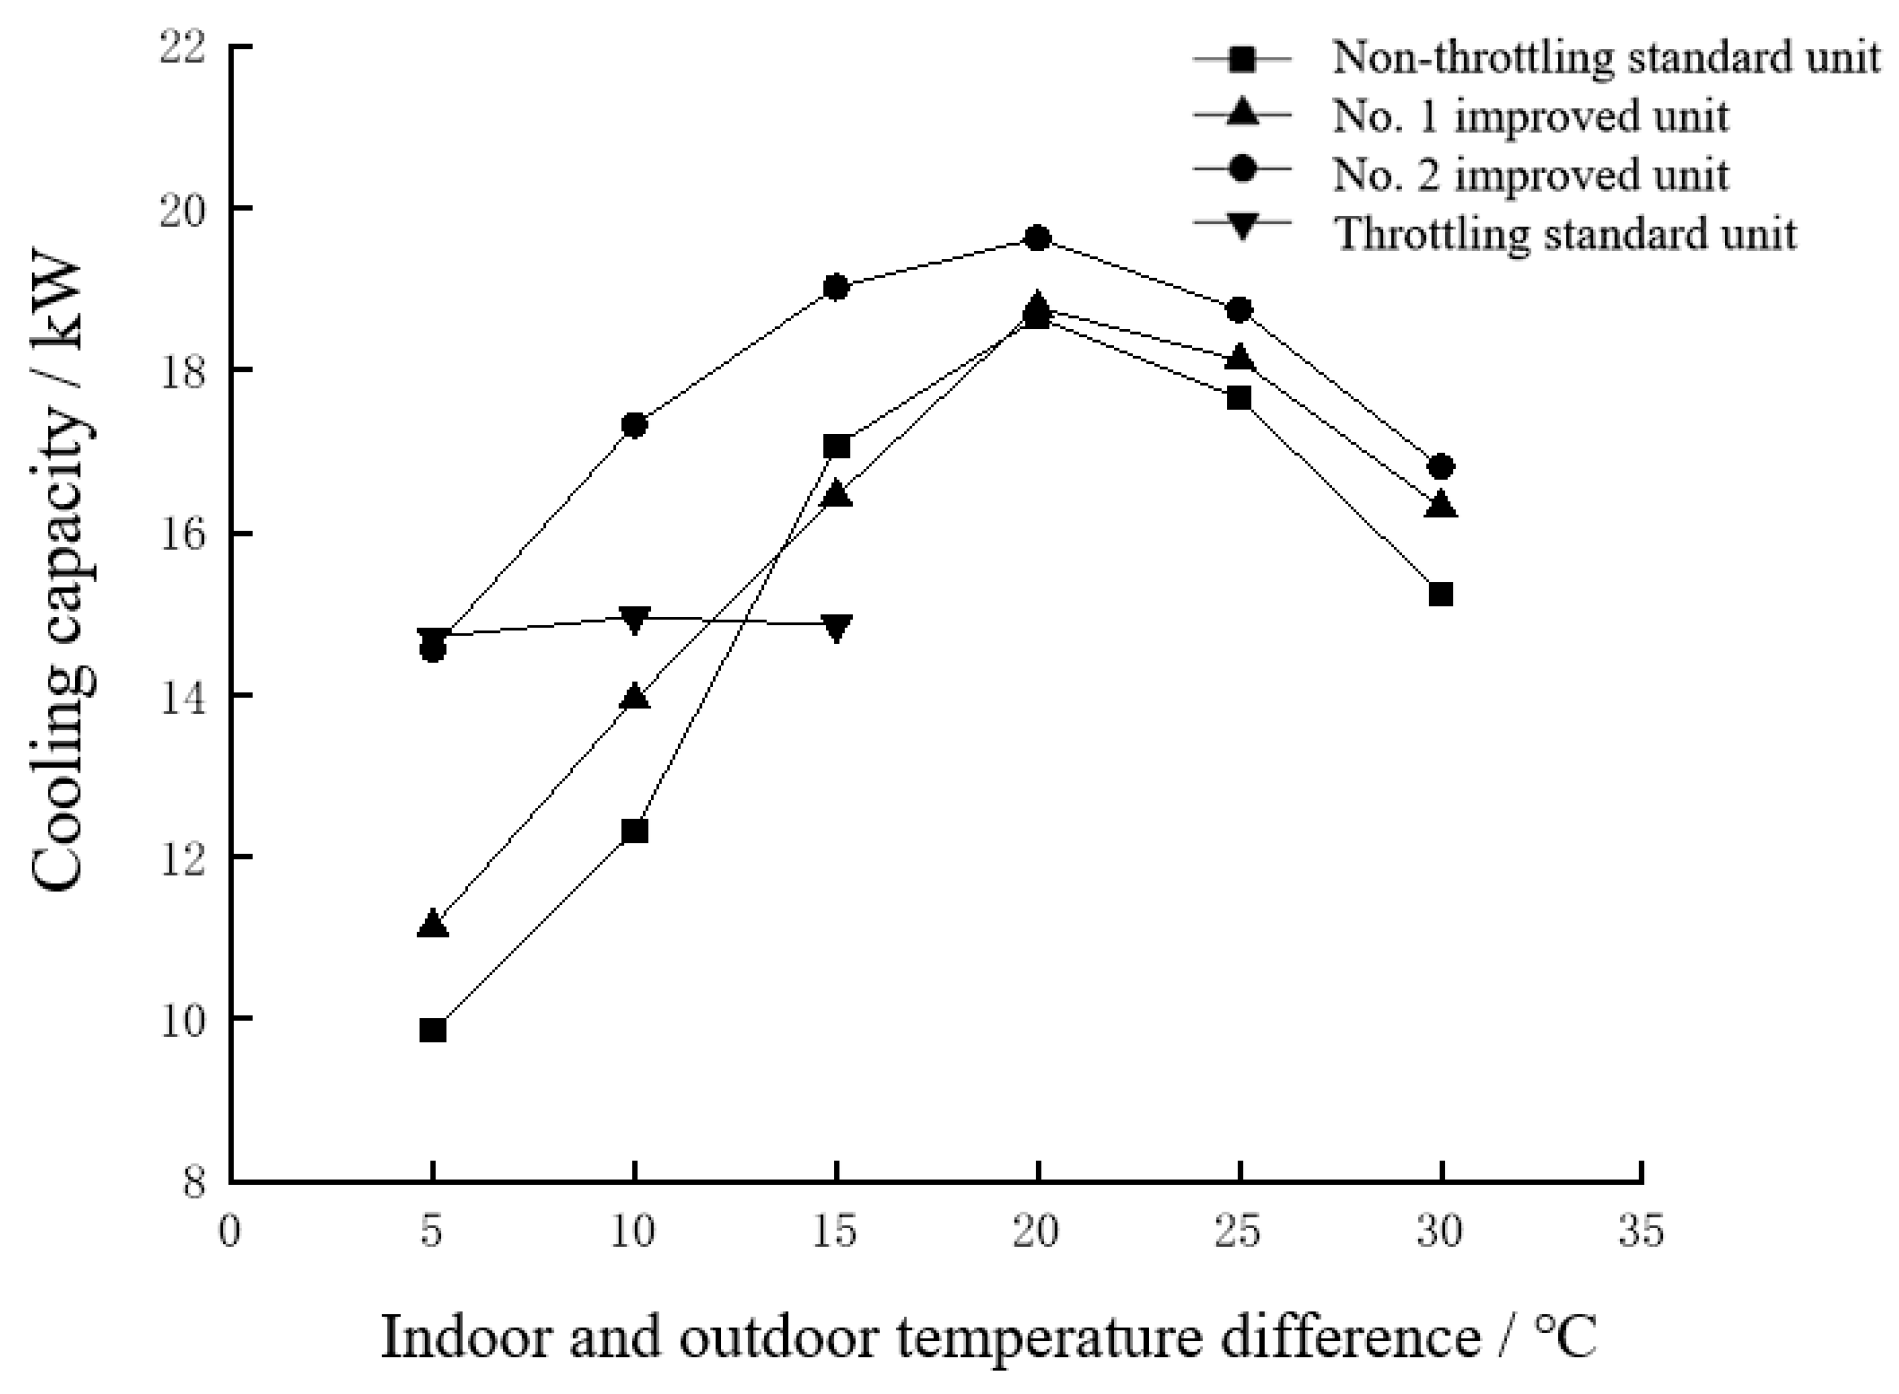
(4)
In terms of the system performance evaluation index, the cooling capacity in the indoor and outdoor temperature difference of 5 °C–15 °C of improved unit number 2 is better than that of improved unit number 1, and the growth rates are 30.7%, 24.2%, and 15.7%. However, after the indoor and outdoor temperature difference increases up to 20 °C, the growth rate is below 5%. The cooling capacity of improved unit number 2 is better than that of improved unit number 1, and the growth rate of the cooling capacity is more than 40% when the indoor and outdoor temperature difference is 5 °C and 10 °C. The growth rate of the cooling capacity for the rest of the working conditions is also about 10%.
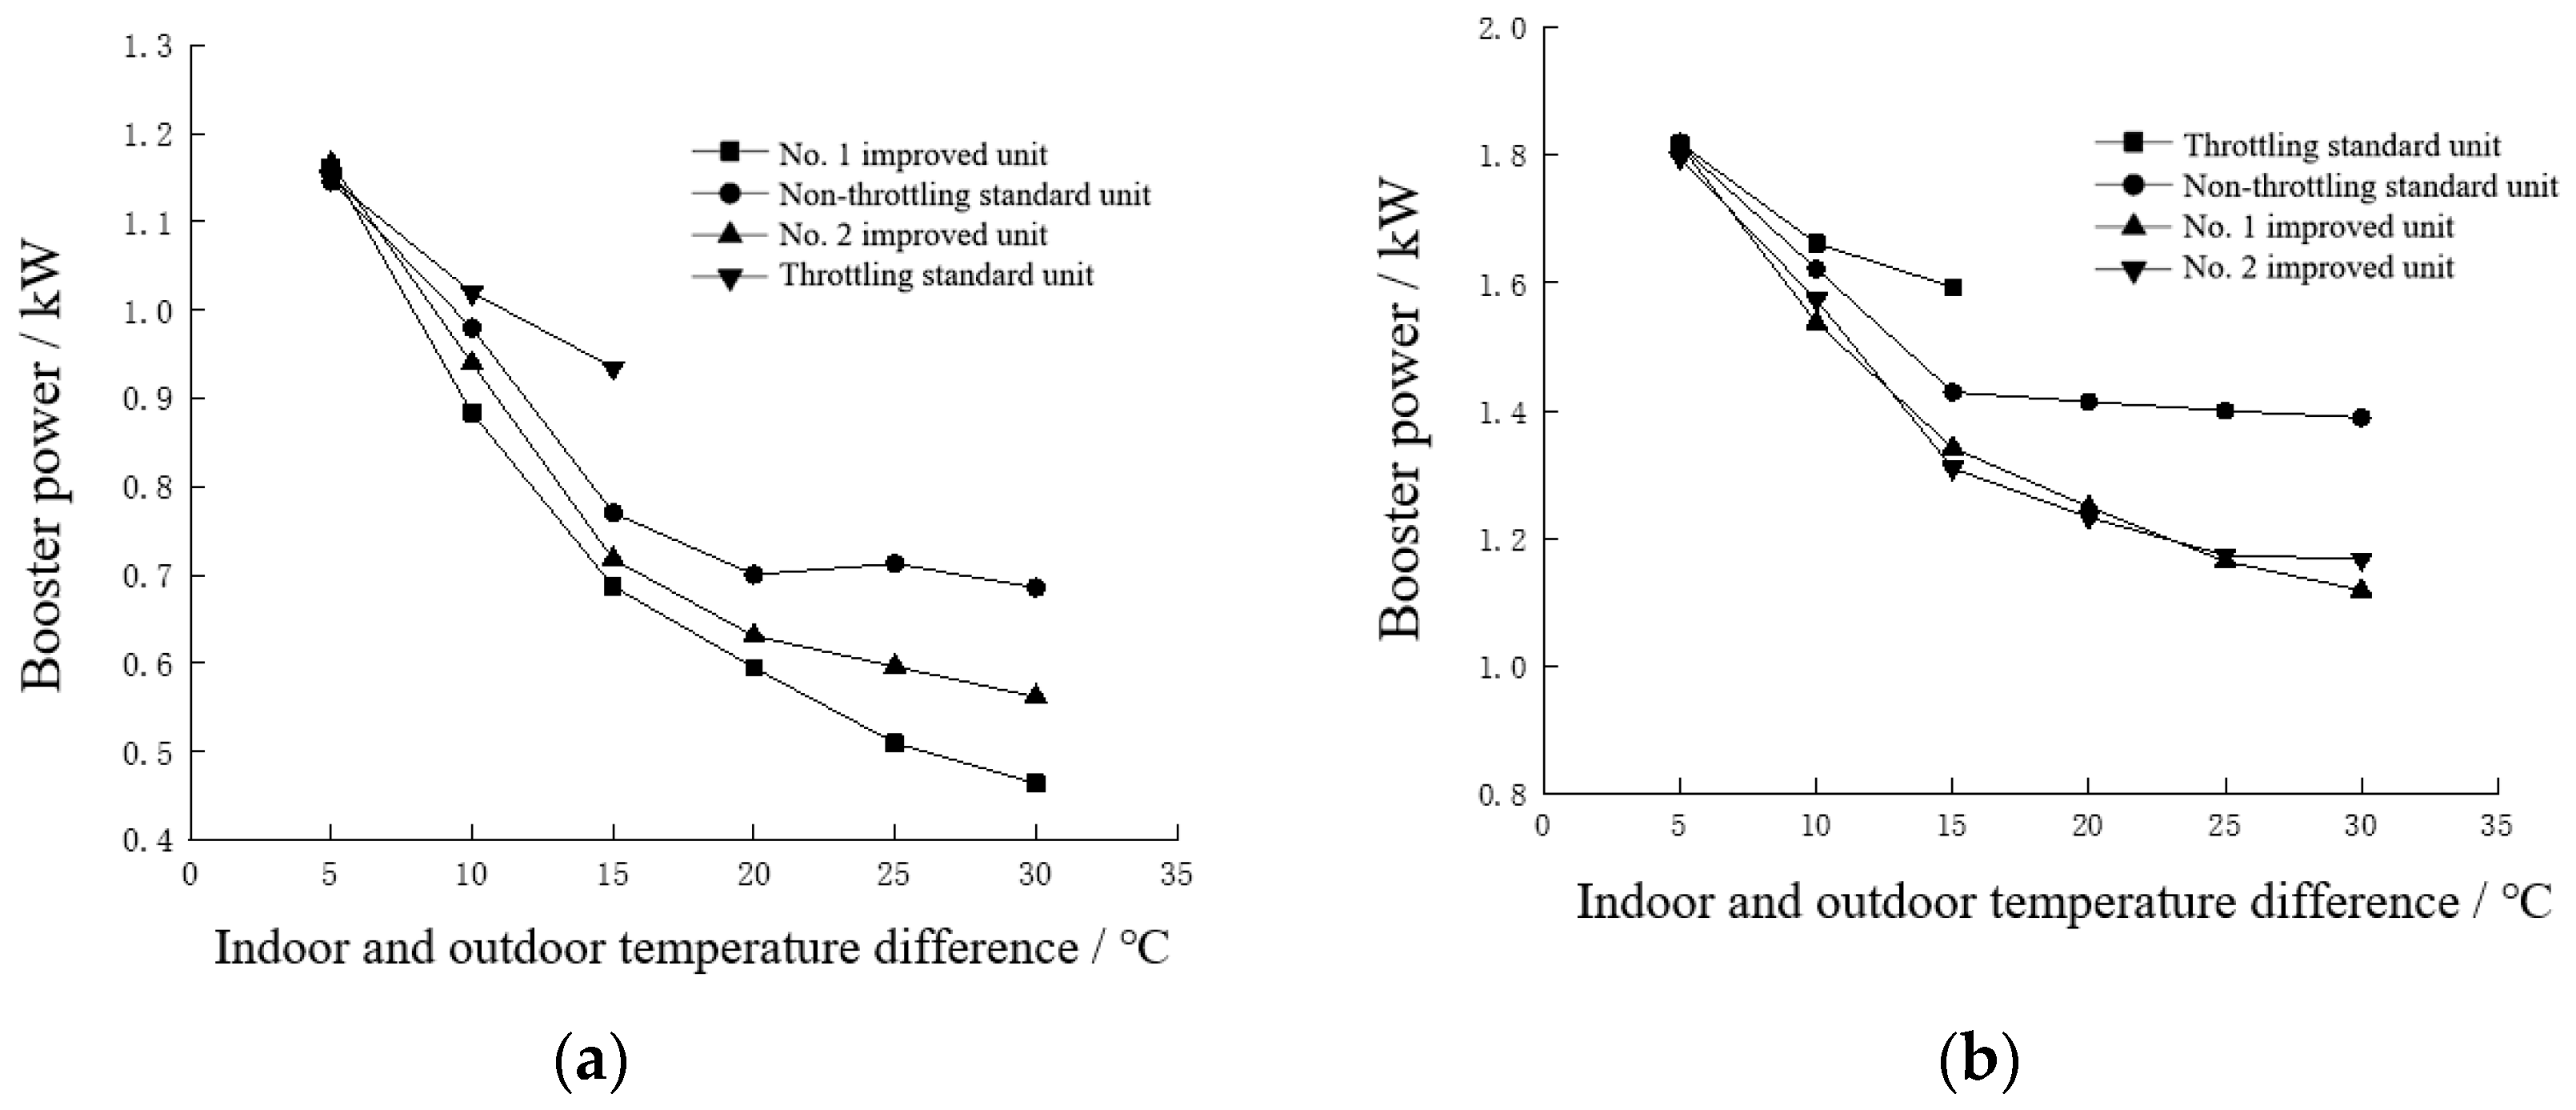
(5)
The system performance evaluation index, in all indoor and outdoor temperature difference ranges, shows the rotary booster power follows the order of standard unit in the throttled condition > standard unit in the unthrottled condition > improved unit number 2 > improved unit number 1. With the increase in the indoor and outdoor temperature difference, the rotary booster power shows a decreasing trend, and the decreasing trend stabilizes after the indoor and outdoor temperature difference of up to 20 °C. The reason is related to the suction pressure of the rotary booster and the saturated condensing pressure in ambient temperature.
(6)
The EER curves of improved unit number 2 are better than those of the standard unit and improved unit number 1 under most of the indoor and outdoor temperature differences. For the development of a special booster, the one with a large torque owns the priority. The performance variation rules and matching relationship of the hybrid unit can be adopted for the system design and efficiency improvement.

Author Contributions

Conceptualization, F.Z. and G.M.; methodology, F.Z., G.M. and S.L.; validation, S.L., B.X. and X.T.; formal analysis, R.Z., S.L., B.X. and X.T.; investigation, R.Z., S.L., F.Z. and G.M.; data curation, R.Z., S.L., B.X. and X.T.; writing—original draft preparation, R.Z., S.L., B.X. and X.T.; writing—review and editing, F.Z., G.M., R.Z., S.L., B.X. and X.T.; visualization, R.Z., S.L. and B.X.; supervision, F.Z. and G.M.; project administration, R.Z., F.Z. and G.M.; funding acquisition, F.Z. and G.M. All authors have read and agreed to the published version of the manuscript.

Funding

This research was supported by the State Key Laboratory of Air-Conditioning Equipment and System Energy Conservation (ACSKL2021KT03), the General Project of Science and Technology Program of Beijing Municipal Education Commission (KM201910005017), and the Science and Technology Innovation Foundation for Urban Carbon Neutralization of Beijing University of Technology (No. 049000514122607).

Institutional Review Board Statement

Not applicable.

Informed Consent Statement

Not applicable.

Conflicts of Interest

The authors declare no conflict of interest.

References

  1. Salim, M.; Tozer, R. Data centers’ energy auditing and bench marking-progress update. Ashrae Trans. 2010, 116, 109–117. [Google Scholar]
  2. Ebrahimi, K.; Jones, G.F.; Fleischer, A.S. A review of data center cooling technology, operating conditions and the corresponding low-grade waste heat recovery opportunities. Renew. Sustain. Energy Rev. 2014, 31, 622–638. [Google Scholar] [CrossRef]
  3. Li, G.; Shi, Z.; Zhang, Z.; Jin, T.; Shao, S.; Tian, C. Experimental investigation on energy saving of the combined air conditioner in data center by separate heat pipe and vapor compressor. Cryog. Supercond. 2016, 10, 67–71. [Google Scholar]
  4. Shi, W.; Han, L.; Wang, B. Principle of combined air conditioner by heat pipe and vapor compression and its application analysis in high heat density space. Refrig. Air Cond. 2011, 11, 30–36. [Google Scholar]
  5. Lee, S.; Kang, H.; Kim, Y. Performance optimization of a hybrid cooler combining vapor compression and natural circulation cycles. Int. J. Refrig. 2008, 32, 800–808. [Google Scholar] [CrossRef]
  6. Zhang, H.; Shao, S.; Xu, H.; Zou, H.; Tian, C. Free cooling of data centers: A review. Renew. Sustain. Energy Rev. 2014, 35, 171–182. [Google Scholar] [CrossRef]
  7. Wang, F. Design and Test of 30 kW Dynamic Separate Type Heat Pipe. Ph.D. Thesis, Hefei University of Technology, Hefei, China, 2014. [Google Scholar]
  8. Liu, J. Investigations on Running Characteristics of the Mechanically Pumped Cooling Loop for Space Applications. Ph.D. Thesis, Shanghai Jiao Tong University, Shanghai, China, 2008. [Google Scholar]
  9. Wang, T.; Wang, F.; Li, H.; Wang, J.; Zhao, S.; Liu, H.; Lv, J. Design and experimental study of dynamic separate type heat pipe. Refrig. Air Cond. 2014, 14, 40–43. [Google Scholar]
  10. Zhou, F.; Wei, C.; Ma, G. Development and analysis of a pump—Driven loop heat pipe unit for cooling a small data center. Appl. Therm. Eng. 2017, 124, 1169–1175. [Google Scholar] [CrossRef]
  11. Zhang, P.; Wang, B.; Shi, W.; Li, X. Experimental investigation on two-phase thermosyphon loop with partially liquid-filled downcomer. Appl. Energy 2015, 160, 10–17. [Google Scholar] [CrossRef]
  12. Wei, C.; Ma, G.; Xu, S.; Zhang, S.; Zhou, F. Design and experimental study on heat exchanger unit with a gas pump—Driven loop heat pipe for communication base stations. In Proceedings of the 12th National Conference on Refrigerators (Cabinet), Air Conditioners and Compressors; Small Refrigerator Low Temperature Biomedical Committee of Chinese Association of Refrigeration, Home Appliance Industry Technology Innovation Strategic Alliance: Hefei, China, 2014. [Google Scholar]
  13. Wang, F.; Huang, D.; Shi, Z. Experimental study on two kinds of dynamic separate type heat pipe system. Refrig. Air Cond. 2017, 17, 53–57. [Google Scholar]
  14. Shi, W.; Wang, F.; Huang, D.; Shi, Z. Development of gas pressurized composite air-conditioning unit and annual operation energy efficiency analysis. Refrig. Air Cond. 2017, 17, 11–16. [Google Scholar]
  15. Fei, Y. Error Theory and Data Processing; Mechanical Industry Press: Beijing, China, 2010; pp. 82–86. [Google Scholar]
Figure 1. Schematic diagram of rotary booster structure. (a) Dimensions; (b) inner structure. 1-exhaust tube; 2-shell; 3-stator; 4-rotor; 5-crank axle; 6-cylinder 1; 7-baffle; 8-cylinder 2; 9-suction tube; 10-oil container.
Sustainability 15 14558 g001
Figure 2. Design of the heat exchanger. (a) Main view; (b) left view; (c) three-dimensional figure of the heat exchanger.
Sustainability 15 14558 g002
Figure 3. Physical figure of indoor/outdoor units. (a) Indoor unit; (b) outdoor unit.
Sustainability 15 14558 g003
Figure 4. Experimental setup of booster-driven loop heat pipe energy recovery device. T—dry bulb temperature measurement point; Tw—wet bulb temperature measurement point; P—pressure measurement point; ΔP—pressure difference measurement point; 1, 2, 3, and 4—heat exchanger inlet shut-off valves; 5, 6, 7, and 8—three-way valves; 9, 10, 11, and 12—heat exchanger outlet shut-off valves; 13 and 14—condenser; 15 and 16—evaporator; 17—rotary booster; 18—gas/liquid separator; 19—mass flowmeter; 20, 21, and 22—sampling blower; 23—pressure difference measurement point; 24—nozzles.
Sustainability 15 14558 g004
Figure 5. Operating parameters of number 1 improvement booster at 35 °C outdoor temperature. (a) Temperature of the unit measurement points; (b) mass flow rate; (c) pressure of the unit measurement points.
Sustainability 15 14558 g005
Figure 6. Operating parameters of number 2 improvement booster at 40 °C outdoor temperature. (a) Temperature of unit measurement point; (b) pressure of unit measurement point; (c) mass flow.
Sustainability 15 14558 g006
Figure 7. Variation in pressure with temperature difference in different boosters. (a) Exhaust pressure of system; (b) suction pressure of system; (c) pressure difference in booster.
Sustainability 15 14558 g007
Figure 8. Pressure of number 1 improved unit system (indoor and outdoor temperature difference abbreviated as IOTD, the same below).
Sustainability 15 14558 g008
Figure 9. Pressure of number 2 improved unit system.
Sustainability 15 14558 g009
Figure 10. Pressure of standard unit system.
Sustainability 15 14558 g010
Figure 11. Variation in mass flow with temperature difference in different boosters.
Sustainability 15 14558 g011
Figure 12. Variation in refrigeration capacity with temperature difference in different boosters.
Sustainability 15 14558 g012
Figure 13. Variation in power with temperature differences in different boosters. (a) Power of booster; (b) power of unit.
Sustainability 15 14558 g013
Figure 14. Variation in EER of different booster units with indoor and outdoor temperature differences.
Sustainability 15 14558 g014
Table 1. Geometric parameters of the heat exchanger.
ParameterSymbolValueUnit
Outer tube diameterdo10mm
Tube thicknessδt0.5mm
Inner tube diameterdi9mm
Tube lengthl500mm
Number of tube rows on the windward sidenx24/
Number of tube rows in the airflow directionny5/
Center distance between tubes on the windward sidesx25mm
Pipe center distance in the airflow directionsy22mm
Fin thicknessδf0.2mm
Fin spacingsf2.3mm
Table 2. Main parameters of instruments.
InstrumentationPrecisionRangeBrand/Model
Thermocouples±0.2 °C−30 °C–150 °COmega/TT-T
Pressure transducer±0.2%0–25 barHuba/YD512
Data logger————Agilent/34970A
Power monitor±0.02%——YOKOGAWA/WT230
Pressure difference transducer±0.25%1000 paEJA-120/110
RTD platinum resistanceA class0.00–60.00 °CNRHS3/3wire
Mass flow meter±0.2%500 kg/hBJSINCERITY/Ultrasound Mass flow meter
Disclaimer/Publisher’s Note: The statements, opinions and data contained in all publications are solely those of the individual author(s) and contributor(s) and not of MDPI and/or the editor(s). MDPI and/or the editor(s) disclaim responsibility for any injury to people or property resulting from any ideas, methods, instructions or products referred to in the content.

