Understanding Consumer’s Willingness to Engage with Digital Reuse Systems


Abstract
:1. Understanding Consumer’s Willingness to Engage with Digital Reuse Systems
1.1. Factors That Influence Consumers’ Engagement with Reusable Packaging
1.2. Digital Reuse Systems
1.3. The Present Research
2. Study 1
2.1. Method
2.1.1. Participants
2.1.2. Materials
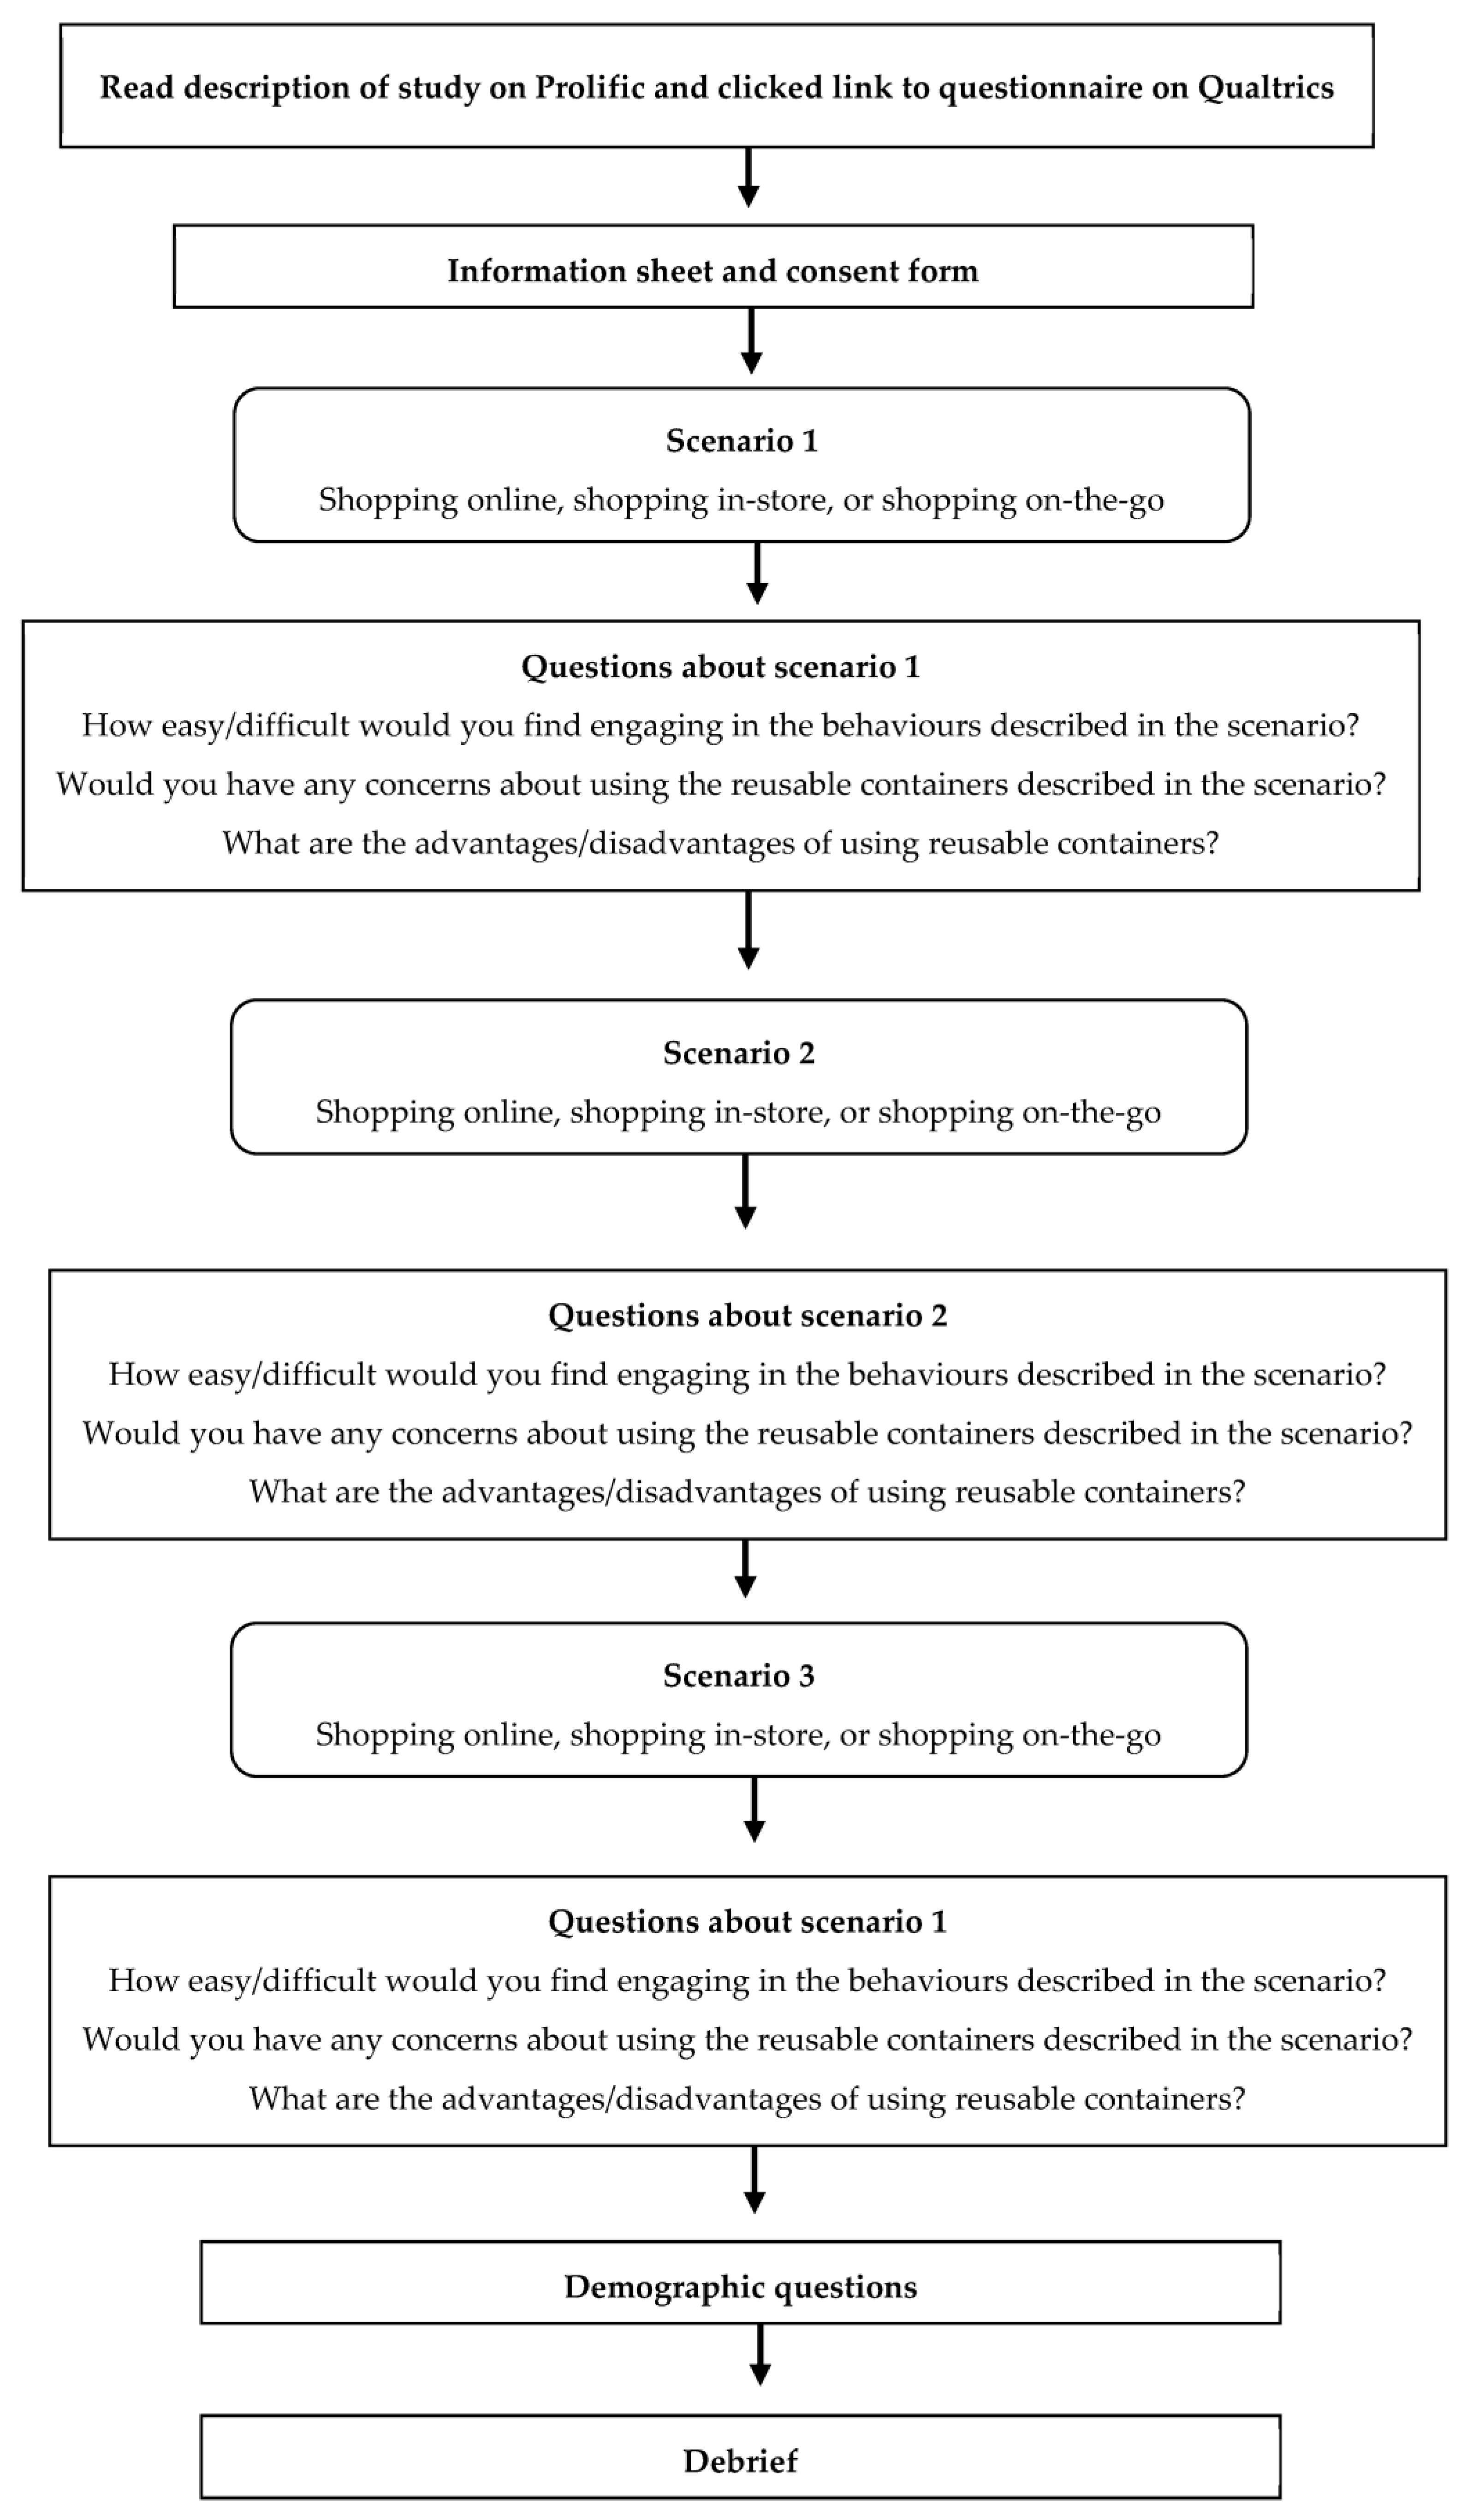
2.1.3. Procedure
2.2. Results
2.3. Discussion
3. Study 2
3.1. Method
3.1.1. Participants
3.1.2. Materials
3.1.3. Procedure
3.1.4. Data Analysis
3.2. Results
3.2.1. Willingness to Engage with Digital Reuse Systems
3.2.2. Beliefs about Digital Reuse Systems
3.2.3. Predictors of Willingness to Reuse Containers When Shopping Online
3.2.4. Predictors of Willingness to Reuse Containers When Shopping in Store
3.2.5. Predictors of Willingness to Reuse Containers When Shopping On-the-Go
3.3. Discussion
4. Study 3
- Information making it clear (rather than ambiguous) that it is the movement of the containers in the supply chain that are monitored (not the movement of consumers) and that the RFID tags (referred to as digital chips in the scenarios) are not GPS enabled, and so their location is only registered when scanned.
- Information about the technology being used and how it works.
- Information emphasising the benefits of including this technology in reuse systems (i) for the system as a whole or (ii) for the consumer.
4.1. Method
4.1.1. Participants
4.1.2. Design
4.1.3. Materials
4.1.4. Procedure
4.1.5. Data Analysis
4.2. Results
4.2.1. Willingness to Engage with Digital Reuse Systems
4.2.2. Beliefs about Digital Reuse Systems
4.3. Discussion
5. General Discussion
6. Limitations and Future Directions
7. Conclusions
Author Contributions
Funding
Institutional Review Board Statement
Informed Consent Statement
Data Availability Statement
Conflicts of Interest
References
- Global Plastic Waste. Available online: https://www.statista.com/topics/5401/global-plastic-waste/#topicOverview (accessed on 28 July 2023).
- Andrady, A.L.; Neal, M.A. Applications and Societal Benefits of Plastics. Philos. T. R. Soc. B 2009, 364, 1977–1984. [Google Scholar] [CrossRef] [PubMed]
- Langley, J.; Turner, N.; Yoxall, A. Attributes of Packaging and Influences on Waste. Packag. Technol. Sci. 2011, 24, 161–175. [Google Scholar] [CrossRef]
- The Big Plastic Count. Available online: https://thebigplasticcount.com/media/The-Big-Plastic-Count-Results-Report.pdf (accessed on 28 July 2023).
- The UK Plastic Pact’s Annual Report 2021–2022. Available online: www.wrap.org.uk/sites/default/files/2022-11/The%20UK%20Plastics%20Pact%20Annual%20Report%202021-22.pdf (accessed on 1 August 2023).
- Far-Reaching Ban on Single-Use Plastics in England. Available online: https://www.gov.uk/government/news/far-reaching-ban-on-single-use-plastics-in-england (accessed on 29 September 2023).
- Plastics Definitions. Available online: https://wrap.org.uk/taking-action/plastic-packaging/initiatives/the-uk-plastics-pact/plastics-definitions (accessed on 1 August 2023).
- Greenwood, S.C.; Walker, S.; Baird, H.M.; Parsons, R.; Mehl, S.; Webb, T.L.; Slark, A.T.; Ryan, A.J.; Rothman, R.H. Many Happy Returns: Combining Insights from the Environmental and Behavioural Sciences to Understand What Is Required to Make Reusable Packaging Mainstream. Sus. Prod. Consum. 2021, 27, 1688–1702. [Google Scholar] [CrossRef]
- Reuse—Rethinking Packaging. Available online: https://ellenmacarthurfoundation.org/reuse-rethinking-packaging (accessed on 28 July 2023).
- Future of Reusable Consumption Models. Available online: https://www.weforum.org/reports/future-of-reusable-consumption-models/ (accessed on 29 September 2023).
- Ellsworth-Krebs, K.; Rampen, C.; Rogers, E.; Dudley, L.; Wishart, L. Circular Economy Infrastructure: Why We Need Track and Trace for Reusable Packaging. Sustain. Prod. Consum. 2021, 29, 249–258. [Google Scholar] [CrossRef]
- Living Landscape of Reusable Packaging Solutions. Available online: https://www.reuselandscape.org/ (accessed on 28 July 2023).
- Bradley, C.; Corsini, L. A Literature Review and Analytical Framework of the Sustainability of Reusable Packaging. Sustain. Prod. Consum. 2023, 37, 126–141. [Google Scholar]
- Coelho, P.M.; Corona, B.; Klooster, R.t.; Worrell, E. Sustainability of Reusable Packaging–Current Situation and Trends. Resour. Conserv. Recycl. 2020, 6, 100037. [Google Scholar] [CrossRef]
- Cottafava, D.; Costamagna, M.; Baricco, M.; Corazza, L.; Miceli, D.; Riccardo, L.E. Assessment of the Environmental Break-Even Point for Deposit Return Systems through an LCA Analysis of Single-Use and Reusable Cups. Sustain. Prod. Consum. 2021, 27, 228–241. [Google Scholar] [CrossRef]
- Refill and Reuse: Unilever Launches Cif Ecorefill, Removing 1.5 Million Plastic Spray Bottles from Shelves. Available online: https://www.packaginginsights.com/news/refill-and-reuse-unilever-launches-cif-ecorefill-removing-15-million-plastic-spray-bottles-from-shelves.html (accessed on 1 August 2023).
- Reuse Systems Unpacked. Available online: https://www.hubbub.org.uk/reuse-systems-unpacked (accessed on 28 July 2023).
- Jiang, X.; Dong, M.; He, Y.; Shen, J.; Jing, W.; Yang, N.; Guo, X. Research on the Design of and Preference for Collection Modes of Reusable Takeaway Containers to Promote Sustainable Consumption. Int. J. Environ. Res. Public Health 2020, 17, 4764. [Google Scholar] [CrossRef]
- Miao, X.; Magnier, L.; Mugge, R. Switching to Reuse? An Exploration of Consumers’ Perceptions and Behaviour towards Reusable Packaging Systems. Resour. Conserv. Recycl. 2023, 193, 106972. [Google Scholar] [CrossRef]
- Baxter, W.; Aurisicchio, M.; Childs, P. Contaminated Interaction: Another Barrier to Circular Material Flows. J. Ind. Ecol. 2017, 21, 507–516. [Google Scholar] [CrossRef]
- Hazée, S.; Van Vaerenbergh, Y.; Delcourt, C.; Warlop, L. Sharing Goods? Yuck, No! An Investigation of Consumers’ Contamination Concerns about Access-Based Services. J. Serv. Res. 2019, 22, 256–271. [Google Scholar] [CrossRef]
- Baird, H.M.; Meade, K.; Webb, T.L. This Has Already Been Used! A Paradigm to Measure the Point at Which People Become Unwilling to Use Reusable Containers. J. Clean. Prod. 2022, 363, 132321. [Google Scholar] [CrossRef]
- Collis, B.; Baxter, W.; Baird, H.M.; Meade, K.; Webb, T.L. Signs of Use Present a Barrier to Reusable Packaging Systems for Takeaway Food. Sustainability 2023, 15, 8857. [Google Scholar] [CrossRef]
- Magnier, L.; Gil-Perez, I. Reviving the milk man: Consumers’ evaluations of circular reusable packaging offers. In Proceedings of the PLATE 2021: The 4th Conference on Product Lifetimes and the Environment, Limerick, Ireland, 26–28 May 2021. [Google Scholar]
- Lofthouse, V.A.; Bhamra, T.A.; Trimingham, R.L. Investigating Customer Perceptions of Refillable Packaging and Assessing Business Drivers and Barriers to Their Use. Packag. Technol. Sci. 2009, 22, 335–348. [Google Scholar] [CrossRef]
- Long, Y.; Ceschin, F.; Mansour, N.; Harrison, D. Product–Service Systems Applied to Reusable Packaging Systems: A Strategic Design Tool. Des. Manage. 2020, 15, 15–32. [Google Scholar] [CrossRef]
- Lampe, M.; Strassner, M. The Potential of RFID for Moveable Asset Management. In Ubiquitous Commerce Workshop at Ubicomp; ETH Zurich: Zürich, Switzerland, 2003. [Google Scholar]
- Matthews, M.; Webb, T.L. Review of How Tracking Technologies Have been Used within Reuse Systems for Food and Drink. (Appendix in a Report Titled “Reusability by Design: Reusable Plastic Packaging Design Guidance for the Value Chain” Published by RECOUP). Available online: https://www.recoup.org/p/422/sustainability-circularity (accessed on 13 July 2023).
- Mandatory Digital Waste Tracking. Available online: https://www.gov.uk/government/publications/digital-waste-tracking-service/mandatory-digital-waste-tracking (accessed on 1 August 2023).
- Green Deal: New Proposals to Make Sustainable Products the Norm and Boost Europe’s Resource Independence. Available online: https://ec.europa.eu/commission/presscorner/detail/en/ip_22_2013 (accessed on 24 August 2023).
- Dogra, N.; Adil, M.; Sadiq, M.; Rafiq, F.; Paul, J. Demystifying Tourists’ Intention to Purchase Travel Online: The Moderating Role of Technical Anxiety and Attitude. Curr. Issues Tour 2022, 26, 2164–2183. [Google Scholar] [CrossRef]
- Maduku, D.K.; Mpinganjira, M.; Rana, N.P.; Thusi, P.; Ledikwe, A.; Mkhize, N.H. Assessing Customer Passion, Commitment, and Word-of-Mouth Intentions in Digital Assistant Usage: The Moderating Role of Technology Anxiety. J. Retail. Consum. Serv. 2023, 71, 103208. [Google Scholar] [CrossRef]
- Meuter, M.L.; Ostrom, A.L.; Bitner, M.J.; Roundtree, R. The Influence of Technology Anxiety on Consumer Use and Experiences with Self-Service Technologies. J. Bus. Res. 2003, 56, 899–906. [Google Scholar] [CrossRef]
- Vo, K.N.; Le, A.N.H.; Thanh Tam, L.; Ho Xuan, H. Immersive Experience and Customer Responses towards Mobile Augmented Reality Applications: The Moderating Role of Technology Anxiety. Cogent Bus. 2022, 9, 2063778. [Google Scholar] [CrossRef]
- Douglas, B.D.; Ewell, P.J.; Brauer, M. Data Quality in Online Human-Subjects Research: Comparisons between MTurk, Prolific, CloudResearch, Qualtrics, and SONA. PLoS ONE 2023, 18, e0279720. [Google Scholar] [CrossRef]
- Peer, E.; Rothschild, D.; Gordon, A.; Everden, Z.; Damer, E. Data Quality of Platforms and Panels for Online Behavioral Research. In Behavior Research Methods; Springer: Berlin/Heidelberg, Germany, 2021. [Google Scholar]
- Allison, A.L.; Lorencatto, F.; Michie, S.; Miodownik, M. Barriers and Enablers to Buying Biodegradable and Compostable Plastic Packaging. Sustainability 2021, 13, 1463. [Google Scholar] [CrossRef]
- Gibbons, F.X.; Gerrard, M.; Ouellette, J.A.; Burzette, R. Cognitive Antecedents to Adolescent Health Risk: Discriminating between Behavioral Intention and Behavioral Willingness. Psychol. Health 1998, 13, 319–339. [Google Scholar] [CrossRef]
- Hukkelberg, S.S.; Dykstra, J.L. Using the Prototype/Willingness Model to Predict Smoking Behaviour among Norwegian Adolescents. Addict. Behav. 2009, 34, 270–276. [Google Scholar] [CrossRef] [PubMed]
- Triandis, H.C. Values, attitudes, and interpersonal behavior. In Nebraska Symposium of Motivation; Howe, H.E., Jr., Page., M., Eds.; University of Nebraska Press: Lincoln, NE, USA, 1980; Volume 27, pp. 195–259. [Google Scholar]
- Van Overveld, W.J.M.; De Jong, P.J.; Peters, M.L.; Cavanagh, K.; Davey, G.C. Disgust Propensity and Disgust Sensitivity: Separate Constructs that are Differentially Related to Specific Fears. Pers. Individ. Differ. 2006, 41, 1241–1252. [Google Scholar] [CrossRef]
- Whitmarsh, L.; O’Neill, S. Green Identity, Green Living? The Role of Pro-Environmental Self-Identity in Determining Consistency across Diverse Pro-Environmental Behaviours. J. Environ. Psychol. 2010, 30, 305–314. [Google Scholar] [CrossRef]
- Ellen, P.S. Do We Know What We Need to Know? Objective and Subjective Knowledge Effects on Pro-Ecological Behaviors. J. Bus. Res. 1994, 30, 43–52. [Google Scholar] [CrossRef]
- Lefkeli, D.; Tulan, D.; Gürhan-Canli, Z. Being Observed in the Digital Era: Conceptualization and Scale Development of the Perception of Being Observed. Psychol. Mark. 2022, 39, 1992–2008. [Google Scholar] [CrossRef]
- Steelman, K.S.; Tislar, K. Measurement of Tech Anxiety in Older and Younger Adults. In Proceedings of the International Conference on Human-Computer Interaction, Orlando, FL, USA, 26–31 July 2019; pp. 520–527. [Google Scholar]
- Hartmann, C.; Siegrist, M. Development and Validation of the Food Disgust Scale. Food Qual. 2018, 63, 38–50. [Google Scholar] [CrossRef]
- Ertz, M.; Huang, R.; Jo, M.-S.; Karakas, F.; Sarigöllü, E. From Single-Use to Multi-Use: Study of Consumers’ Behavior toward Consumption of Reusable Containers. J. Environ. Manag. 2017, 193, 334–344. [Google Scholar] [CrossRef]
- Sparks, P.; Shepherd, R. Self-Identity and the Theory of Planned Behavior: Assesing the Role of Identification with “Green Consumerism”. Soc. Psychol. Q. 1992, 55, 388. [Google Scholar] [CrossRef]
- Baumeister, R.F.; Vohs, K.D.; Nathan DeWall, C.; Zhang, L. How Emotion Shapes Behavior: Feedback, Anticipation, and Reflection, rather than Direct Causation. Pers. Soc. Psychol. Rev. 2007, 11, 167–203. [Google Scholar] [CrossRef] [PubMed]
- Sheeran, P.; Maki, A.; Montanaro, E.; Avishai-Yitshak, A.; Bryan, A.; Klein, W.M.P.; Miles, E.; Rothman, A.J. The Impact of Changing Attitudes, Norms, and Self-Efficacy on Health-Related Intentions and Behavior: A Meta-Analysis. Health Psychol. 2016, 35, 1178–1188. [Google Scholar] [CrossRef] [PubMed]
- Faul, F.; Erdfelder, E.; Lang, A.-G.; Buchner, A. G*Power 3: A Flexible Statistical Power Analysis Program for the Social, Behavioral, and Biomedical Sciences. Behav. Res. Methods 2007, 39, 175–191. [Google Scholar] [CrossRef] [PubMed]
- Online Grocery Shopping in the UK. Available online: https://www.statista.com/topics/3144/online-grocery-shopping-in-the-united-kingdom/#topicOverview (accessed on 1 August 2023).
- Costello, A.B.; Osborne, J. Best practices in exploratory factor analysis: Four recommendations for getting the most from your analysis. Pract. Assess. Res. Eval. 2005, 10, 7. [Google Scholar]
- Velicer, W.F.; Jackson, D.N. Component analysis versus common factor analysis: Some issues in selecting an appropriate procedure. Multivar. Behav. Res. 1990, 25, 1–28. [Google Scholar] [CrossRef]
- Himmelfarb, S. What Do You Do When the Control Group Doesn’t Fit into the Factorial Design? Psychol. Bull. 1975, 82, 363–368. [Google Scholar] [CrossRef]
- Plangger, K.; Montecchi, M. Thinking beyond Privacy Calculus: Investigating Reactions to Customer Surveillance. J. Interact. Mark. 2020, 50, 32–44. [Google Scholar] [CrossRef]
- Smith, H.J.; Milberg, S.J.; Burke, S.J. Information Privacy: Measuring Individuals’ Concerns about Organizational Practices. MIS Q. 1996, 20, 167. [Google Scholar] [CrossRef]
- Pal, D.; Babakerkhell, M.D.; Roy, P. How Perceptions of Trust and Intrusiveness Affect the Adoption of Voice Activated Personal Assistants. IEEE Access 2022, 10, 123094–123113. [Google Scholar] [CrossRef]
- Douglas, K.; Sutton, R.; Cichocka, A. The Psychology of Conspiracy Theories. Curr. Dir. Psychol. 2017, 26, 538–542. [Google Scholar] [CrossRef]
- Wood, W. Attitude Change: Persuasion and Social Influence. Annu. Rev. Psychol. 2000, 51, 539–570. [Google Scholar] [CrossRef] [PubMed]
- Howe, L.C.; Krosnick, J.A. Attitude Strength. Annu. Rev. Psychol. 2017, 68, 327–351. [Google Scholar] [CrossRef] [PubMed]
- Clark, J.K.; Evans, A.T. Source credibility and persuasion: The role of message position in self-validation. Psychol. Sci. 2014, 40, 1024–1036. [Google Scholar] [CrossRef] [PubMed]
- Prislin, R.; Wood, W. Social Influence in Attitudes and Attitude Change. In The Handbook of Attitudes; Albarracín, D., Johnson, B.T., Zanna, M.P., Eds.; Lawrence Erlbaum Associates Publishers: Mahwah, NJ, USA, 2005; pp. 671–705. [Google Scholar]
- Trope, Y.; Liberman, N. Construal-Level Theory of Psychological Distance. Psychol. Rev. 2010, 117, 440–463. [Google Scholar] [CrossRef]
- Morwitz, V.G.; Fitzsimons, G.J. The Mere-Measurement Effect: Why Does Measuring Intentions Change Actual Behavior? J. Consum. Psychol. 2004, 14, 64–74. [Google Scholar]
- Meng, M.D.; Leary, R.B. It Might be Ethical, but I Won’t Buy It: Perceived Contamination of, and Disgust towards, Clothing Made from Recycled Plastic Bottles. Psychol. Mark. 2019, 38, 298–312. [Google Scholar] [CrossRef]
- White, K.; Lin, L.; Dahl, D.W.; Ritchie, R.J.B. When Do Consumers Avoid Imperfections? Superficial Packaging Damage as a Contamination Cue. J. Mark. Res. 2016, 53, 110–123. [Google Scholar] [CrossRef]


| Theme | Example Quotes |
|---|---|
| Enablers | |
| Environmental benefits | “Reusing containers is much more environmentally friendly and sustainable”. “There would be less going to landfill and less waste” |
| Domestic benefits | “Having reusable containers that would go back to the retailer would mean that my recycling bin at home would be less cluttered each week”. |
| Reminders to return | “A list of the products I received that were using reusable containers so I would be able to return all the containers without fail”. “A reminder from the online delivery supermarket to get your containers ready for pick up”. |
| Informed about how to use system | “Clear instructions on what to do”. “Information on what happens if they are broken or missing”. |
| Ease of using systems | “The smart return point would have to be quick and efficient in this fast society”. |
| Convenience | “Having them collected from your home is far easier than having to return them yourself”. “If it is a supermarket that you visit regularly then it’s no hardship to take your containers back with you when you next go shopping” |
| Central locations for return points | “Having lots of drop off points not just at the supermarket for example amazon lockers etc so can drop off at a close location”. “Wide availability of return points, not linked to any one brand of shop”. “They would need to be able to be returned to any of numerous locations away from the purchase site. The whole thing about buying ‘on the go’ is that I’m quite possibly not going to be returning to that same location”. |
| Incentives to use system | “If there was a reward system in place”. “Having an incentive to return them (price reduction, coupons) “Customer needs an incentive to keep the bottle rather discard it. For example, a drink may be 20p more expensive but you get that 20p back when returning the bottle”. |
| Anticipated emotions | “Feeling good about being environmentally friendly” |
| Already sort waste (e.g., for recycling) | “We are already in the habit of taking reusable bags into the store—adding containers for recycling to take back is just a minor adjustment in a routine”. “I already collect these items for recycling, so it would be easy for me to store them separately to send them back to the shop”. |
| Design of reusable containers/packaging | “Ideally they would need to take up as little space as possible (i.e., be stackable)” “If they were study enough to be used properly again”. “Containers are light so can be easily transported by bike/car”. |
| Automation of process | “Returning to a machine would be easier than a person”. “An automatic financial incentive to return the bottle”. |
| Barriers | |
| Design of reusable containers/packaging | “Size of them might put people off keeping them until the next delivery” “Having specific opening and closing mechanisms could make it difficult”. “If I’ve taken it back to the office for my lunch I don’t want to be walking round with a huge bottle that needs taking back to the store” |
| Do not drive | “I also don’t drive, so if I did a small to medium shop, which I sometimes do without the car I would have to carry them all into town. This is a disadvantage to those of us without cars”. “Getting to the location of certain retailers” |
| Feel unable to clean | “If the containers could not be cleaned easily.“ “If they are difficult to clean” |
| Effort involved in using system | “More effort for the consumer” “You have to think a bit more about your waste, and make sure you don’t throw things away that need to be returned” “It would be an additional job to do in returning the packaging” |
| Memory demands (e.g., forgetting to bring or return containers) | “To start it might be difficult to remember, as it was for reusable bags”. “Just forgetting to bring them”. “Having to return them in shop. This means I have to remember to pick up the container from home” |
| Complexity of system | “A complicated process with different types of containers”. “Scanning system in store that is complex and may require regular assistance from staff”. “It’s more complicated than just being allowed to use your own containers”. |
| Cleanliness | “The containers could be dirty, so you would need quality control in place”. “I would be concerned that the bottles had been cleaned thoroughly” |
| Hygiene | “The downside would be a potential poor hygiene situation. Spread of pathogens”. “My main concern is the hygiene standards of the business. Sanitary cleaning would be essential”. “Containers for pasta/rice is not such an issue as you aren’t directly putting your mouth to the packaging, plus cooking the food before eating to get rid of bacteria. But with a drinks bottle that has more cause for concern”. |
| Contamination of product | “I might be concerned about the containers degrading or containing harmful chemicals that could leach into food (e.g., BPA)”. “Food contamination is my main concern. Especially with fresh produce. I would much rather re-use my own containers than some containers whose whereabouts and sanitation procedures I am not sure of”. |
| Concerns over tracking | “Digital chip again. I’m concerned about the location of my house being compromised and accessed by someone other than the retailer”. “The scheme above sounds a bit intrusive. I wouldn’t want them to be able to track me or my products”. “Digital chip could possibly be hacked, and my location could be accessed by someone else” |
| Damage to containers | “Damaged containers not accepted back”. “The cost of replacement when they get damaged”. “Some may not be in good condition for return” |
| Erroneous beliefs about system | “Expected to clean them before return” |
| Penalties | “Would you be penalised for damaging the packaging?” |
| Environmental cost | “I question the cost (in CO2) of delivering the packaging to a cleaning centre, and back to the store”. “The materials used to create the containers and the energy consumption/environmental impact in their creation”. “Might be more environmentally damaging if people aren’t returning them and throwing them away instead” |
| Confidence in return | “If the technology failed then this could cause a problem”. “That you may take the containers to a return point while on the way somewhere else, only to find that the return point was broken or not functioning” |
| Responsibility for containers | “I would want to wash the containers so it’s very likely a digital chip would get damaged. If they were damaged would the shop charge for their replacement?” “Containers being stolen from the front of the property. If left out someone may just come and take them”. |
| Attitudes towards plastic | “My main concern would be that wouldn’t be solving the issue of getting rid of plastic. Companies would have to be making more plastic to make these containers. We need less plastic in the world. Not more”. “It doesn’t really solve the plastic problem. You are replacing a problem with another problem”. |
| Finite resources being used for digital reuse systems | “The raw materials in digital chips are running low, worldwide, and are increasingly hard to get hold of. Is this the best use of them or should priority be given to laptops and essential equipment?” “Waste of microchips” |
| Anticipated emotions | ““People probably would be embarrassed bringing in dirty containers”. |
| Storage at home/carrying containers | “Depending on the number of reusable containers that was received each week, the problem would be where to store them—if there was numerous containers the problem would be where to store them until the next weeks online shop arrived”. “I am dubious it would work for large families who have limited space to keep the containers” “If you’re on the go you might not be able to carry containers with you and just want to throw it in the bin instead” |
| Storage in store | “Concerns would be that stores could not cope with the returns in an adequate time, and queues would mount up. Shoppers might give up and discard them”. “Where would the supermarkets find the additional room?” |
| Accessibility/Availability | “If it’s difficult to locate the return point”. “Availability of products, for example if you only had the brand name products who had signed up to this, it reduced options available”. “If only selected stores had the facilities”. |
| Financial cost | “It would probably make things more expensive”. “The cleaning step could add more cost to the shopping”. “It would need to be a suitable cost”. |
| Time to engage with system | “The time taken to scan them in and out” “Making time to return my reusable containers” “If it took time or there were queues for returning containers that would be a barrier to completing this”. |
| Return window | “Having a limited amount of time to return it” “If there was a time limit for returning them that didn’t fit in with your schedule”. “If I needed to store these items in the container and they weren’t empty by the time I had my next delivery” |
| Others not engaging | “It would be difficult if people threw them away instead of returning them”. “People not returning creating demand for more reusable items to be made as those not returned getting disposed and not used for its original purpose”. “I see people failing to return them or losing them. I also see people breaking them perhaps”. |
| Shopping Online | Shopping in Store | Shopping on the Go | Overall | ||||||||
|---|---|---|---|---|---|---|---|---|---|---|---|
| Belief | M | SD | α | M | SD | α | M | SD | α | M | SD |
| Enablers | |||||||||||
| Environmental benefits | 4.61 | 0.57 | 0.72 | 4.46 | 0.78 | 0.82 | 4.49 | 0.62 | 0.55 | 4.52 | 0.59 |
| Informed about how to use system | 4.50 | 0.62 | 0.72 | 4.40 | 0.60 | 0.50 | 4.37 | 0.58 | 0.68 | 4.43 | 0.60 |
| Design of reusable packaging/containers | 4.46 | 0.46 | 0.44 | 4.43 | 0.46 | 0.58 | 4.22 | 0.63 | 0.26 | 4.37 | 1.18 |
| Convenience | 4.40 | 0.84 | 4.19 | 0.99 | 4.20 | 0.96 | 4.26 | 0.93 | |||
| Already sort waste (e.g., for recycling) | 4.37 | 0.84 | 4.21 | 0.79 | 4.14 | 0.92 | 4.24 | 0.85 | |||
| Anticipated emotions | 4.24 | 0.67 | 0.54 | 4.03 | 0.69 | 0.54 | 4.01 | 0.78 | 0.58 | 4.09 | 0.72 |
| Ease of using systems | 4.02 | 0.92 | 0.78 | 3.80 | 0.77 | 0.73 | 3.91 | 0.71 | 0.55 | 3.91 | 1.17 |
| Domestic benefits | 4.04 | 0.64 | 0.46 | 3.90 | 0.56 | 0.09 | 3.75 | 0.56 | 0.09 | 3.9 | 0.60 |
| Central locations for return points | 3.88 | 0.60 | 0.04 | 3.82 | 0.65 | 0.18 | 3.85 | 0.61 | |||
| Incentives to use system | 3.37 | 0.86 | 0.29 | 2.76 | 0.82 | −0.05 | 2.86 | 0.88 | 0.41 | 3.74 | 0.86 |
| Reminders to return | 4.14 | 0.92 | 3.70 | 1.02 | 3.36 | 1.23 | 0.46 | 3.74 | 1.10 | ||
| Automation of process | 4.29 | 0.71 | 3.99 | 0.92 | 0.26 | 4.06 | 0.92 | 0.26 | 3.4 | 1.07 | |
| Barriers | |||||||||||
| Erroneous beliefs about system | 3.33 | 1.16 | 3.58 | 1.09 | 3.58 | 1.10 | 3.50 | 1.18 | |||
| Penalties | 3.66 | 1.17 | 3.61 | 1.15 | 3.21 | 1.25 | 3.50 | 1.20 | |||
| Attitudes towards plastic | 3.36 | 0.71 | 0.30 | 3.42 | 0.74 | 0.45 | 3.58 | 0.70 | 0.43 | 3.45 | 0.72 |
| Others not engaging | 3.20 | 0.75 | 0.65 | 3.38 | 0.65 | 0.58 | 3.50 | 0.71 | 0.59 | 3.36 | 0.71 |
| Concerns over tracking | 2.94 | 1.21 | 0.85 | 3.37 | 1.25 | 0.88 | 3.19 | 1.34 | 0.91 | 3.17 | 1.27 |
| Finite resources being used for digital reuse systems | 3.05 | 1.01 | 2.97 | 0.95 | 3.28 | 1.00 | 3.10 | 0.99 | |||
| Damage | 2.93 | 0.63 | 0.20 | 3.07 | 0.78 | 0.58 | 3.08 | 0.84 | 0.62 | 3.03 | 0.75 |
| Responsibility for containers | 2.90 | 0.77 | 0.16 | 3.05 | 0.84 | 0.56 | 2.97 | 0.88 | 2.97 | 0.83 | |
| Memory demands (e.g., forgetting to bring or return containers) | 2.50 | 1.22 | 2.83 | 1.17 | 2.96 | 1.18 | 2.76 | 1.20 | |||
| Storage at home/carrying containers | 2.72 | 1.34 | 2.71 | 1.23 | 2.69 | 1.30 | 2.71 | 1.29 | |||
| Storage in store | 2.6 | 1.06 | 2.67 | 1.19 | 2.64 | 1.13 | |||||
| Return window | 2.85 | 1.05 | 2.72 | 0.97 | 2.06 | 0.98 | 2.55 | 1.05 | |||
| Time to engage with system | 2.71 | 1.26 | 2.26 | 1.10 | 2.59 | 1.24 | 2.52 | 1.21 | |||
| Do not drive | 2.44 | 1.39 | 2.59 | 1.41 | 2.51 | 1.40 | |||||
| Contamination of product | 2.24 | 0.97 | 2.60 | 1.05 | 2.65 | 1.08 | 2.50 | 1.05 | |||
| Effort involved in using system | 1.94 | 1.07 | 2.42 | 0.87 | 0.49 | 2.30 | 0.86 | 0.37 | 2.42 | 0.87 | |
| Confidence in return | 2.25 | 1.11 | 2.55 | 1.10 | 2.32 | 0.98 | 2.37 | 1.70 | |||
| Cleanliness | 2.10 | 0.78 | 0.68 | 2.35 | 0.78 | 0.68 | 2.32 | 0.88 | 0.72 | 2.25 | 0.82 |
| Accessibility/availability of system and items | 3.57 | 1.11 | 3.32 | 0.49 | 0.45 | 3.21 | 0.80 | 0.59 | 2.21 | 1.11 | |
| Complexity of system | 1.94 | 0.94 | 2.21 | 1.06 | 2.37 | 1.18 | 2.18 | 1.09 | |||
| Unable to clean | 1.89 | 0.96 | 2.15 | 1.13 | 2.41 | 1.04 | 2.15 | 1.06 | |||
| Financial cost | 1.88 | 0.99 | 2.19 | 0.94 | 2.23 | 1.02 | 2.10 | 0.99 | |||
| Hygiene | 1.82 | 0.80 | 0.73 | 2.15 | 0.84 | 0.64 | 2.22 | 0.97 | 0.68 | 2.07 | 0.89 |
| Environmental cost | 1.73 | 0.75 | 1.98 | 0.85 | 1.87 | 0.93 | 1.86 | 0.85 | |||
| Shopping Online | Shopping In-Store | Shopping On-the-Go | ||||
|---|---|---|---|---|---|---|
| Belief | Beta | t-Value | Beta | t-Value | Beta | t-Value |
| Anticipated emotions | 0.36 | 3.89 ** | 0.29 | 2.89 * | ||
| Concerns over tracking | −0.23 | −3.18 * | −0.26 | −3.31 * | ||
| Complexity of system | −0.19 | −2.17 * | −0.21 | −2.19 * | ||
| Domestic benefits | 0.18 | 2.48 * | ||||
| Finite resources being used for digital reuse systems | −0.16 | −2.10 * | ||||
| Reminders to return | 0.27 | 3.06 * | ||||
| Storage in store | −0.20 | −2.69 * | ||||
| Reuse behaviour | 0.27 | 2.68 * | ||||
| Ease of use | 0.23 | 3.80 ** | ||||
| Confidence in return | −0.22 | −2.67 * | ||||
| Responsibility for containers | 0.23 | 3.23 ** | ||||
| R2 | 0.59 | 0.53 | 0.58 | |||
| Adjusted R2 | 0.56 | 0.50 | 0.54 | |||
| Item | Loading | M | SD |
|---|---|---|---|
| Factor 1: Concerns about tracking and practicalities of using the system (α = 0.86, Eigenvalue = 7.82) | 2.64 | 0.77 | |
| Returning containers would be too complex | 0.64 | 2.02 | 1.05 |
| Tracking containers is intrusive | 0.58 | 2.86 | 1.29 |
| My security would be compromised by tracking the container | 0.58 | 2.68 | 1.26 |
| I am concerned that I would be penalised if I damaged or lost the containers | 0.53 | 3.60 | 1.06 |
| I would not trust the delivery driver to correctly scan and return all the containers | 0.62 | 2.35 | 1.06 |
| The materials used to make the digital chips are limited and would be wasted on reuse systems | 0.60 | 2.95 | 1.04 |
| I would not have space to store the containers before returning them | 0.57 | 2.61 | 1.27 |
| It would be too expensive for me to reuse containers | 0.54 | 2.14 | 0.98 |
| It would take too long for the delivery driver to scan the containers | 0.66 | 2.56 | 1.11 |
| Factor 2: Benefits of using the system (α = 0.84, Eigenvalue = 2) | 4.08 | 0.49 | |
| Receiving an incentive (e.g., discounts, a points system) for returning the containers would encourage me to do so | 0.59 | 4.50 | 0.75 |
| Reusing containers would reduce waste at home | 0.55 | 4.42 | 0.76 |
| Reusing containers would make more space in the waste and/or recycling bins | 0.47 | 4.30 | 0.83 |
| I would feel good knowing that I was reusing containers | 0.70 | 4.33 | 0.81 |
| I would feel guilty buying items in plastic packaging if they were not reusable | 0.47 | 3.45 | 1.13 |
| Having a delivery driver collect the reusable containers would be convenient | 0.51 | 4.37 | 0.83 |
| Receiving incentives should be automated | 0.43 | 4.25 | 0.83 |
| Returning the containers to the delivery driver would be easy | 0.44 | 4.26 | 0.86 |
| Returning the containers to the delivery driver would be quick and efficient | 0.41 | 4.00 | 0.92 |
| I would want all my products to come in reusable containers | 0.37 | 3.50 | 1.15 |
| Factor 3: Concerns about cleanliness (α = 0.82, Eigenvalue = 1.42) | 2.13 | 0.87 | |
| Reusable containers would be dirty | −0.65 | 2.26 | 1.03 |
| Reusable containers will have been thoroughly cleaned | 0.47 | 4.17 | 0.86 |
| Reusable containers would not be hygienic | −0.72 | 2.30 | 1.12 |
| What Is the Technology Tracking? | |||||||||||||
|---|---|---|---|---|---|---|---|---|---|---|---|---|---|
| Ambiguous | Specific | ||||||||||||
| Information on How the Technology Works | |||||||||||||
| Provided | Not Provided | Provided | Not Provided | ||||||||||
| Information on the Benefits of the Technology | |||||||||||||
| Belief | For System | For Consumer | Not Provided | For System | For Consumer | Not Provided | For System | For Consumer | Not Provided | For System | For Consumer | Not Provided | Non-Digital System |
| Willingness | 4.36 (0.78) | 4.25 (0.92) | 4.32 (0.87) | 4.56 (0.53) | 4.39 (0.68) | 4.43 (0.67) | 4.24 (0.98) | 4.26 (0.71) | 4.37 (0.73) | 4.24 (0.79) | 4.34 (0.78) | 4.23 (0.89) | 4.42 (0.67) |
| Practicality and tracking aspects | 2.59 (0.71) | 2.69 (0.84) | 2.61 (0.77) | 2.50 (0.83) | 2.56 (0.72) | 2.54 (0.75) | 2.73 (0.71) | 2.88 (0.78) | 2.56 (0.78) | 2.78 (0.84) | 2.57 (0.77) | 2.67 (0.75) | 2.50 (0.66) |
| Benefits | 4.12 (0.37) | 4.04 (0.62) | 4.08 (0.53) | 4.16 (0.39) | 4.03 (0.49) | 4.67 (0.36) | 4.09 (0.57) | 4.03 (0.45 | 4.12 (0.48) | 3.99 (0.54) | 4.05 (0.47) | 4.05 (0.52) | 4.11 (0.54) |
| Concerns about cleanliness | 2.08 (0.94) | 2.02 (0.74) | 2.18 (1.01) | 4.03 (0.49) | 2.19 (0.90) | 2.13 (0.90) | 2.13 (0.91) | 2.16 (0.76) | 2.02 (0.72) | 2.29 (0.76) | 2.13 (1.00) | 2.23 (0.94) | 2.21 (0.85) |
| Independent Variables | df | f Value | p Value | ηp2 |
|---|---|---|---|---|
| Emphasis on what is tracked | 1, 626 | 2.76 | 0.097 | 0.004 |
| Information on how technology works | 1, 626 | 1.11 | 0.292 | 0.002 |
| Benefits | 2, 626 | 0.13 | 0.881 | 0.000 |
| Emphasis*Information | 1, 626 | 1.99 | 0.158 | 0.003 |
| Emphasis*Benefits | 2, 626 | 0.95 | 0.388 | 0.003 |
| Information*Benefits | 2, 626 | 0.47 | 0.628 | 0.001 |
| Emphasis*Information*Benefits | 2, 626 | 0.22 | 0.806 | 0.001 |
| Independent Variables | df | Wilks’ Λ | f Value | p Value |
|---|---|---|---|---|
| Emphasis on what is tracked | 3, 624 | 0.994 | 1.23 | 0.298 |
| Information on how technology works | 3, 624 | 0.993 | 1.97 | 0.251 |
| Benefits | 6, 1248 | 0.993 | 0.70 | 0.654 |
| Emphasis*Information | 3, 624 | 0.998 | 0.50 | 0.681 |
| Emphasis*Benefits | 6, 1248 | 0.994 | 0.62 | 0.711 |
| Information*Benefits | 6, 1248 | 0.990 | 1.08 | 0.372 |
| Emphasis*Information*Benefits | 6, 1248 | 0.996 | 0.46 | 0.842 |
Disclaimer/Publisher’s Note: The statements, opinions and data contained in all publications are solely those of the individual author(s) and contributor(s) and not of MDPI and/or the editor(s). MDPI and/or the editor(s) disclaim responsibility for any injury to people or property resulting from any ideas, methods, instructions or products referred to in the content. |
© 2023 by the authors. Licensee MDPI, Basel, Switzerland. This article is an open access article distributed under the terms and conditions of the Creative Commons Attribution (CC BY) license (https://creativecommons.org/licenses/by/4.0/).
Share and Cite
Matthews, M.; Webb, T.L. Understanding Consumer’s Willingness to Engage with Digital Reuse Systems. Sustainability 2023, 15, 14560. https://doi.org/10.3390/su151914560
Matthews M, Webb TL. Understanding Consumer’s Willingness to Engage with Digital Reuse Systems. Sustainability. 2023; 15(19):14560. https://doi.org/10.3390/su151914560
Chicago/Turabian StyleMatthews, Meghann, and Thomas L. Webb. 2023. "Understanding Consumer’s Willingness to Engage with Digital Reuse Systems" Sustainability 15, no. 19: 14560. https://doi.org/10.3390/su151914560
APA StyleMatthews, M., & Webb, T. L. (2023). Understanding Consumer’s Willingness to Engage with Digital Reuse Systems. Sustainability, 15(19), 14560. https://doi.org/10.3390/su151914560