Article

Analysis of Spatiotemporal Variation and Influencing Factors of PM2.5 in China Based on Multisource Data

1
School of Internet of Things, Wuxi University, Wuxi 214105, China
2
School of Automation, Nanjing University of Information Science and Technology, Nanjing 210044, China
3
School of Atmospheric Science and Remote Sensing, Wuxi University, Wuxi 214105, China
*
Author to whom correspondence should be addressed.
Sustainability 2023, 15(19), 14656; https://doi.org/10.3390/su151914656
Submission received: 29 August 2023 / Revised: 1 October 2023 / Accepted: 2 October 2023 / Published: 9 October 2023

Abstract

:
The urbanization process over the past decades has resulted in increasing attention being paid to atmospheric pollution by researchers, especially changes in PM2.5 concentration. This study attempted to explore the spatiotemporal changes in PM2.5 concentration in China from 2000 to 2021, as well as their interaction patterns and intensities with temperature, precipitation, vegetation coverage, and land use types. This was carried out by analyzing monthly average PM2.5 concentration data and various meteorological and geographical factors. Suggestions have also been made to reduce PM2.5 concentration and improve air quality. The results show that in the past 22 years, the overall concentration of PM2.5 in China has shown a downward trend, with an average annual rate of 1.42 μg/m3 from 2013 to 2021, accompanied by a clear spatial pattern and significant seasonal changes. The high pollution areas are mainly concentrated in the Tarim Basin, Sichuan Basin, North China Plain, and the Middle and Lower Yangtze Valley Plain, where the PM2.5 concentration in autumn and winter is significantly higher than that in spring and summer. In addition, based on the national spatial scale, PM2.5 concentration is negatively correlated with precipitation and vegetation coverage, while it is significantly positively correlated with arable land and impervious surfaces. Strengthening the control of farmland pollution, accelerating urban greening construction, further expanding the scale of forests and grasslands, and enriching vegetation types will help reduce PM2.5 concentration and improve air quality.

1. Introduction

The rapid urbanization and industrialization of China’s urban agglomerations have produced a series of environmental pollution problems, especially frequent air pollution problems in recent years [1]. These have not only affected the sustainable development of the economy and society but also the traffic system and residents’ lives [2]. PM2.5 (particulate matter with a diameter of 2.5 μm or less in the air) is one of the main air pollutants, whose sources can be divided into natural sources and human factors. In recent years, scholars at home and abroad have carried out a vast amount of research on PM2.5, mainly including PM2.5 pollution characteristics, impact on the environmental economy and human health, emission reduction technologies, and air quality testing [3,4,5,6].Existing research has shown that long-term exposure to high concentrations of particulate matter, such as PM2.5 and PM10, may lead to adverse health outcomes and that there are definite positive correlations between the concentration distribution of PM2.5 and the fatality rates of certain diseases [7]. PM2.5 reduces visibility due to light extinction effect, which seriously affects the safety and efficiency of people’s travel, causing great inconvenience to transportation and travel sectors, and affecting socioeconomic development and the quality of activities. At the same time, the implementation of environmental protection measures also requires a large amount of funds, which imposes a certain burden on enterprises and the government. Therefore, it is necessary to take preventive measures against PM2.5. The aim of this paper is to deepen the understanding of air pollution mechanisms by investigating the spatial and temporal distribution characteristics of PM2.5 [8]. Quantifying the influencing factors regarding PM2.5 concentration is conducive to identifying the key influencing factors of the spatial distribution of PM2.5 concentration [9], which will provide a scientific basis for formulating targeted pollution prevention and control policies. In addition, by studying the correlation analysis between PM2.5 and influencing factors, it provides a prerequisite for the establishment of prediction models.

1.1. Research on the Temporal and Spatial Variation Characteristics of PM2.5

PM2.5 pollution usually exhibits regional, cumulative, and compound characteristics on different temporal and spatial scales. Accurately grasping the temporal variation and spatial heterogeneity of PM2.5 plays an important role in the prevention and control of air pollution [3]. Based on different data sources (e.g., experimental data, site data, and remote sensing inversion data, etc.), scholars have used various approaches such as geostatistical analysis, GIS spatial interpolation, exploratory spatiotemporal data analysis, and linear trend methods to explore the temporal variation characteristics and spatial evolution patterns of PM2.5 concentrations [3]. Based on the hourly observation data of PM2.5 and PM10 concentrations at 50 ambient air quality monitoring stations in Jiaozuo City from 2018 to 2020, combined with meteorological data, Li [10] et al. analyzed the temporal and spatial distribution characteristics of PM2.5 and PM10 concentrations in Jiaozuo. The results showed that PM2.5 and PM10 in Jiaozuo demonstrated bimodal variation diurnally, a significant U-shaped variation pattern monthly, and seasonal characteristics of being high in winter, low in summer, and medium in spring and autumn. In addition, the annual mean values of PM2.5 and PM10 concentrations were spatially different, with a high in the southwest and a low in the northeast [10]. Xu [11] et al. used methods such as the pixel dichotomy model, Theil–Sen Median trend analysis, Mann–Kendall test, Pearson correlation analysis, and multiple correlation analysis to explore the spatial concentration and temporal–spatial variation characteristics of PM2.5 in China’s three major economic regions. Yang [12] et al. used the Multi-angle Atmospheric Correction (MAIAC) Aerosol Optical Depth (AOD) product, combined with meteorological and land use data, and constructed a two-stage statistical regression model consisting of Linear Mixed Effects (LME) and Geographically Weighted Regression (GWR) to establish a PM2.5 concentration dataset with a 1 km spatial resolution from 2013 to 2020. The temporal and spatial variation trend in the PM2.5 concentration in the Beijing–Tianjin–Hebei region was analyzed. The results depicted obvious temporal (high in winter and low in summer) and spatial (high in the southern plains and low in the northern mountainous areas) characteristics. In parallel, the area with a high PM2.5 concentration was predicted to be significantly reduced in 2020, with an average annual concentration drop of 54.04% compared with 2013. This provides a scientific basis for the prevention and control of air pollution in Beijing–Tianjin–Hebei and the surrounding areas. Whitty [13] et al. analyzed the data from air quality monitoring networks in Hawai’i to assess the spatial and temporal variations in the sulfur dioxide (SO2) and PM2.5 levels around Kīlauea volcano from 2007 to 2018. The study found that the 2018 lower East Rift Zone (LERZ) eruption of Kīlauea volcano led to a major increase in gas emission rates, resulting in reduced air quality in downwind communities. Liu [14] et al. analyzed long-term observational data of air pollutants and meteorological factors in Germany from 2008 to 2018. The trend of atmospheric pollutants was stable during this period. They also explored prediction methods and analyzed pollutant variations for air quality control in Germany. Therefore, it is particularly important to analyze changes in the long-term series, and to clearly and correctly grasp the complex characteristics of PM2.5 concentration trend development and regional changes in different spatial dimensions.

1.2. Research on the Influencing Factors of PM2.5

The mechanism of the influencing factors of PM2.5 concentration has the characteristics of complexity and interaction [3]. Different studies aimed to determine and quantify the main factors affecting PM2.5. The selection of indicators is mainly divided into two parts, including natural factors such as weather and topography, as well as social factors such as population, transportation, industry, and energy. To quantitatively identify the impact of various factors on PM2.5 concentration, scholars have used different models to conduct in-depth research, involving the Geographically Weighted Regression (GWR) model, the Generalized Additive Model (GAM), a Gradient Boosting Machine (GBM), land use regression, and the chemical transport model. Zhen [15] et al. established a multivariate time series model of PM2.5 concentrations based on daily air quality data and meteorological observation data in Harbin from 2013 to 2018. They used highly correlated air pollutants (i.e., SO2, NO2, PM10, CO, and O3) and meteorological factors (i.e., average temperature, maximum wind speed, cumulative precipitation, sunshine hours, and average air pressure). An optimized Vector Autoregressive (VAR) model called VAR(2) was designed to analyze the impact of the above factors on PM2.5 through generalized impulse response and variance decomposition. The results have shown that the maximum wind speed and precipitation can inhibit PM2.5 in the short term, while the average temperature and sunshine hours can promote PM2.5 in the long term. This provides an important reference for future study on the relationship between meteorological elements and PM2.5. Wu [9] took Sichuan Province as the research area to evaluate and select diverse estimating variables, involving Himawari-8 aerosol optical depth (AOD), ERA5 meteorological reanalysis data, the Digital Elevation Model (DEM), Land Use/Land Cover Change (LUCC), luminous remote sensing data, and the Normalized Difference Vegetation Index (NDVI). An improved Linear Mixed Model combined with a Geographic Intelligent Random Forest (iLME + Geoi-RF) model was proposed to estimate the PM2.5 concentration in Sichuan Province. The monthly average PM2.5 concentration data with 5 km × 5 km grids in Sichuan Province were taken as the spatiotemporal evaluation unit, where the proposed learning model was used to analyze the impact of different influencing factors on the change in PM2.5 concentration. It was concluded that air pressure, temperature, elevation, and a low vegetation index were the key factors affecting the concentration of PM2.5 in Sichuan Province, but the key influencing factors of PM2.5 were not the same in different months. It can be seen that many influencing factors play different roles in terms of PM2.5 dynamics, according to the location and period in which the events occurred. Alternative sources/data can be investigated to explore additional influencing factors of PM2.5.
Throughout the previous studies, some progress has been made in the research on the analysis of the spatiotemporal characteristics of PM2.5 and the correlation analysis of influencing factors, but there are still some limitations and deficiencies:
(1)
From the temporal dimension, the periods selected by most current studies are mostly seasonal or short-lived years, which will lead to large differences in the results obtained in different periods and a lack of long-term series analysis research.
(2)
From the perspective of spatial dimension, most of the current research has focused on small regions and medium-sized cities, while few studies have taken national regions or larger spaces as the research areas. In addition, China’s urbanization leads to rapid changes in land use patterns. Such an inevitable trend makes it necessary to focus on the temporal and spatial impact of land use on PM2.5.
(3)
From the perspective of data sources, most studies have used a single meteorological element for analysis without considering the impact of multiple factors on PM2.5.
Therefore, in order to meet the current national needs for air pollution prevention and control, through spatial analysis, correlation analysis and trend analysis, we analyze the temporal and spatial characteristics of PM2.5 in China over the past 22 years. In addition, we explore the spatial and temporal correlation between precipitation, average temperature, vegetation cover, and land use and PM2.5. Based on the experimental results, we propose targeted pollution prevention and control policies to establish a robust scientific foundation for national air pollution control measures.

2. Data Source and Pre-Processing

2.1. Data

The data used in this study included PM2.5 concentration data, precipitation data, average temperature data, vegetation coverage data, and land use data. The first four were all from the National Tibetan Plateau Data Center (http://data.tpdc.ac.cn/ (accessed on 20 April 2023)), and the detailed information and sources of all data are as follows:

2.1.1. PM2.5 Data

The PM2.5 data comes from China’s high-resolution and high-quality PM2.5 dataset from 2000 to 2021, produced by Wei et al. [16,17] (https://doi.org/10.5281/zenodo.3539349 (accessed on 20 April 2023)). The dataset used artificial intelligence technologies to fill in the spatial missing values of satellite MODIS MAIAC AOD products combined with ground-based observations, atmospheric reanalysis, and emission inventories. This produced 22 years of national seamless ground PM2.5 data. The coefficient of determination R2 of the ten-fold cross-validation of the data was 0.92, and the Root Mean Square Error (RMSE) was 10.76 µg/m3. The spatial resolution of the dataset was 1 km, whilst the time resolution could be set as daily, monthly, and yearly. The concentration unit was μg/m3.

2.1.2. Precipitation and Average Temperature Data

The precipitation data came from the 1 km resolution monthly precipitation dataset in China from 1901 to 2021, produced by Peng [18,19,20,21] (https://doi.org/10.5281/zenodo.3185722 (accessed on 20 April 2023)), whereas the average temperature data came from the 1901–2021 China 1 km resolution monthly average temperature dataset (https://doi.org/10.11888/Meteoro.tpdc.270961 (accessed on 20 April 2023)), also produced by Peng. Both datasets are based on the global 0.5° climate dataset released by the CRU (Climatic Research Unit) [22] and the global high-resolution climate dataset released by WorldClim [23], which were generated by downscaling in China through the Delta spatial downscaling scheme. A total of 496 independent meteorological observation points of the data were used for verification, which proved that the verification results were credible [24]. The spatial resolution of the data was 0.0083333° (approximately 1 km). The precipitation is in units of mm and temperature in °C.

2.1.3. Vegetation Coverage Data

The vegetation coverage data came from the 250 m vegetation coverage dataset in China from 2000 to 2022, by Gao et al. [25]. (https://doi.org/10.11888/Terre.tpdc.300330 (accessed on 20 April 2023)). The dataset adopted a dichotomous model based on the Normalized Difference Vegetation Index (NDVI). Pure vegetation and bare soil pixel values were determined according to the land use type to realize the calculation of vegetation coverage. The NDVI data came from the product of the 250 m dataset (2000–2022). According to our analysis and test, the dataset conformed to the temporal and spatial variation trends. The spatial resolution was 250 m, and the dataset adopted the monthly maximum synthesis.

2.1.4. Land Use Data

The land use data came from the 30 m land use type dataset in China from 1990 to 2021 (https://zenodo.org/record/5816591 (accessed on 15 May 2023)), based on Landsat image samples produced by Jie Yang et al. [26]. The training samples were collected in the dataset using 335,709 Landsat images from Google Earth Engine (GEE). A time metric was constructed and provided to a random forest classifier to obtain the classification results. Finally, a post-processing method was presented combined with spatiotemporal filtering and logical reasoning to improve the spatiotemporal consistency of land use classification. All efforts above resulted in an accuracy of 79.3%. Therefore, this accurately reflects China’s rapid urbanization and the development process of a series of ecological projects, revealing the impact of human activities on land use types under climate change conditions.

2.2. Pre-Processing

To facilitate data analysis and calculation, all raw data were pre-processed. First, all the data whose original format was ‘nc’ were uniformly converted into ‘tif’. ‘GCS_WGS_1984’ was used as the coordinate system, which was then processed by ArcGIS software (10.8). The data were all resampled to a spatial resolution of 0.01° (1 km). The nearest neighbor method was chosen as the resampling method, due to its simplicity and fast processing speed, with no changes made to the original raster values. Applicable discrete data were used in this study, as they not only offered an elevated spatial resolution, facilitating multifaceted analyses, but also enabled comprehensive investigations of correlations from multiple perspectives by virtue of their potential for integration with other data sources, such as satellite remote sensing data and geographic information system (GIS) data. Next, we used the national boundary vector mask to extract the sampled data. Here, it needs to be explained that the national vector was based on the standard map (approval number: GS (2020)4619) downloaded from the standard map service website of the National Bureau of Surveying, Mapping, and Geographic Information.

3. Methods

3.1. Trend Analysis Method

This study used a combination of the Theil–Sen median trend analysis method and the Mann–Kendall test method to analyze the changing trend in the PM2.5 time series data. The Theil–Sen median trend analysis method, also known as Sen slope estimation (or further shortened as the Sen method), is a robust non-parametric statistical trend calculation method. With high computational efficiency, the Sen method is insensitive to measurement errors and outlier data and is suitable for trend analysis of long-term series data [27]. In this paper, the Sen method was used to analyze the trend changes in the 22-year annual average PM2.5 concentration and the monthly average PM2.5 concentration of the same month in the 22 years. For a time series T = (T1, T2, T3, …, Tn), n is the data length, and its calculation formula is as follows:
β = M d i a n T j T i j i , i , j 1 , n , j > i
where i and j are time series; T i , T j   represent the PM2.5 concentration at the time i and j, respectively; and Median() represents the median value. If β > 0, this indicates that the PM2.5 concentration is on the rise; whereas β < 0 indicates that the PM2.5 concentration declines.
The Mann–Kendall test, referred to as the MK test [28], is a non-parametric time series trend test method, which does not require the measured values to obey the normal distribution. It is not affected by missing values and outliers and is very suitable for trend significance testing of long-term time series data. In this paper, based on the Sen analysis, the MK test method was used to test the significance of the changing trend in PM2.5 concentration. As above, for the time series T = (T1, T2, T3, …, Tn), the formula is as follows:
S = i ˙ = 1 n 1 × j = i + 1 n s g n T j T i
where S is the test statistic; sgn() is a symbolic function, and its calculation formula is:
s g n T j T i = 1   T j T i > 0 0   T j T i = 0 1   T j T i < 0
The standardized test statistic Z was used to carry out the trend test, and its calculation is as follows:
Z = S 1 Var ( S )   ( S > 0 )   0   ( S = 0 ) S + 1 Var ( S )   ( S < 0 )
The formula for calculating Var is:
V a r S = n ( n 1 ) ( 2 n + 5 ) 18
The normalized Z is standardized and normally distributed [29]. Regarding the level of significance, the trend is not significant when Z Z 1 α / 2 ; in fact, it is the opposite. Z 1 α / 2 is the corresponding value of the standard normal function distribution table at the confidence level α, which was set to 0.05, and the degree of freedom was 20.

3.2. Correlation Analysis Method

Correlation analysis refers to the quantitative analysis of the correlation between two variables. The strength and direction of the relationship between variables are clarified by calculating the correlation coefficient, whose significance is measured by a significance test. A program written in Python was used to complete relevant statistics and a correlation analysis. Taking China and 34 provincial-level administrative regions as the basic analysis unit, we qualitatively analyzed the effects of air temperature, precipitation, FVC, and land use types on PM2.5 concentrations, according to the size and direction of the correlation coefficient.
The calculation formula for Pearson correlation is as follows:
r x , y = n x y x y [ n x 2 ( x ) 2 ] [ n y 2 ( y ) 2 ]
where rx,y represents the correlation coefficient between x and y, and n is the sample size. For the calculation of the correlation between PM2.5 concentration and air temperature, precipitation, and FVC, x is the PM2.5 concentration value, and y is one of the compared parameters. For the calculation of the correlation between PM2.5 concentration and land use type, x is the average PM2.5 concentration value of each province, and y is the area ratio of each land use type in each province. The range of rx,y is [−1, 1]; where there are three results: (a) (0, 1] indicates a positive correlation; (b) [−1, 0) indicates a negative correlation; (c) 0 means it is irrelevant. The closer the absolute value of the correlation coefficient is to 1/−1, the stronger the positive/negative correlation between two variables [30].

3.3. Definition of Seasons

To comprehensively examine the relevant factors affecting the concentration of PM2.5 and understand the strength of the interaction between various environmental variables and PM2.5, this study investigated the concentration of PM2.5 in relation to air temperature, precipitation, FVC, and land use type data from 2000 to 2021. Each variable was normally distributed. Correlation analysis was conducted to explore the influence of various factors in the continuous time series from 2000 to 2021 on the concentration of PM2.5. Using the meteorological division method [31], the seasons were defined as spring being from March to May, summer being from June to August, autumn being from September to November, and winter being from December to February of the following year.

4. Results

4.1. Spatial–Temporal Variation Analysis of PM2.5 in China

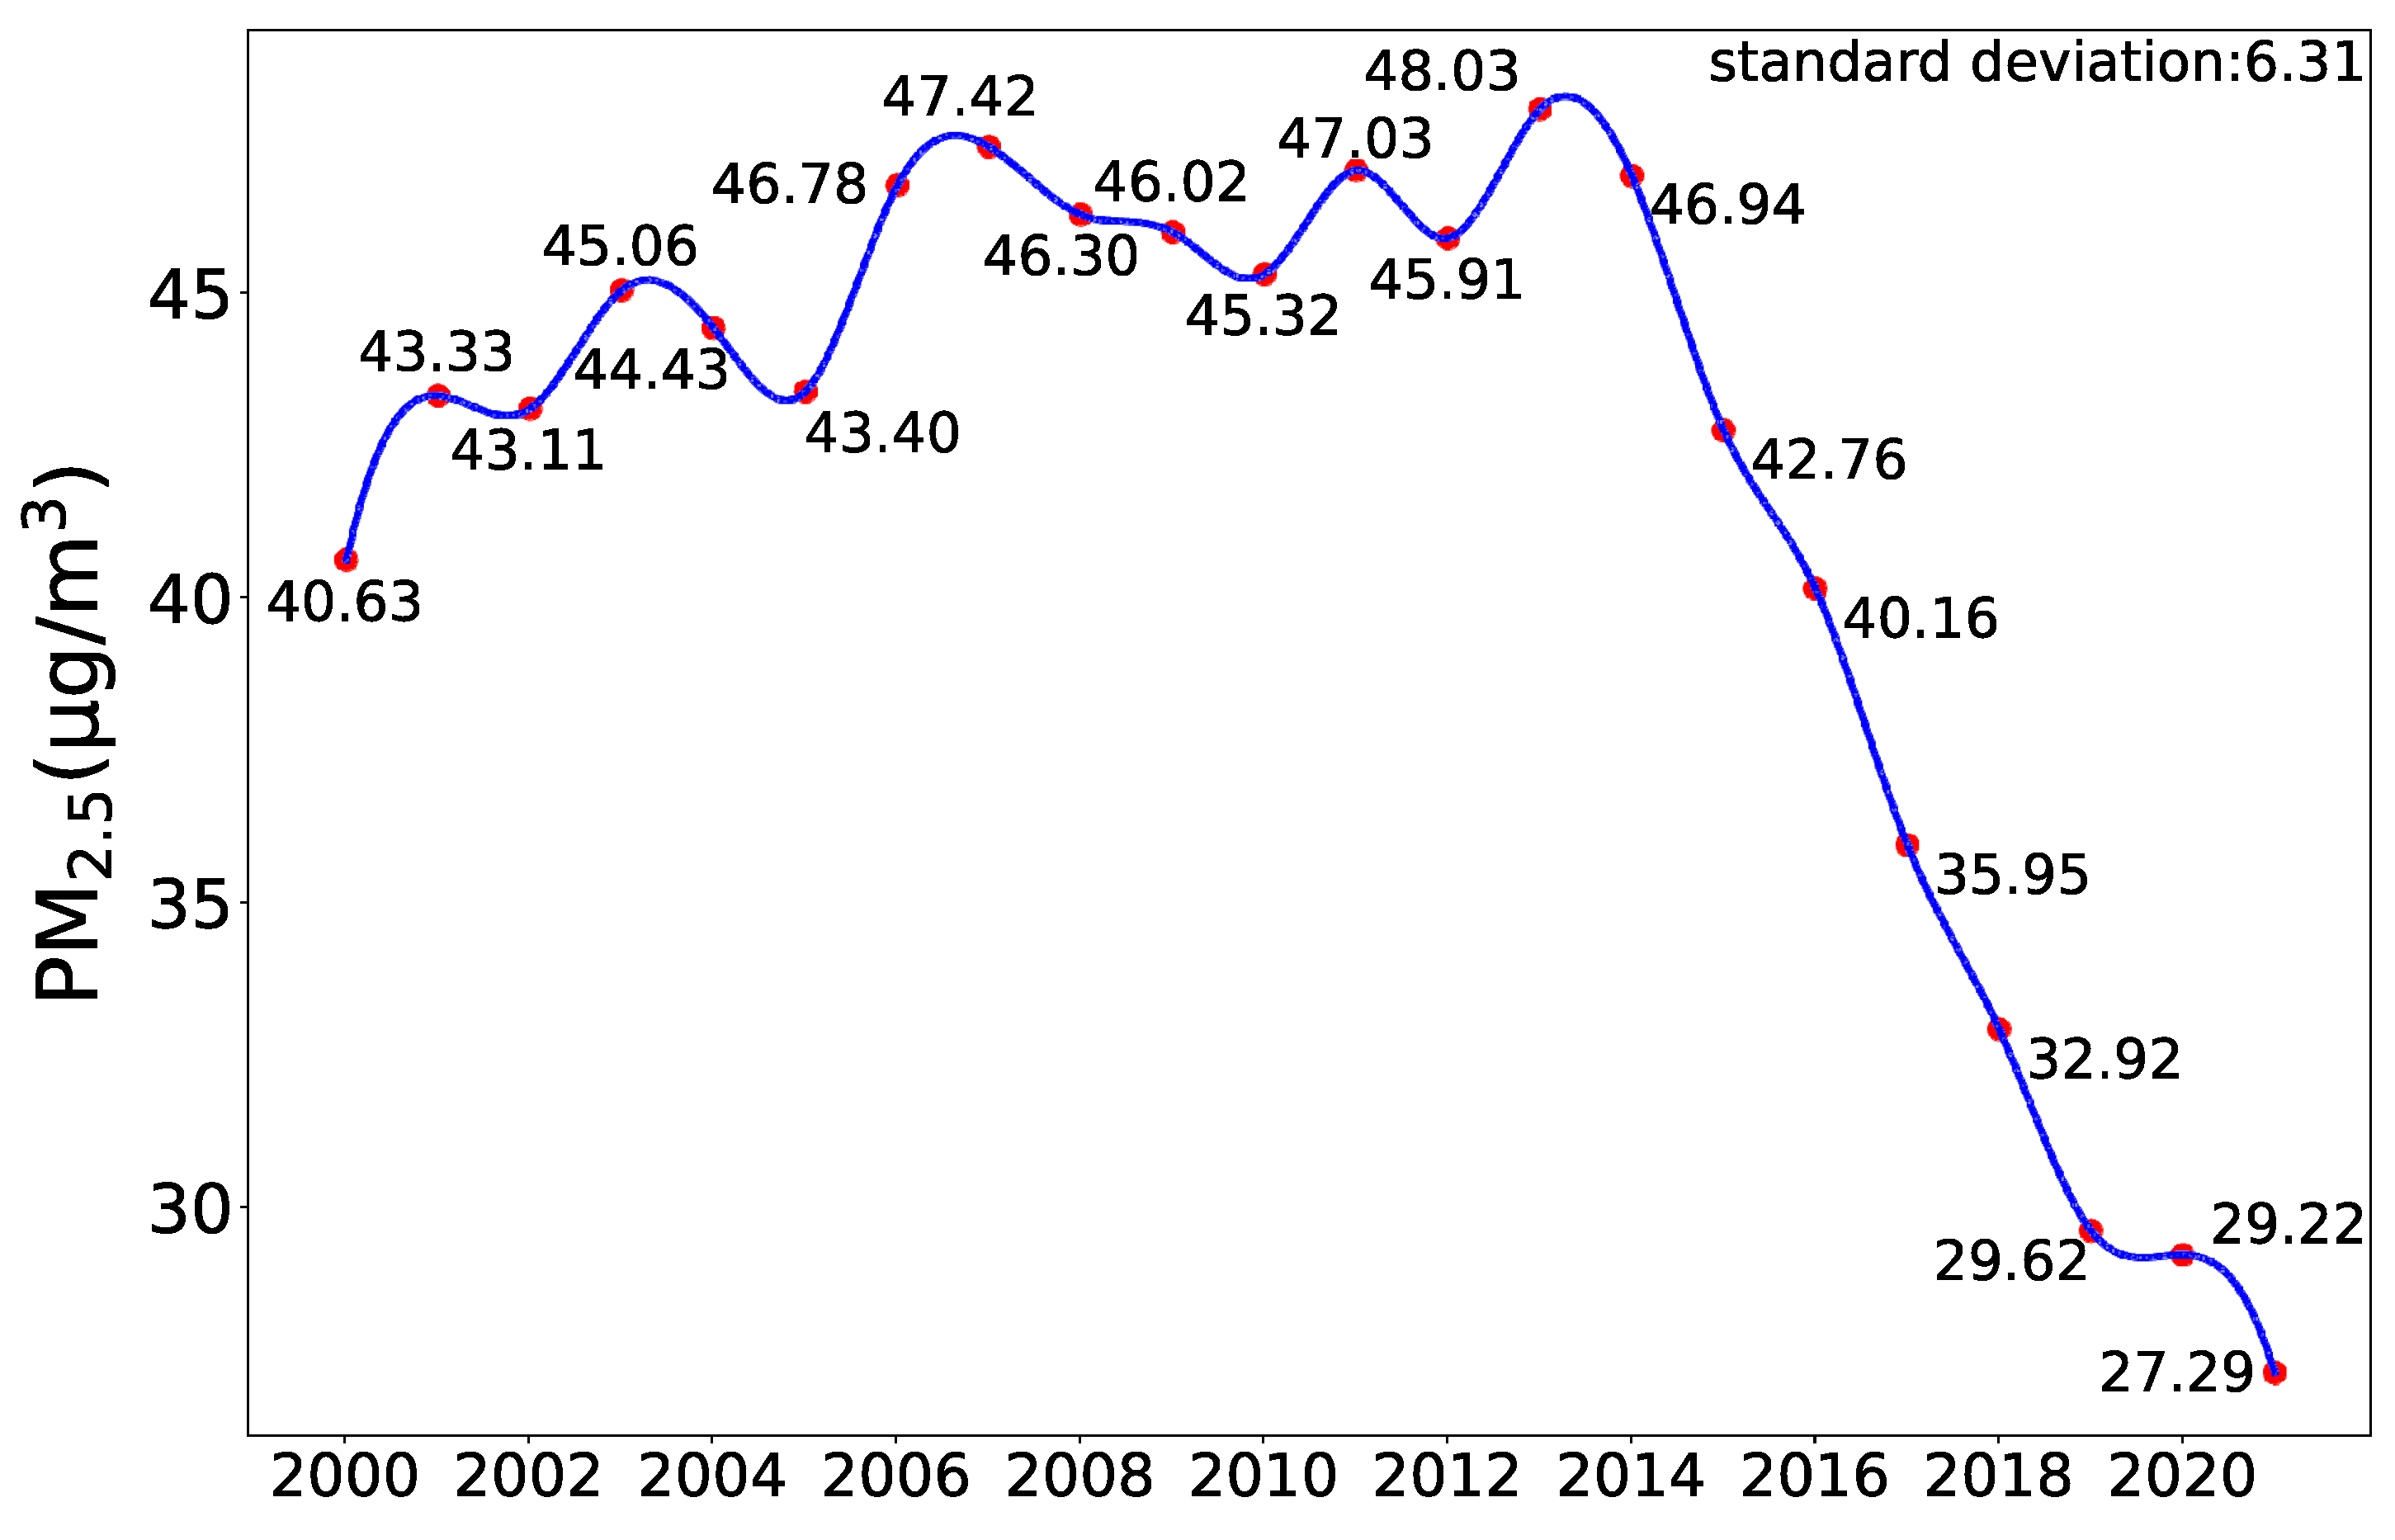
4.1.1. Temporal Variation in PM2.5

The annual average concentration of PM2.5 was estimated in this study, based on PM2.5 data from 2000 to 2021. The interannual variation curve and spatial distribution of the PM2.5 concentration have been drawn, as shown in Figure 1 and Figure 2. It can be seen that the annual average PM2.5 concentration showed a fluctuating increasing trend from 40.63 μg/m3 in 2000 to a peak of 48.03 μg/m3 in 2013, especially in the Tarim Basin, the North China Plain, and the middle and lower reaches of the Yangtze River Plain. The PM2.5 significantly reduced at an average annual rate of 1.42 μg/m3 per year from 2013 to 2021, reaching 27.29 μg/m3 by 2021, which approached China’s national air quality standard limit (2012) (less than 35 μg/m3), and reached this limit in 2019. It is worth noting that from 2019 to 2021, the concentration of PM2.5 in China (except the Tarim Basin) was at a relatively low level.
Specifically, from 2000 to 2003, the annual average concentration of PM2.5 in China showed a fluctuating upward trend, among which, the most obvious increase was 3.4 μg/m3 from 2005 to 2006, and the changing trend in the remaining years was relatively flat. From 2014 to 2021, the annual average concentration of PM2.5 in China showed a significant downward trend, which was most obvious and stable from 2014 to 2019, when it decreased by 2.59 μg/m3. The time node of the significant decrease in the annual average concentration of PM2.5 is consistent with that promulgated by the State Council of China in the “Five-Year Air Pollution Prevention and Control Action Plan” [32]. This effectively proves the effectiveness of the pollution prevention and control action plan. In addition, from 2019 to 2021, in order to curb the spread of the 2019 novel coronavirus (COVID-19) [33], China took the initiative to blockade areas with severe outbreaks, and various local governments also carried out strong control measures to reduce people’s travel and gatherings. The closure or control of shopping malls, factories, and other places also reduced the production of PM2.5 at source, leading to a decrease in the atmospheric PM2.5 concentrations.
To discuss, in detail, the time distribution of PM2.5 within a year, this study calculated the change curve and spatial distribution of PM2.5 concentration over 12 months from 2000 to 2021, as shown in Figure 3 and Figure 4. It can be seen that the areas with high PM2.5 concentrations are still mainly concentrated in the North China Plain, the middle and lower reaches of the Yangtze River Plain, the Sichuan Basin, and the Tarim Basin. The PM2.5 concentrations in each region show obvious seasonality. Specifically, the concentration of PM2.5 in the North China Plain, the middle and lower reaches of the Yangtze River, and the Sichuan Basin decreased from 49.07 μg/m3 in February to the lowest value of 29.74 μg/m3 in August. In contrast, the concentration of PM2.5 showed an upward trend from August to January and peaked at 55.53 μg/m3 in January. That is, the concentration of PM2.5 was the highest in winter and the lowest in summer. In areas with low PM2.5 concentrations, there was relatively little fluctuation in the PM2.5 concentration from February to September and it showed an increasing trend from September to January. Thanks to the coastal location and favorable climate conditions for atmospheric diffusion, the concentration of PM2.5 in the Pearl River Delta and the Greater Bay Area has always been maintained at a relatively low level.
Throughout the Tarim Basin, the inter-annual PM2.5 concentration changes did not show obvious patterns, but from the monthly perspective, the PM2.5 concentration changes in the Tarim Basin showed a strong seasonal pattern. From March to May, PM2.5 concentration increased sharply, which was the most polluted area in China. PM2.5 and particle pollutants only come from local dust and dust in nearby areas. March to May is also the period with the most frequent sandstorm activity in Northwest China [34].

4.1.2. Spatial Variation in PM2.5

The spatial distribution and average value of PM2.5 from 2000 to 2021 are shown in Figure 2. It can be seen from the figure that the spatial distribution of PM2.5 in China presented an obvious spatial aggregation phenomenon, and there were significant differences in the concentration of PM2.5 in different regions. The overall trend was higher in the north than the south, whilst higher in the east compared with the west. The areas with high PM2.5 concentrations were mainly concentrated in the densely populated and industrially populated Sichuan Basin, the North China Plain, the middle and lower reaches of the Yangtze River Plain, and the harsh environment of the Tarim Basin, where precipitation is scarce and the storms are severe. Thanks to lower industrial emissions and climate conditions conducive to atmospheric diffusion, the concentration of PM2.5 in the southern and coastal areas was relatively low. Among them, from 2000 to 2013, the areas with a high PM2.5 concentration were centered among the Sichuan Basin, the North China Plain, and the middle and lower reaches of the Yangtze River Plain, showing a gradual expansion in space. From 2013 to 2021, when the State Council of China promulgated and implemented the “Five-Year Air Pollution Prevention and Control Action Plan”, the areas with high PM2.5 concentrations, with the exception of the Tarim Basin, had shrunk significantly. The reason why the range of areas with a PM2.5 high concentration in the Tarim Basin had not shrunk during this period is that its special desert landform had greatly promoted the accumulation of PM2.5 and other particulate matter [35]. The concentration of PM2.5 in the Sichuan Basin, the North China Plain, and the middle and lower reaches of the Yangtze River had dropped significantly, and the air quality in the Pearl River Delta and the Greater Bay Area continued to improve.
From the monthly perspective, PM2.5 concentrations accumulated rapidly from November to January in the North China Plain, the middle and lower reaches of the Yangtze River Plain, the Northeast Plain, and the Sichuan Basin region, and the high pollution range expanded rapidly. When the weather gradually warmed up, PM2.5 concentrations decreased rapidly in the above areas. The rationale behind this seasonal surge can be attributed in part to coal heating and biomass burning in winter. On the other hand, meteorological conditions in winter are not conducive to the diffusion of atmospheric pollutants. Temperature inversion (TI) in the lower troposphere is meteorologically defined as an atmospheric layer with the air temperature increases with altitude [36]. This meteorological condition can have a significant impact on PM2.5 concentration. During TI events, the vertical mixing of air pollutants becomes limited, resulting in the accumulation of fine particulate matter, such as PM2.5, in the near-surface layer. As a consequence, PM2.5 concentrations tend to rise under the influence of temperature inversions. The unique latitude of the Pearl River Delta and the Greater Bay Area is lower and the climate conditions are favorable for atmospheric dispersion, whereas the heating demand is correspondingly lower, so the PM2.5 concentration remained low, even in the winter [37].

4.1.3. PM2.5 Change Trend Analysis

This study used the Theil–Sen median trend analysis method to analyze the changing trend in PM2.5 from 2000 to 2021, with further analysis of the monthly change trend in PM2.5 from 2000 to 2021. The MK trend test was conducted at the same time. Figure 5a shows the changing trend in PM2.5 in China from 2000 to 2021. It can be seen from the figure that the changing trend in PM2.5 in China had obvious spatial differences. PM2.5 showed a downward trend in most parts of China, and only showed an increasing trend in Xinjiang and some parts of Tibet. According to the statistics, the area in which the PM2.5 concentration showed a downward trend covers 97.9% of the total area in China. Figure 5b shows the significance test of the changing trend in PM2.5 from 2000 to 2021. At the 0.05 confidence level, the area that passed the significance test covers 51.8% of the total area in China. This means that from 2000 to 2021, China’s PM2.5 concentration changed significantly in 51.8% of the land area, but not in the remaining areas. Combining the above results, the comprehensive change trend in PM2.5 in China from 2000 to 2021 was obtained, as shown in Figure 5c, and only a small part of the Taklimakan Desert showed an increasing trend.
The monthly change trend in PM2.5 from 2000 to 2021 is shown in Figure 6. The North China Plain and some areas in the middle and lower reaches of the Yangtze River demonstrated an increasing trend from January to February, and a significant decreasing trend after March. This may mean that the demand for heating in winter continued to grow. However, the Tarim Basin area showed an increasing trend in February, March, and May, which can indicate that the intensity of sandstorm activity in the Tarim Basin area gradually increased. In addition, northeastern China showed a significant upward trend in March and April, which could be attributed to the temperature inversion phenomenon that occurs in spring. Lower ground temperatures and higher temperatures in the atmosphere cause cold air to sink, which does not easily diffuse and dilute PM2.5, leading to higher PM2.5 concentrations. Other regions and periods in China have shown a downward or nearly unchanged trend.

4.2. Correlation Analysis between Various Factors and PM2.5

4.2.1. Correlation Analysis of PM2.5 Concentration and Precipitation

To explore the temporal correlation between PM2.5 and precipitation, we first made a trend analysis of 22 years of national precipitation, as shown in Figure 7. As can be seen in Figure 1 and Figure 7, precipitation and PM2.5 generally show a negative correlation. Specifically, from 2000 to 2015, except for 2004, 2007, 2009 and 2014, the trend of the two is opposite, i.e., PM2.5 decreases when precipitation rises. From 2016 to 2021, the average annual precipitation shows a fluctuating upward trend, and PM2.5 shows a decrease in the same time period. On this basis, we analyzed the correlation relationship between PM2.5 and precipitation specifically in time and space.
In this study, the Pearson correlation analysis was performed on the precipitation and PM2.5 concentration data of the same month in the collected 22 years, as shown in Table 1. In the summer, with the most precipitation in the whole year (accounting for more than 50% of the total annual precipitation), there was a close negative correlation between precipitation and PM2.5 concentration, where the correlation degree was >0.4. In the spring and autumn, there was a general negative correlation, whereas in the winter, with the least precipitation, there was almost no significant correlation. It can be preliminarily concluded that the greater the precipitation, the lower the PM2.5 concentration. Gases and aerosol particles in the atmosphere are removed by atmospheric water (i.e., cloud droplets, fog droplets, rain, snow, etc.) and finally settle to the ground; this is collectively referred to as atmospheric moisture removal [38]. It is inferred that, with a lot of precipitation in summer, the greater the precipitation particles, the greater the collision efficiency with aerosol particles. Rainwater has carried out natural atmospheric moisture removal of PM2.5. Combined with Figure 2, it can be found that this effect is particularly pronounced in areas with abundant precipitation such as the middle and lower reaches of the Yangtze River and the Sichuan Basin. However, the correlation coefficient in spring and autumn also shows that less precipitation has also a small effect on PM2.5. This can be caused by the intensity of precipitation because there is more heavy rainfall in summer and more plum rain in spring and autumn; alternatively, the duration of precipitation could be another reason. Precipitation events of longer duration usually have stronger washing and dilution effects. This means that they can more effectively wash PM2.5 from the atmosphere to the ground, diluting it to lower concentrations. Therefore, it is also not difficult to find that high intensity and prolonged widespread precipitation is most effective in suppressing the growth of PM2.5 concentrations.
The spatial correlation analysis of the 22-year annual average precipitation and PM2.5 concentration data has been carried out, as shown in Figure 8, where Figure 8a is the correlation analysis, and Figure 8b is the significance test. A significant negative correlation between precipitation and PM2.5 concentration can be seen in parts of the northeast coast, the junction of Inner Mongolia and the three northeastern provinces, the southeastern coastal area of Jiangsu Province, the Sichuan–Chongqing–Guizhou region, the junction area of Qinghai, Gansu, and Sichuan provinces, and the southwest of Tibet and Xinjiang. The significance test passed 0.05, and the absolute value of the correlation was greater than 0.4. In parallel, their correlation in southwestern Tibet, eastern Inner Mongolia, and the middle region of Qinghai–Gansu–Sichuan reached below −0.8, forming a close negative correlation. From the perspective of the regional distribution, the annual precipitation in China generally decreases from southeast to northwest. Among the regions with a strong negative correlation, the annual precipitation in Jiangsu Province and the Sichuan–Chongqing–Guizhou region is approximately 1200 mm. In the northeast region and Qinghai–Sichuan–Gansu region, the annual precipitation is approximately 600 mm, while it is below 100 mm or even less in Tibet and Xinjiang. As the annual precipitation decreases in these areas, the negative correlation with PM2.5 concentration is stronger [39].

4.2.2. Correlation Analysis of PM2.5 Concentration and Temperature

As in the previous subsection, we first analyzed the trend of the 22-year national average temperature, as shown in Figure 9. Comparing the annual average trends of temperature and PM2.5 concentration, it is easy to see that the trend relationship between the two is more complex and is not a simple positive or negative correlation. The trend of the temperature itself also shows fluctuations in the magnitude of change, with no specific rise or fall, so analyzing the correlation between temperature and PM2.5 concentration needs to be considered from a number of perspectives.
In this study, the monthly average temperature and average PM2.5 concentration data in China from 2000 to 2021 were collected, and Pearson correlation analysis was performed on the average temperature and average PM2.5 concentration. The correlation results against the months are shown in Table 2. It can be seen that there is a weak correlation between temperature and PM2.5 concentration in general, with a very weak correlation in winter when the temperature is relatively low.
Theoretically, the meteorological conditions in summer are usually accompanied by high temperatures and relatively low atmospheric stability, which promote the air to rise to form convection. The further increased capacity of the diffusion air is conducive to diluting pollutants and keeping them away from the ground, which thereby reduces PM2.5 concentration. However, the results of the experiment in this paper not only show a certain positive correlation, but also pass the significance test at the 0.01 level. The probable reason for this is that the high temperatures and intense sunlight during the summer months promote chemical reactions in the atmosphere, and these conditions contribute to the oxidation of gaseous precursors (e.g., NOx, volatile organic compounds (VOCs), ammonia, and sulfur oxides) that are converted to secondary PM2.5. This means that the relationship between air temperature and PM2.5 concentration is affected by a variety of factors; these include, but are not limited to, geography, meteorology, emission sources, and human activities [40]. Therefore, the accurate analysis of the relationship between air temperature and PM2.5 requires comprehensive consideration of additional factors, and detailed regional research and data analysis.
In the spatial dimension, the correlation analysis and significance test results of the 22-year annual average temperature and PM2.5 concentration are shown in Figure 10.
Figure 10a is the correlation analysis, and Figure 10b is the significance test. In southeast China, North China, Northwest China, and eastern Inner Mongolia, the annual average temperature and PM2.5 concentration have shown a significant negative correlation with an absolute correlation value being greater than 0.4, and the significance test over 0.05. The degree of correlation shows a high-to-low trend from the eastern coast to the inland region. The higher the temperature, the closer the correlation. Especially in the southern region of Guangdong and Fujian, the negative correlation coefficient can reach −0.9. At the same time, however, the correlation in the southwest region also shows a large number of mixed areas; that is, both positive and negative correlations are high in geographically adjacent locations, with no regional regularity. The reason may be that the southwestern region is affected by the topography, so the regional differences are large. For example, the average annual temperature in the eastern part can reach approximately 20 degrees, but the lowest annual average temperature in the western part can be below 0 degrees Celsius. The climate is relatively extreme, so it shows spatial correlation. Rising air temperature will promote air convection and diffusion [40], making PM2.5 easier to dilute and disperse, and the concentration of PM2.5 will decrease accordingly. However, when the temperature rises to a certain level, it may lead to the formation and accumulation of some secondary pollutants, and the concentration of PM2.5 may also rise accordingly.

4.2.3. Correlation Analysis between PM2.5 Concentration and FVC

In this study, the monthly vegetation coverage (Fractional Vegetation Cover, or FVC) and average PM2.5 concentration data from 2000 to 2021 were counted, and Pearson correlation analysis was performed on the FVC and average PM2.5 concentration. The results are shown in Figure 11. The time dimension correlation results are shown in Table 3. Combined with Figure 11a,b, it can be seen that the FVC and the PM2.5 concentration are generally negatively correlated with moderate intensity, but depict a strong seasonality; that is, it shows a very weak negative correlation or even a positive correlation in autumn and winter, and this gradually becomes negative from spring to summer.
This seasonal variation is related to the seasonal growth of vegetation [41]. In autumn and winter, vegetation leaves wither or decrease in number, resulting in a decrease in the vegetation coverage. Therefore, in autumn and winter, the vegetation coverage and PM2.5 concentration may show a very weak negative or positive correlation. On the contrary, from spring to summer, vegetation growth activities increase with denser leaves, so the scavenging of PM2.5 is strengthened. This shows that the absorption of particulate pollution such as PM2.5 by vegetation is closely related to the leaves of vegetation [42].
The correlation analysis and significance test are shown in Figure 12a,b, respectively. It can be seen that a significant negative correlation has been depicted between the vegetation coverage and PM2.5 in most regions of the country, except for the Taklamakan Desert, parts of southeastern Tibet, parts of North China and East China, and parts of northeast Inner Mongolia; that is, the higher the vegetation coverage, the lower the PM2.5 concentration. According to the latest distribution map of China’s vegetation coverage, the correlation generally fails to pass the significance test in the Taklimakan Desert (no vegetation coverage), broad-leaved forest areas, and some cultivated vegetation areas. This is because the influence of vegetation coverage on PM2.5 is complex. On the one hand, the vegetation coverage can reduce the concentration of PM2.5 due to the fact that vegetation, especially leaf surface, can adsorb PM2.5 particles through electrostatic force and chemical actions [43]; on the other hand, it may also increase the concentration of PM2.5 under certain circumstances, e.g., through the sedimentation effect, the concentration of PM2.5 particles may raise since slow wind speed and increased air humidity make it easier for PM2.5 particles to settle. However, different types of vegetation have different effects. Vegetation itself also emits substances such as biological particles and organic compounds. These substances may interact with PM2.5 particles and may increase PM2.5 concentrations. In general, from the perspective of spatial distribution, although the vegetation coverage and PM2.5 show a close negative correlation, there is no significant correlation in areas with low vegetation coverage or complex vegetation types [11].

4.2.4. Correlation Analysis between PM2.5 Concentration and Land Use Type

Land has been the basis of human activities for a long time, and various land use types have already been formed. The intensity of human activities varies considerably across land use types, resulting in spatially heterogeneous land use structures. As a result, the strength and mode of interaction between different land use types and PM2.5 vary [44]. Therefore, this study counted the proportion of the annual average PM2.5 concentration of each province and the area of each land use type in the continuous time series from 2000 to 2021. Forest areas and shrubs were merged into forests, and wetlands, ice, and snow, and water surfaces into water bodies. Pearson correlation analysis was used to study the impact of different land use types on PM2.5 concentration.
In this study, the annual average concentration of PM2.5 in each province and the ratio of each land use type in each province were counted, and the correlation analysis between the PM2.5 concentration and the area of land use types was carried out using Pearson correlation analysis. The results are shown in Table 4, where it can be seen that there is a significant correlation between PM2.5 concentration and certain land use types, which means that different soil use types can promote or inhibit the accumulation of PM2.5. Overall, the PM2.5 concentration in China from 2000 to 2021 was significantly correlated with cultivated land and forests, and had a certain correlation with grassland, impervious surfaces, and water bodies; however, grassland, water bodies, and some impervious surfaces did not pass the significance test.
Specifically, cultivated land and impervious surfaces were significantly positively correlated with PM2.5; cultivated land and PM2.5 were strongly positively correlated from 2002 to 2015 and from 2017 to 2019, with the correlation coefficient being above 0.6, indicating that cultivated land and impervious surfaces play a positive role in promoting the accumulation of PM2.5. The positive impact of cultivated land on PM2.5 is that when the cultivated land lacks crop coverage, the bare soil of the cultivated land is affected by wind and other environmental factors, carrying dust particles suspended in the air to increase the concentration of PM2.5 [45]; on the other hand, the stalks of harvested crops are not properly treated or utilized. The traditional practice is usually to incinerate on-site as potash fertilizer, which produces a lot of smoke, PM2.5 particles, and other particulate matter. In addition, the use of agricultural fertilizers has resulted in large amounts of ammonia emissions, and in humid environments NH3 reacts with NOx and SO2 to form secondary inorganic particulate matter, which directly contributes to high localized PM2.5 concentrations. The experimental data showed varying degrees of positive correlation between impermeable surfaces and PM2.5 concentrations, and this positive correlation was relatively strong from 2003 to 2004 and from 2013 to 2017. This indicates that impervious surfaces are also an important source of PM2.5, and that the modification and utilization of land surfaces by human activities directly increases the accumulation of PM2.5. Transportation activities on impervious surfaces, such as vehicle emissions, are often more likely to accumulate PM2.5 particulate matter on urban roads, especially during traffic congestion or low wind speeds. This can lead to elevated PM2.5 concentrations around impervious surfaces. [46].
Forests and grasslands are negatively correlated with PM2.5 concentrations. Forests and PM2.5 concentrations generally have a moderate negative correlation, indicating that the existence of forests can significantly reduce PM2.5 concentrations, which is embodied in the following two aspects: (a) trees and grasslands in forests can absorb carbon dioxide and other gases in the atmosphere, and adsorb and fix PM2.5 and other particulate matter through the blade surface, thereby reducing PM2.5 and other pollutants; (b) the soil under forest cover is usually rich in organic matter and microorganisms, which has a good retention capacity, and can absorb and fix PM2.5 particles [47]. In addition, the coverage of forests and grasslands greatly reduces the possibility of dust particles suspended in the air to increase the concentration of PM2.5, further reducing the concentration of particulate matter. However, the trees in the forest can form a barrier in the airflow, reduce the transmission of PM2.5 and other particulate matter by wind force, delay the diffusion speed of PM2.5 and other particulate matter, and make it easier to settle to the ground [48].
In order to further verify the applicability of this correlation in various regions of China, we further calculated the correlation between land use types and PM2.5 in the Beijing–Tianjin–Hebei region as an example, as shown in Table 5. It can be seen that the correlation between arable land, forest, and PM2.5 in the Beijing-Tianjin-Hebei region remains highly consistent with Table 4. While grassland, water bodies, and impervious surfaces are generally consistent with Table 4 in terms of correlation, they are generally higher than Table 4 in terms of intensity.
Therefore, the way of interaction between land use types and PM2.5 described above is highly applicable in various regions of China. However, there are differences in the intensity of the interaction due to differences in land use types such as water bodies and grasslands in different regions or the influence of other elements.

5. Discussion

Ambient fine particulate matter air pollution (PM2.5), is affected by various factors comprehensively. Based on the full analysis of the changing trend in PM2.5 concentration over the past 22 years and of various factors affecting the concentration of PM2.5, this study puts forward several recommendations to reduce PM2.5 pollution and improve air quality.
The oscillating increase in the annual average PM2.5 concentration from 2000 to 2013 reflects China’s high-intensity industrial activities during this period. The above shows that while the economy and society are developing, environmental quality can be improved by raising awareness of environmental protection and introducing governance policies.
Precipitation and PM2.5 concentration generally show a negative correlation, which is more significant in the rainy season. Therefore, precipitation can reduce the concentration of PM2.5 to a certain extent, but it may require a large amount of precipitation, e.g., through artificial means of rainfall to reduce the concentration of PM2.5. Short-term, low-intensity precipitation may not achieve the expected effect [49]. In desert areas such as the Tarim Basin, increasing precipitation can suppress the increase in PM2.5 concentration from the source. Rainwater collection systems can be built in cities and other areas, where rainwater collection devices can be set up in wide areas, e.g., buildings, roads, and squares, so rainwater can be used to irrigate urban green spaces or reserves. This can indirectly inhibit the increase in PM2.5 concentration and increase urban precipitation. In addition, strengthening the management of rivers and lakes can effectively reduce PM2.5 concentrations, since it improves the water storage capacity and evaporation of surface water, which can further increase precipitation intensity and frequency [49].
As the main way to scavenge and adsorb PM2.5, vegetation plays an important role in improving air quality. The increase in urban vegetation coverage and the construction of ecological corridors should be encouraged, especially in traffic-intensive areas, industrial areas, and pollution sources. The increasing vegetation coverage can effectively inhibit the spread of PM2.5 to surrounding areas. On the other hand, according to the seasonal changes in the correlation between PM2.5 concentration and vegetation coverage, evergreen plants and plant types with dense foliage may have a better effect on filtering PM2.5 and other pollutants.
Cultivated land is the most important land use type that affects PM2.5. Pollution control should be strengthened by the strict prohibition of straw burning, the promotion of green ecological agriculture, and the rational manipulation of fertilizers and pesticides. The transformation of China’s agriculture from traditional operations to smart ones should be accelerated. Green belts can be built in cultivated areas to increase the degree of fragmentation of cultivated land [50]. With the acceleration of urbanization, the increase in impervious surfaces also contributes significantly to the increase in PM2.5 concentration. The increasing population density, especially concentrated in cities with a relatively low vegetation coverage, as well as the increase in industrial production intensity, will make PM2.5 gradually accumulate, and it will not disperse easily. This is one of the reasons for the high concentration of PM2.5 in the North China Plain, the Middle and Lower Yangtze Valley Plain, and other regions. Therefore, it is necessary to reasonably control the size of the city, implement land consolidation, rationally arrange industrial land, and strictly control industrial emissions.

6. Summary

Based on multisource meteorological elements, land use, and continuous time series data of PM2.5 concentration, this study aimed to explore the spatiotemporal changes in PM2.5 over the past 22 years, as well as the mode and intensity of interaction with various environmental variables. The results show that, with the exception of the Tarim Basin, the concentration of PM2.5 in China has generally shown a downward trend over the past 22 years, especially from 2013 to 2021. It has shown a significant downward trend in 51.8% of the country’s regions, which exclude North China, where the concentration of PM2.5 is relatively high. This downward trend became particularly obvious and stable after 2013, with an average annual decrease of 1.42 μg/m3 and even more than 4 μg/m3 in some years. From the perspective of the annual data, the PM2.5 concentration shows obvious seasonal characteristics; that is, the PM2.5 concentration is higher in autumn and winter than in spring and summer. Specifically, the study found that the average concentration of PM2.5 was highest in winter, followed by spring, autumn and summer. The average PM2.5 mean concentration in autumn and winter is more than 7.53 μg/m3 higher than that in spring and summer.
In addition, factors such as vegetation cover and precipitation inhibited the accumulation of PM2.5. The correlation between these factors and PM2.5 is greater than 0.3 in spring and summer, which indicates such an inhibitory effect was particularly obvious in these two seasons. Vegetations, especially forests, provide a special contribution to the absorption of PM2.5, where the correlation between forests and PM2.5 reached a maximum of more than 0.65. Cultivated land and impermeable surfaces, however, have a significant role in promoting the accumulation of PM2.5. Generally speaking, environmental factors such as land use types have a significant impact on PM2.5. To improve the quality of the environment, in addition to controlling pollution sources such as PM2.5 from the source, we should also increase green areas and rationally develop and utilize the land.
This study only quantitatively evaluated the correlation between each element and PM2.5 concentration separately, while the spatial scale was relatively large. Subsequent research should consider the influence of multiple factors on PM2.5 concentration and take comprehensive measures, so as to further alleviate PM2.5 pollution and improve environmental quality.

Author Contributions

Conceptualization, X.K. and L.Z.; methodology, X.K.; software, X.L. and Z.Z.; validation, X.K., X.L. and L.Z.; formal analysis, Z.Z.; investigation, L.Z.; resources, Y.Z.; data curation, L.Z.; writing—original draft preparation, X.K., Z.Z. and Q.L.; writing—review and editing, X.K., Z.Z., X.L., L.Z. and K.T.C.L.K.S.; visualization, L.Z.; supervision, X.K.; project administration, X.K. and Y.Z.; funding acquisition, X.K. and Y.Z. All authors have read and agreed to the published version of the manuscript.

Funding

This research was funded by the Natural Science Foundation of the Jiangsu Higher Education Institutions of China, grant number 21KJB170006, 23KJB170025, the National Natural Science Foundation of China, grant number 42105143, 42305158, the National Key Research and Development Program of China, grant number 2021YFE0116900, Research Start-up Fund of Wuxi University, grant number 2022r035.

Institutional Review Board Statement

Not applicable.

Informed Consent Statement

Not applicable.

Data Availability Statement

The data supporting the findings of this study are available from the first author (X.K.).

Acknowledgments

We are immensely grateful to the editor and anonymous reviewers for their comments on the manuscript.

Conflicts of Interest

The authors declare no conflict of interest.

References

  1. Wang, B.Y.; Liang, L.W.; Wang, X.J. Spatio-temporal evolution patterns and influencing factors of PM2.5 in Chinese urban agglomerations. J. Acta Geogr. 2019, 74, 2614–2630. [Google Scholar]
  2. Ma, D.; Li, G.; He, F. Exploring PM2.5 enviromental efficiency and its influencing factors in China. Int. J. Environ. Res. Public Health 2021, 18, 12218. [Google Scholar] [CrossRef] [PubMed]
  3. Li, X. Study on the Spatio-Temporal Evolution Pattern and Influencing Factors of PM2.5 in Zhejiang Province. Master’s Thesis, Zhejiang Normal University, Jinhua, China, 2022. [Google Scholar]
  4. Baldelli, A. Evaluation of a low-cost multi-channel monitor for indoor air quality through a novel, low-cost, and reproducible platform. Meas. Sens. 2021, 17, 10059. [Google Scholar] [CrossRef]
  5. Xu, T.; Han, C.D.; Yong, G.; Jeffrey, W.; Rui, W.; Yang, X.; Han, H. Economic impacts from PM2.5 pollution-related health effects in China’s road transport sector: A provincial-level analysis. Environ. Int. 2018, 115, 200–229. [Google Scholar]
  6. Feng, D.; Bolin, Y.; Pan, Y.L. Examining the synergistic effect of CO2 emissions on PM2.5 emissions reduction: Evidence from China. J. Clean. Prod. 2019, 223, 759–771. [Google Scholar]
  7. Cheng, Z.; Jiang, J.; Fajardo, O.; Wang, S.; Hao, J. Characteristics and health impacts of particulate matter pollution in China (2001–2011). Atmos. Environ. 2013, 65, 186–194. [Google Scholar] [CrossRef]
  8. Wang, Y.; Li, W.; Gao, W.; Liu, Z.; Tian, S.; Shen, R.W.; Ji, D.; Wang, S.; Wang, L.; Tang, G.; et al. Trends in particulate matter and its chemical compositions in China from 2013–2017. Sci. China Earth Sci. 2019, 62, 1857–1871. [Google Scholar] [CrossRef]
  9. Wu, Y.H. Estimation of PM2.5 Concentration and Analysis of Influencing Factors Based on Multi-Source Data. Master’s Thesis, Guizhou University, Guizhou, China, 2022. [Google Scholar]
  10. Li, Y.; Liu, Y.H.; Wang, X.Y.; Wang, H.L. Spatial-temporal characteristics of PM2.5 and PM10 and their relationships with meteorological factors in Jiaozuo, Henan. Environ. Eng. 2022, 40, 44–53. [Google Scholar]
  11. Xu, Y.; Li, X.Y.; Huang, W.T.; Guo, Z.D.; Pan, Y.C.; Zhang, Z.W.; Dai, Q.Y. Spatio-temporal Variation in PM2.5 Concentration and Its Relationship with Vegetation Landscape Patterns in Typical Economic Zones in China from 2000 to 2020. Environ. Sci. 2023, 44, 1852–1864. [Google Scholar]
  12. Yang, X.H.; Xiao, P.D.; Bai, H.Z.; Tang, J.Z.; Wang, W.; Guo, F.H.; Liu, J.F. Simulation and Trend Analysis of Spatiotemporal Variation of PM2.5 Concentrations in the Beijing-Tianjing-Hebei Region from 2013 to 2020. Geogr. Geogr. Inf. Sci. 2022, 38, 58–67. [Google Scholar]
  13. Whitty, R.C.W.; Ilyinskaya, E.; Mason, E.; Wieser, P.E.; Liu, E.J.; Schmidt, A.; Roberts, T.; Pfeffer, M.A.; Brooks, B.; Mather, T.A.; et al. Spatial and Temporal Variations in SO2 and PM2. 5 Levels around Kīlauea Volcano, Hawai’i during 2007–2018. Front. Earth Sci. 2020, 8, 36. [Google Scholar] [CrossRef]
  14. Liu, X.; Hadiatullah, H.; Tai, P.; Xu, Y.; Zhang, X.; Schnelle-Kreis, J.; Schloter-Hai, B.; Zimmerman, R. Air pollution in Germany: Spatio-temporal variations and their driving factors based on continuous data from 2008 to 2018. Environ. Pollut. 2021, 276, 116732. [Google Scholar] [CrossRef] [PubMed]
  15. Zhen, Z.; Liu, J.Y.; Niu, Y.Z. Analysis of impact factors of PM2.5 in Harbin based on multivariate time series. J. Henan Norm. Univ. 2022, 50, 98–107. [Google Scholar]
  16. Wei, J.; Li, Z.; Lyapustin, A.; Sun, L.; Peng, Y.; Xue, W.; Su, T.; Cribb, M. Reconstructing 1-km-resolution high-quality PM2.5 data records from 2000 to 2018 in China: Spatiotemporal variations and policy implications. Remote Sens. Environ. 2021, 252, 112–136. [Google Scholar] [CrossRef]
  17. Wei, J.; Li, Z.; Cribb, M.; Huang, W.; Xue, W.; Sun, L.; Guo, J.; Peng, Y.; Li, J.; Lyapustin, A.; et al. Improved 1 km resolution PM2.5 estimates across China using enhanced space-time extremely randomized trees. Atmos. Chem. Phys. 2020, 20, 3273–3289. [Google Scholar] [CrossRef]
  18. Peng, S.Z.; Ding, Y.X.; Wen, Z.M.; Chen, Y.M.; Cao, Y.; Ren, J.Y. Spatiotemporal change and trend analysis of potential evapotranspiration over the Loess Plateau of China during 2011–2100. Agric. For. Meteorol. 2017, 233, 183–194. [Google Scholar] [CrossRef]
  19. Ding, Y.X.; Peng, S.Z. Spatiotemporal trends and attribution of drought across China from 1901–2100. Sustainability 2020, 12, 477. [Google Scholar] [CrossRef]
  20. Peng, S.Z.; Ding, Y.X.; Liu, W.Z.; Li, Z. 1 km monthly temperature and precipitation dataset for China from 1901 to 2017. Earth Syst. Sci. Data 2019, 11, 1931–1946. [Google Scholar] [CrossRef]
  21. Peng, S.; Gang, C.; Cao, Y.; Chen, Y. Assessment of climate change trends over the loess plateau in china from 1901 to 2100. Int. J. Climatol. 2017, 38, 2250–2264. [Google Scholar] [CrossRef]
  22. Harris, I.; Osborn, T.J.; Jones, P.; Lister, D. Version 4 of the CRU TS monthly high-resolution gridded multivariate climate dataset. Sci. Data 2020, 7, 109. [Google Scholar] [CrossRef]
  23. Fick, S.E.; Hijmans, R.J. WorldClim 2: New 1-km spatial resolution climate surfaces for global land areas. Int. J. Climatol. 2017, 37, 4302–4315. [Google Scholar] [CrossRef]
  24. Zhang, Y. Study on the Characteristic Changes of Precipitation Events in the Dianchi Lake Basin and Its Influence on the Surface Water Temperature of Dianchi Lake. Master’s Thesis, Yunnan Normal University, Kunming, China, 2021. [Google Scholar]
  25. Gao, J.; Shi, Y.; Zhang, H.; Chen, X.; Zhang, W.; Shen, W.; Xiao, T.; Zhang, Y. China Regional 250m Fractional Vegetation Cover Data Set (2000–2022). National Tibetan Plateau Data Center. 2022. Available online: https://cstr.cn/18406.11.Terre.tpdc.300328 (accessed on 28 August 2023).
  26. Jie, Y.; Xin, H. The 30 m annual land cover datasets and its dynamics in China from 1990 to 2021. Earth Syst. Sci. Data 2022, 13, 3907–3925. [Google Scholar]
  27. Cheng, C.W. Vegetation Change and Its Influencing Factors in the Yellow River Basin from 1982 to 2015. Master’s Thesis, Chang’an University, Chang’an, China, 2020. [Google Scholar]
  28. Hamed, K.H.; Rao, A.R. A modified Mann-Kendall trend test for autocorrelated data. J. Hydrol. 1998, 204, 182–196. [Google Scholar] [CrossRef]
  29. Chen, Y.L.; Xie, Y.; Zhang, H. Temporal and Spatial Variations of Extreme Climate Events in Karst Areas of Guangxi from 1961 to 2019. J. Guangxi For. Sci. 2022, 51, 859–865. [Google Scholar]
  30. Liu, Z.Y.; Liu, H.L. Analysis on the Characteristics of Pollution and Correlation of Influencing Factors of PM2.5 in Hengyang, China. Hunan J. Ecol. Sci. 2021, 8, 69–75. [Google Scholar]
  31. Duan, Q.C.; Huang, Y.; Wang, J.; Zhou, C.X. Study on Spatiotemporal Distribution of Drought in Yunnan Province. In Proceedings of the Ninth Third Council of the Yunnan Water Conservancy Society and the 2013 Academic Exchange Meeting, Kunming, China, 10 December 2013. [Google Scholar]
  32. Cheng, T. Research on Performance Evaluation and Optimization Strategy of Air Pollution Prevention and Control Policy in Hubei Province. Ph.D. Thesis, Huazhong University of Science and Technology, Wuhan, China, 2021. [Google Scholar]
  33. Zhang, Y.; Wu, W.; Li, Y.; Li, Y. An investigation of PM2.5 concentration changes in Mid-Eastern China before and after COVID-19 outbreak. Environ. Int. 2023, 175, 107941. [Google Scholar] [CrossRef]
  34. Qin, J.H.; Yang, X.J.; Ma, L.; Wang, Y.C.; Fu, Z.; Zhu, J.X.; Lu, Z.Q. Characteristics and causes of regional sandstorms in Northwest of China from 2000 to 2020. Chin. Desert 2022, 42, 53–64. [Google Scholar]
  35. Li, T.; Lv, A.; Zhang, W.; Liu, Y. Spatiotemporal Characteristics of Watershed Warming and Wetting: The Response to Atmospheric Circulation in Arid Areas of Northwest China. Atmosphere 2023, 14, 151. [Google Scholar] [CrossRef]
  36. Shao, M.; Xu, X.; Lu, Y.; Dai, Q. Spatio-temporally differentiated impacts of temperature inversion on surface PM2.5 in eastern China. Sci. Total Environ. 2023, 855, 158785. [Google Scholar] [CrossRef]
  37. Liu, W.K.; Qin, W.T.; Miao, F. Investigating the characteristics and source analyses of PM2.5 seasonal variations in Chengdu, Southwest China. Chemosphere 2020, 243, 125–267. [Google Scholar]
  38. Luan, T.; Guo, X.L.; Zhang, T.H.; Guo, L.J. The Scavenging Process and Physical Removing Mechanism of Pollutant Aerosols by Different Precipitation Intensities. J. Appl. Meteorol. 2019, 30, 279–291. [Google Scholar]
  39. Ren, X.J.; Fang, J.B.; Yang, X.Q. Characteristics of intra-seasonal oscillation of summer precipitation in eastern China and its related low frequency atmospheric circulation. Weather Sci. 2020, 40, 686–696. [Google Scholar]
  40. Dai, F.; Chen, M.; Yang, B. Spatiotemporal variations of PM2.5 concentration at the neighborhood level in five Chinese megacities. Atmos. Pollut. Res. 2020, 11, 190–202. [Google Scholar] [CrossRef]
  41. Xiao, Y.J.; Li, B.S.; Song, W.D.; Cheng, Y.X.; Huang, J.F. The impact of concentration change of PM2.5 on air temperature in China during 1998–2016. J. Meteorol. Environ. 2022, 38, 85–92. [Google Scholar]
  42. Jin, J.; Liu, S.; Wang, L.; Wu, S.; Zhao, W. Fractional Vegetation Cover and Spatiotemporal Variations of PM2.5 Concentrations in the Beijing-Tianjin-Hebei Region of China. Atmosphere 2022, 13, 1850. [Google Scholar] [CrossRef]
  43. Fan, S.; Li, X.; Dong, L. Field assessment of the effects of land-cover type and pattern on PM10 and PM2.5 concentrations in a microscale environment. Environ. Sci. Pollut. Res. 2019, 26, 2314–2327. [Google Scholar] [CrossRef]
  44. Zhang, X.L.; Feng, X.; Wang, J.X. Study on Spatio-temporal Didtribution and Land Use of PM2.5 in Southest Yunnan. Jiangxi Agric. J. 2022, 34, 156–161. [Google Scholar]
  45. Ming, A.Y.; Hu, X.; Li, X.J.; Xiang, X.C. Temporal and spatial distribution characteristics and the correlation with land use of PM2.5 in Jinan City. Mine Surv. 2020, 48, 6–11. [Google Scholar]
  46. Zhao, W.F.; Yu, Z.J.; Wang, R.H.; Gao, Q.; Peng, Q.; Yang, P. Spatial and Temporal Characteristics of PM2.5 and Its Response to Land Use Change in Shijiazhuang. J. Ecol. Environ. 2020, 29, 2404–2413. [Google Scholar]
  47. Zhai, C.; Bao, G.; Zhang, D.; Sha, Y. Urban Forest Locations and Patch Characteristics Regulate PM2.5 Mitigation Capacity. Forests 2022, 13, 1408. [Google Scholar] [CrossRef]
  48. Ding, J.; Liang, C. Analysis of air PM2.5 pollution and research on environmental treatment. Energy Environ. Prot. 2023, 45, 105–111. [Google Scholar]
  49. Wu, G.F.; Wang, L.L.; Dong, J.; Shen, N.C.; Jiang, J.F.; Zhao, W.J. Effects of Precipitation on the Removal of PM2.5 and PM10 in Beijing Urban Area. J. China Environ. Monit. 2021, 37, 83–92. [Google Scholar]
  50. Zhou, L.X.; Wu, T.; Jiang, G.J.; Zhang, J.Z.; Pu, L.J.; Xu, F.; Xie, X.F. Spatial Heterogeneity of PM2.5 Concentration in Response to Land Use/Cover Conversion in the Yangtze River Delta Region. Environ. Sci. 2022, 43, 1201–1211. [Google Scholar]
Figure 1. The average concentration of PM2.5 in China from 2000 to 2021.
Sustainability 15 14656 g001
Figure 2. Spatial distribution of mean PM2.5 from 2000 to 2021.
Sustainability 15 14656 g002
Figure 3. The average concentration of PM2.5 from January to December in China from 2000 to 2021.
Sustainability 15 14656 g003
Figure 4. Distribution map of average PM2.5 concentration from January to December in 2000–2021.
Sustainability 15 14656 g004
Figure 5. (a) Change trend in PM2.5 in China from 2000 to 2021; (b) Significance of PM2.5 change trend from 2000 to 2021; (c) Comprehensive change trend in PM2.5 in China from 2000 to 2021.
Sustainability 15 14656 g005
Figure 6. Monthly trend in PM2.5 in China from 2000 to 2021.
Sustainability 15 14656 g006
Figure 7. Average precipitation curve of China from 2000 to 2021.
Sustainability 15 14656 g007
Figure 8. Analysis of the spatial correlation between precipitation and PM2.5 from 2000 to 2021: (a) the spatial correlation between precipitation and PM2.5 concentration; (b) the significance test.
Sustainability 15 14656 g008
Figure 9. Average temperature curve of China from 2000 to 2021.
Sustainability 15 14656 g009
Figure 10. Spatial correlation analysis of average temperature and PM2.5 from 2000 to 2021: (a) the spatial correlation between average temperature and PM2.5 concentration; (b) the significance test.
Sustainability 15 14656 g010
Figure 11. (a) Correlation curve between PM2.5 concentration and FVC; (b) monthly change curve of FVC.
Sustainability 15 14656 g011
Figure 12. Spatial correlation analysis of FVC and PM2.5 from 2000 to 2021: (a) the spatial correlation between FVC and PM2.5 concentration; (b) the significance test.
Sustainability 15 14656 g012
Table 1. Correlation between PM2.5 and rain.
MonthCorrelationMonthCorrelation
January0.121 **July−0.418 **
February0.065 **August−0.510 **
March−0.208 **September−0.333 **
April−0.194 **October−0.311 **
May−0.248 **November0.088 **
June−0.431 **December0.099 **
Note: **: Significant correlation at 0.01 level.
Table 2. Correlation between PM2.5 and temperature.
MonthCorrelationMonthCorrelation
January0.317 **July0.327 **
February0.348 **August0.351 **
March0.428 **September0.362 **
April0.339 **October0.334 **
May0.326 **November0.174 **
June0.351 **December0.233 **
Note: **: Significant correlation at 0.01 level.
Table 3. Correlation between PM2.5 and FVC.
MonthCorrelationMonthCorrelation
January0.020 **July−0.359 **
February0.005 **August−0.353 **
March−0.112 **September−0.319 **
April−0.254 **October−0.247 **
May−0.292 **November−0.183 **
June−0.358 **December−0.035 **
Note: **: Significant correlation at 0.01 level.
Table 4. Correlation between PM2.5 and land use type.
Land
Use Types
CroplandForestGrasslandWater BodiesImpervious Surfaces
Years
20000.566 **−0.659 **0.0510.0290.336 *
20010.562 **−0.623 **−0.0020.0580.337 *
20020.625 **−0.638 **−0.0340.1630.391 *
20030.675 **−0.547 **−0.1500.1790.459 **
20040.670 **−0.480 **−0.2400.2770.416 *
20050.675 **−0.466 **−0.2030.2070.362 *
20060.657 **−0.511 **−0.1590.1820.386 *
20070.676 **−0.462 *−0.2250.1970.399 *
20080.707 **−0.496 **−0.2210.2240.379 *
20090.721 **−0.516 **−0.1980.1920.391 *
20100.706 **−0.523 **−0.1950.1730.388 *
20110.707 **−0.489 *−0.1970.1490.382 *
20120.670 **−0.512 **−0.1640.1220.377 *
20130.728 **−0.473 **−0.2370.1650.441 *
20140.681 **−0.466 **−0.2180.1190.419 *
20150.631 **−0.603 **−0.0920.1740.467 **
20160.571 **−0.580 **−0.0840.1170.401 *
20170.662 **−0.510 **−0.1750.1320.430 *
20180.608 **−0.549 **−0.1010.1150.393 *
20190.714 **−0.465 **−0.2720.1220.383 *
20200.594 **−0.530 **−0.1520.0410.278
20210.598 **−0.487 **−0.1560.0850.182
Note: **: Significant correlation at 0.01 level; *: Significant correlation at 0.05 level.
Table 5. Correlation between PM2.5 and land use type in the Beijing–Tianjin–Hebei region.
Land
Use Types
CroplandForestGrasslandWater BodiesImpervious Surfaces
Years
20000.782−0.724−0.7140.9910.953
20010.730−0.674−0.7640.9860.912
20020.827−0.787−0.6510.9900.912
20030.727−0.5170.4520.9830.960
20040.766−0.753−0.6960.9940.917
20050.774−0.769−0.6820.9960.905
20060.759−0.755−0.7010.9940.913
20070.721−0.724−0.7380.9880.932
20080.730−0.738−0.7260.9900.924
20090.774−0.787−0.6730.9930.904
20100.703−0.724−0.740.9870.942
20110.724−0.753−0.7090.9930.930
20120.785−0.813−0.6380.9920.895
20130.840−0.881−0.5240.9950.844
20140.716−0.773−0.6750.9940.935
20150.683−0.751−0.7010.9910.951
20160.714−0.785−0.6700.9920.938
20170.811−0.875−0.5420.9940.871
20180.833−0.902−0.4960.9840.844
20190.895−0.954−0.3690.9480.769
20200.910−0.965−0.3300.9390.761
20210.950−0.985−0.2310.9040.693
Disclaimer/Publisher’s Note: The statements, opinions and data contained in all publications are solely those of the individual author(s) and contributor(s) and not of MDPI and/or the editor(s). MDPI and/or the editor(s) disclaim responsibility for any injury to people or property resulting from any ideas, methods, instructions or products referred to in the content.

