Article

Study on the Characteristics of Coal Ultrasonic Response during Loading and Its Influence Mechanism

1
College of Safety Science and Engineering, Xi’an University of Science and Technology, Xi’an 710054, China
2
Xin’an Coal Mine, Henan Dayou Energy Co., Ltd., Luoyang 471842, China
*
Author to whom correspondence should be addressed.
Sustainability 2023, 15(2), 1093; https://doi.org/10.3390/su15021093
Submission received: 22 November 2022 / Revised: 30 December 2022 / Accepted: 4 January 2023 / Published: 6 January 2023
(This article belongs to the Collection Mine Hazards Identification, Prevention and Control)

Abstract

:
The prediction and prevention· of mine disasters are crucial to identifying the stress and strain state of coal using ultrasonic response characteristics. In this study, ultrasonic testing experiments of primary structure coal samples under uniaxial loading were conducted using a low-frequency rock physics measuring device. Based on the experimental results, the study focused on analyzing the relationship of the stress–strain state of coal samples with the ultrasonic velocity and quality factor of coal samples during stress loading, and exploring the influence mechanism of ultrasonic propagation in coal during stress loading. The results demonstrated that the stress-loading process of coal samples falls into the elastic deformation stage and the plastic deformation stage. In the elastic deformation stage, the ultrasonic velocity and the quality factor of the coal sample increased with the increase in the coal axial strain. In the plastic deformation stage, the ultrasonic velocity and quality factor of coal samples decreased as the axial strain of coal samples increased. Coal porosity was the fundamental factor affecting the coal wave velocity variation and the coal quality factor variation. In the elastic deformation stage, increased coal axial stress was accompanied by decreased coal porosity, contributing to the increase in coal wave velocity and coal quality factor. In the plastic deformation stage, the increase in the coal axial strain increased coal porosity and thus curtailed the wave velocity and quality factor of coal. Significant differences were observed in ultrasonic response characteristics of coal under various stress and strain states. The research results can lay a theoretical foundation for the safe and efficient development of coal resources and the prevention and control of mine disasters.

Graphical Abstract

1. Introduction

Coal stress and its change are one of the main causes of accidents such as rib spalling, roof fall, rock burst, and coal and gas outbursts. Obtaining the stress–strain state and its variation law of coal can greatly help to reduce various mine disasters in the process of coal mining and realize safe and efficient coal mining.
The ultrasonic detection method mainly focuses on the exploration of geophysical properties. This method mainly emits ultrasonic waves into a coal medium and uses the parameters such as wave velocity, amplitude, and waveform collected after the ultrasonic wave passes through the medium to reversely infer the physical properties of the coal medium [1]. Much research has been done on the relationship between ultrasonic waves and physical properties of coal. Mahmood Karimaei et al. [2] established an exponential relationship between compressive strength and ultrasonic pulse velocity. The research results of Wang Bo et al. [3] show that the ultrasonic velocity is negatively and linearly related to the gas pressure. Kim Wonchang [4] obtained the correlation coefficient between ultrasonic pulse velocity and residual elastic modulus through an ultrasonic pulse experiment. Marta Krzesin’ska [5] applied the ultrasonic velocity measurement method to their study and found that the log (density/velocity) value of bituminous coals is closely related to elastic properties. The above research results provide theoretical support for obtaining the physical properties of coal and play an active role in ensuring coal mining. However, with the increase of coal mining depth, the influence of stress on the physical characteristics of coal is more and more significant, and the influence on coal mining is more and more serious.
Under stress loading, the stress and its changes have a significant effect on the physical properties exhibited by coal and rock mass, affecting the ultrasonic propagation law of the coal. Therefore, investigating the ultrasonic response characteristics of coal can help to identify the coal stress state [6,7], laying a foundation for the prevention and control of mine disasters.
Researchers have conducted many studies to explore the correlation between ultrasonic response characteristics and coal stress [8]. In 1988, Shea and Hanson [9] studied the structural failure law of loaded coal samples in different stages through the test of elastic wave velocity of coal samples. Through a uniaxial loading test, Tiedemann et al. [10], Zhai Xiaojie [11], and Zhao Mingjie et al. [12] revealed that the coal elastic modulus, the density of coal samples, and the compressive strength were obviously and linearly related to their longitudinal wave velocity (LWV) and transverse wave velocity (TWV). They believed that the closing of micro-cracks was the major factor that impacted the axial acoustic characteristics of rocks. Guo Deyong [13], Zhou Feng [14], and Tong Jiqiang et al. [15] suggested that increasing the confining pressure boosted coals’ LWV and TWV through ultrasonic detection experiments. Yan Lihong [16] and Wu Jiwen [17] analyzed the relevance of wave velocity to mechanical parameters under tensile conditions through experiments, revealing a good power function correlation between the wave velocity and the tensile strength. Li Qiong et al. [18] paid attention to the impact of pressure on LWV and TWV through experiments, demonstrating that coal samples’ LWV and TWV increased with the increase in pressure, and there was a quadratic correlation between them. During loading, rock or coal samples’ internal strain exhibited relaxation properties, and the ultrasonic velocity variation could indicate the rock stress relaxation [19]. Engelder and Plumb [20] investigated the changing law of ultrasonic wave velocity under uniaxial loading and performed wave tests for describing the wave velocity–stress relationship. Nur [21] researched the response characteristics presented by ultrasonic wave velocity to the loading stress level. Zheng Guiping et al. [22] confirmed a correspondence relationship of the wave velocity with rock damage variable under uniaxial compression. Liu Xiaofei [23] investigated the laws by which ultrasonic signals propagated through a coal material under different loading conditions, as well as analyzed the changes in ultrasonic parameters such as amplitude, dominant frequency, and velocity. Chen Zhuo [24] explored the response characteristics of coal stress–strain and ultrasonic waves under different confining pressure conditions through triaxial loading of the coal in the laboratory, discovering that the variations of LWV can more accurately reflect the change characteristics of coal pore fissure under different confining pressure conditions compared to TWV.
In conclusion, many studies have focused on the relevance of ultrasonic velocity to the stress of coal, while few paid attention to the relationship between the coals’ stress–strain state and their ultrasonic response characteristics during the stress-loading process. Additionally, most of the coal ultrasonic experimental studies only consider the characteristics of acoustic kinematics and only use the acoustic velocity to reflect the coal properties while ignoring the characteristics of its dynamics. Moreover, there are few studies on acoustic attenuation under different loading stress conditions. The stress of underground coal is in different stress and strain states, and the mine disaster is closely associated with the coal stress and strain state. It is particularly critical to obtain the stress and strain state of coal as well as its change trend for predicting and preventing mine disasters. Therefore, the ultrasonic response characteristic experiment under uniaxial loading was performed with the primary structure coal as the research object to obtain the ultrasonic response characteristic law of coal under different stress states. Besides, the ultrasonic velocity variation law and energy attenuation law of coal under uniaxial loading were analyzed considering the experimental results. The study demonstrates the association between ultrasonic kinematics (LWV and TWV), dynamic characteristics (attenuation), and stress and strain under the consideration of the coal anisotropy and lays a theoretical foundation for back calculating the stress–strain state and its changes in coal.

2. Materials and Methods

2.1. Ultrasonic Propagation Theory of Coal during Stress Loading

The physical characteristics exhibited by coal determined the propagation law of ultrasonic waves in coals. The stress and loading process of coal can change their physical properties, thereby affecting the above mentioned propagation. Therefore, the change in the ultrasonic propagation law is the result of the response to the change in the physical properties of coal.
Close et al. believed that coal is a dual structural medium constituted of matrix pores and fractures [25]. Pores in coal include micropores, small pores, mesopores, and macropores, according to their pore size [26]. Following its genesis, the fractures in coal include endogenous, exogenous, and inherited fractures. Generally, the wave velocity and its attenuation characteristics of coal exhibit a close association with the development degree of coal pore fissures. That is to say, the more developed the pores and fissures of coal, the lower the coal wave velocity, and the greater the attenuation coefficient.
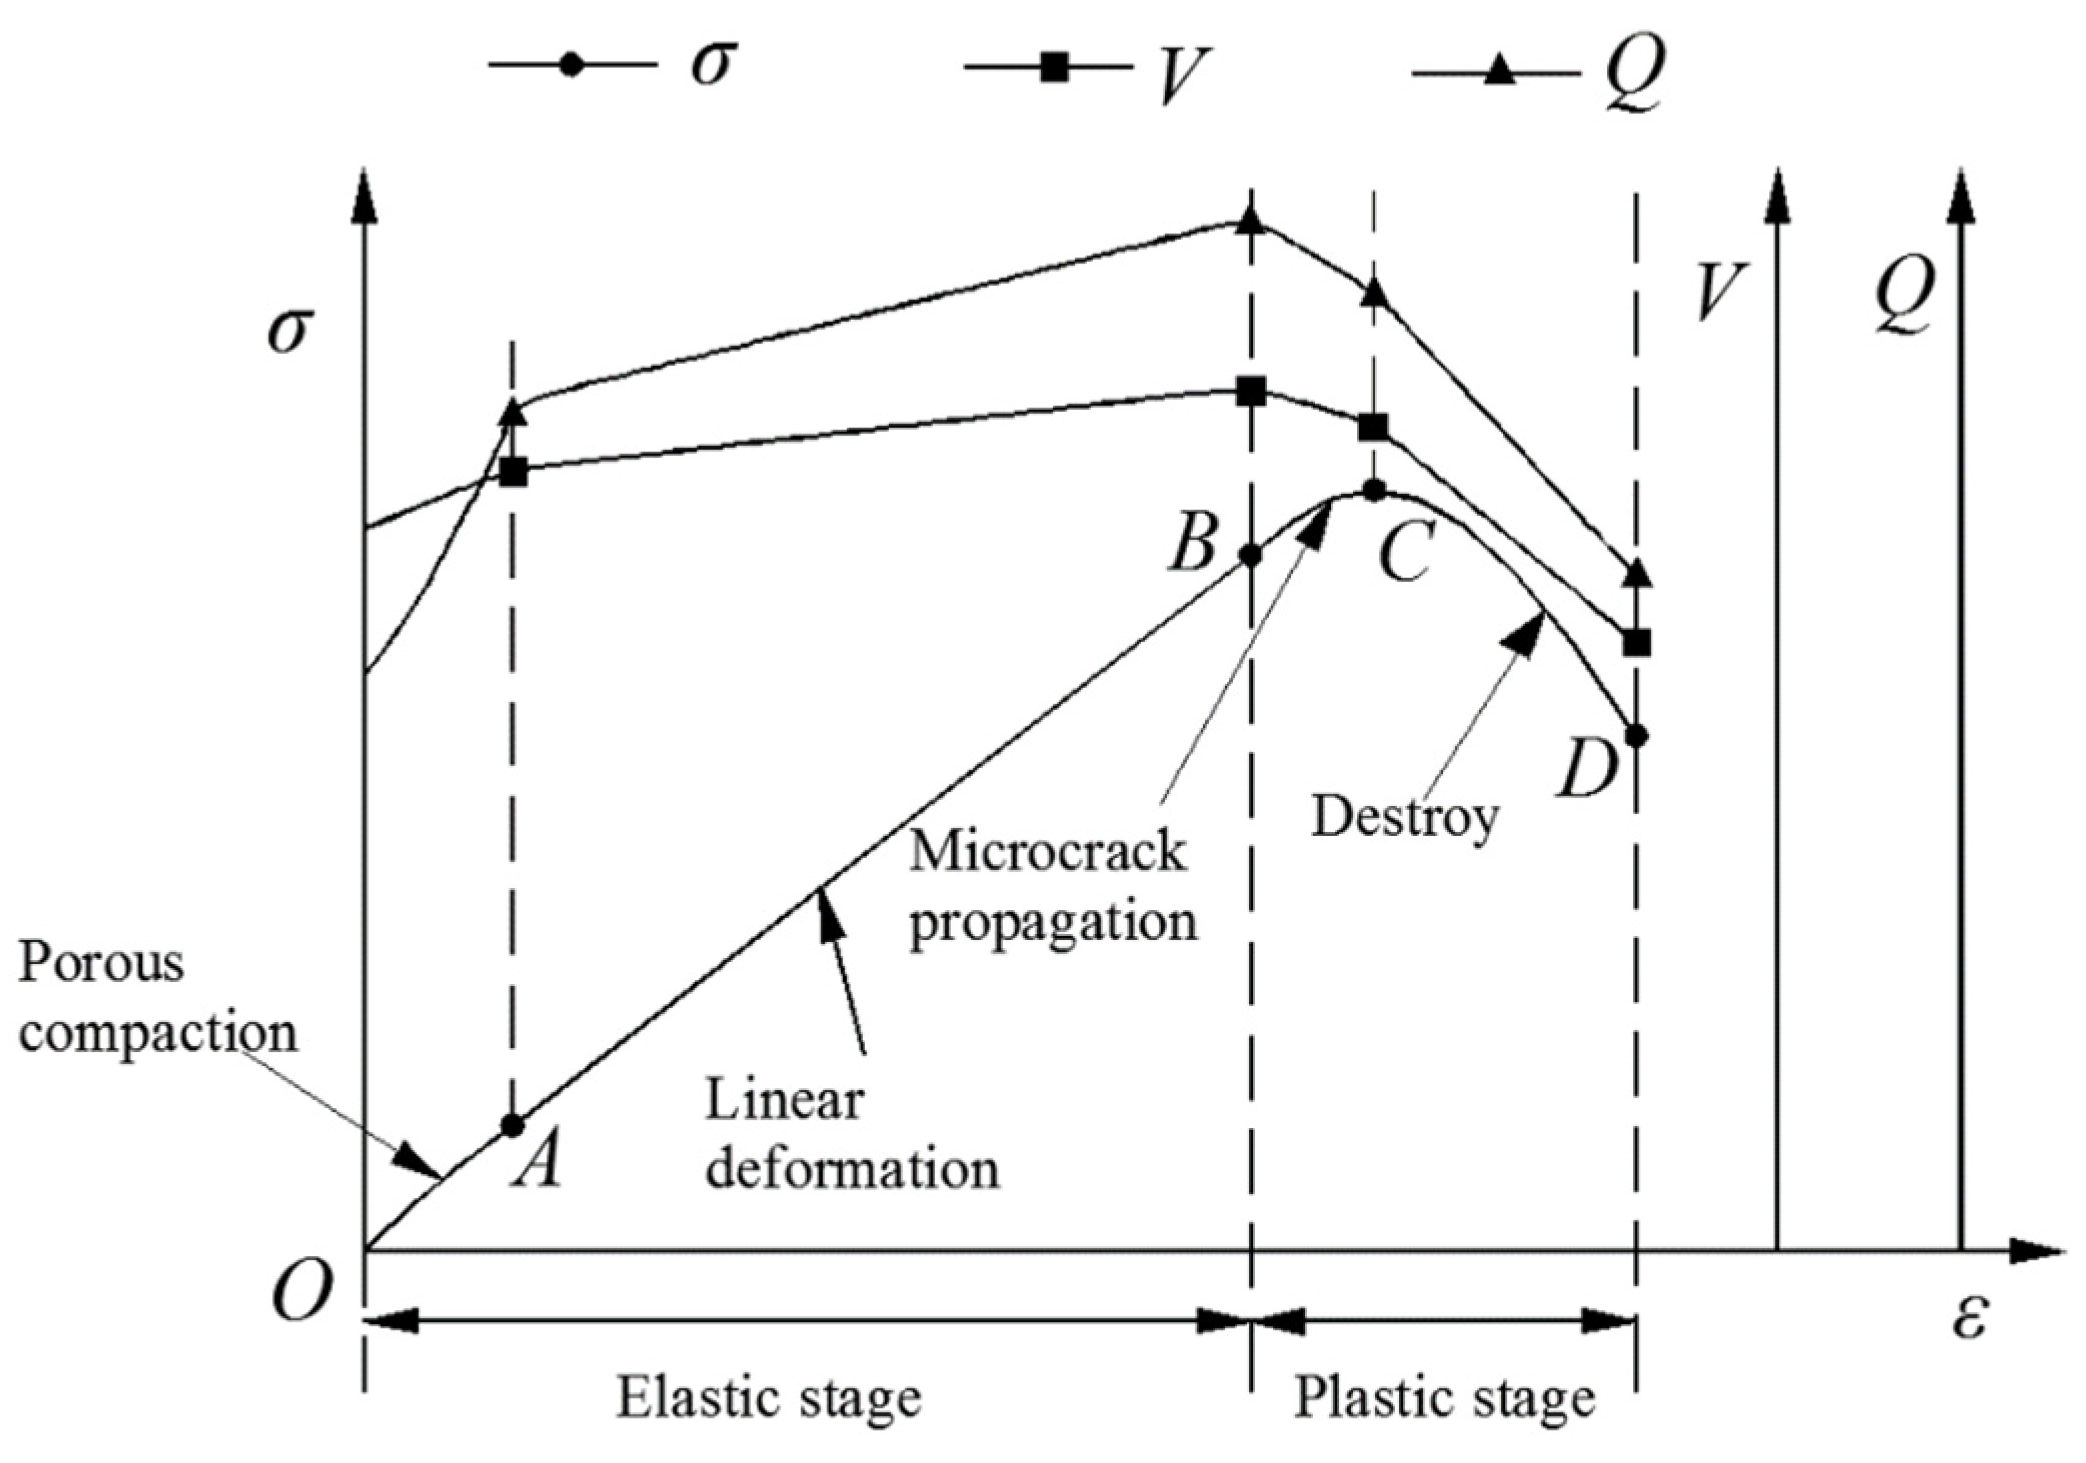
The stress–strain relationship of coal during stress loading involves four stages: pore compaction(OA stage), linear deformation(AB stage), micro-fracture propagation(BC stage), and coal failure(CD stage) (Figure 1) [27]. Among them, the coal in the pore compaction and linear deformation stage belongs to elastic deformation, and the coal in the micro-fracture propagation and coal failure stage belongs to plastic deformation. The law and mechanism of the change in pore and fissure in coal caused by elastic deformation and plastic deformation are different, and so is the mechanism of wave velocity change and attenuation characteristics of coal. Therefore, the study analyzed the coal wave velocity change and its attenuation characteristics during stress loading from the perspective of elastic deformation and plastic deformation.

2.1.1. Theory of Ultrasonic Velocity Change

Coal is a dual structure system composed of matrix pores and fractures which are usually regarded as pores to facilitate the study. Experiments revealed that the relationship between LWV and porosity of coal conforms to the following laws [28,29]:
φ = b e a V p
where φ denotes porosity; a and b are constants; Vp refers to the LWV, i.e., the wave velocity in Equation (1). Since the longitudinal wave and transverse wave had similar propagation laws during stress loading, Equation (1) was also applicable to the transverse wave.
In the elastic deformation stage, the porosity equation expressed in volume strain can be obtained from the definition of porosity [30]:
φ = 1 ( 1 φ 0 ) 1 + ε V
where φ0 represents the initial porosity, and εV indicates the volume strain (negative for volume compression and positive for volume expansion).
Additionally, the volumetric strain–stress relationship of coal is based on the volumetric compressibility coefficient and defined according to the definition of volumetric compressibility coefficient [31]:
1 + ε V = exp ( C f Δ σ )
where Δσ’ indicates the change of effective stress, Cf denotes the volumetric compressibility coefficient of coal, Cf = 3(1 − 2v)/E, v represents the Poisson’s ratio, and E represents the elastic modulus.
By substituting Equation (3) into Equation (2), the relation between porosity and stress can be obtained:
φ = 1 1 φ 0 exp ( C f Δ σ )
It can be obtained by substituting Equation (4) into Equation (1) to calculate Vp that
V P = 1 a ln { 1 b [ 1 1 φ 0 exp ( C f Δ σ ) ] }
Then,
V P = 1 a ln { 1 b [ 1 1 φ 0 exp [ 3 ( 1 2 v ) E Δ σ ] ] }
Considering that the experiment in this paper was a uniaxial loading test, the change in effective stress during stress loading is Δ σ = 1 3 Δ σ x and Δ σ x = σ 1 σ 0 ; then:
V P = 1 a ln { 1 ( 1 φ 0 ) exp [ 1 2 v E ( σ 1 σ 0 ) ] b }
where σ0 and σ1 respectively denote the initial stress and the current stress.
In the plastic deformation stage, the change in coal porosity is related to coal damage. The equation below describes the relationship between coal porosity and the coal damage variable [32]:
φ = φ 1 e β D
where φ1 represents the porosity at the beginning of coal damage, φ indicates the porosity, β denotes the damage parameter of coal which can be obtained by parameter fitting, and D signifies the damage variable.
The plastic variable is defined as the damage variable [33]:
D = ε p ε 0 p ε f p ε 0 p
where ε 0 p denotes the threshold value of damage strain, that is, the plastic strain when the coal starts to damage; ε p represents the current plastic strain; ε f p stands for the plastic strain at the residual strength of coal. ε 0 p , ε p , and ε f p are positive. Considering that the experiment in this paper was a uniaxial stress loading test, various plastic strains were replaced by various axial strains. Specifically, ε 0 p , ε p , and ε f p are the axial strains at the beginning of plastic deformation, during plastic deformation, and after the failure of coal, respectively.
By substituting Equation (8) into Equation (1), LWV Vp at the plastic deformation stage is calculated as:
V P = 1 a ln [ φ 1 e β D b ]

2.1.2. Ultrasonic Wave Propagation Energy Attenuation Theory

The main forms of energy attenuation included diffusion attenuation, absorption attenuation, and scattering attenuation when the ultrasonic wave propagated in the medium. Among them, diffusion attenuation is correlated with the distance of ultrasonic propagation [34], and absorption attenuation mainly comprises heat conduction attenuation and viscous absorption attenuation [35]. In the experiment of this study, the coal samples have the same length and same structure type. Meanwhile, the influence of diffusion attenuation and absorption attenuation on ultrasonic is small and thus can be ignored. Hence, the energy attenuation of ultrasonic wave propagation in coal is primarily reflected in scattering attenuation. According to the research results of Urick R J, the scattering attenuation coefficient of ultrasonic wave propagation in coal is [36]:
α s = φ 1 6 ( 2 π f v ) 4 r ¯ 3
where αs denotes the scattering attenuation coefficient of ultrasonic, φ is the coal porosity, r ¯ indicates the effective radius of pores and fractures in coal, f represents ultrasonic frequency, and v refers to ultrasonic velocity.
According to Equation (11), the scattering attenuation coefficient αs is majorly associated with the porosity of coal, the effective radius of pores and fractures, and the ultrasonic velocity. During the experiment, the ultrasonic velocity of coal has been measured, the porosity of coal has been obtained in the elastic deformation stage and plastic deformation stage, and the effective radius of pores and fractures in coal is difficult to be directly obtained. The existing research confirms that the porosity and effective radius of coal have the following relationship [37]:
φ = 12 π ξ r ¯ N
where ζ denotes the linear density exhibited by cracks in the coal sample, and N represents a coefficient related to the shape of the crack.
Substituting Equation (12) into Equation (11) yields:
α s = φ 4 1 6 ( 2 π f v ) 4 ( π 12 ξ N ) 3
Considering that the energy attenuation regarding ultrasonic wave propagation in coal is mainly scattering attenuation, the attenuation coefficient can be obtained as:
α = α s = φ 4 1 6 ( 2 π f v ) 4 ( π 12 ξ N ) 3
Thus, the quality factor of coal during ultrasonic propagation is:
Q = 1 / α = 1 φ 4 1 6 ( 2 π f v ) 4 ( π 12 ξ N ) 3
The parameters ξ and N in Equation (15) are not easy to measure and cannot be effectively verified directly through the laboratory data. Hence, the comparison method is used for verification. During comparison and verification, the ratio of a quality factor at different stages to that at the initial stage is expressed as M with the ultrasonic attenuation coefficient at the beginning of this stage as the standard. The calculation method of M is:
M = Q b Q a = v b 4 φ a 4 φ b 4 v a 4
where M is the ratio of quality factor, Qb indicates the quality factor of the current state, Qa denotes the quality factor in the initial state, and vb and va represent the wave velocity in the current state and in the initial state, respectively. φb and φa denote the porosity in the current state and in the initial state, respectively.
In the elastic deformation stage, substituting Equation (4) into Equation (16) yields:
M 1 = v 4 φ 0 4 { 1 ( 1 φ 0 ) exp [ 1 2 v E ( σ 1 σ 0 ) ] } 4 v 0 4
where M1 indicates the ratio of quality factor in the elastic deformation stage.
In the plastic deformation stage, substituting Equation (8) into Equation (16) yields:
M 2 = v 4 φ 1 4 φ 4 v 1 4 = v 4 φ 1 4 ( φ 1 e β D ) 4 v 1 4
where M2 denotes the ratio of quality factor in the plastic deformation stage.

2.2. Experiment

2.2.1. Experimental Equipment

The ultrasonic experiment adopted a rock physics measurement device under low frequency during the stress loading process. Its working principle is illustrated in Figure 2. The device is equipped with a core sample testing system (System 1) and a data acquisition system (System 2).
System 1, as an essential part of the device, has a semiconductor strain gauge, ultrasonic transducer, standard aluminum sample, servo vibrator, and epoxy resin sheet. System 1 can transmit and receive ultrasonic waves through ultrasonic transducers to realize the ultrasonic measurement of coal media. The frequency range of the ultrasonic measurement is 5 Hz–1 MHz. The axial pressure measurement is realized by applying stress to the test coal sample through a servo vibrator.
System 2, taking charge of recording the change in coal strain and ultrasonic velocity during the experiment, is adopted mainly to achieve high-precision data acquisition, which consists of a control software, signal generator, 12-channel high-precision differential amplifier, servo vibration amplifier, pulse generator receiver, digital oscilloscope, digital acquisition board, embedded computer, and analog-to-digital input board.
Additionally, auxiliary tools such as balances and vernier calipers are also needed during the experiment.

2.2.2. Measurement Principle

The measurement of ultrasonic wave velocity in low-frequency rock physics measurement systems primarily adopted the pulse transmission method [38,39]. Specifically, the measurement was conducted using the polarization filtering method to pick up the initial transverse wave, and then its wave velocity was calculated. Due to the constraints of experimental conditions, the propagation of the ultrasonic transverse wave in the anisotropic thin layer is accompanied by the propagation of fast and slow transverse waves in the medium in the way of orthogonal polarization, so as to weaken the time difference between them reaching the receiver. The detector can only identify the time point of receipt of the transverse wave fast wave, and it is difficult to identify the time point of arrival of the transverse wave slow wave. Therefore, this experiment only focuses on the shear wave velocity given the influence of realistic conditions.
(1)
Measurement of wave velocity.
The pulse transmission ultrasonic system was adopted in the experiment. The computer can directly read out the sound wave velocity. The principle of test is expressed as:
{ V p = L / ( t p t 0 ) V s = L / ( t s t 0 )
where Vp and Vs denote the LWV and TWV, respectively. L represents the distance between the transmitting and receiving transducers, tp stands for the longitudinal wave propagation time, ts is the transverse wave propagation time, and t0 signifies the zero delay of the instrument system.
(2)
Measurement of quality factor.
Due to the existence of pores and fissures in coal, ultrasonic waves will inevitably undergo attenuation in coal. The distribution law and structural characteristics of coals’ internal microstructure and the ground stress state in the coal can be effectively obtained by studying the attenuation law of ultrasonic waves after passing through the coal sample. Their attenuation characteristics are generally measured by quality factors. A larger quality factor indicates smaller pore and crack size in coal, and slower attenuation. The quality factor is calculated by 2π times the ratio of the energy consumed by ultrasonic propagation attenuation to its own energy within a wavelength [40]:
Q = 2 π E Δ E
where Q denotes the quality factor, E represents the energy it has, and ΔE indicates the decayed energy.
The main methods for determining the quality factor are the time domain method and the frequency domain method. The study employed the amplitude decay method in the time domain to determine the quality factor. The key to this method was the determination of the main frequency and the initial arrival time. The specific steps were detailed as follows. Firstly, the ultrasonic wavelet waveform of the failed coal sample and the ultrasonic waveform passing through the coal sample obtained by the experiment were derived. Then, the more complete transmission wave waveform was intercepted by the first arrival pickup and was subjected to broadband filtering to remove other clutter. Afterward, the frequency point corresponding to the maximum amplitude in the first arrival pickup intercepted waveform was picked up as the main frequency. Next, the root mean square amplitude of the ultrasonic wavelet of failed coal samples and the ultrasonic wavelet passing through coal samples were calculated, respectively. Finally, the obtained main frequency, first arrival time, amplitude, and other parameters were substituted into the formula to obtain the corresponding quality factor value.
The process of determining quality factors by amplitude attenuation method is:
A ( x ) = A 0 e α x
where A0 denotes the wavelet amplitude without passing through the coal sample, A(x) indicates the ultrasonic amplitude passing through the coal sample, α represents the attenuation coefficient, and x refers to the length of the medium.
Among them, the attenuation coefficient α can be expressed as:
α = π f Q V
where f and V denote the main frequency and the wave velocity, respectively.
Substituting Equation (22) into Equation (21) yields:
A ( x ) = A 0 e π f x Q V
From the first arrival time of ultrasonic wave t = x/V, it can be obtained that
A ( x ) = A 0 e π f t Q
After taking logarithms on both sides, Q can be obtained as:
Q = π f t / ln [ A ( x ) A 0 ]

2.2.3. Coal Sample Collection and Preparation

With the underground raw coal as the research object in the experiment, coal samples were collected per the provisions of Methods for Taking Coal Rock Samples [41] and Classification of Coal Structure [42]. The collected raw coal was primary structural coal. The strike orientations of the fractures in the coal seam are different, suggesting the influence of the anisotropy of the coal seam on the transmission of ultrasonic waves. Hence, attention should be paid to indicating coal samples’ strike, tendency, and vertical bedding direction in the coal seam upon the collection of the coal samples on site.
The sampling site was located at 31004 working face of Shanxi Xinyuan Coal Co., Ltd. of Yangmei Group (Jinzhong, China). The working face was located in the Hanzhuang sub-district and mainly mined 3# coal seam. Its coal quality was high-quality lean coal with medium ash and low sulfur. The coal seam was majorly bright coal with developed endogenous fractures. The coal seam contained 1–2 layers of argillaceous gangue, and the thickness was in the range of 0.01–0.04 m (0.02 m on average). The 3# coal seam mined in this working face had steady occurrence and simple structure, and the coal firmness coefficient was 0.51–0.82, meeting the requirements of coal sample collection in this experiment.
The coal with a large volume and relatively complete structure preservation should be picked up as the master sample when coal samples are collected. After picking up the master sample, it should be put into the pre-prepared woven bag. Concurrently, the structure type and direction of the collected coal samples should be indicated on the bag surface. After the master sample was collected, it was transferred to the laboratory and processed into a 100 mm-high cylindrical standard coal sample (50 mm in diameter) by drilling equipment. Additionally, the coal core obtained by drilling was polished to make its flatness less than 0.02% to enable the transducer of the ultrasonic tester to form better contact with the coal core.
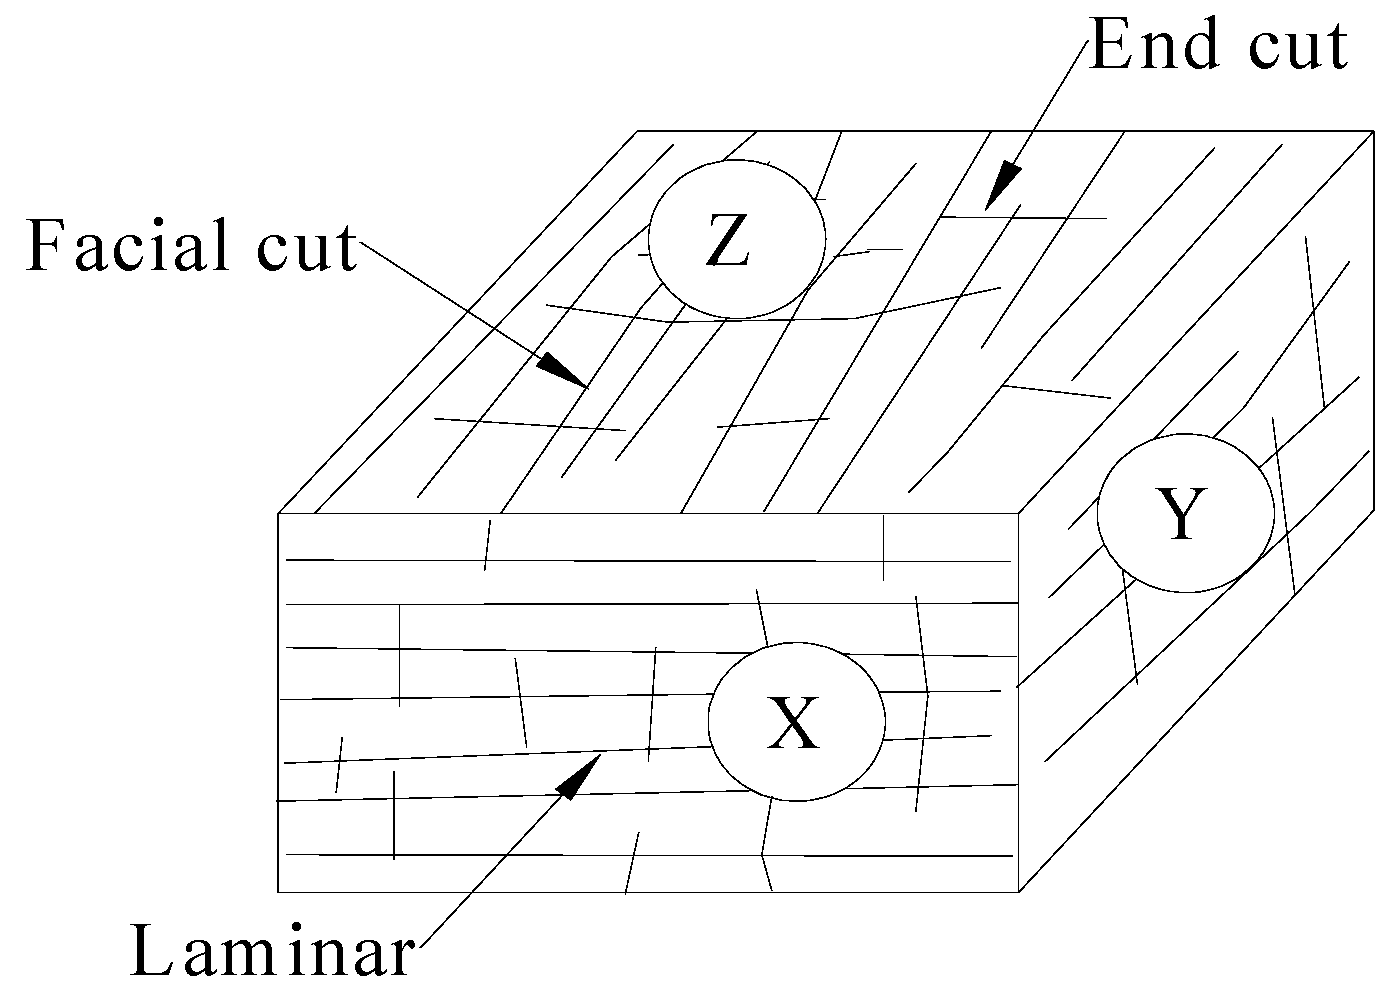
The total processing completed three experimental coal samples, including one in the strike, inclination, and vertical bedding direction. The coal sample number is specified as follows for contributing to the statistics and analysis. The direction of the parallel plane cleat, vertical plane cleat, and vertical bedding is defined as the X, Y, and Z direction, respectively, as shown in Figure 3. According to the classification standard of coal structure type, the primary structure coal is class I coal. Hence, experimenters name the three coal samples IX1, IY1, and IZ1 in turn.
The coal sample obtained after processing is exhibited in Figure 4. The specific parameters of the coal sample are presented in Table 1.

2.2.4. Experimental Scheme and Steps

In this experiment, there were three coal samples; stress loading was in the form of uniaxial compression; pressure was maintained 5 min after every certain value until the end of the coal failure experiment. Each coal sample experiment’s specific steps are described as follows.
  • Clean the sticking position of the coal sample’s strain gauge, firmly stick the strain gauge on the coal sample surface with glue, and press it hard to ensure full contact. After the glue is dry and firmly connected, the resistance value is checked with a strain gauge to ensure no open circuit or short circuit.
  • In order to improve the measurement accuracy, the coupling agent is applied to the coal sample and the ultrasonic transducer probe, and put the coal sample into the loading test system. Thus, the coal sample is consistent with the central axis of the transducer probe to ensure stable placement.
  • Connect the outgoing line of the strain gauge with the strain measurement instrument, and obtain the strain of the coal through the output of the strain measurement instrument.
  • Connect the ultrasonic testing instrument following the experimental setting, turn on the computer control terminal and digital oscilloscope power, and debug to assure the normal use of the instrument.
  • Adjust the loading system for controlling axial pressure change, and load the coal sample by stages until it breaks. Stabilize the voltage for 5 min after each new stress value is loaded, read out the corresponding ultrasonic wave velocity, record the first wave amplitude, and export the waveform data on the oscilloscope.
  • Record the loading stress value, axial strain, and ultrasonic response characteristic parameters, and repeat step 5 until the coal sample is broken and the experiment is completed.

3. Results

3.1. Experimental Results

Table 2 lists the experimental results of coal samples in terms of the ultrasonic velocity, quality factor, and axial strain during uniaxial stress loading.

3.2. Relationship between the Ultrasonic Velocity and Axial Strain of Coal Sample during Stress Loading

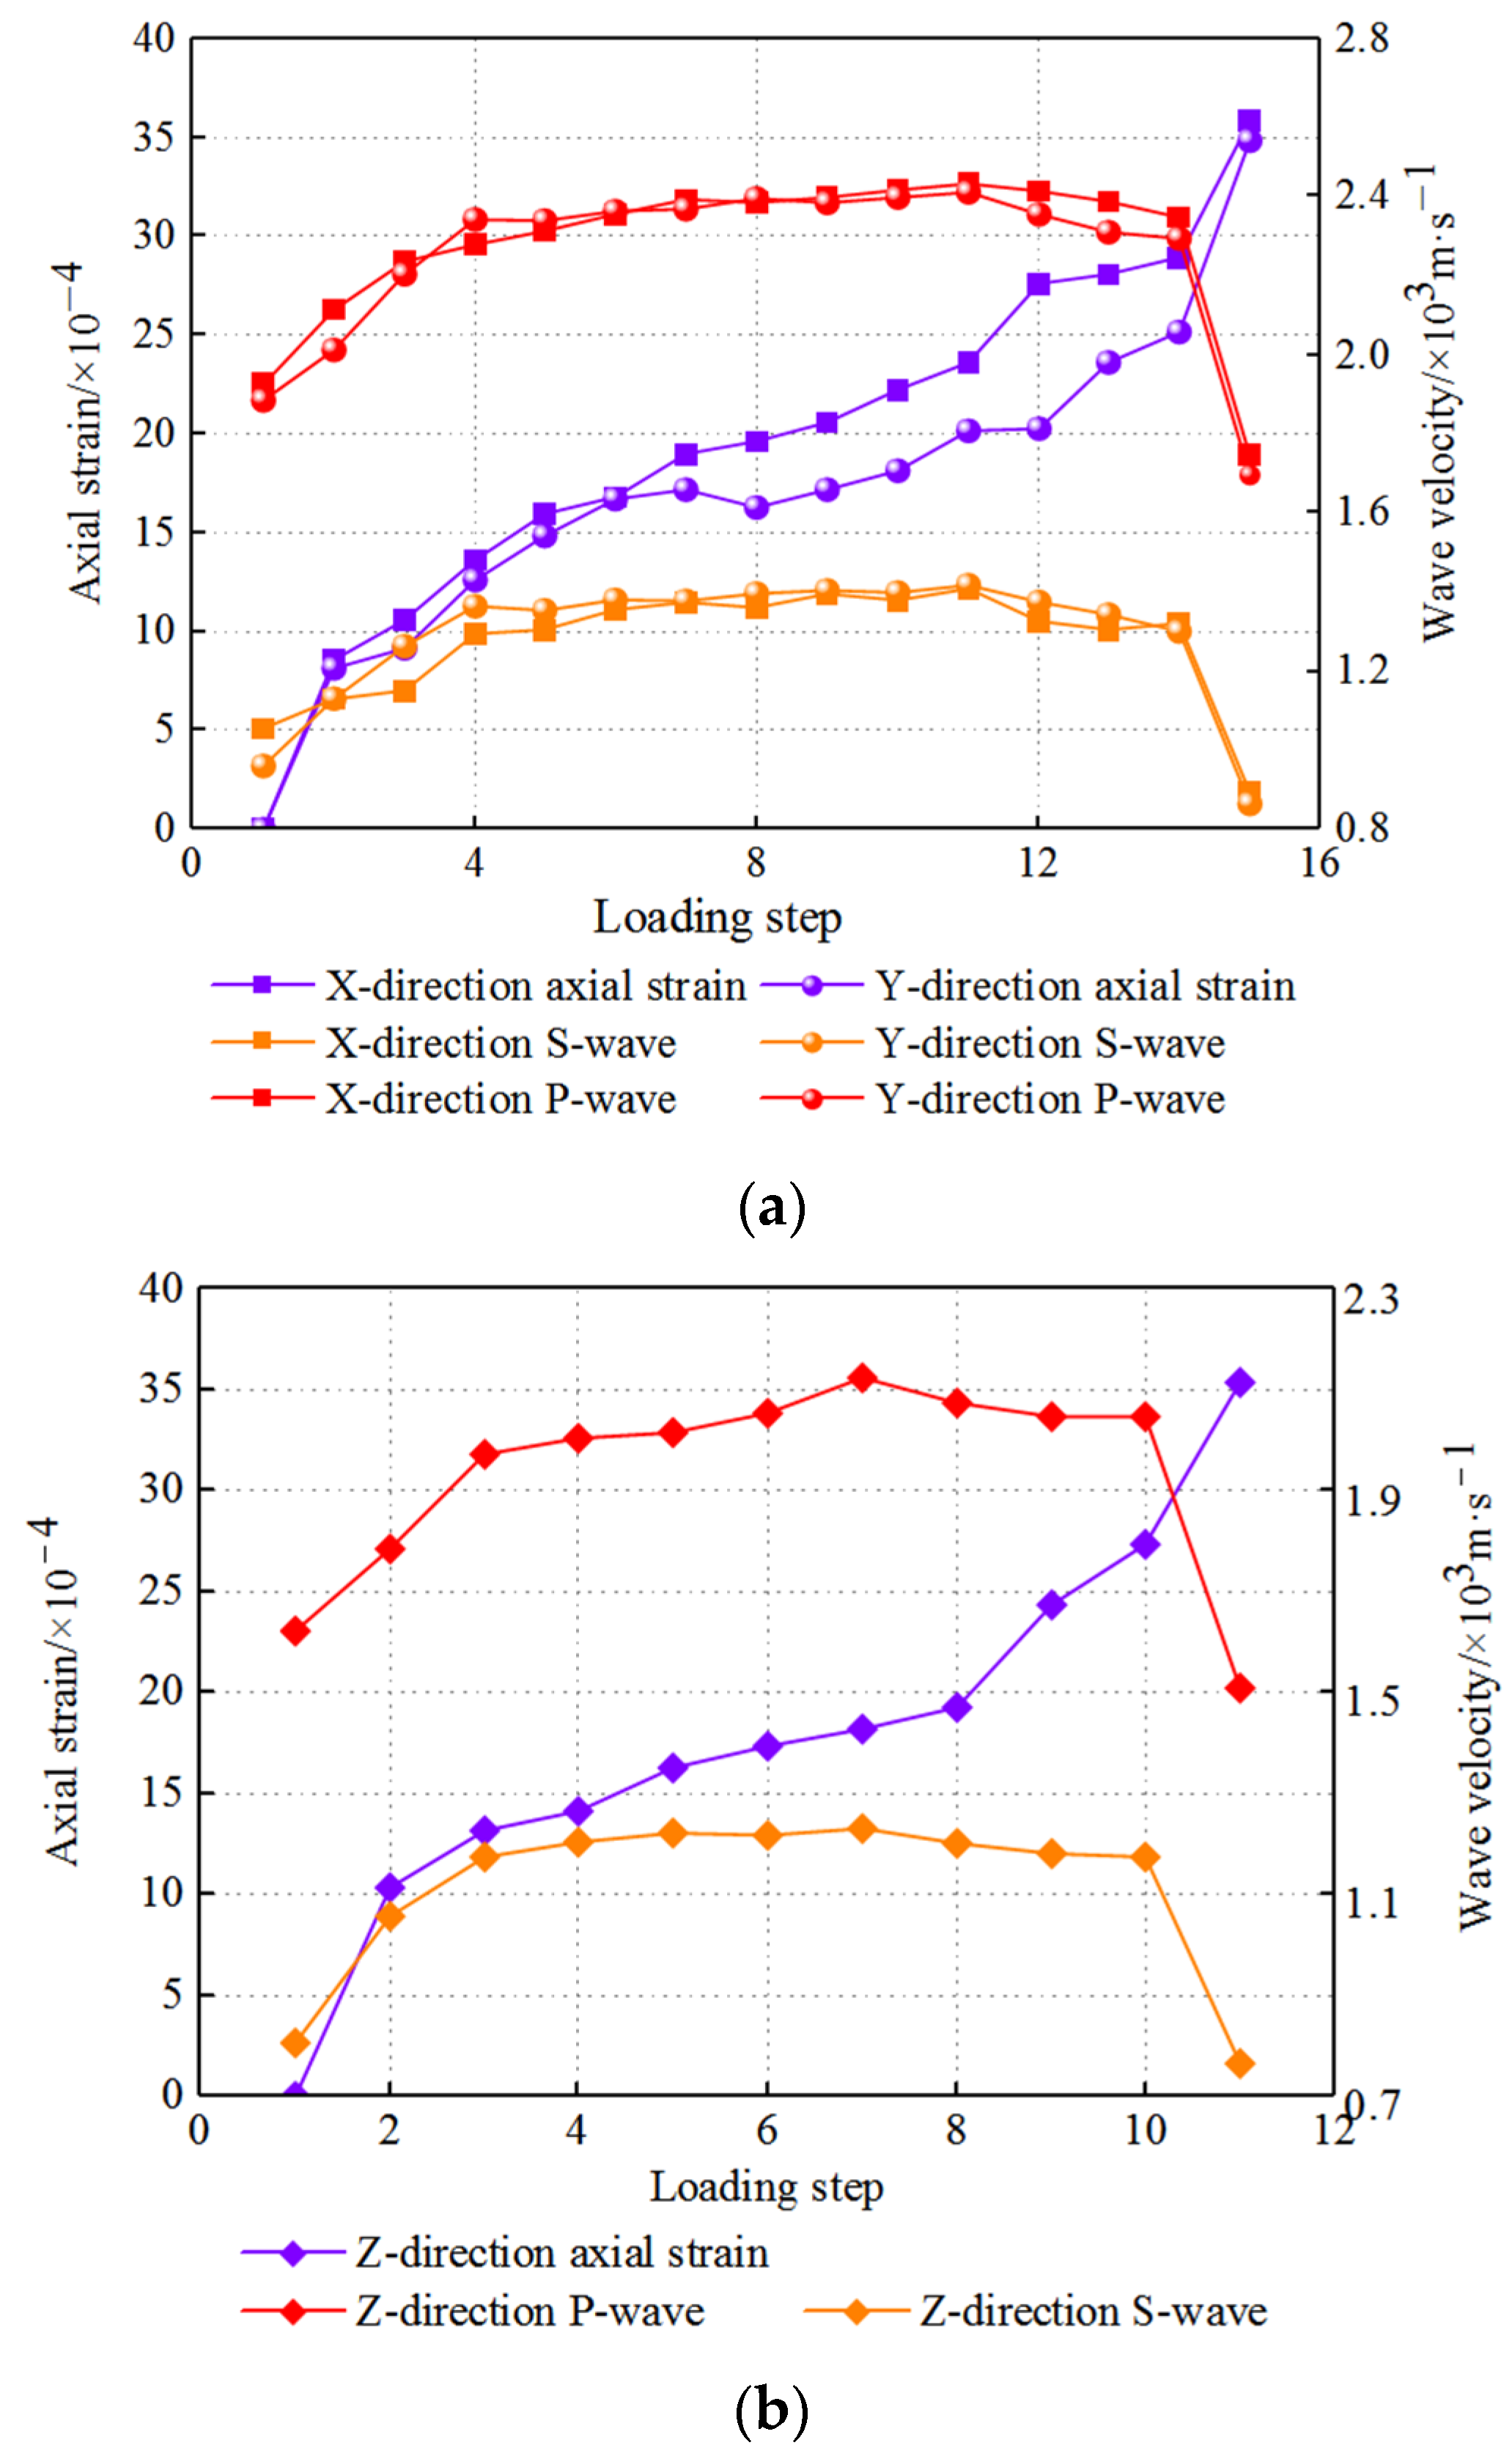
Table 2 explains the ultrasonic velocity–axial strain relationship of the coal sample during stress loading (Figure 5).
With Figure 5, the analysis on the above relationship assists in drawing the following conclusions:
  • As the loading step increases, the axial strain of the coal sample will be on a rise, while the LWV and TWV will present an increase-to-decrease trend.
  • The wave velocity exhibits strong anisotropy. The coal sample possesses higher LWV than TWV, and the LWV in the Z direction is lower than that in the X and Y directions. Through numerical analysis, the Pearson correlation coefficient of the TWV in the X and Y directions is 0.96501, indicating that the TWV in the X and Y directions is similar. During the whole process of stress loading, the TWV in the X and Y directions of the coal sample showed a change trend of “increase-slow increase-slow decrease-sharply decrease”. The TWV in the X direction increases from 1056 m/s to 1296 m/s in the stress range of 0–1.5 MPa. Then, with the increase of axial stress to 6.6 MPa, the TWV in X direction increases slowly from 1296 m/s to 1408 m/s. Then, it slowly decreases to 1321 m/s, and the axial stress is 7.2 MPa. After the coal sample is damaged, the stress value drops sharply to 1.5 Mpa, and the TWV in the X direction decreases sharply to 893 m/s. The TWV in the Y direction increases from 959 m/s to 1364 m/s in the stress range of 0–1.5 Mpa. Then, with the increase of axial stress to 6.6 MPa, the TWV in Y direction increases slowly from 1364 m/s to 1416 m/s. Subsequently, it slowly begins to decrease to 1300 m/s, and the axial stress is 7.2 MPa. After the failure of the coal sample, the stress value drops sharply to 1.5 MPa, and the TWV in the Y direction decreases sharply to 864 m/s. The Pearson correlation coefficient of the LWV in the X and Y directions is 0.98241, indicating that the LWV in the X and Y directions is similar. In the whole process of stress loading, the LWV of coal samples in X and Y directions showed the change trend of “increase-slow increase-slow decrease-sharply decrease”. The LWV in the X direction increases from 1925 m/s to 2280 m/s in the stress range of 0–1.5 MPa; then, as the axial stress increases to 6.6 MPa, the LWV in the X direction slowly increases from 2280 m/s to 2434 m/s, and then slowly decreases to 2347 m/s, and the axial stress is 7.2 Mpa. After the coal sample is destroyed, the stress value drops sharply to 1.5 Mpa, and the LWV in the X direction decreases sharply to 1743 m/s. The LWV in the Y direction increases from 1886 m/s to 2342 m/s in the stress range of 0–1.5 Mpa. Then, with the increase of axial stress to 6.6 Mpa, the LWV in the Y direction increases slowly from 2342 m/s to 2412 m/s, and then decreases slowly to 2296 m/s, and the axial stress is 7.2 Mpa. After the coal sample is destroyed, the stress value drops sharply to 1.5 Mpa, and the LWV in the Y direction decreases sharply to 1695 m/s.
  • According to the stress loading process of coal samples, the changes in axial strain, LWV, and TWV fall into the initial stage, the middle stage, the late stage, and end stage of stress loading.
  • In the early stage of stress loading, the LWV, TWV, and axial strain of coal samples increase. In the middle stage of stress loading, the LWV, TWV, and axial strain of coal samples increase slowly. In the late stage of stress loading, the axial strain of coal samples showed a significant increase trend, and the LWV and TWV of coal samples began to decrease slowly. At the end of the stress loading, the coal sample is broken, the axial strain of the coal sample increases sharply, and the LWV and TWV of the coal sample decreases sharply. The reasons for these trends are as follows: in the early stage of stress loading, the coal structure is compressed, the size of pores and cracks in the coal decreases, the axial strain increases, and the acoustic wave velocity of the coal increases. In the middle of stress loading, with the increase of axial pressure, the compression amplitude of coal structure decreases, so the LWV, TWV, and axial strain of coal sample increase slowly. In the late stage of stress loading, the coal enters the plastic stage, the internal cracks of the coal sample begin to increase, the size of the pores and cracks increases, the axial strain of the coal sample increases, and the LWV and TWV of the coal sample begin to decrease slowly. At the end of the stress loading, because the load of the coal sample exceeds its maximum bearing capacity, a large number of cracks appear in the coal, the axial strain increases sharply, and the wave velocity decreases abruptly.
  • In the initial and middle stages, the ultrasonic velocity and axial strain of coal samples present an uptrend and have a good positive correlation. In the late stage and at the end of stress loading, the axial strain continues to increase, while the wave velocity significantly decreases. The ultrasonic velocity of coal samples shows a negative correlation with the axial strain.

3.3. Relationship between the Axial Strain and Quality Factor of Coal Sample during Stress Loading

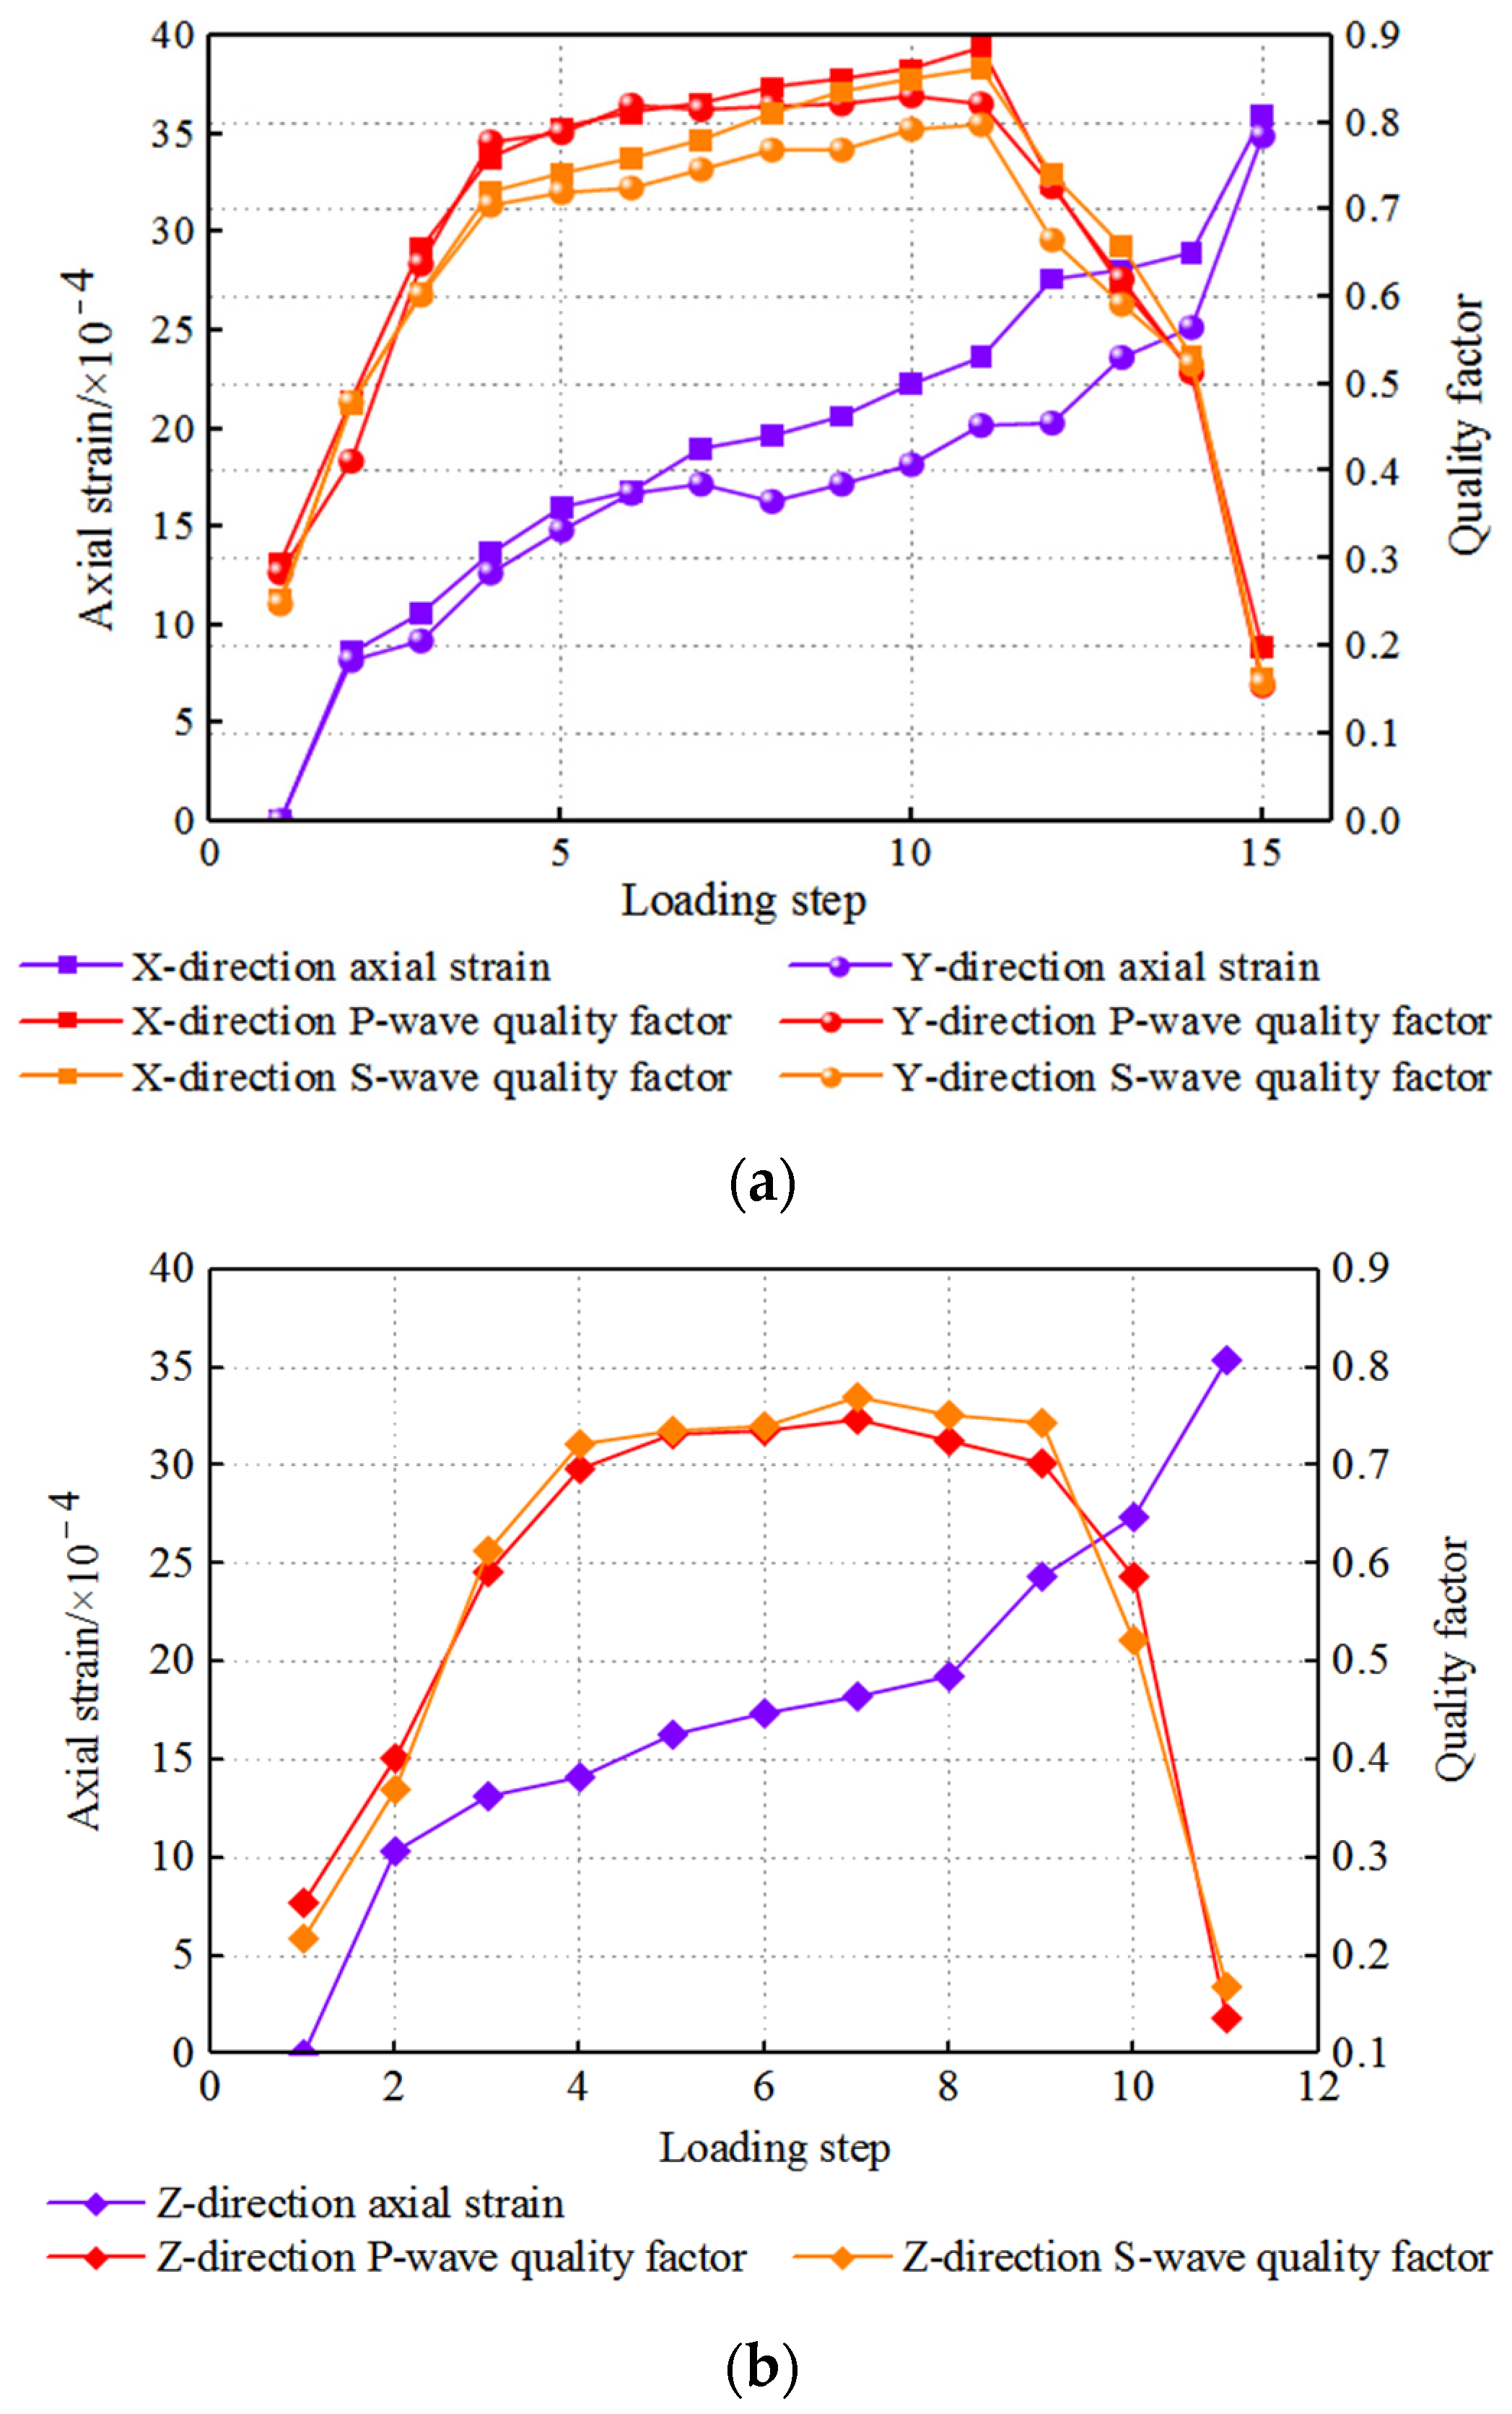
Similarly, the relationship between the coal sample quality factor and axial strain during stress loading can be obtained according to Table 2 (Figure 6).
Analysis on the above relationship assists in drawing the following conclusions, as shown in Figure 6:
  • The quality factors of coal samples also demonstrate strong anisotropy. The quality factors of coal samples in the Z direction are less than those in the X and Y directions. The quality factors of coal samples in the two directions are similar, and the variation law is the same. In other words, coal samples present a higher wave velocity attenuation amplitude in the Z direction relative to the X and Y directions.
  • The variation trend of coal sample quality factors during stress loading also falls into the initial stage, the middle stage, the late stage, and the end stage of stress loading. In the initial stage, the coal sample quality factor significantly increases. In the middle stage, the quality factor slowly increases. In the late stage, the quality factor significantly decreases. At the end of stress loading, the quality factor sharply decreases.
  • In the initial and middle stage of stress loading, the coal sample quality factor increases as the axial strain increases, indicating that the attenuation amplitude of energy during ultrasonic propagation decreases as the axial strain increases. In the late stage and at the end of stress loading, the axial strain of coal samples keeps increasing, while the quality factor of coal samples sharply decreases, implying that the attenuation range of energy during ultrasonic propagation increases as the axial strain increases.

3.4. Relationship between Coal Sample Wave Velocity and Quality Factor during Stress Loading

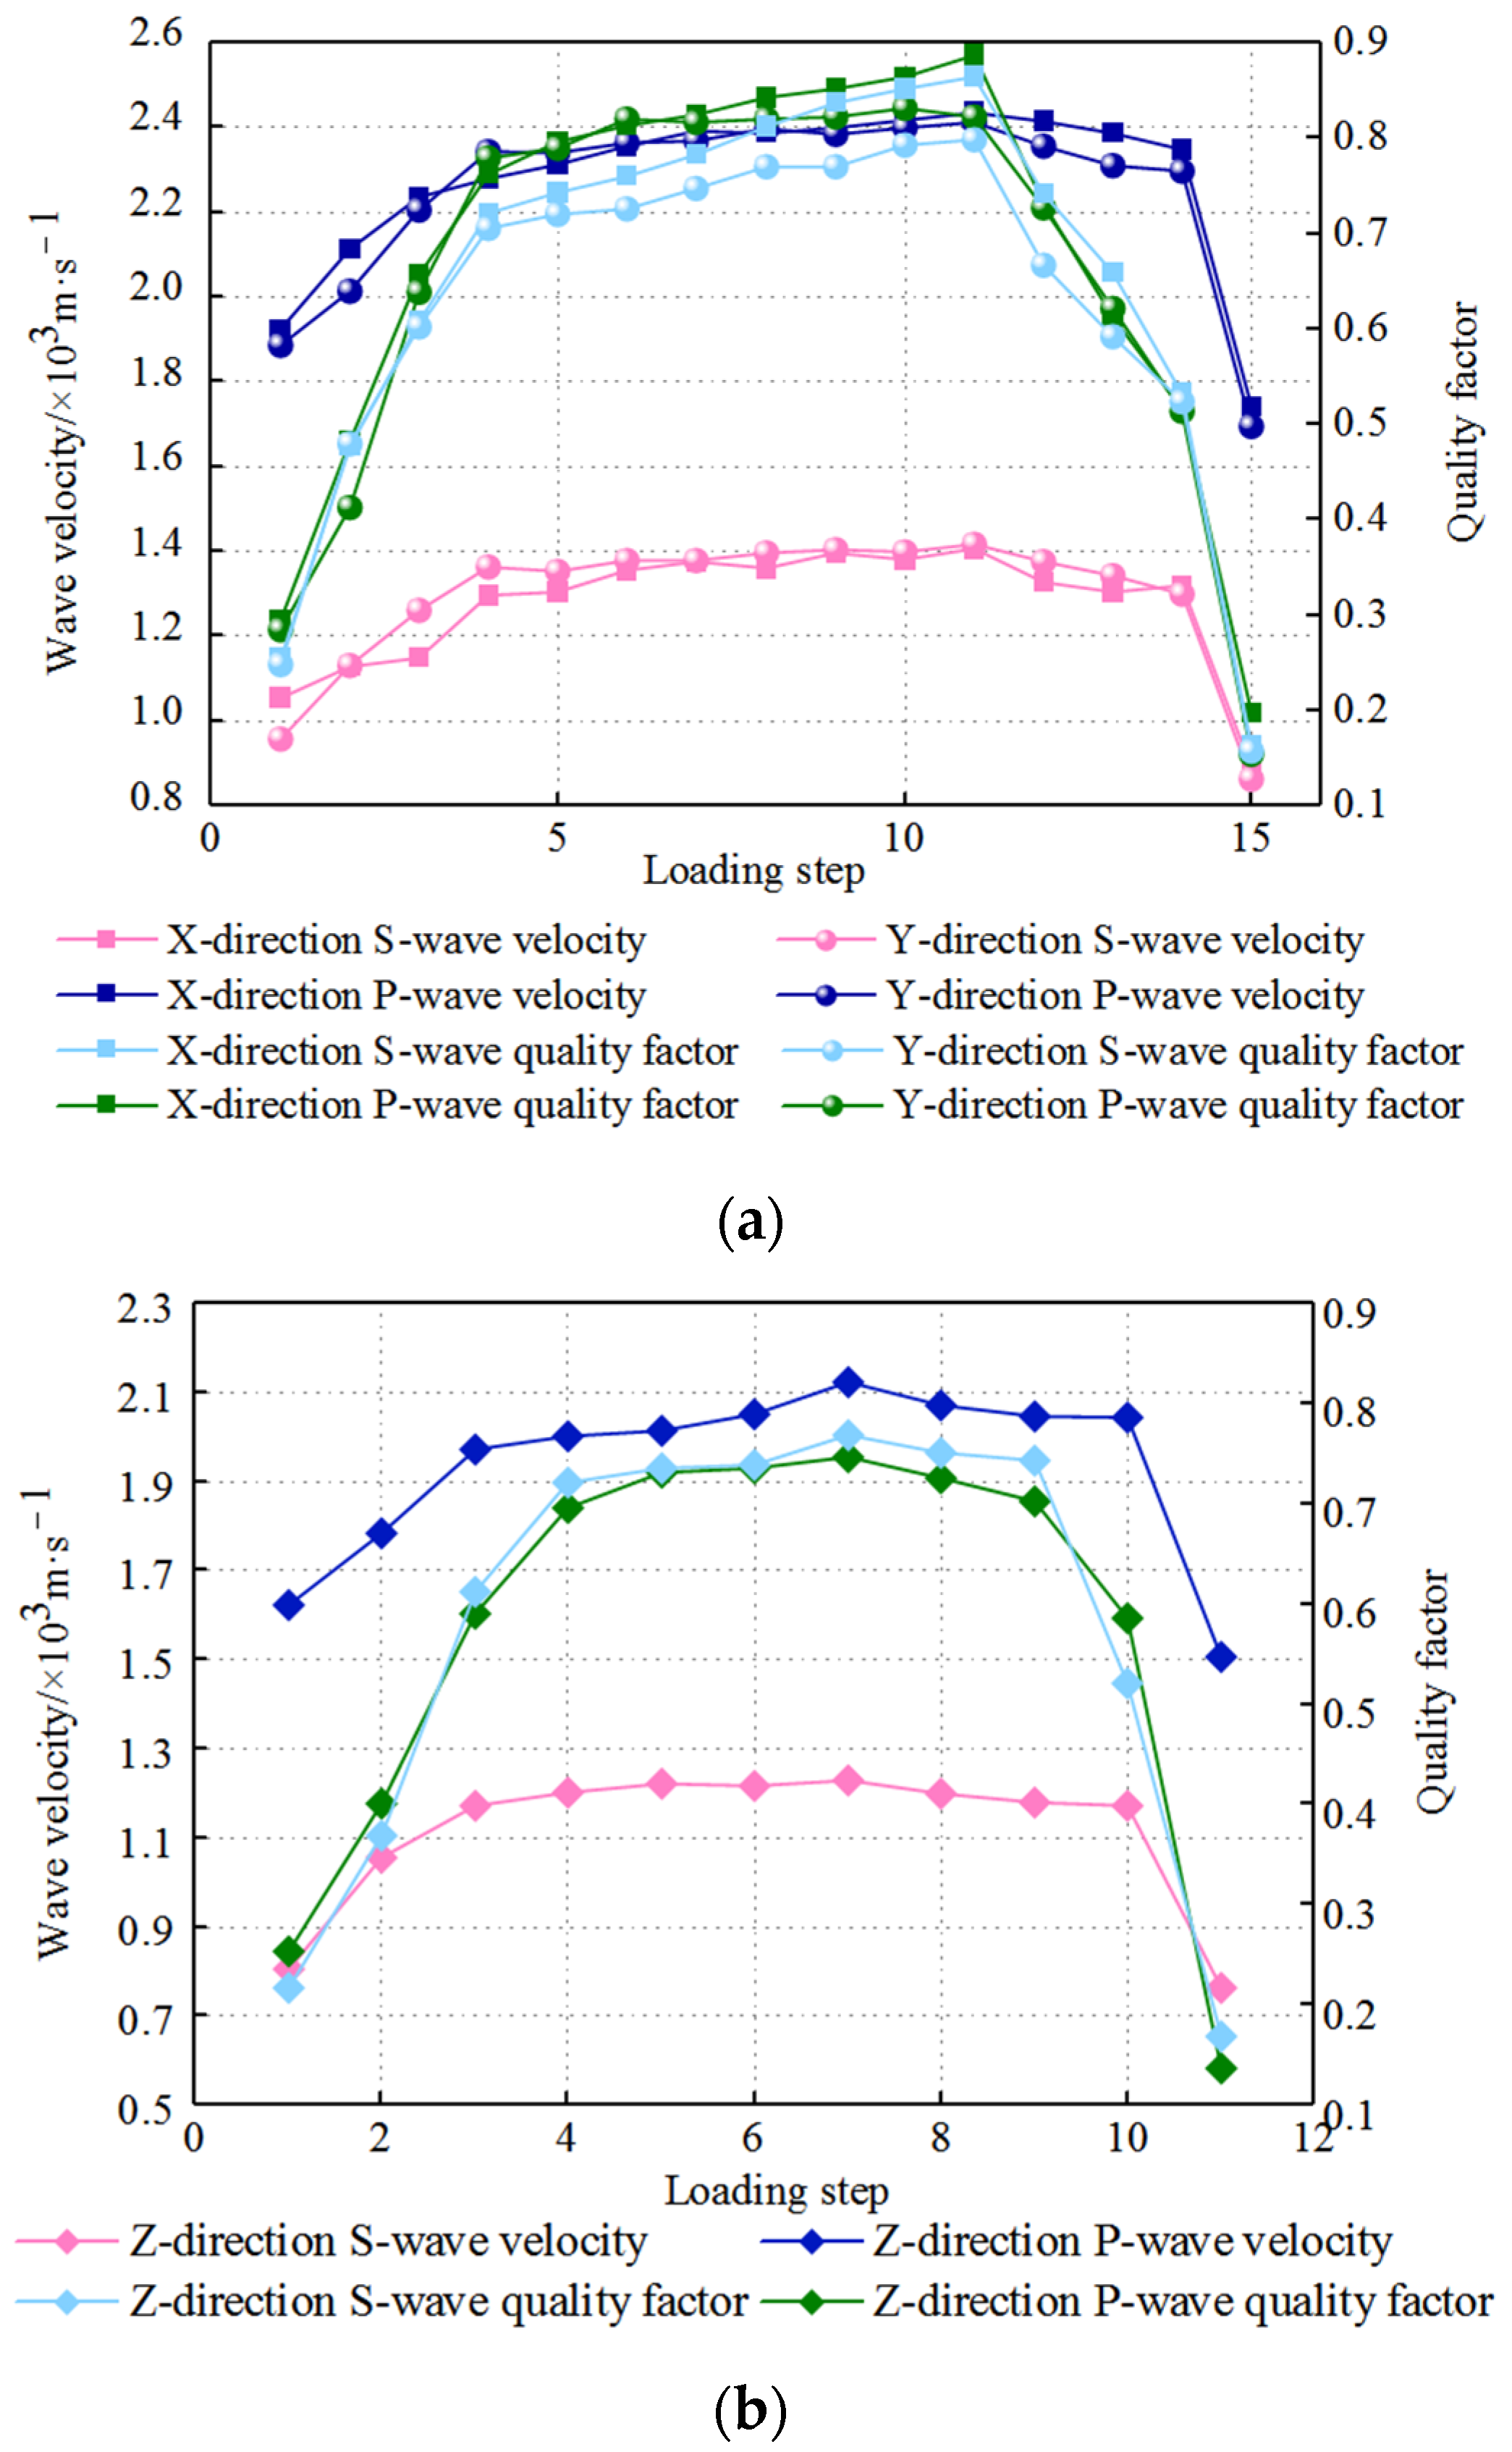
Based on Table 2, the coal sample quality factor-wave velocity relationship of coal sample during stress loading can be obtained (Figure 7).
As revealed in Figure 7, the quality factor-wave velocity relationship of the coal sample during the stress loading process can be concluded as follows. The two parameters have significant stage characteristics, and their variation laws are the same.

4. Discussion

4.1. Analysis of Influencing Factors of Coal Ultrasonic Velocity Change during Stress Loading

Equations (7) and (10) are used to calculate ultrasonic wave velocity in the elastic deformation stage and plastic deformation stage, respectively. Whether Equations (7) and (10) are reliable is further verified with the longitudinal wave data in the X direction as an example.
According to the longitudinal wave data in the X direction in Table 2, Equation (26) can be obtained by fitting according to Equation (1):
φ = 0.044741915 e 0.000126133 V P
where a = −0.000126133, and b = 0.044741915; Vp refers to the LWV, m/s.
The coefficient of Equation (26) is fitted based on the measurement results of this experiment. However, due to the limitation of test conditions, the number of coal samples in this experiment is small, which may lead to a certain error of the coefficient. Therefore, we will focus on improving this problem in subsequent research. The variation data of LWV with stress can be obtained by substituting coal mechanical parameters and fitting parameters a and b into Equation (7). Figure 8 displays the comparison diagram between the calculated value of LWV in the X direction and the experimental value in the elastic deformation stage in combination with the experimental data in Table 2. In Figure 9, the LWV in the X direction demonstrates a linear increase with stress during the elastic deformation phase of the stress loading process, revealing the increase in stress in the elastic deformation stage, the decrease in coal porosity, and the increase in wave velocity. This conclusion is consistent with Yale’s research results. Yale [43] also proposed in the research results that the porosity of rock decreases with the increase of stress, which leads to the increase of wave velocity transmitted in rock mass. Therefore, the internal factor affecting the change of coal wave velocity in the elastic deformation stage is porosity, which theoretically explains the root cause of the change of coal wave velocity.
After calculation, the error rate between the experimental value and the calculated value of the LWV in the X direction of the elastic deformation stage is 1.14% (loading step 1), and the maximum is 10.75% (loading step 4), which shows that it is feasible to calculate the LWV in the elastic deformation stage by this formula.
With the longitudinal wave data in the X direction in Table 2, β = 0.05 can be obtained by fitting according to Equation (8). Then, the coal mechanical parameters are substituted, and parameters a and b are fitted into Equation (10), so as to acquire the variation data of LWV with strain. With respect to the experimental data in Table 2, the comparison diagram between the calculated value of LWV in the X direction in the plastic deformation stage and the experimental value can be depicted (Figure 9). As observed in Figure 9, the LWV in the X direction decreases exponentially with the strain in the plastic deformation stage during stress loading. Thus, in the plastic deformation stage, the coal axial strain, the damage variable, and the porosity increase, leading to weakened wave velocity. After calculation, the error rate between the experimental value and the calculated value of the LWV in the X direction of the plastic deformation stage is 7.36% (loading step 13), and the maximum is 11.9% (loading step 15), which shows that it is feasible to calculate the LWV in the plastic deformation stage by this formula.
Equation (7) illuminates that the main factor affecting the change of coal wave velocity in the elastic deformation stage is stress, and the wave velocity increases linearly with the increasing stress. This research result is in line with the research results of Meng Zhaoping [44], Zhou Feng [14], and Li Qiong [45]. In addition, Dong Shouhua et al. [46] focused on the measurement of the ultrasonic wave velocity of anthracite samples under triaxial stress. The research found that the confining pressure increase was accompanied by the increase in ultrasonic wave velocity, and the wave velocity increased slowly and became stable when it exceeded the critical value of confining pressure. Sun Xiaoyuan [47] found that the P-wave velocity of briquettes was positively correlated with its pressure; Zhang Long [48] and others found a logarithmic relationship between ultrasonic LWV and stress. Yu Hongyan [49] and others found that effective stress increase resulted in obviously increased P-wave and S-wave velocities of fractured shale. Cao Anye et al. [50] found that the P-wave velocity was exponentially positively correlated with the applied stress through laboratory experiments. The research results of these scholars show that the change of wave velocity is related to stress, but the influence of stress on wave velocity is different, which shows that there are different variation rules of wave velocity in different stress change stages. Therefore, according to the stress–strain characteristics of coal, the stress loading process is divided into the elastic stage and plastic stage. In these two stages, the variation law of wave velocity is studied respectively, which can reflect the response characteristics of the ultrasonic wave more truly.
Equation (10) suggests that the primary factor that impacts the change of coal wave velocity in the plastic deformation stage is strain. As the strain is on a rise, the wave velocity exhibits an exponential decrease, consistent with the research results of Zhao Mingjie [51]. Zhao Mingjie established an exponential relationship between rock strength and ultrasonic velocity based on damage mechanics. In addition, the results of Yang Sen [52] and Li Jian [53] show that the LWV decreases with the development of coal and rock damage. Zhang Zhibo et al. [54] also found through experimental research that the wave velocity decreases with the increase of stress, and the important factor affecting the change of UTV is the change of microcrack structure. This shows that the wave velocity of coal decreases in the propagation stage of micro-cracks, and the reason for the decrease of wave velocity can be caused by damage or stress increase. In this paper, the reason for the decrease of wave velocity is summarized as strain, which is due to the fact that the increase of coal damage and the propagation of micro-cracks are two expressions of the same result in the plastic deformation stage. Using strain can describe the change of wave velocity more realistically, and it is also easy to quantify the change of wave velocity.
According to Equations (7) and (10), the main influencing factors of wave velocity change of coal in the elastic deformation stage and plastic deformation stage are different. However, further analysis by combining Equations (7) and (10) unveils that porosity is still the fundamental factor influencing the wave velocity change of coal in the process of stress loading. Moreover, a good mathematical relationship exists between the change in coal porosity and the coal stress in the elastic deformation stage, confirming the stress as the primary factor that impacts wave velocity change in the elastic deformation stage. However, a relationship can be hardly established between the coal porosity change and stress in the plastic deformation stage, while a strain can establish a good relationship with the coal porosity change. Hence, the primary factor influencing coal wave velocity change in the plastic deformation stage is strain. This is the influence mechanism of the ultrasonic wave velocity change during the stress loading process. Equations (7) and (10) reveal the variations of ultrasonic velocity during coal stress loading more deeply and comprehensively, with better accuracy and applicability.

4.2. Analysis of Influencing Factors of Ultrasonic Propagation Energy Attenuation

Equations (17) and (18) describe the change in coal quality factor in the elastic deformation stage and plastic deformation stage, respectively. The calculated value of the quality factor is compared with the experimental value in Table 2 with the X-direction longitudinal wave as an example to verify the reliability of Equations (17) and (18). Meanwhile, the changing trend of the ratio of the quality factor in the process of stress loading is obtained (Figure 10 and Figure 11).
As observed in Figure 10, the ratio of the coal quality factor increases in the form of a power function with the increase in stress in the elastic deformation stage. At the end of the elastic stage, the coal quality factor ratio is about three times the initial time, and the calculated value meets the experimental value, reflecting the changing trend of the quality factor. Equation (17) reveals that the quality factor ratio shows relevance to the porosity and coal wave velocity. In the elastic deformation stage of stress loading, the wave velocity of coal increases, together with the decrease in porosity.
In Figure 11, the coal quality factor ratio decreases as the parabola forms with increasing loading steps during the plastic deformation phase. The coal quality factor ratio at the time of rupture is about 20% of that at the beginning of the plastic deformation phase. The calculated value conforms to the experimental value, implying the changing trend of the quality factor. Equation (18) illuminates that the quality factor ratio of coal is correlated with the coal porosity and wave velocity. In the plastic deformation stage of stress loading, the coal wave velocity decreases, and the porosity increases. Consequently, the quality factor ratio of coal decreases in the form of the parabola function.
Equation (17) suggests that the change of coal quality factor in the elastic deformation stage of coal during stress loading is related to stress. The reason is presented as follows. The porosity decreases with the increase in stress, and there is an acceptable mathematical relationship between the change in coal porosity and coal stress. This implies that the main factor influencing the coal quality factor in the elastic deformation stage is stress. Equation (18) demonstrates that the change in the coal quality factor in the plastic deformation stage is derived from strain. The reason is that the change in stress in the plastic deformation stage is difficult to reflect the change in porosity, and a good mathematical relationship can be established between strain and coal porosity. It is revealed that the main factor affecting the coal quality factor in the plastic deformation stage is strain.
As discovered by combining Equations (15)–(18), coal quality factor Q is inversely proportional to coal porosity φ4, and the fundamental factor affecting the coal quality factor is coal porosity. The change in coal porosity in the two stress loading stages are expressed by stress and strain, respectively. This is the influence mechanism of energy attenuation during ultrasonic propagation during stress loading.
Zhao Qiufang [55] and Zhang Pingsong [56] reported that the attenuation coefficient of the coal seam presented a logarithmical association with the porosity. Liang Yanxia et al. [57]. revealed that the quality factor presented a negative linear relationship with the porosity, while the coal quality factor (Q) is inversely proportional to the coal porosity (φ4) in our study. In other words, different researchers have different research results on the coal quality factor–coal porosity relationship. However, the general trend is consistent. Specifically, larger coal porosity indicates a smaller coal quality factor. Generally, the model established in the study based on the ultrasonic wave propagation theory covers the whole process of coal loading and has been verified by the experimental results with high accuracy and reliability.
Since the influence mechanism of ultrasonic dynamic parameters of coal is relatively complex, the relationship model between the ultrasonic attenuation coefficient and stress under loading conditions established in this paper is not perfect. The research results only reflect the variation law of the coal quality factor somewhat. Therefore, the attenuation law of coal ultrasonic should be further investigated in the future.

4.3. Relationship between the Stress–Strain State of the Coal and Ultrasonic Response Characteristics during Stress Loading

The relationship between the coal stress–strain state and ultrasonic response characteristics (ultrasonic velocity and quality factor) can be obtained (Figure 12) by analyzing the influencing factors of coal ultrasonic propagation during stress loading. Figure 12 illustrates that the stress–strain state of coal during stress loading falls into the elastic deformation stage and the plastic deformation stage. In the elastic deformation stage, the wave velocity and coal quality factor exhibit an increasing trend. They increase faster in the pore compaction stage, but increase more slowly in the linear deformation stage. In the plastic deformation stage, the two parameters decrease. They decrease slowly in the microcrack growth stage, but decrease rapidly in the coal destruction stage. Thus, the change in ultrasonic velocity and attenuation of energy have a significant corresponding relevance to the coal stress state, laying a theoretical foundation for the inversion of the stress state and its change trend through the change and attenuation of ultrasonic velocity.
The following is an application scenario. The working face is an area that possesses a high coal and gas outburst risk in coal mine production, and the high risk is obviously associated with the coal stress state. During the production process of the working face, the ultrasonic characteristics in the coal in front of the working face can be continuously monitored by drilling. The stress state and its change trend of coal are inversed by using the change and attenuation of ultrasonic velocity following the previous research results of this paper. When the ultrasonic speed slows down, the quality factor is reduced, and the stress has not reached the peak stress. Thus, the safety production status of the working face shall be analyzed, and necessary safety protection measures shall be taken to prevent the occurrence of coal mine safety production accidents.
Although the research conclusion of this paper is obtained under the condition of coal with a primary structure, it is also applicable to coal with other structure types. The difference is that the stress and strain process for the primary structure coal is significant during stress loading, and the process is gentle for the fragmented coal and mylonitic coal. As a result, the change in ultrasonic speed and the attenuation of energy are relatively weak, leading to the increased difficulty and requirements of identification. The research in this area will be strengthened in the future. Generally, the method proposed in the paper has a relatively broad application prospect and provides a new idea for inferring the stress state and change trend of coal in the working face, contributing to a positive significance for predicting and preventing the occurrence of mine disasters. Due to the limitation of experimental conditions, the number of coal samples and the range of coal samples selected in this paper are small, which have certain limitations. The ultrasonic response characteristics of loaded coal analyzed in the experiment are only general statistical laws. It is necessary to carry out experimental analysis on more coal samples in order to reduce accidental errors and obtain more accurate general ultrasonic response laws. This is also the direction that the author needs to work hard towards in the future.

5. Conclusions

(1)
The coal stress-loading process falls into the elastic deformation stage and the plastic deformation stage. In the process of stress loading, the ultrasonic velocity and the quality factor of the coal sample have the same variation law. In the elastic deformation stage, the ultrasonic velocity and quality factor of the coal sample increase as coal axial strain elevates; in the plastic deformation stage, coal samples’ axial strain continues to increase, while the ultrasonic velocity and quality factor significantly decline.
(2)
In the process of stress loading, the ultrasonic velocity and quality factor of the coal sample demonstrate strong anisotropy, and are smaller in the Z direction than those in the X and Y directions. The ultrasonic velocity and quality factor of the coal sample in the X and Y directions are similar and present the same variation law.
(3)
Coal porosity is the fundamental factor influencing the change in the coal wave velocity and coal quality factor. In the elastic deformation stage, the coal stress increases, and the porosity decreases; the coal wave velocity and coal quality factor both increase, and the coal attenuation coefficient decreases. It is revealed that the primary factor that impacts the coal wave velocity and coal quality factor is stress. In the stage of plastic deformation, the porosity increases as the coal strain is on a rise, the coal wave velocity and coal quality factor decreases, and the coal attenuation coefficient increases, suggesting that the main factor affecting coal wave velocity and coal quality factor was strain.
(4)
The wave velocity and coal quality factor rapidly increase in the pore compaction stage and slowly increase in the linear deformation stage. The wave velocity and coal quality factor slowly decrease in the stage of microcrack propagation, while the wave velocity and coal quality factor rapidly decrease in the stage of coal destruction. The stress–strain state of coal corresponds well to the ultrasonic response characteristics during the loading process.

Author Contributions

Conceptualization, G.X.; methodology, G.X.; validation, G.X. and C.W.; formal analysis, T.M.; investigation, Y.W.; writing—original draft preparation, G.X. and Y.W.; writing—review and editing, G.X. and T.M.; visualization, T.M.; supervision, H.J.; project administration, G.X.; funding acquisition, G.X. The published version of the manuscript has been read by and obtained the agreement of all authors. All authors have read and agreed to the published version of the manuscript.

Funding

This work was financially supported by the National Key Research and Development Program (2018YFC0807805), Natural Science Basic Research Program of Shaanxi (2019JM-072).

Institutional Review Board Statement

Not applicable.

Informed Consent Statement

Not applicable.

Data Availability Statement

Not applicable.

Acknowledgments

Many thanks to all the contributions and support given by the authors in preparing the writing of this article. Besides, thanks to the coal sample preparation provided by Shanxi Xinyuan Coal Co., Ltd. of Yangmei Group for this study.

Conflicts of Interest

The authors declare no conflict of interest.

References

  1. Cheng, L.; Wang, Y.; Zhao, H. Research status and prospect of acoustic characteristics of coal and rock. Adv. Geophys. 2013, 28, 452–461. [Google Scholar] [CrossRef]
  2. Karimaei, M.; Dabbaghi, F.; Dehestani, M.; Rashidi, M. Estimating Compressive Strength of Concrete Containing Untreated Coal Waste Aggregates Using Ultrasonic Pulse Velocity. Materials 2021, 14, 647. [Google Scholar] [CrossRef] [PubMed]
  3. Wang, B.; Hao, J.; Liu, S.; Zhou, F.; Zhang, Z.; Zhang, H.; Sun, H. Experimental Study on the Effect of Gas Pressure on Ultrasonic Velocity and Anisotropy of Anthracite. Geofluids 2019, 2019, 3183816. [Google Scholar] [CrossRef]
  4. Kim, W.; Jeong, K.; Lee, T.; Park, S. A Study on Correlation between Ultrasonic Pulse Velocity Method and Coarse Aggregate for Estimating Residual Modulus of Elasticity of Concrete Exposed to High Temperatures. Appl. Sci. 2022, 12, 6644. [Google Scholar] [CrossRef]
  5. Krzesinska, M. Averaged Structural Units in Bituminous Coals Studied by Means of Ultrasonic Wave Velocity Measurements. Energy Fuels 2001, 15, 930–935. [Google Scholar] [CrossRef]
  6. Kong, X.; He, D.; Liu, X.; Wang, E.; Li, S.; Liu, T.; Ji, P.; Deng, D.; Yang, S. Strain characteristics and energy dissipation laws of gas-bearing coal during impact fracture process. Energy 2022, 242, 123028. [Google Scholar] [CrossRef]
  7. Solís-Carca1o, R.; Moreno, E. Evaluation of concrete made with crushed limestone aggregate based on ultrasonic pulse velocity. Constr. Build. Mater. 2008, 22, 1225–1231. [Google Scholar] [CrossRef]
  8. Zhao, M. Research status and prospect of rock acoustic characteristics. J. Chongqing Jiaotong Univ. 2000, 19, 81–83. [Google Scholar] [CrossRef]
  9. Shea, V.; Hanson, D.; Dai, S. Determination of different stages of loading and failure of coal samples by elastic wave velocity and attenuation. Adv. Geophys. 1990, 5, 94–102. [Google Scholar]
  10. Meng, Z.; Zhang, J. Joachim Tiedemann: Relationship between rock physical and mechanical parameters of coal measures and acoustic velocity. J. Geophys. 2006, 49, 1505–1510. [Google Scholar] [CrossRef]
  11. Zhai, X. Study on Ultrasonic Characteristics of Rock under Uniaxial Loading; Chengdu University of Technology: Chengdu, China, 2008. [Google Scholar]
  12. Zhao, M.; Wu, D. Ultrasonic classification and strength prediction of engineering rock mass. J. Rock Mech. Eng. 2000, 19, 89–92. [Google Scholar]
  13. Guo, D.; Han, D.; Feng, Z. Experimental study on wave velocity characteristics of tectonic coal under confining pressure. Coal Sci. Technol. 1998, 4, 22–24. [Google Scholar] [CrossRef]
  14. Zhou, F. Experiment on the influence of cracks on the ultrasonic velocity of coal and rock-taking -Carboniferous coal seam in Qinshui Basin as an example. Coalf. Geol. Explor. 2012, 40, 71–74. [Google Scholar] [CrossRef]
  15. Tong, J.; Yang, D.; Li, Z.; Ren, H.; Wang, Z. Experimental analysis of coal seam wave velocity under different confining pressures. Coal Mine Saf. 2017, 48, 49–52. [Google Scholar] [CrossRef]
  16. Yan, L. Study on the wave velocity characteristics of coal and rock in Yangzhuang Coal Mine and its relationship with strength. Coal Sci. Technol. 2006, 34, 57–60. [Google Scholar] [CrossRef]
  17. Wu, J.; Jiang, Z.; Fan, C.; Lin, F. Study on wave velocity measurement of coal seam tensile strength. J. Geotech. Eng. 2005, 27, 999–1003. [Google Scholar] [CrossRef]
  18. Li, Q.; He, J.; Chen, J. Simultaneous ultrasonic experiment of dynamic and static elastic parameters of coal under formation pressure conditions in Qinshui Basin. Chin. J. Geophys. 2017, 60, 2897–2903. [Google Scholar] [CrossRef]
  19. Adam, L.; Van Wijk, K.; Otheim, T.; Batzle, M. Changes in elastic wave velocity and rock microstructure due to basalt-CO2-water reactions. J. Geophys. Res. Solid Earth 2013, 118, 4039–4047. [Google Scholar] [CrossRef] [Green Version]
  20. Engelder, T.; Plumb, R. Changes in situ ultrasonic properties of rock on strain relaxation. Int. J. Rock Mech. Min. Sci. 1984, 21, 75–82. [Google Scholar] [CrossRef]
  21. Nur, A. Effects of access on velocity anisotropy in rocks with cracks. Rock Mech. Eng. Geol. 1971, 76, 2002–2034. [Google Scholar] [CrossRef]
  22. Zheng, G.; Zhao, X.; Liu, J.; Li, Y. Experimental study on change in acoustic wave velocity when rock is loading. J. Northeast. Univ. 2009, 30, 1197–1200. [Google Scholar] [CrossRef]
  23. Liu, X.; Wang, X.; Wang, E.; Liu, Z.; Xu, X. Study on ultrasonic response to mechanical structure of coal under loading and unloading condition. Shock Vib. 2017, 2017, 7643451. [Google Scholar] [CrossRef]
  24. Chen, Z. Stress Strain Ultrasonic Response Characteristics of Coal during Loading; Henan Polytechnic University: Jiaozuo, China, 2018. [Google Scholar]
  25. Close, J. Natural fracture in coal. In Hydrocarbons from Coal; Law, B.E., Rice, D.D., Eds.; AAPG: Tulsa, OK, USA, 1993; Volume 38, pp. 119–132. [Google Scholar]
  26. Walker, L. Desities, porposites and surface area of coal macerals as measured by their interaction with gases, vapours and liquids. Fuel 1988, 67, 1615–1623. [Google Scholar] [CrossRef]
  27. Wang, Y. Basic Research on the Deformation and Rupture Microwave Radiation Law of Loaded Coal Body and Its Mechanism. Ph.D. Thesis, China University of Mining and Technology, Beijing, China, 2008. [Google Scholar]
  28. Wang, X.; Asem, P.; Chen, H.; Labuz, J. Microcracking in tensile fracture of a brittle rock. Eng. Fract. Mech. 2021, 251, 1–16. [Google Scholar] [CrossRef]
  29. Li, X.; Nie, B.; Yang, C.; Mao, Y. Experimental study on the variation law of sound wave velocity during coal loading. Coal Mine Saf. 2016, 47, 3–16. [Google Scholar] [CrossRef]
  30. Lu, P.; Shen, Z.; Zhu, G.; Fang, E. Permeability characterization and experimental study in the whole process of stress and strain of rock samples. J. Univ. Sci. Technol. China 2002, 32, 678–684. [Google Scholar] [CrossRef]
  31. Tao, Y.; Xu, J.; Cheng, M.; Li, S.; Peng, S. Theoretical analysis and experimental study on permeability of coal containing gas. J. Rock Mech. Eng. 2009, 28, 3363–3370. [Google Scholar] [CrossRef]
  32. Yang, T.; Tang, C.; Zhu, W.; Feng, Q. Coupling analysis of seepage and stress in rock fracture process. J. Geotech. Eng. 2001, 23, 489–493. [Google Scholar] [CrossRef]
  33. Yang, T.; Xu, T.; Liu, J.; Tang, S.; Yu, Q.; Shi, B. Stress-damage-seepage coupling model and its application in deep coal seam gas pressure relief practice. Chin. J. Rock Mech. Eng. 2005, 24, 2900–2905. [Google Scholar]
  34. Kong, X.; Wang, E.; Li, S.; Lin, H.; Xiao, P.; Zhang, K. Fractals and Chaos Characteristics of Acoustic Emission Energy about Gas-Bearing Coal During Loaded Failure. Fractals 2019, 27, 5. [Google Scholar] [CrossRef]
  35. Liu, C.; Jing, H.; Fang, L.; Xu, M. Theoretical study on acoustic attenuation model of gas pipeline leakage. Vib. Shock 2018, 37, 109–114. [Google Scholar] [CrossRef]
  36. Urick, R. The absorption of sound in suspensions of irregular particles. J. Acoust. Soc. Am. 1948, 20, 283. [Google Scholar] [CrossRef]
  37. O’Connell, R.J.; Budiansky, R. Seismic velocities in dry and saturated cracked solids. J. Geophys. Res. 1974, 79, 5412–5425. [Google Scholar]
  38. He, Y.; Ma, X. Modern Physics Experiment; Tsinghua University Publishing House: Beijing, China, 2003; pp. 198–206. [Google Scholar]
  39. Wu, X. Study on Acoustic Velocity and Its Related Properties in Petroleum Fluid; Institute of Geophysics, Chinese Academy of Sciences: Beijing, China, 2000. [Google Scholar]
  40. RaiC, S.; Hanson, K. Transverse-wave velocity anisotropy in sedimentary rock: A laboratory study. Geophysics 1988, 53, 800–806. [Google Scholar] [CrossRef]
  41. GB/T19222-2003; Coal and Rock Sampling Methods. China Standards Publishing House: Beijing, China, 2003.
  42. GB/T30050-2013; Coal Structure Classification. China Standards Publishing House: Beijing, China, 2013.
  43. Yale, D. Recent advances in rock physics. Geophysics 1985, 50, 2480–2491. [Google Scholar] [CrossRef]
  44. Meng, Z.; Liu, C.; He, X. Experimental analysis on acoustic velocity of coal measures rocks and its influencing factors. J. Min. Saf. Eng. 2008, 25, 390–394. [Google Scholar] [CrossRef]
  45. Li, Q.; He, J.; Li, C. Study on the relationship between compressional and shear wave velocities and formation pressure of coalbed methane reservoirs in Qinshui Basin. Geophys. Geochem. Calc. Technol. 2013, 35, 382–385. [Google Scholar] [CrossRef]
  46. Dong, S.; Wu, H.; Li, D.; Huang, Y. Experimental study of ultrasonic velocity and anisotropy in coal samples. J. Seism. Explor. 2016, 25, 131–146. [Google Scholar]
  47. Sun, X.; Chen, G.; Li, J.; Xu, X.; Fu, S.; Xie, J.; Liang, L. Propagation characteristics of ultrasonic P-wave velocity in artificial jointed coal briquettes. J. Geophys. Eng. 2020, 5, 827–837. [Google Scholar] [CrossRef]
  48. Zhang, L.; Zhang, Z.; Zhang, R.; Gao, M.; Xie, J. The Ultrasonic P-Wave Velocity-Stress Relationship and Energy Evolution of Sandstone under Uniaxial Loading-Unloading Conditions. Hindawi Ltd. 2021, 2021, 9921716. [Google Scholar] [CrossRef]
  49. Yu, H.; Zhang, Y.; Lebedev, M.; Wang, Z.; Li, X.; Squelch, A.; Verrall, M.; Lalauer, S. X-ray micro-computed tomography and ultrasonic velocity analysis of fractured shale as a function of effective stress. Mar. Pet. Geol. 2019, 110, 472–482. [Google Scholar] [CrossRef]
  50. Cao, A.; Dou, L.; Cai, W.; Gong, S.; Liu, S.; Jing, G. Case study of seismic hazard assessment in underground coal mining using passive tomography. Int. J. Rock Mech. Min. Sci. 2015, 78, 1–9. [Google Scholar] [CrossRef]
  51. Zhao, M. Study on Acoustic Characteristics of Fractured Rock Mass under Loading; Chongqing Jiaotong University: Chongqing, China, 1998. [Google Scholar]
  52. Yang, S.; Zhang, N.; Feng, X.; Kan, J.; Pan, D.; Qian, Q. Experimental Investigation of Sandstone under Cyclic Loading: Damage Assessment Using Ultrasonic Wave Velocities and Changes in Elastic Modulus. Shock Vib. 2018, 2018 Pt 3, 1–13. [Google Scholar] [CrossRef]
  53. Li, J.; Wang, H.; Zhang, Q. Progressive damage and fracture of biaxially-confined anisotropic coal under repeated impact loads. Int. J. Rock Mech. Min. Sci. 2022, 149, 4979. [Google Scholar] [CrossRef]
  54. Zhang, Z.; Wang, E.; Liu, X.; Zhang, Y.; Li, S.; Khan, M.; Gao, Y. Anisotropic characteristics of ultrasonic transmission velocities and stress inversion during uniaxial compression process. J. Appl. Geophys. 2021, 186, 104274. [Google Scholar] [CrossRef]
  55. Zhao, Q. Test and Research on Seismic Wave Parameters of Coal Seams; Anhui University of Science and Technology: Huainan, China, 2005. [Google Scholar]
  56. Zhang, P.; Liu, S.; Zhao, Q.; Guo, L. Analysis of attenuation characteristics and quality factors of coal seams in Huainan Mining Area. Coal Sci. Technol. 2006, 5, 83–85. [Google Scholar] [CrossRef]
  57. Liang, Y. Experimental Study on Ultrasonic and Pore Change Characteristics of Loaded Coal Containing Water; Henan Polytechnic University: Jiaozuo, China, 2020. [Google Scholar]
Figure 1. Stress–strain curve of coal.
Sustainability 15 01093 g001
Figure 2. Working principle of low-frequency rock physics measurement device.
Sustainability 15 01093 g002
Figure 3. Schematic diagram of coal cleat and bedding.
Sustainability 15 01093 g003
Figure 4. Physical drawing of coal sample.
Sustainability 15 01093 g004
Figure 5. Relationship between coal sample wave velocity and axial strain during stress loading: (a) X and Y directions; (b) Z direction.
Sustainability 15 01093 g005
Figure 6. The axial strain-quality factor relationship of coal sample during stress loading: (a) X and Y directions; (b) Z direction.
Sustainability 15 01093 g006
Figure 7. Relationship between coal sample wave velocity and coal sample quality factor during stress loading: (a) X and Y directions; (b) Z direction.
Sustainability 15 01093 g007
Figure 8. Experimental and calculated values of LWV of coal in the X-direction during the elastic deformation stage.
Sustainability 15 01093 g008
Figure 9. Experimental and calculated values of LWV of coal in the X-direction during the plastic deformation stage.
Sustainability 15 01093 g009
Figure 10. Experimental and the calculated values of quality factor ratio in the elastic deformation stage.
Sustainability 15 01093 g010
Figure 11. Experimental and the calculated values of quality factor ratio in the plastic deformation stage.
Sustainability 15 01093 g011
Figure 12. Relationship between the stress–strain state of the coal and the ultrasonic response characteristics.
Sustainability 15 01093 g012
Table 1. Statistics of parameters of processed coal samples.
Coal Sample NumberCoal Structure TypeLength
(mm)
Diameter
(mm)
Fracture DevelopmentRo,maxVdaf
(%)
Bulk Density
(t/m3)
Porosity
(%)
Modulus of Elasticity (MPa)Poisson’s Ratio
IX1Primary structural
coal
100.050.1The bedding is clear without obvious cracks.1.8615.71.433.515000.3
IY199.949.9
IZ1100.150.1
Table 2. Test results of ultrasonic velocity, axial strain, and quality factor of coal samples under uniaxial stress loading.
Loading
Step
Axial Stress
(MPa)
P-Wave Velocity
(m·s−1)
S-Wave Velocity
(m·s−1)
Axial Strain
(10−4)
Quality Factor QpQuality Factor Qs
X, YZXYZXYZXYZXYZXYZ
10019251886162310569598070000.29540.28460.25410.25410.24890.2182
20.40.52114201317851129113110568.56218.156210.32160.48230.41240.40150.47650.47950.3695
30.9122362205197311501262117410.56899.156413.16840.65690.63860.59120.60710.60250.6128
41.51.522802342200312961364120313.641512.615614.12350.76140.77830.69620.72150.70540.7218
52.22.123122341201613041352122215.950114.820416.26050.79620.78930.73160.74280.71990.7356
62.92.823562364205313561379121816.785116.692517.36940.81240.82010.73560.75940.72590.7398
73.63.723922368212313751378123018.965417.165118.20680.82380.81580.74650.78160.74670.7695
84.24.123852395207313621396120119.625816.260919.26540.84170.81960.72560.81190.76920.7512
94.94.223992384204813961403118220.604117.165624.36540.85140.82140.70260.83640.76970.7435
105.84.324162399204613811399117422.235418.156127.36910.86320.83090.58650.85160.79270.5216
116.61.72434241215081408141676523.635120.165635.36140.88630.82180.13690.86320.79830.1689
126.8241523561327137527.624820.25180.73120.72690.74150.6662
136.9238723101305134328.069523.63250.61240.62140.65890.5918
147.2234722961321130028.956225.16590.51640.5140.53210.5238
151.51743169589386435.860134.86610.19840.15410.16310.1578
Disclaimer/Publisher’s Note: The statements, opinions and data contained in all publications are solely those of the individual author(s) and contributor(s) and not of MDPI and/or the editor(s). MDPI and/or the editor(s) disclaim responsibility for any injury to people or property resulting from any ideas, methods, instructions or products referred to in the content.