Abstract
Water shortages are currently becoming a more global than local issue. This paper aims to demonstrate a complex, universal urban water reuse system, allowing for a reduction of freshwater withdrawal. Opportunities for improvement were analyzed in the categories of municipal services: power and heat production, greenery irrigation, landscaping, street and public transport fleet cleaning. Technical possibilities were coupled with current international legislative requirements. Two scenarios for universal, complex water reuse systems in the municipal area were evaluated, including all essential city services. Results of the case study show that ozonation and filtration of treated wastewater should be sufficient to obtain the desired water quality for urban purposes. Current legislation mainly addresses agricultural water reuse, so their requirements should be adjusted to assess the water quality needed for other applications. When water is used in public spaces, constant monitoring for the presence of pathogens should be maintained due to the risk of human exposure. A life cycle assessment was conducted to evaluate the environmental impacts associated with the topic of water transportation in urban areas, which is infrequently considered in such studies. Two scenarios including different means of transport were compared. It was shown that with constant daily operation, it is necessary to build an independent water network, since the environmental impact of water delivery by tank lorries increases substantially.
1. Introduction
Water shortages are often associated with the countries located in subtropical zones, such as those in Sub-Saharan Africa [1], the West coast of North [2] and South America [3], or Central Asia [4]. The situation in these areas requires immediate action. However, the public eye tends to omit that water stress also occurs in the countries located in the North, i.e., in Europe [5]. Moreover, compared to previous decades, less frequent precipitation during the year and more frequent heatwaves during summers only serve to worsen the situation [6].
To minimize freshwater withdrawal, water-scarce countries have implemented various methods, i.e., rationing [7], education on resources protection [8], or advanced irrigation systems [9]. They have also introduced direct solutions, such as clean water production from unconventional sources. These include desalination [10] or direct and indirect reuse from wastewater [11]. The latter is a promising option due to its versatility and lower cost compared with the first method [12].
Various studies have already been done on water reuse systems applications, where a more significant number focus on use in agriculture [13,14]. It is already regulated by regional polices [15], and it has been recently regulated internationally by European law [16]. Another widely commented topic involves potable water reuse [17,18,19]. This case is being studied not only as a technical, but also as a social issue [20]. More recently, industrial water recycling has been discussed by researchers, since manufacturing processes sometimes need abundant amounts of water to operate [21,22,23].
In general, cities require a large amount of water for public services such as, power and heat production, cleaning of streets and public transport fleet, sewage network flushing, greenery irrigation, landscaping, etc. However, research on water reclamation for urban purposes is not as widespread as other applications. Lee and Jepson [24] previously reviewed the literature published on urban water reuse between 2010 and 2019, identifying 39 articles, most of which focused solely on policy-making and socio-economic issues. In South Africa, few municipalities have successfully implemented water reuse systems for urban purposes, including landscaping, sports fields irrigation and industrial purposes [25]. Similarly, over 80% of total reclaimed water is used in China for landscaping and industrial applications [26]. Ramaiah et al. [27] studied the reliability of urban green space irrigation with reclaimed water. Additionally, Cherchi et al. [28] reviewed the application of water reuse in the power production sector in the US, presenting 11 successful operating installations. Some studies have also been carried out on water reuse system modeling and planning [29]. The environmental impacts of water reclamation techniques are defined using life cycle assessment analysis (LCA). Studies in the scope of water reuse usually are treatment technology-oriented or application-oriented. Papers that target wastewater treatment technologies [30,31,32] or single processes [33,34] can be found. A significant number of studies address irrigation application [35,36] or industrial application [37].
Most of the previous works focus on a complete analysis of a single application or a variety of methods, but analyzed one criterion. Only a few authors have investigated the topic in the scope of quality and quantity, also considering legislative issues. Municipal wastewater reuse in metropolitan areas also needs more feasibility and environmental impact studies. This paper uses a complex approach to evaluate urban water reclamation systems. It gathers all mentioned problems: the quality and quantity of the available wastewater together with current local and international policies in force, and the required infrastructure. Different application methods were considered, and deliberations were carried out to present the most optimal scenarios for the implementation of the water reuse system. Furthermore, the topic of public transport fleet cleaning was developed using comparative life cycle assessment, discussing the environmental effects of suggested solutions. It was possible to perform the analysis for this water reuse application due to the constant water demand throughout the year and fixed delivery routes. In this case, a water delivery step was considered. It is worthy of note that the delivery step is often neglected in the research, but in cases of water transport within a large metropolitan area, it has a significant contribution and should be considered. Simultaneously, there is also a lack of studies that include the comparison of results as a function of time. This provides another perspective to an overall evaluation, contrary to the independent comparison of results. Poland’s capital city, Warsaw, served as an example for this study.
2. Materials and Methods
2.1. State of Wastewater Management in Example Location
Warsaw’s wastewater collection and treatment system has a capacity of over 2,000,000 P.E. per day. Sewage is treated by four wastewater treatment plants (WWTP) spread throughout the city and its suburbs. The biggest plant is called “Czajka” and is located in the North, and the second one is “Południe” on the South. Two other smaller plants are located in the suburbs: “Pruszków” in the West and “Dębe” in the Northeast. [38,39]. The total volume of wastewater treated in the municipal area of Warsaw every day is approx. 518,000 m3 and almost all of it is discharged into the Vistula, Utrata and Narew rivers. Czajka and Południe have served as the exemplary WWTPs in this study, representing two different sizes of facilities. Pruszków and Dębe were omitted from this analysis since they do not lay within Warsaw’s city territory.
To examine the opportunity for water recycling, first, the quantity and quality of treated wastewater was analyzed (Table 1, see also: Figure S1). The time span was 5 years—from 2017 to 2021 [40,41]. Wastewater samples were collected in the discharge collection canal at the end of the treatment system, in different frequencies, totaling approx. 30 to 130 measurements per indicator (Figures S2–S9). High values of BOD and suspended solids on certain days may have been caused by heavy rainfall, which flushed larger volumes of organic matter from the roads into the sewage system in a short time, resulting in higher standard deviations for those indicators.

Table 1.
Average values of indicators and their frequencies of measurement for Czajka and Południe WWTPs.
2.2. Current State of Water Recycling at Warsaw’s WWTPs
At the moment, the small part of the effluents from WWTPs is only used for the internal purposes of the plants (Table 1), i.e., to clean and cool the machinery, rinse the screens, water the greenery inside the plant territory, or as fire protection. Treated wastewater is disinfected with sodium hypochlorite prior to use. The available data on effluent recycling was measured between 2015 and 2019. The water recycling rate did not exceed 1 percent at Czajka WWTP and equaled 2.2 percent at Południe WWTP (Figure 1).
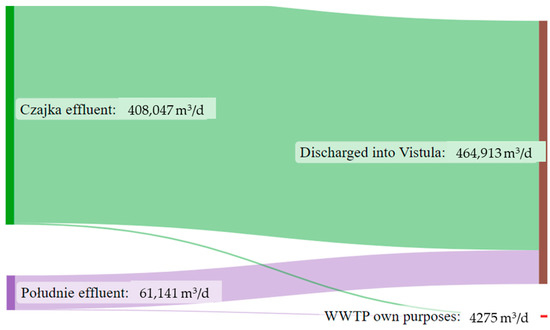
Figure 1.
Current treated wastewater distribution in Warsaw metropolitan area.
2.3. Current State of Water Demand for Power Production
Approximately 95% of the power in Warsaw is generated by coal power plants (PPs) [42], which use excessive amounts of water for heat production, cooling and the overall operation process [43]. Two large coal PPs within Warsaw’s area have served as examples in this study. They are known as Siekierki and Żerań, and they currently use raw water that comes directly from the Vistula River. Its desired quality is achieved at the water treatment plants located at each facility. Treatment processes include coagulation, filtration and ion exchange. Purified water circulates a few times through the power generation system and is discharged back into the river after reaching a specific temperature. The quantities of water withdrawal and wastewater discharge for both PPs are shown in Table 2 [44]. The application of a water reuse system from municipal wastewater was examined to minimize the abundant water flux exchange in the Vistula. To assess which water source would require less treatment, the quality of the Czajka and Południe effluents and Vistula surface water in central Warsaw (the water source for Siekierki and Żerań) were compared (Table 3, see also: Table S1).
Table 2.
Average water and wastewater fluxes between PPs and Vistula in Warsaw between 2018 and 2021.
Table 3.
Average values of quality indicators in the Vistula River in comparison with quality indicator values in the Czajka and Południe WWTPs.
2.4. Current State of Landscaping and Street Cleaning in Example Location
Greenery in municipal areas is usually spread throughout the city, and the frequency of irrigation differs between years, depending on the age of the plants or the weather. Water is delivered to each location mainly by water carts during night hours [45]. Landscaping in the metropolitan area also includes pond and fountain maintenance. Larger ponds are usually filled with river water, but fountains have to operate using clean, filtered water to avoid the risk of clogging and biofilm overgrowth. Due to the decentralization of water applications, its seasonality and varying planting throughout the years, no public data is available on the total water demand for landscaping in Warsaw. Because of that, the implementation of a water recycling system was considered in the scope of quality, not quantity. Minimal water quality requirements were defined based on WHO guidelines for the safe use of wastewater [46] and the only regulation on water reuse currently applicable in Poland is Regulation (EU) 2020/741 of the European Parliament and of the Council of 25 May 2020 on minimum requirements for water reuse [47]. This legislation mainly regulates agricultural use. However, Annex I, Section 1 suggests that this practice can also be implemented for amenity-related and environmental purposes. Based on that, guidelines for water reclamation practices were presented.
All 1300 km of public roads within the city’s territory are cleaned approximately once a week during night hours from spring to late autumn. In 2020 and 2021, during summer maintenance and the emptying of public pools, water was not discharged into the sewage system. Instead, it was collected by cisterns and used for street cleaning [48,49]. On average, one cubic meter of water is needed to clean 1 km of road [50], which equals almost 191 m3 of water required per day in Warsaw. Due to a lack of information on current water sources other than pool water, it was assumed that tap water is used during the rest of the year. Water reuse adaptation was considered as an alternative source, and minimum quality requirements were suggested.
2.5. Current State of Public Transport Fleet and Its Cleaning in Example Location
The public transportation fleet in Warsaw includes 1665 buses, 730 trams and 75 metro trains in total, from which 89% of buses, 58% of trams and 72% of metro trains operated daily in 2020 and 2021 [51,52]. At the end of the workday, each vehicle parks for the night in its assigned depot, as shown in the table (Table 4).
Table 4.
Public transport depots in Warsaw and its vehicles in operation [53].
According to service workers, all operating vehicles are cleaned frequently during this break in special carwashes at each depot. The buses and trams are cleaned from the outside after every day of operation [54], and the metro trains are cleaned once every two weeks [55]. The amount of water used to clean one vehicle depends on the duration of the process, and no specific data for the city of Warsaw could be found. For the purposes of this study, this amount was evaluated based on the literature and data available online. According to the India’s vehicle washing systems manufacturer [56], manual washing consumes 0.4 to 0.6 m3 of water per bus, whereas an automatic carwash uses only 0.1 to 0.25 m3 per bus. Almeida et al. [57] estimated an average consumption in Sao Paulo of 0.4 m3 per bus. Similar estimations have been made by the Spanish vehicle wash and care company [58] that are equal to 0.3 m3 per bus. The same manufacturer also estimated the amount of water needed to wash a metro as 0.871 m3 per train. This correlates with the information provided by the operators of Warsaw’s metro that one washing cycle consumes 0.8 to 0.9 m3 of water [55]. Data on water consumption by trams is lacking, but a report from another big polish city, Wrocław [59], indicates that approx. 0.1 m3 is needed by one tram if the system uses internal water recycling. Considering that trams in Warsaw are 20 to 30 m long, and the metro train is 120 m long, it was calculated, that a tram would demand 0.14 to 0.21 m3 for one wash. Bus and tram wash service providers in Warsaw confirm that systems installed in the city are characterized by internal water recycling. Only a portion of tap water is used in each washing cycle [60]. Based on all reports, it was assumed that a bus consumes 0.1 m3, a tram 0.14 m3, and a metro 0.85 m3 of water per wash.
2.6. Scenarios of Reused Water Delivery
The daily water demand for each depot was calculated based on the number of vehicles parked for the night at each depot and the frequency of them being washed. The possibility of using treated wastewater as an alternative source was studied, evaluating two scenarios for its delivery. The first one was to deliver the effluent to each depot from its nearest WWTP by tank lorries daily. It was assumed that during each day, the lorries would tank the tertiary treated and disinfected effluent from either of the two WWTPs (Czajka or Południe), deliver it to corresponding depots for the night wash, and that they would return to the designated WWTPs afterwards. The distance both ways between the nearest facilities and depots in Warsaw was measured using Google Maps (Table 5).
Table 5.
Daily water demand and tank lorry delivery system details for each depot.
The second suggested scenario for treated wastewater delivery was to construct an independent piping system to deliver tertiary treated and disinfected effluent from WWTPs to the depots. Based on the map of the example location, the network was preliminarily designed (Figure 2). The conduits were assumed to be placed alongside the roads at the shortest distance possible. The total length of the network was 50.2 km. The blue network would supply five depots with one WWTP effluent—Czajka (four on the right and one on the left side of the river) and have a length of 27.3 km. The dark red network would supply six depots with a second WWTP effluent—Południe, on the left side of the river, with a length of 22.9 km.
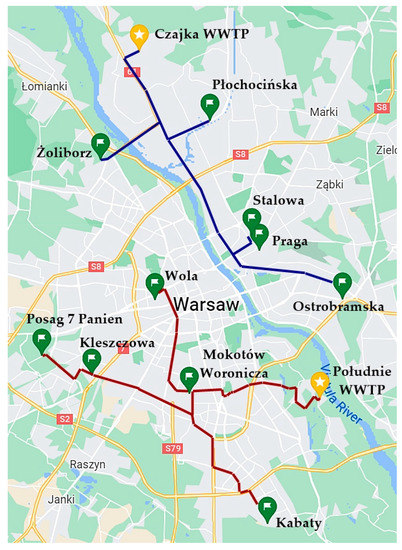
Figure 2.
Proposed design of two water networks delivering reused water to the depots 1; 1 Source: Google, 2022.
The life cycle assessment for suggested scenarios was carried out. The main purpose of defining two scenarios was to compare technological options in their environmental impacts [61]. The comparison of results for different impact categories allowed to evaluate how long it would take for the second scenario to have a lower environmental impact than the first scenario. An LCA was carried out in the openLCA 1.11.0 program. The data inventory was based on the ELCD 3.2. and OzLCI2019 databases, used previously for water reuse case studies in China [62] and Australia [63]. The impact assessment method used in the calculation was the CML-IA baseline. This is an update of CML 2000 methodology, which is based on the ISO standards 14040:2006 and 14044:2006. It is widely used in water reuse-related studies [64,65,66,67].
The first scenario aimed to demonstrate the environmental impact of a one-day delivery system operation by tank lorries. The product system included two types of vehicles: large lorries—represented by the process “Articulated lorry transport, Euro 0, 1, 2, 3, 4 mix, 40 t total weight, 27 max payload—PL” and medium lorries, represented by the process “Lorry transport, Euro 0, 1, 2, 3, 4 mix, 22 t total weight, 17.3 max payload—PL”. The system’s quantitative reference was 211 m3 of delivered effluent, 126 m3 by large and 85 m3 by medium lorry, as it was previously proven that longer, heavier vehicles are characterized by lower environmental impacts than the smaller ones [68].
The second scenario aimed to demonstrate the environmental impact of new water network construction, as presented in Figure 2. The product system included pipe manufacturing and ground excavation work. Other processes, like pipe delivery, etc. were omitted to simplify the analysis. It was assumed that the entire network would be constructed similarly to the water network in the Warsaw metropolitan area, using PVC pipes of 100 mm diameter (100 mm uPVC 1.67 kg/m length Conduit Pipe—PL). The trench had a rectangular cross-section, with 1.5 m depth and 1.0 m width. Based on the average ground density over the Warsaw area, it was calculated that 1 m of the trench would require excavating 2550 kg of ground. The excavation process was represented by “Excavator, technology mix, 100 kW, Construction—GLO”. The system’s quantitative reference was 50.2 km of the constructed network.
3. Results
3.1. Opportunities for Water Reuse in Power Production
Two main surface water purification processes are coagulation and ion exchange. At the exemplary PPs, they are carried out in clarifiers and ion exchange beds, respectively. Both processes require a constant power supply and the dosing of chemical reagents such as flocculants, polyelectrolytes, lime, base or acid [69]. Water withdrawn by PPs from the river always has to be treated prior use. The suggested solution was to maintain the current operation of water treatment plants at the facilities and only replace the water source with treated wastewater from the WWTPs.
Eight quality indicators for Vistula water and exemplary effluents (Czajka and Południe) were compared (Table 6). It was observed that two indicators were significantly lower in treated wastewater than in river water. One was suspended solids −79% lower in Czajka effluent and 83% lower in treated wastewater from Południe. Assuming the replacement of the entire water flux with treated wastewater, the coagulation time could be shortened considerably. This would indicate a savings in power and reagent consumption, reaching as much as 80% at the coagulation step. Higher total phosphorus and nitrogen values in treated wastewater should not cause a legislative problem, since their maximum concentrations are not mentioned in the cooling water regulation. Phosphorus is also mainly removed during coagulation.
Table 6.
Percentage relation of average quality indicators between WWTPs effluent and Vistula river water.
Water reclamation using ion exchange has already been successfully adopted, i.e., in Florida [70] and India [71]. Sulphate and chloride concentrations in analyzed WWTPs effluents were two to four times higher than in river water. The replacement of the water source would cause the quicker exhaustion of ion beds, leading to higher power and reagent consumption for regeneration. Based on the results, it is impossible to unequivocally state that the implementing of water reuse practices in power production would be economically and environmentally beneficial when only considering the provided data. Further research would have to be carried out to show which application would bring a higher reduction of power and reagents consumption—quicker coagulation or the less frequent regeneration of ion exchange beds.
3.2. Opportunities for Water Reuse in Landscaping and Street Cleaning
The possibility of tanking the water carts with treated wastewater instead of tap water was analyzed. Water quality requirements were considered, since they were recognized as the most crucial issue in reuse for landscaping and greenery irrigation, where direct human exposure to reclaimed water can occur. Currently, there are no local laws in force targeting water reuse in Poland, so the only legislation that regulates its adaptation is the one issued by the European Parliament in May 2020 [47]. It focuses on agricultural reuse, but reuse for amenity-related and environmental purposes is also encouraged. The regulation divides crops into four classes, depending on the minimum required reclaimed water quality. Public greenery isn’t harvested, so it could be included in the lowest class D (industrial, energy and seeded crops).
Other standards that should also be considered are WHO guidelines for the safe use of wastewater. They include health-based targets for wastewater use in agriculture, divided by the type of irrigation. In the analyzed case, the most suitable type would be labor-intensive restricted irrigation. The standard parameters listed in both documents are summarized in Table 7.
Table 7.
Minimum requirements and parameters for irrigation with treated wastewater.
Both analyzed WWTPs effluents have much lower TSS and BOD5 than indicated in the EU Regulations. The presence and concentration of bacteria, pathogens and Helminth eggs should be defined, especially since pressurized watering with a hose causes the forming of aerosols. Due to close contact with landscaping workers and pedestrians, effluent disinfection should always be considered prior to use. Disinfection would also be necessary if wastewater was used for other landscaping purposes, like fountains or ponds. To minimize the risk of piping system clogging, it should also be checked if wastewater needs filtration to remove the remaining suspended solids.
Water reuse in street cleaning at the example location has been adapted only during the summer when used pool water was recycled. However, each pool is emptied only once per year, so this solution is not universal. In this case, according to EU Regulations, WWTP effluent could also be used for cleaning instead of tap water. An amount of 191 m3 of water saved per day on street cleaning equals the daily freshwater demand of approx. 1340 people [73]. This solution presents great potential with minimal investment. Similarly to water for irrigation, treated wastewater would have to be disinfected before being tanked into cleaning vehicles.
3.3. Opportunities for Water Reuse in Public Transport Fleet Cleaning
The cleaning of public transport vehicles creates yet another opportunity for water reuse implementation. Internal water reuse systems were described previously by Canales et al. [74], Panizza and Cerisola [75], and Hamada and Miyazaki [76]. Since carwashes already have internal water recycling with their own pollution separation systems, WWTP effluent could be used without any tertiary treatment except disinfection to minimize the risk of bacterial exposure in forming aerosols. The daily amount of water required for the cleaning of buses, trams and metro trains in the analyzed metropolitan area is around 211 m3, which equals the daily freshwater demand of approx. 1475 people. Such an application also has another advantage: consumption is constant and continuous throughout the year.
Since the primary purpose of water reuse is natural environment protection, an LCA was carried out to evaluate which of the two proposed reused water delivery solutions would have a lower environmental impact. It was primarily assumed that water network construction would be less impactful than daily delivery by lorries over an extended period of time, since once built it no longer generates significant emissions. The analysis aimed to calculate how many days it would take for the piping system to become less impactful than tank lorry delivery. The results of the calculations were analyzed in 10 environmental impact categories (Table 8). The impactful period represents the number of days after which the environmental impact of tank lorry delivery will be higher than the impact of water network construction.
Table 8.
Results of the impact assessment for two analyzed scenarios.
Depending on the indicator, the impactful period for water network construction was between 11 days for freshwater aquatic ecotoxicity to 9.5 years for terrestrial ecotoxicity. However, the median value showed that after 73 days of operation, the water network would already have a lower environmental impact than daily delivery by tank lorries. These results show that the water network construction would undoubtedly be a better solution for reused water delivery to public transport depots. Although no other processes were included in the analysis, it could be assumed that the water network would become less impactful than lorry delivery in less than a year. Considering that this solution would be implemented permanently, the piping system should be chosen as a preferred solution.
3.4. Final Proposal of Urban Water Reuse—Case Study
Eventually, a proposal for a complex urban water reuse system was evaluated, covering all purposes mentioned in previous sections. It was observed that the daily effluent from the bigger WWTP, Czajka, could cover the total daily water demand for the bigger PP, Siekierki, with a surplus of 71,232 m3/d. This creates an opportunity for closing the loop in the power production sector in the city and still leaving the remaining effluent to be used for other purposes. However, the distance between Czajka and Siekierki is almost 20 km, and there is a 2-m incline in the elevation towards Siekierki PP. Considering the required average water flow of more than 300,000 m3/d between the facilities, the piping system could be the only option to transport such considerable amounts daily.
To diversify the water reuse management, two scenarios were evaluated. Both of them would require construction of: a tertiary treatment system of treated wastewater at WWTPs, including filtration and disinfection, reclaimed water network connecting WWTPs with corresponding public transport depots, as well as a reclaimed water tanking station at Czajka WWTP for water carts and street cleaning vehicles. Additionally, one scenario would cover the total water demand for power production, but would also require extensive investments. Furthermore, it would include the following:
- construction of a connecting channel (approx. 500 m long) between Południe WWTP and Siekierki PP, using the entire Południe effluent, excluding the amount required for its own needs and the public transport depots supply,
- construction of a long conduit (approx. 20 km) between Czajka WWTP and Siekierki PP, delivering the remaining water required for power production,
Such a management system would allow for satisfying the entire water demand for two exemplary PPs (Siekierki and Żerań), and the entire demand for landscaping, street cleaning and public transport fleet washing purposes. It would lead to the management of the total Południe WWTP effluent and 89% of the effluent from Czajka, lowering the wastewater discharge to the Vistula River by even 91% each year (Figure 3). However, such a solution would require enormous investment costs to build an extensive piping system between Czajka and Siekierki. Additionally, it would have to be checked if this drastic reduction of effluent discharge wouldn’t be a risk for maintaining the environmental flow requirements.
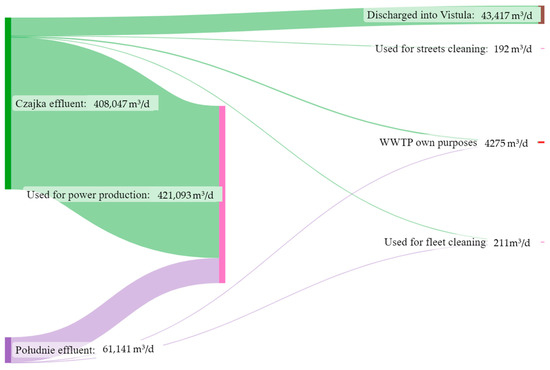
Figure 3.
Proposed treated wastewater distribution in metropolitan area—scenario 1.
The second scenario assumed lower investment costs in comparison to the first one, and higher effluent discharge back to the river. The proposed solution included the following:
- construction of a shorter conduit (approx. 8–10 km long) between Czajka WWTP and Żerań PP,
- construction of a connecting channel (approx. 500 m long) between Południe WWTP and Siekierki PP,
Such a management system would allow for satisfying the entire Żerań PP and 18% of the Siekierki PP water demand, as well as for the total demand for landscaping, street cleaning and public transport fleet washing purposes. It would lead to the management of the entire Południe WWTP effluent and 22% of the effluent from Czajka, lowering the wastewater discharge to the Vistula River by 16% each year (Figure 4).
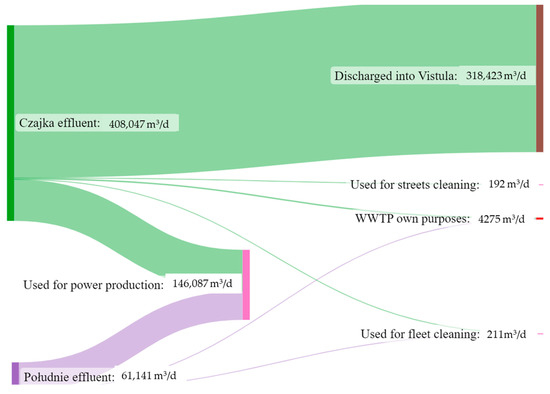
Figure 4.
Proposed treated wastewater distribution in metropolitan area—scenario 2.
4. Discussion
This study tackled the subject of water reuse which has not been developed on a broader scale as yet. It aimed to evaluate the universal urban water reuse system proposal. Two urban water reclamation systems proposed in this paper could allow for the reuse of 91 or 33 per cent of treated wastewater. Takeuchi and Tanaka [77] have reported that in Japan only 1.3% of treated wastewater is recycled and used for various urban purposes, from which 22% is used for landscape irrigation. Based on data available from Shanghai and Beijing, Bauer et al. [78] have calculated that the reclaimed water demand for city purposes (streets cleaning and greenery irrigation) of 104,000 P.E. would constitute for 202% of its actual production. Street cleaning purposes would have the biggest contribution and require 119% of the actual water production.
Reuse for municipality purposes is very versatile, but simultaneously this situation creates various implementation obstacles and challenges. Reclaimed water characterizes with different composition than the surface water used by power plants. Higher concentrations of ammonia, phosphorus or hydrogen sulfide can cause corrosion in the metallic parts. Nutrients and residual organic matter can also lead to biofilm formation, causing components fouling [28]. Water treatment plants that serve power production facilities are designed to treat the water of specific quality occurring locally. In case of water source replacement with treated wastewater, it would be necessary to adjust the components or possibly add other treatment processes to ensure the desired nutrient and residual organic matter removal rate. Considering literature reports, the removal of these compounds at power plants is usually carried out in biofilters [79] or membrane bioreactors [22]. What is interesting is that ion exchange was proven to be an efficient alternative to biological processes. Zeolite resins regenerated with NaCl allow for the removal and recovery of nutrients [80,81]. This solution should be considered while implementing water reuse at power plants already operating with ion exchange processes. Current components would have to be adjusted to facilitate nutrient removal, but it would also require lower investment than the construction of biological reactors. In this study, the daily demands for power production of 421,093 and 146,087 m3/d of reclaimed water were analysed. Cherchi et al. [28] have reported 60 power plants in the US that have successfully implemented the usage of reclaimed water, from which approx. 50% consume at least 5000 m3 per day and 20% consume more than 46,000 m3 per day. Li et al. [82] have conducted a study on a nuclear plant where consumption exceeds 208,000 m3/d.
The results of the study indicated that there was approx. an 80 percent lower concentration of suspended solids in reclaimed water than in surface water. This situation is advantageous in terms of electricity and reagent consumption, but it may also be a premise for the adjustment of the coagulation process at PP. A low concentration may impede the formation of flocks, therefore new, enhanced coagulation techniques should be acknowledged. Some previous studies describe the micro-coagulation advantage over conventional coagulation processes in water reuse [83]. It requires lower coagulant doses, shorter retention times and generates a smaller environmental footprint.
The usage of reclaimed water for greenery irrigation and landscaping is one of the most popular practices in urban water reuse [26,84]. The remaining nitrogen and phosphorus in WWTP effluent can lead to eutrophication and marine life degradation when discharged back into a water body [85]. It has been determined multiple times that the WWTP effluent is more beneficial for land plants than water flora [14,86]. It was specified by Wang et al. [87] that domestic wastewater can increase crop yield, but industrial wastewater has rather adverse effects and should not be considered. This research considered the water reuse in the irrigation of public landscape in the quality criterion only. Woltersdorf et al. [88] have also included the quantity criterion, and calculated that in a small municipal area of 1400 P.E., the amount of reclaimed water would be sufficient to fully irrigate and fertilize 1ha of public greenery or cover 39% of the crop requirements for water, 100% for nitrogen and 29% for phosphorus.
Another problem that may occur during irrigation with treated wastewater is an unpleasant odor caused by compounds present in the effluent, such as hydrogen sulfide or volatile organic compounds [89], because this parameter isn’t usually altered at the WWTPs [90]. Before the reclaimed water could be tanked into water carts, besides disinfection, it would be necessary to implement the odor removal processes. Popular techniques include ozonation or adsorption [91]. An appropriately designed ozonation process could serve for both disinfection and odor removal. Certain studies also observed the degradation of soil in public parks when reclaimed water was used for irrigation [92,93].
Legislative procedures may take a lot of time, especially when it concerns implementing a new technology that has not been widely tested inside the country’s territory. The lack of local regulations on water reuse may additionally prolong the process. Although the research on this subject started a few decades ago, only six countries in Europe have adopted some local policies in water reclamation: Spain [94], France [95,96], Italy [97], Portugal [98], Greece [99] and Cyprus [100], where only the Greek government issued more than one document by 2022. This fact highlights the necessity to elaborate more legislative acts targeting the issue and to update those published more than a few years ago. Regulations in Europe describe various urban purposes, however only landscape irrigation of public areas is included in all of them. Other purposes include:
- street cleaning (Greece, Italy, Spain),
- the irrigation of ornamental flowers without contact of reclaimed water with the product (France, Greece, Italy, Spain),
- cooling towers (Greece and Italy),
- the industrial washing of vehicles (Italy, Spain).
Maximum values in reclaimed water have been defined for parameters such as various bacteria species, F-specific bacteriophages, Helminth eggs, TSS, TDS, turbidity, BOD, COD, pH, heavy metals, electrical conductivity, or chlorine [84]. The local and national governments of the countries that haven’t issued any water reuse policies yet could use existing regulations as guidelines. Already adapted practices serve as examples to dispel doubts.
Another problem that makes it harder to obtain specific permits and agreements for urban water reuse, where, for example, irrigated plants come into contact with the citizens, is the so-called “yuck factor”. This refers to the negative attitude and public perception towards the reuse of municipal wastewater [101]. In many cities, it is still believed that such practices expose residents to the risk of infections caused by bacteria and viruses that may be found in the WWTP effluent [102]. The organoleptic properties of reused water are often also a concern. However, many studies have already been conducted, showing no bacteriological risk if the wastewater is disinfected appropriately prior to use [103]. Moreover, as previously mentioned, treated wastewater may benefit irrigated plants more than tap water. If water reuse is planned to be implemented in the city, educational campaigns should be included in the plan to assure the citizens that these solutions are safe and have been tested multiple times for many years.
While designing the water reuse management plan, it is essential to include the environmental flow requirements. Sometimes the main emphasis is put on human needs [104] and systems that allow for the reusing of as much wastewater as possible. However, to maintain sustainable water resource management, environmental requirements cannot be neglected. Some parts of treated wastewater has to be discharged back into the aquatic ecosystem to provide plants and animals with enough water and nutrients to survive without stress.
This study included the comparative LCA analysis of reclaimed water delivery by road lorry transportation and water distribution network (PVC pipes). A CML scenario was used as the calculation methodology. The global warming potential emission equaled 16 kg CO2 per ton of transported water on a total distance of 289 km. Abbas and Handler [105] have previously reported that the delivery of 1 ton of wood by large lorries generates 33.2 kg CO2 at a distance of 300 km and 27.7 kg CO2 at a distance of 250 km. Amores et al. [106] have calculated the environmental impact of reclaimed water distribution networks made from PVC pipes, using the CML scenario method. Hajibabaei et al. [107] and Sanjuan-Delmás et al. [108] used the same methodology to calculate the environmental impact of PVC pipes production and the construction of a drinking water distribution network. The results for 1 km of constructed network in the aforementioned studies have been compiled with the results of this study in Table 9. All four studies have reported the lowest environmental impact for ozone layer depletion and the highest for global warming.
Table 9.
Comparison of water network construction LCA results with literature reports.
Further research should be carried out to evaluate the in-depth environmental impact analysis and feasibility study of urban water reuse. Future studies should be interdisciplinary and focus on the combination of social, economic, environmental and technological aspects.
5. Conclusions
Continuously shrinking global freshwater resources demand rapid actions to minimize the impacts of global warming and the increasing population. This paper discussed water reclamation for urban purposes. Options for a complex water reuse system in the municipal area, including all essential city services (i.e., power and heat production, greenery irrigation, streets and public transport fleet cleaning) were elaborated. One of the proposed scenarios can lead to a reduction of freshwater withdrawal by 91%. The second could reduce the withdrawal by 16%, but it would also require much lower investment and maintenance costs. Reclaimed water for public transport fleet cleaning can be delivered by tank lorries or a specially built independent water network. The latter solution would generate relatively high environmental emissions during construction. However, the LCA results indicate that after 2.5 months the environmental impacts of this solution would be lower than in the case of water delivery by tank lorries. The proposed solutions are universal and could be implemented in any middle-sized or bigger city globally.
Supplementary Materials
The following supporting information can be downloaded at: https://www.mdpi.com/article/10.3390/su15021190/s1, Figure S1: Average yearly wastewater flow in analysed WWTPs between 2017 and 2021; Figure S2: BOD values in analysed WWTPs between 2017 and 2021; Figure S3: COD values in analysed WWTPs between 2017 and 2021; Figure S4: Suspended solids concentration in analysed WWTPs between 2017 and 2021; Figure S5: Total phosphorus concentration in analysed WWTPs between 2017 and 2021; Figure S6: Total nitrogen concentration in analysed WWTPs between 2017 and 2021; Figure S7: Chlorides concentration in analysed WWTPs between 2017 and 2021; Figure S8: Sulphates concentration in analysed WWTPs between 2017 and 2021; Figure S9: Iron concentration in analysed WWTPs between 2017 and 2021; Table S1: Average indicators’ values in Vistula river measured at water supply point “Gruba Kaśka” between 2020 and 2021.
Author Contributions
Conceptualization, K.S. and M.Z.-S.; methodology, K.S.; formal analysis, K.S.; resources K.S.; data curation K.S.; writing—original draft preparation, K.S.; writing—review and editing, M.Z.-S. and K.S.; visualization K.S.; supervision M.Z.-S. All authors have read and agreed to the published version of the manuscript.
Funding
This research received no external funding.
Institutional Review Board Statement
Not applicable.
Informed Consent Statement
Not applicable.
Data Availability Statement
The data presented in this study are available in Supplementary Material.
Acknowledgments
We thank would like to thank Municipal Water Supply and Sewerage Company in Warsaw Joint Stock Company for providing the access to measurement data used in preparation of this article. Special thanks are dedicated to Agnieszka Bisak for facilitating the data handover.
Conflicts of Interest
The authors declare that they have no conflict of interest.
References
- Filho, W.L.; Totin, E.; Franke, J.A.; Andrew, S.M.; Abubakar, I.R.; Azadi, H.; Nunn, P.D.; Ouweneel, B.; Williams, P.A.; Simpson, N.P. Understanding responses to climate-related water scarcity in Africa. Sci. Total Environ. 2022, 806 Pt 1, 150420. [Google Scholar] [CrossRef] [PubMed]
- Hung, F.; Son, K.; Yang, Y.C.E. Investigating uncertainties in human adaptation and their impacts on water scarcity in the Colorado river Basin, United States. J. Hydrol. 2022, 612, 128015. [Google Scholar] [CrossRef]
- Narvaez-Montoya, C.; Torres-Martínez, J.A.; Pino-Vargas, E.; Cabrera-Olivera, F.; Loge, F.J.; Mahlknecht, J. Predicting adverse scenarios for a transboundary coastal aquifer system in the Atacama Desert (Peru/Chile). Sci. Total Environ. 2022, 806, 150386. [Google Scholar] [CrossRef] [PubMed]
- Gosling, S.; Arnell, N. A global assessment of the impact of climate change on water scarcity. Clim. Chang. 2016, 134, 371–385. [Google Scholar] [CrossRef]
- FAOSTAT. fao.org/faostat. 2019. Available online: https://www.fao.org/faostat/en/#data/SDGB (accessed on 20 July 2022).
- Li, C.; Lu, T.; Fu, B.; Wang, S.; Holden, J. Sustainable city development challenged by extreme weather in a warming world. Geogr. Sustain. 2022, 3, 114–118. [Google Scholar] [CrossRef]
- Kimengsi, J.N.; Amawa, S.G. Water Rationing in the Buea Municipality: Patterns, Effects and Coping Strategies. Afr. J. Soc. Sci. 2015, 6, 1–13. [Google Scholar]
- Timmer, D.K.; Loë, R.; Kreutzwiser, R.D. Source water protection in the Annapolis Valley, Nova Scotia: Lessons for building local capacity. Land Use Policy 2007, 24, 187–198. [Google Scholar] [CrossRef]
- Nouri, H.; Stokvis, B.; Galindo, A.; Blatchford, M.; Hoekstra, A.Y. Water scarcity alleviation through water footprint reduction in agriculture: The effect of soil mulching and drip irrigation. Sci. Total Environ. 2019, 653, 241–252. [Google Scholar] [CrossRef]
- Alnajdi, O.; Calautit, J.K.; Wu, Y. Development of a multi-criteria decision making approach for sustainable seawater desalination technologies of medium and large-scale plants: A case study for Saudi Arabia’s vision 2030. Energy Procedia 2019, 158, 4274–4279. [Google Scholar] [CrossRef]
- Olivieri, A.W.; Pecson, B.; Crook, J.; Hultquist, R. Chapter Two—California water reuse—Past, present and future perspectives. Adv Chem Pollut, Environ Manage Prot. 2020, 5, 65–111. [Google Scholar]
- Tow, E.W.; Hartman, A.L.; Jaworowski, A.; Zucker, I.; Kum, S.; AzadiAghdam, M.; Blatchley, E.R., III; Achilli, A.; Gu, H.; Urper, G.M.; et al. Modeling the energy consumption of potable water reuse schemes. Water Res X 2021, 13, 100126. [Google Scholar] [CrossRef] [PubMed]
- Meffe, R.; Santiago-Martín, A.; Teijon, G.; Hernandez, V.M.; Lopez-Heras, I.; Nozal, L.; Bustamante, I. Pharmaceutical and transformation products during unplanned water reuse: Insights into natural attenuation, plant uptake and human health impact under field conditions. Environ. Int. 2021, 157, 106835. [Google Scholar] [CrossRef] [PubMed]
- Ait-Mouheb, N.; Mange, A.; Froment, G.; Lequette, K.; Bru-Adan, V.; Maihol, J.-C.; Molle, B.; Wéry, N. Effect of untreated or reclaimed wastewater drip-irrigation for lettuces and leeks on yield, soil and fecal indicators. Resour Environ. Sustain. 2022, 8, 100053. [Google Scholar] [CrossRef]
- Rebelo, A.; Quadrado, M.; Franco, A.; Lacasta, N.; Machado, P. Water reuse in Portugal: New legislation trends to support the definition of water quality standards based on risk characterization. Water Cycle 2020, 1, 41–53. [Google Scholar] [CrossRef]
- Truchado, P.; Gil, M.I.; López, C.; Garre, A.; López-Aragón, R.F.; Böhme, K.; Allende, A. New standards at European Union level on water reuse for agricultural irrigation: Are the Spanish wastewater treatment plants ready to produce and distribute reclaimed water within the minimum quality requirements? Int. J. Food Microbiol. 2021, 356, 109352. [Google Scholar] [CrossRef]
- Tran, H.D.M.; Boivina, S.; Kodamatani, H.; Ikehata, K.; Fujioka, T. Potential of UV-B and UV-C irradiation in disinfecting microorganisms and removing N-nitrosodimethylamine and 1,4-dioxane for potable water reuse: A review. Chemosphere 2022, 286, 131682. [Google Scholar] [CrossRef]
- Cao, H.; Yu, X.; Zheng, Y.; Aghdam, E.; Sun, B.; Song, M.; Wang, A.; Han, J.; Zhang, J. Micropollutant abatement by the UV/chloramine process in potable water reuse: A review. J. Hazard. Mater. 2022, 424, 127341. [Google Scholar] [CrossRef]
- Xing, J.; Du, L.; Quan, X.; Luo, X.; Snyder, S.A.; Liang, H. Combining chlor(am)ine-UV oxidation to ultrafiltration for potable water reuse: Promoted efficiency, membrane fouling control and mechanism. J. Membr. Sci. 2021, 635, 119511. [Google Scholar] [CrossRef]
- Ormerod, K.J.; Redman, S.; Kelley, S. Public perceptions of potable water reuse, regional growth, and water resources management in the Reno-Sparks area of northern Nevada, USA. City Environ. Interact. 2019, 2, 100015. [Google Scholar] [CrossRef]
- Echevarría, C.; Pastur, M.; Valderrama, C.; Cortina, J.; Vega, A.; Mesa, C.; Aceves, M. Techno-economic assessment of decentralized polishing schemes for municipal water reclamation and reuse in the industrial sector in costal semiarid regions: The case of Barcelona (Spain). Sci. Total Environ. 2022, 815, 152842. [Google Scholar] [CrossRef]
- Hoinkis, J.; Deowan, S.A.; Panten, V.; Figoli, A.; Huang, R.R.; Drioli, E. Membrane Bioreactor (MBR) Technology—A Promising Approach for Industrial Water Reuse. Procedia Eng. 2012, 33, 234–241. [Google Scholar] [CrossRef]
- Bauer, S.; Dell, A.; Behnisch, J.; Linke, H.J.; Wagner, M. Sustainability requirements of implementing water-reuse concepts for new industrial park developments in water-stressed regions. J. Water Reuse Desalin. 2020, 10, 490–499. [Google Scholar] [CrossRef]
- Lee, K.; Jepson, W. Drivers and barriers to urban water reuse: A systematic review. Water Secur. 2020, 11, 100073. [Google Scholar] [CrossRef]
- Adewumi, J.; Ilemobade, A.; Zyl, J. Treated wastewater reuse in South Africa: Overview, potential and challenges. Resour. Conserv. Recycl. 2010, 55, 221–231. [Google Scholar] [CrossRef]
- Chen, Z.; Wu, Q.; Wu, G.; Hu, H.-Y. Centralized water reuse system with multiple applications in urban areas: Lessons from China’s experience. Resour. Conserv. Recycl. 2017, 117, 125–136. [Google Scholar] [CrossRef]
- Ramaiah, M.; Avtar, R.; Kumar, P. Treated Wastewater Use for Maintenance of Urban Green Spaces for Enhancing Regulatory Ecosystem Services and Securing Groundwater. Hydrology 2022, 9, 180. [Google Scholar] [CrossRef]
- Cherchi, C.; Kesaano, M.; Badruzzaman, M.; Schwab, K.; Jacangelo, J.G. Municipal reclaimed water for multi-purpose applications in the power sector: A review. J. Environ. Manag. 2019, 236, 561–570. [Google Scholar] [CrossRef]
- Khor, C.S.; Akinbola, N.S.G. A model-based optimization study on greywater reuse as an alternative urban water resource. Sustain. Prod. Consum. 2020, 22, 186–194. [Google Scholar] [CrossRef]
- Carré, J.B.E.; Jauzein, V.; Junqua, G.; Lopez-Ferber, M. Life cycle assessment case study: Tertiary treatment process options for wastewater reuse. Integr. Environ. Assess. Manag. 2017, 13, 1113–1121. [Google Scholar] [CrossRef]
- Çetinkaya, A.; Bilgili, L. Treatment of slaughterhouse industry wastewater with ultrafiltration membrane and evaluation with life cycle analysis. Environ. Sci. Technol. 2022, 5, 197–201. [Google Scholar] [CrossRef]
- Jeong, H.; Broesicke, O.A.; Drew, B.; Crittenden, J.C. Life cycle assessment of small-scale greywater reclamation systems combined with conventional centralized water systems for the City of Atlanta, Georgia. J. Clean Prod. 2018, 174, 333–342. [Google Scholar] [CrossRef]
- Foglia, A.; Andreola, C.; Cipolletta, G.; Radini, S.; Akyol, Ç.; Eusebi, A.L.; Stanchev, P.; Katsou, E.; Fatone, F. Comparative life cycle environmental and economic assessment of anaerobic membrane bioreactor and disinfection for reclaimed water reuse in agricultural irrigation: A case study in Italy. J. Clean. Prod. 2021, 293, 126201. [Google Scholar] [CrossRef]
- Arzate, S.; Pfister, S.; Oberschelp, C.; Sánchez-Pérez, J. Environmental impacts of an advanced oxidation process as tertiary treatment in a wastewater treatment plant. Sci. Total Environ. 2019, 694, 133572. [Google Scholar] [CrossRef] [PubMed]
- Romeiko, X.X. A Comparative Life Cycle Assessment of Crop Systems Irrigated with the Groundwater and Reclaimed Water in Northern China. Sustainability 2019, 11, 2743. [Google Scholar] [CrossRef]
- Canaj, K.; Mehmeti, A.; Morrone, D.; Toma, P.; Todorović, M. Life cycle-based evaluation of environmental impacts and external costs of treated wastewater reuse for irrigation: A case study in southern Italy. J. Clean. Prod. 2021, 293, 126142. [Google Scholar] [CrossRef]
- Pintilie, L.; Torres, C.M.; Teodosiu, C.; Castells, F. Urban wastewater reclamation for industrial reuse: An LCA case study. J. Clean. Prod. 2016, 139, 1–14. [Google Scholar] [CrossRef]
- Municipal Water Supply and Sewerage Company in Warsaw JSC. Zakład Pruszków. Available online: https://www.mpwik.com.pl/view/zaklad-pruszkow (accessed on 24 November 2022).
- Municipal Water Supply and Sewerage Company in Warsaw JSC. Zakład Dębe. Available online: https://www.mpwik.com.pl/view/zaklad-debe (accessed on 24 November 2022).
- Municipal Water Supply and Sewerage Company in Warsaw JSC. Zakład Czajka. Available online: https://www.mpwik.com.pl/view/zaklad-czajka (accessed on 24 November 2022).
- Municipal Water Supply and Sewerage Company in Warsaw JSC. Zakład Południe. Available online: https://www.mpwik.com.pl/view/zaklad-poludnie (accessed on 24 November 2022).
- Statistics Poland. Local Data Bank. 2022. Available online: https://bdl.stat.gov.pl/bdl/start (accessed on 21 November 2022).
- Greenpeace. The Great Water Grab: How the Coal Industry is Deepening the Global Water Crisis; Greenpeace International: Amsterdam, The Netherlands, 2016. [Google Scholar]
- PGNiG. 2022. Available online: https://termika.pgnig.pl/raportysrodowiskowe (accessed on 25 July 2022).
- Zarząd Oczyszczania Miasta Warszawa. Zarząd Oczyszczania Miasta. Available online: https://zom.waw.pl/aktualnosci/nocne-podlewanie-miejskich-roslin (accessed on 21 November 2022).
- World Health Organization. WHO Guidelines for the Safe Use of Wastewater, Excreta and Greywater. Excreta and Greywater Use in Agriculture; World Health Organization: Geneva, Switzerland, 2006; Volume 4. [Google Scholar]
- European Union. Regulation (EU) 2020/741 of the European Parliament and of the Council of 25 May 2020 on Minimum Requirements for Water Reuse. 2020. Available online: https://eur-lex.europa.eu/legal-content/EN/TXT/HTML/?uri=CELEX:32020R0741&from=EN (accessed on 21 November 2022).
- Zarząd Oczyszczania Miasta Warszawa. Podsumowanie 2021: Ulice i torowiska regularnie sprzątane. 3 January 2022. Available online: https://zom.waw.pl/aktualnosci/podsumowanie-2021-ulice-i-torowiska-regularnie-sprzatane (accessed on 21 November 2022).
- Zarząd Oczyszczania Miasta Warszawa. Podsumowanie 2020—Sprzątanie ulic. 11 January 2021. Available online: https://zom.waw.pl/aktualnosci/podsumowanie-2020-sprzatanie-ulic (accessed on 21 November 2022).
- Unia Polskich Metropolii. Warszawa Sprząta Ulice Wodą z Basenów. 6 August 2020. Available online: https://metropolie.pl/artykul/warszawa-sprzata-ulice-woda-z-basenow (accessed on 21 November 2022).
- Zarząd Transportu Miejskiego w Warszawie. Zarząd Transportu Miejskiego w Warszawie, Raport 2020; Zarząd Transportu Miejskiego w Warszawie: Warsaw, Poland, 2020. [Google Scholar]
- Zarząd Transportu Miejskiego w Warszawie. Zarząd Transportu Miejskiego w Warszawie, Raport 2021; Zarząd Transportu Miejskiego w Warszawie: Warsaw, Poland, 2021. [Google Scholar]
- Zarząd Transportu Miejskiego w Warszawie. Vehicle Database. Available online: https://www.ztm.waw.pl/baza-danych-pojazdow/ (accessed on 21 November 2022).
- Warszawa.pl. Jak Się Myje Autobusy i Tramwaje? 18 April 2017. Available online: https://www.warszawa.pl/jak-sie-myje-autobusy-i-tramwaje/ (accessed on 21 November 2022).
- Marat, J. Odwiedziliśmy Nową Halę i Myjnię na STP Kabaty. Koło Miłośników Metra. 25 June 2018. Available online: https://kmmetra.pl/odwiedzilismy-nowa-hale-i-myjnie-na-stp-kabaty/ (accessed on 21 November 2022).
- Clean India Journal. Bus Cleaning: From Manual Scrubbing to Automated Washing. 16 December 2021. Available online: https://www.cleanindiajournal.com/bus-cleaning-from-manual-scrubbing-to-automated-washing/ (accessed on 21 November 2022).
- Almeida, C.; Borges, D., Jr.; Bonilla, S.H.; Giannetti, B.F. Identifying improvements in water management of bus-washing stations in Brazil. Resour. Conserv. Recycl. 2010, 54, 821–831. [Google Scholar] [CrossRef]
- Istobal. Istobal Saves More than 6380 Litres of Water Every Hour in Bus Wash Facilities. 20 March 2020. Available online: https://int.istobal.com/inter/blog/istobal-saves-more-than-6380-litres-of-water-every-hour-in-bus-wash-facilities/ (accessed on 21 November 2022).
- Falkiewicz, P. Czy Zastanawiało Was Kiedyś, Jak Kąpią Się Miejskie Tramwaje? Śpieszymy z Odpowiedzią! 26 July 2022. Available online: https://www.wroclaw.pl/dla-mieszkanca/myjnia-tramwajowa-wroclaw (accessed on 21 November 2022).
- Transport Publiczny. SULTOF: Jak Się Myje Autobusy? 15 November 2022. Available online: https://www.transport-publiczny.pl/wiadomosci/sultof-jak-sie-myje-autobusy-69298.html (accessed on 21 November 2022).
- Seis, W.; Remy, C. D3.1 Appropriate and User Friendly Methodologies for Risk Assessment, Life Cycle Assessment, and Water Footprinting; Fundació CTM Centre Tecnològic: Barcelona, Spain, 2015. [Google Scholar]
- Lam, L.; Kurisu, K.; Hanaki, K. Comparative environmental impacts of source-separation systems for domestic wastewater management in rural China. J. Clean. Prod. 2015, 104, 185–198. [Google Scholar] [CrossRef]
- Lane, J.; de Haas, D.; Lant, P.A. The diverse environmental burden of city-scale urban water systems. Water Res. 2015, 81, 398–415. [Google Scholar] [CrossRef] [PubMed]
- Pasqualino, J.C.; Meneses, M.; Castells, F. Life Cycle Assessment of Urban Wastewater Reclamation and Reuse Alternatives. J. Ind. Ecol. 2011, 15, 49–63. [Google Scholar] [CrossRef]
- Büyükkamacı, N.; Karaca, G. Life cycle assessment study on polishing units for use of treated wastewater in agricultural reuse. Water Sci. Technol. 2017, 76, 3205–3212. [Google Scholar] [CrossRef]
- Polruang, S.; Sirivithayapakorn, S.; Talang, R.P.N. A comparative life cycle assessment of municipal wastewater treatment plants in Thailand under variable power schemes and effluent management programs. J. Clean. Prod. 2018, 172, 635–648. [Google Scholar] [CrossRef]
- Shiu, H.-Y.; Lee, M.; Chiueh, P.-T. Water reclamation and sludge recycling scenarios for sustainable resource management in a wastewater treatment plant in Kinmen islands, Taiwan. J. Clean. Prod. 2017, 152, 369–378. [Google Scholar] [CrossRef]
- Burhan, S.; Recanati, F.; Ciroth, A. How Sustainable Are Longer and Heavier Vehicles? GreenDelta GmbH: Berlin, Germany, 2018. [Google Scholar]
- Valverde, J.L.; Lucas, A.D.; Carmon, M.; Pérez, J.P.; González, M.; Rodríguez, F. Minimizing the environmental impact of the regeneration process of an ion exchange bed charged with transition metals. Sep. Purif. Technol. 2006, 49, 167–173. [Google Scholar] [CrossRef]
- Castro, D.J.; Stasis, R.P. Innovative Water Treatment Design for Turning Wastewater Treatment Effluent Into Boiler Makeup Water. In Proceedings of the 11th North American Waste-to-Energy Conference, Tampa, FL, USA, 28–30 April 2003. [Google Scholar]
- Jiménez, B.; Asano, T. Water Reuse: An International Survey of Current Practice, Issues and Needs; IWA Publishing: London, UK, 2008. [Google Scholar]
- World Health Organization. WHO Guidelines for the Safe Use of Wastewater, Excreta and Greywater. Wastewater Use in Agriculture; World Health Organization: Geneva, Switzerland, 2006; Volume 2. [Google Scholar]
- Grespan, A.; Garcia, J.; Brikalski, M.P.; Henning, E.; Kalbusch, A. Assessment of water consumption in households using statistical analysis and regression trees. Sustain. Cities Soc. 2022, 87, 104186. [Google Scholar] [CrossRef]
- Canales, F.A.; Plata-Solano, D.; Cantero-Rodelo, R.; Pereira, Y.Á.; Díaz-Martínez, K.; Carpintero, J.; Kaźmierczak, B.; Tavera-Quiroz, H. Assessment of carwash wastewater reclamation potential based on household water treatment technologies. Water Resour. Ind. 2021, 26, 100164. [Google Scholar] [CrossRef]
- Panizza, M.; Cerisola, G. Applicability of electrochemical methods to carwash wastewaters for reuse. Part 1: Anodic oxidation with diamond and lead dioxide anodes. J. Electroanal. Chem. 2010, 638, 28–32. [Google Scholar] [CrossRef]
- Hamada, T.; Miyazaki, Y. Reuse of carwash water with a cellulose acetate ultrafiltration membrane aided by flocculation and activated carbon treatments. Desalination 2004, 169, 257–267. [Google Scholar] [CrossRef]
- Takeuchi, H.; Tanaka, H. Water reuse and recycling in Japan—History, current situation, and future perspectives. Water Cycle 2020, 1, 1–12. [Google Scholar] [CrossRef]
- Bauer, S.; Linke, H.; Wagner, M. Combining industrial and urban water-reuse concepts for increasing the water resources in water-scarce regions. Water Environ. Res. 2020, 92, 1027–1041. [Google Scholar] [CrossRef]
- Lazarova, V.; Perera, J.; Bowen, M.; Sheilds, P. Application of aerated biofilters for production of high quality water for industrial reuse in West Basin. Water Sci. Technol. 2000, 41, 417–424. [Google Scholar] [CrossRef]
- Liberti, L.; Boari, G.; Petruzzelli, D.; Passino, R. Nutrient removal and recovery from wastewater by ion exchange. Water Res. 1981, 15, 337–342. [Google Scholar] [CrossRef]
- Huang, X.; Guida, S. Jefferson and A. Soares. Economic evaluation of ion-exchange processes for nutrient removal and recovery from municipal wastewater. npj Clean Water 2020, 3, 7. [Google Scholar] [CrossRef]
- Li, H.; Chien, S.-H.; Hsieh, M.-K.; Dzombak, D.A.; Vidic, R.D. Escalating Water Demand for Energy Production and the Potential for Use of Treated Municipal Wastewater. Environ. Sci. Technol 2011, 45, 4195–4200. [Google Scholar] [CrossRef] [PubMed]
- Yu, T.; Xu, C.; Chen, F.; Yin, H.; Sun, H.; Cheng, L.; Bi, X. Microcoagulation improved the performance of the UF–RO system treating the effluent from a coastal municipal wastewater treatment plant: A pilot-scale study. Water Reuse Desalination 2021, 11, 177–188. [Google Scholar] [CrossRef]
- Sanz, L.A.; Gawlik, B.M. Water Reuse in Europe Relevant Guidelines, Needs for and Barriers to Innovation; Publications Office of the European Union: Luxembourg, 2014. [Google Scholar]
- Preisner, M.; Neverova-Dziopak, E.; Kowalewski, Z. Analysis of eutrophication potential of municipal wastewater. Water Sci. Technol. 2020, 81, 1994–2003. [Google Scholar] [CrossRef]
- Davand, H.; Sepehr, E.; Momtaz, H.R.; Ahmadi, F. Wastewater irrigation: An opportunity for improving soil phosphorus availability; PHREEQC modeling and adsorption studies. Sci. Total Environ. 2022, 851, 158180. [Google Scholar] [CrossRef]
- Wang, H.-j.; Wang, J.; Yu, X. Wastewater irrigation and crop yield: A meta-analysis. J. Integr. Agric. 2022, 21, 1215–1224. [Google Scholar] [CrossRef]
- Woltersdorf, L.; Zimmermann, M.; Deffner, J.; Gerlach, M.; Liehr, S. Benefits of an integrated water and nutrient reuse system for urban areas in semi-arid developing countries. Resour. Conserv. Recycl. 2018, 128, 382–393. [Google Scholar] [CrossRef]
- Ren, B.; Lyczko, N.; Zhao, Y.; Nzihou, A. Simultaneous hydrogen sulfide removal and wastewater purification in a novel alum sludge-based odor-gas aerated biofilter. Chem. Eng. J. 2021, 419, 129558. [Google Scholar] [CrossRef]
- Hashem, M.S.; Qi, X. Treated Wastewater Irrigation—A Review. Water 2021, 13, 1527. [Google Scholar] [CrossRef]
- Barbusinski, K.; Kalemba, K.; Kasperczyk, D.; Urbaniec, K.; Kozik, V. Biological methods for odor treatment—A review. J. Clean. Prod. 2017, 152, 223–241. [Google Scholar] [CrossRef]
- Zalacáina, D.; Bienes, R.; Sastre-Merlín, A.; Martínez-Pérez, S.; García-Díaz, A. Influence of reclaimed water irrigation in soil physical properties of urban parks: A case study in Madrid (Spain). Catena 2019, 180, 333–340. [Google Scholar] [CrossRef]
- Lubello, C.; Gori, R.; Nicese, F.P.; Ferrini, F. Municipal-treated wastewater reuse for plant nurseries irrigation. Water Res. 2004, 38, 2939–2947. [Google Scholar] [CrossRef] [PubMed]
- Minister of the Presidency. REAL DECRETO 1620/2007, de 7 de Diciembre, Por el Que Se Establece el Régimen Jurídico de la Reutilización de las Aguas Depuradas. 7 December 2007. Available online: https://www.boe.es/boe/dias/2007/12/08/pdfs/A50639-50661.pdf (accessed on 30 July 2022).
- Ministry of Ecology, Sustainable Development and Energy. Arrêté du 25 Juin 2014 Modifiant L’arrêté du 2 Août 2010 Relatif à L’utilisation D’eaux Issues du Traitement D’épuration des Eaux Résiduaires Urbaines Pour L’irrigation de Cultures ou D’espaces Verts. 25 June 2014. Available online: https://www.legifrance.gouv.fr/jorf/id/JORFTEXT000029186641 (accessed on 30 July 2022).
- The First Minister. Décret n° 2022-336 du 10 Mars 2022 Relatif Aux Usages et Aux Conditions de Réutilisation des Eaux Usées Traitées. 10 March 2022. Available online: https://www.legifrance.gouv.fr/loda/id/LEGIARTI000045334047?datePublication=&dateSignature=&init=true&page=1&query=&searchField=ALL&tab_selection=lawarticledecree&anchor=LEGIARTI000045334047 (accessed on 30 July 2022).
- Ministry of Environment. Italian Regulations for Water Reuse, MINISTERIAL DECREE of the 12 June 2003. 12 June 2003. Available online: https://www.gazzettaufficiale.it/eli/id/2003/07/23/003G0210/sg (accessed on 30 July 2022).
- Portuguese Institute for Quality. Guidelines for Good Practice of Water Reuse for Irrigation: Portugese Standard np 4434. In Wastewater Reuse–Risk Assessment, Decision-Making and Environmental Security; Springer: Amsterdam, The Netherlands, 2006. [Google Scholar]
- Hellenic Ministry of Environment, Energy and Climate Change. Common Ministerial Decision No 145116 (354B)/08.03.11: Measures, Limits and Procedures for Reuse of Treated Wastewater. 8 March 2011. Available online: https://www.elinyae.gr/ethniki-nomothesia/ya-oik-1451162011-fek-354b-832011 (accessed on 30 July 2022).
- Ministry of Agriculture, Rural Development and Environment. Water and Soil Pollution. 2013. Available online: http://www.moa.gov.cy/moa/environment/environmentnew.nsf/page17_en/page17_en?OpenDocument (accessed on 30 July 2022).
- Smith, H.M.; Brouwer, S.; Jeffrey, P.; Frijns, J. Public responses to water reuse—Understanding the evidence. J. Environ. Manag. 2018, 207, 43–50. [Google Scholar] [CrossRef] [PubMed]
- Moya-Fernández, P.J.; López-Ruiz, S.; Guardiola, J.; González-Gómez, F. Determinants of the acceptance of domestic use of recycled water by use type. Sustain. Prod. Consum. 2021, 27, 575–586. [Google Scholar] [CrossRef]
- Jeffrey, P.; Yang, Z.; Judd, S.J. The status of potable water reuse implementation. Water Res. 2022, 214, 118198. [Google Scholar] [CrossRef]
- Yang, Z.; Sun, T.; Cui, B.; Chen, B.; Chen, G. Environmental flow requirements for integrated water resources allocation in the Yellow River Basin, China. Commun. Nonlinear Sci. Numer. Simul. 2009, 14, 2469–2481. [Google Scholar] [CrossRef]
- Abbas, D.; Handler, R.M. Life-cycle assessment of forest harvesting and transportation operations in Tennessee. J. Clean. Prod. 2018, 176, 512–520. [Google Scholar] [CrossRef]
- Amores, M.J.; Meneses, M.; Pasqualino, J.; Antón, A.; Castells, F. Environmental assessment of urban water cycle on Mediterranean conditions by LCA approach. J. Clean. Prod. 2013, 43, 84–92. [Google Scholar] [CrossRef]
- Hajibabaei, M.; Nazif, S.; Sereshgi, F.T. Life cycle assessment of pipes and piping process in drinking water distribution networks to reduce environmental impact. Sustain. Cities Soc. 2018, 43, 538–549. [Google Scholar] [CrossRef]
- Sanjuan-Delmás, D.; Petit-Boix, A.; Gasol, C.M.; Villalba, G.; Suárez-Ojeda, M.E.; Gabarrell, X.; Josa, A.; Rieradevall, J. Environmental assessment of different pipelines for drinking water transport and distribution network in small to medium cities: A case from Betanzos, Spain. J. Clean. Prod. 2014, 66, 588–598. [Google Scholar] [CrossRef]


Disclaimer/Publisher’s Note: The statements, opinions and data contained in all publications are solely those of the individual author(s) and contributor(s) and not of MDPI and/or the editor(s). MDPI and/or the editor(s) disclaim responsibility for any injury to people or property resulting from any ideas, methods, instructions or products referred to in the content. |
© 2023 by the authors. Licensee MDPI, Basel, Switzerland. This article is an open access article distributed under the terms and conditions of the Creative Commons Attribution (CC BY) license (https://creativecommons.org/licenses/by/4.0/).