Article

Architectural Design Strategies for Enhancement of Thermal and Energy Performance of PCMs-Embedded Envelope System for an Office Building in a Typical Arid Saharan Climate

by
Abdelkader Sarri
1,
Saleh Nasser Al-Saadi
2,*,
Müslüm Arıcı
3,
Djamel Bechki
1 and
Hamza Bouguettaia
1
1
Laboratory of New and Renewable Energies in Arid Zones (LENREZA), Kasdi Merbah University, Ouargla 30000, Algeria
2
Department of Civil and Architectural Engineering, College of Engineering, Sultan Qaboos University, P.O. Box 33, Al-Khoudh 123, Oman
3
Engineering Faculty, Mechanical Engineering Department, Kocaeli University, Umuttepe Campus, Kocaeli 41001, Turkey
*
Author to whom correspondence should be addressed.
Sustainability 2023, 15(2), 1196; https://doi.org/10.3390/su15021196
Submission received: 10 December 2022 / Revised: 3 January 2023 / Accepted: 4 January 2023 / Published: 9 January 2023

Abstract

:
The literature showed many studies that evaluated single or multiple Phase change materials (PCMs) layers in passive, active, or in hybrid configurations for building applications. However, little attention has been given to evaluating the energy performance of buildings when PCMs are used together with other passive design strategies. In this work, the energy performance of an office building in a typical arid Saharan climate is simulated using EnergyPlus when a PCMs-embedded envelope is implemented. The office building was analyzed without/with PCMs using various thicknesses. Results indicated that the annual electrical energy for heating, ventilation and air conditioning (HVAC) could be reduced between 3.54% and 6.18%, depending on the PCM thickness. The performance of the office building, including PCMs, was then simulated using two practical architectural design strategies, namely windows-to-wall ratio (WWR) and rezoning of the interior spaces. Outcomes revealed that the annual energy consumption for HVAC can be reduced from 10% to 15.5% and from 6.1% and 8.54% when WWR is reduced by half to three-quarters, and the perimeter zones are enlarged by one-third to two-thirds of the original space area, respectively. By combining both architectural design strategies and PCM, the annual electrical HVAC energy can be reduced between 12.08% and 15.69%, depending on the design configuration and PCM thickness. This design option provides additional benefits also since it reduces the vulnerability of increasing the lighting and fuel gas heating energy because more perimeter zones are exposed to daylighting and solar radiation, respectively.

1. Introduction

Reducing energy consumption in the building sector is a real challenge and a classic problem that has encouraged many researchers and manufacturers to look for immediate, sustainable, and applicable solutions. Despite the variety of solutions, which are often very innovative and creative, this challenge remains unresolved, especially with the climate change that the world is currently witnessing [1]. This has also become intensive as COVID-19 is attacking almost everywhere, putting people at home for a long period which has subsequently increased the energy consumption in the residential sector by 11% to 32% for several countries during the 2020 full lockdown period [2]. Therefore, improving energy efficiency in the building sector is essential, as it involves several methods that are often divided into passive and active technologies. The active design strategies are related to improvement in heating, ventilation and air conditioning (HVAC), hot water production, and lighting, whereas the passive design strategies include the building form, color, material selection, envelope system, shading system, etc., to enhance the energy efficiency without the need for energy.
In addition to the passive and active systems, net zero-energy buildings (NZEB), nearly zero-energy buildings (nZEB), and positive energy buildings (PED) have emerged as new design concepts [3]. In these designs, renewable energy systems are introduced to complement the passive and active design strategies [4,5]. The feasibility of designing a nearly zero-energy building (nZEB) based on typical residential, rural housing in Xi’an has been discussed by Chang et al. [6] by proposing new construction methods and examining the strategies for the refurbishment of an existing house. Although the used passive design strategies could not achieve the Chinese nZEB standard, they showed very promising results in terms of reducing energy consumption. The ZEB in three office buildings has been investigated in the hot-humid climate of Thailand [7]. The passive strategies include the form, geometry, and envelope, the use of a window-to-wall ratio of less than 20%, laminated glazing with horizontal shading, and the use of natural ventilation. For active systems, high-performance lighting systems and high-efficient air conditioning systems are suggested. Finally, a photovoltaic (PV) system is recommended to achieve the ZEB status.
Since passive strategies are considered important design determinants in sustainable building, several studies have explored the impact of form and geometry on the building’s energy performance. For example, the optimum aspect ratio of multi-unit residential buildings in Canadian cities was examined to reduce heating and cooling energy consumption [8]. The simulation results concluded that the optimal aspect ratio could reduce the peak loads since more solar heat gain can be used for heating in winter and provide enough shading to reduce cooling energy in summer. Additionally, energy consumption was reduced by more than 15%. In another study, at an early design stage, the building form and geometry were evaluated for their impact on energy consumption using a local sensitivity index (SI) and a Morris global sensitivity analysis (GSA) [9]. The results indicated that the horizontal and vertical geometric ratio is sensitive to the energy efficiency in buildings. In a related context, Konis et al. [10] suggested a new simulation-based method for improving passive performance that is mainly related to the building form. In particular, this study proposed a novel passive performance optimization framework (PPOF) to improve the building performance using daylighting, solar control, and natural ventilation strategies at the early design stage. It was concluded that PPOF could achieve a reduction in energy use intensity (EUI) between 4% and 17% while improving daylight performance in the range between 27% and 65%, depending on the climate. Therefore, it is apparent that the building form and geometry may enhance the energy performance of buildings, especially when adequately considered at the early design stage.
Another important aspect of passive systems, when used for improving energy efficiency, is the use of building materials, especially for thermal insulation and energy storage. Phase change materials (PCMs) are considered an example of innovative and smart passive solutions that have attracted the attention of many around the world [11]. The benefit of using PCM in buildings relies on the significant amount of latent heat capacity of PCM. More clearly, this material offers much higher energy storage with a slight temperature change than sensible heat storage. This means significant energy can be stored in a small volume at a constant or small temperature range during the phase transition.
Moreover, PCMs can be easily integrated into building envelopes. Many design integration methods are also viable for the embedded-PCMs envelope, which allows various options for practical applications of active or passive systems [12,13]. It should be noted that a large amount of research effort is also focused on improving the physical properties of PCMs and trying to adapt them to specific conditions in construction applications [14,15]. Moreover, many studies focus on various methods of incorporation of PCMs, which is the case in recent research on the effects of capsule geometry on energy storage [16]. The heat transfer performance and phase change behaviors of six PCM capsules of equal size but different shapes were investigated experimentally for use in cold latent heat storage. The findings showed that the optimal shape of the PCM capsules was similar to the red blood cell geometry.
Apart from the experimental protocol that is financially costly and often stressful, many studies have adapted computational methods to investigate the effect of using PCMs in building envelopes, especially with the advancement of computational technology. Furthermore, experimentation may not be possible in many cases, which makes simulation studies complementary to experimental work. Ascione et al. [17] numerically evaluated the influence of PCM plaster on energy savings in the cooling season and naturally ventilated office buildings in five Mediterranean climates. The results showed an increase in energy savings when doubling the PCM thickness. An energy saving of 7.2% was achieved in Ankara. When the office was well-ventilated, a maximum of 22.9% improvement was observed in Naples (Italy). In another study, the feasibility of using PCMs as a potential retrofitting option to reduce the peak indoor air temperature and enhance the occupant thermal comfort was investigated experimentally and numerically in a modern 5-star energy-rated house in Melbourne, Australia [18]. The results showed that PCMs could reduce the indoor air temperature during the day by 1.1 °C and achieve a 34% reduction in hours of thermal discomfort when PCMs are integrated into the ceiling. The study indicated that occupant behavior, such as operating windows and interior doors, may further enhance the PCMs performance.
It was apparent from the literature that PCMs have a positive impact on energy consumption and thermal comfort when evaluated under several climatic conditions [19]. These studies are limited to investigations on optimal PCMs thicknesses, latent heat of fusion, melting temperature, and melting range. In addition, studies are focused on how the PCMs are integrated into the building envelope or when used with active systems. Few studies have addressed the concept of using passive strategies to improve the thermal performance of PCMs when integrated into building envelopes. For instance, Arici et al. [20] proposed a method to distinguish the contribution of latent heat of PCM in the overall energy saving due to the integration of a PCM layer in the external wall of buildings in different cities in Turkey. Piselli et al. [21] investigated the possibility of enhancing the capabilities of PCMs for passive cooling application by natural ventilation in residential building stock under Italian climate zones. The study showed promising results in terms of energy savings when using the two strategies. Moreover, the ideal control of natural ventilation can enhance the efficiency of the thermal energy storage charge–discharge cycle of PCMs. The effect of the exterior design of a building façade with shading devices was recently evaluated when PCMs were integrated into building envelopes in several Saharan climates [22]. This study linked the impact of architectural design, mainly the envelope system and the shading devices, on the thermal and energy performance of a typical housing when PCMs are used. However, limited studies take further steps to enhance the PCM’s performance by considering other factors, such as architectural design. The scientific gap remains deep in this aspect since the architectural design considerations are varied, which may also influence thermal behavior. The novelty of this study, therefore, lies in investigating the impact of two main architectural design aspects, namely, the spatial design (interior layout of spaces) and the window-to-wall ratio (WWR) on the performance enhancement of office building when PCM-embedded envelope systems are used. Several configurations are investigated for an office building under a typical Saharan climate.

2. Presentation of the Ouargla Region

Ouargla is a large desert state (with an area of 211,980 km2) located on the northeastern part of the Algerian Sahara, as shown in Figure 1. This region is characterized by a very harsh environment, classified as a hot desert (BWh) according to the Köppen Classification [23]. In this region, the summer is the longest season in the year, with very high temperatures sometimes exceeding 49 °C and the annual average precipitation is only 45 mm [24]. However, the weather is very pleasant during the mild and warm winter. Despite its arid desert character, Ouargla city can be considered an economic hub in Algeria due to its oil and gas industry, especially in the Hassi Messaoud region. In addition, the region is also witnessing considerable development in several other areas, such as the agricultural sector, culture, and tourism, due to economic and historical considerations. As a result, the urban sector is also influenced, especially in recent years [25], which has led to an inevitable increase in the construction of new administrative buildings. This is the reason for choosing an office building model in the current work in the state capital (i.e., the municipality of Ouargla). The results from this study can be adopted when planning for constructing new administrative buildings or may be used for the renovation of existing office buildings using the PCMs technology in building envelopes to improve energy efficiency.

3. Methodologies

3.1. EnergyPlus Simulation Tool

EnergyPlus, commonly abbreviated as E+, is a whole-building simulation software developed by the US Department of Energy (DOE), which is available for free. It provides the users with tools to model heating, ventilation, and air conditioning (HVAC) systems, cooling load, lighting, and energy flows [26,27] and helps to optimize the building design for low energy use. The software is a collection of several numerical modules that are simultaneously solved to calculate the energy requirements for cooling and heating a building using many systems and configurations and includes advanced simulation capabilities for modeling the building environment and its complex systems.
The ability to model phase transition was made possible in EnergyPlus V 2.0, which was first released in April 2007, by integrating the CondFD algorithm [28]. This algorithm is mainly based on the heat capacity method, which was numerically discretized using a semi-implicit finite difference scheme, with manipulation of auxiliary enthalpy–temperature data, to take into account the evolution of latent heat [28]. Using this database, the heat capacity is approximated using a time-averaging approach proposed by Morgan et al. [29]. While the initial versions of EnergyPlus had a semi-implicit PCM modeling scheme, a fully implicit scheme that is unconditionally stable was later added in version 7 [27]. However, for accurate results and stable computations, a small time step is required.
The thermal performance of PCMs is simulated by EnergyPlus v8.8 through CondFD algorithm in which the one-dimensional implicit finite difference solution is coupled with an enthalpy-temperature function to account for phase change energy (Equation (1)). The specific heat capacity (Cp) of PCMs is updated in each iteration according to the following equation:
C p = h i j h i j 1 T i j T i j 1
where h and T represent the user-defined function of the specific enthalpy of PCMs and the node temperature, while subscript i and superscript j stand for the modeled node and time step, respectively, namely, j and j − 1 are the current and previous simulation time steps. The latent heat of PCM is accounted for via Cp, which is based on the user-defined enthalpy–temperature function. The time step was set to 3 min (20 timesteps per hour) with the node discretization of 3 as per the guideline recommendations for modeling PCM [30].
The CondFD algorithm has undergone numerous experimental validations with mixed precision results. For example, a successful validation of the CondFD algorithm was reported by Zhuang et al. [31], using two envelope systems with PCMs, namely, envelope “A” and envelope “B”. This study showed that the greatest relative difference in temperature was at 12.41% and the least was at 0.71% between the simulation and test results over a sequential period of 36 h in envelope “A”. As for envelope “B”, the maximum relative difference was 8.33% and the minimum was 0.33% in a 72-h sequence. The authors concluded that real weather data and accurate thermal properties are important factors in reducing the deviation between the simulation and experimental results. Other validation efforts of the CondFD algorithm for PCM were obtained by Campbell [32] and Chan [33] using experimental data published by Kuznik et al. [34]. For both validation studies, the indoor air temperature was in good agreement with the experimental results.

3.2. Reference Building Prototype

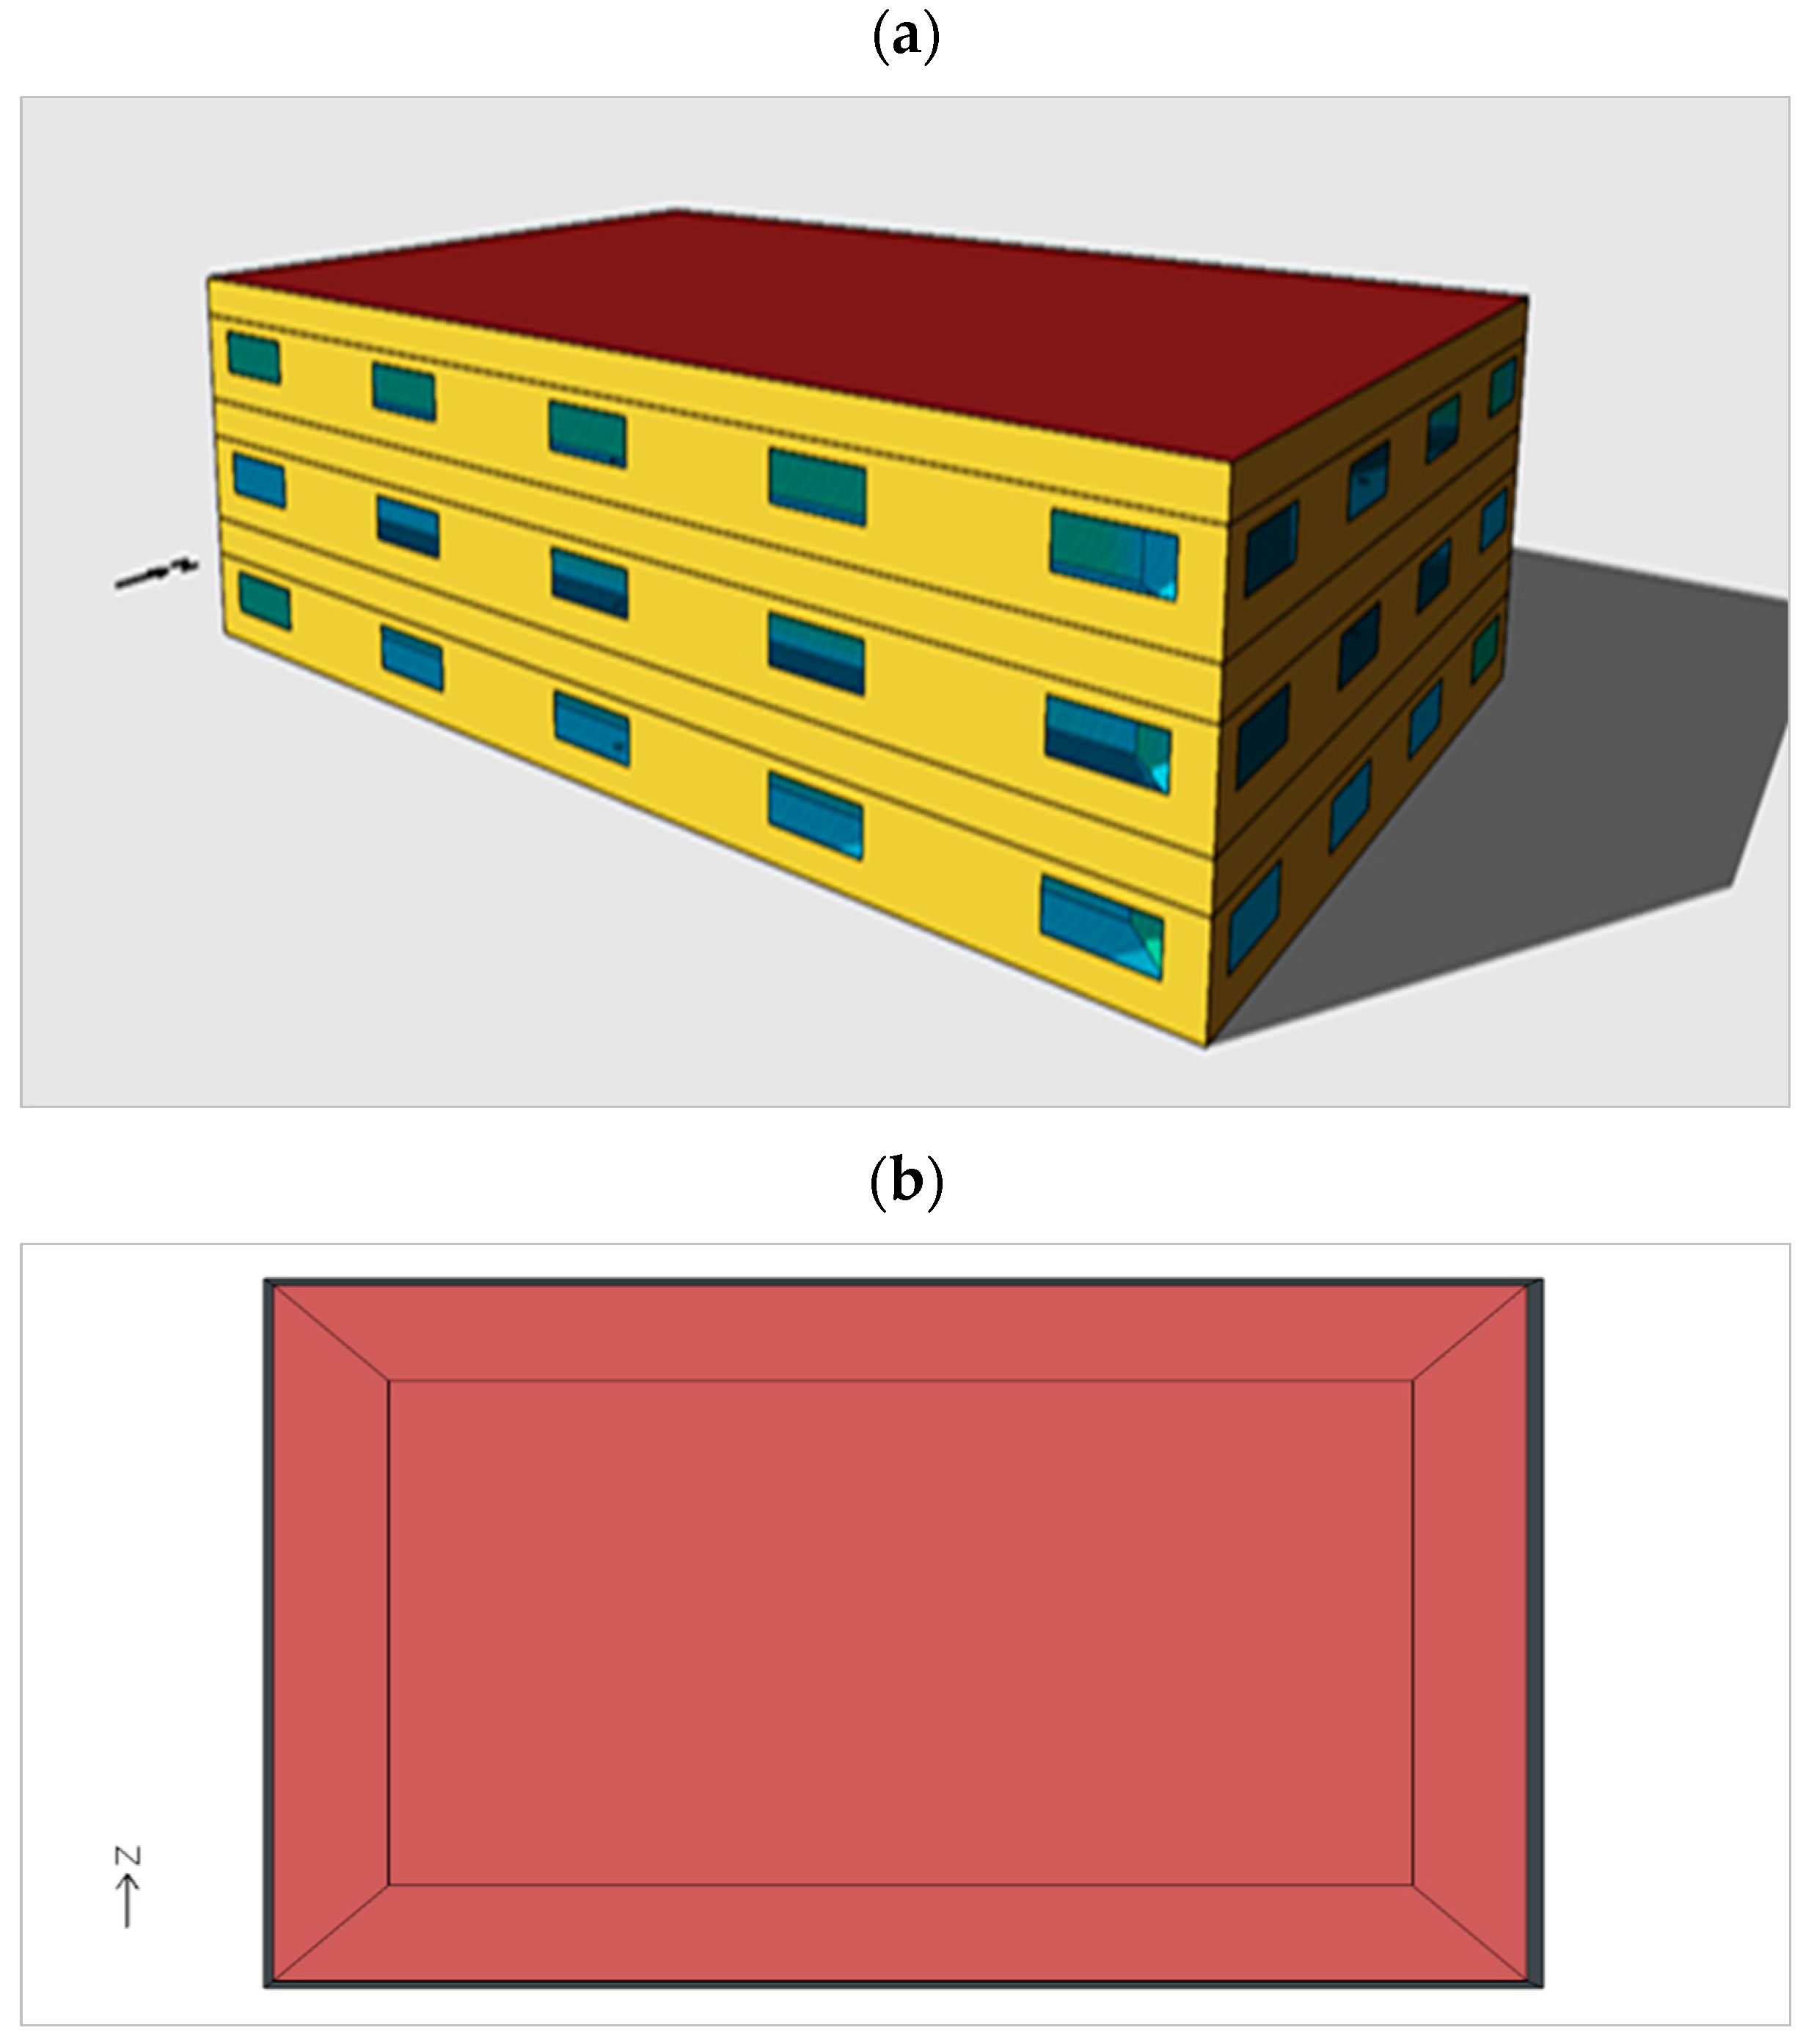
To evaluate the energy performance of PCMs in Ourgala climate, a medium-sized office was selected following the ASHRAE Models of construction of standard prototypes 90.1-2016 [35], and slightly modified to adapt the building to the hot-dry climate conditions as shown in Figure 2a. Figure 2b shows the five thermal zones consisting of four perimeter zones and one core zone which is also identical in all floors. The ASHRAE 90.1 prototype buildings were generated by the Pacific Northwest National Laboratory in support of the US Department of Energy (DOE) Building Energy Codes Program. These construction prototypes are simulated in different climatic zones and could be mapped to other climatic regions for universal use [36].
This building has a rectangular shape (46.32 × 16.91 m), and three floors with a height of 3.10 m per floor, which is usually a practice for an office building. Each level has five thermal zones (i.e., four perimeter zones and a core zone), which can also be considered universal for office building typology. The internal walls are constructed with gypsum board which can easily be retrofitted. The floor contains 5 windows to the north and south with a total window-to-wall (WWR) ratio of 30% and 4 windows with an average of 20% WWR on the east and west sides. All thermal zones are mechanically conditioned. The HVAC system was employed to provide air conditioning, ventilation, and heating in the rooms using a packaged terminal air-to-air heat pump (PTHP) with a variable volume fan control, direct expansion (DX) cooling coil, a gas furnace with electric reheat for heating and an electric heat pump in accordance with ASHRAE standard 90.1 [35]. In this study, the office is generally featured with common architectural and engineering systems so that the proposed design ideas and the conclusion can be generalized in other locations.

3.3. Characterization of PCMs

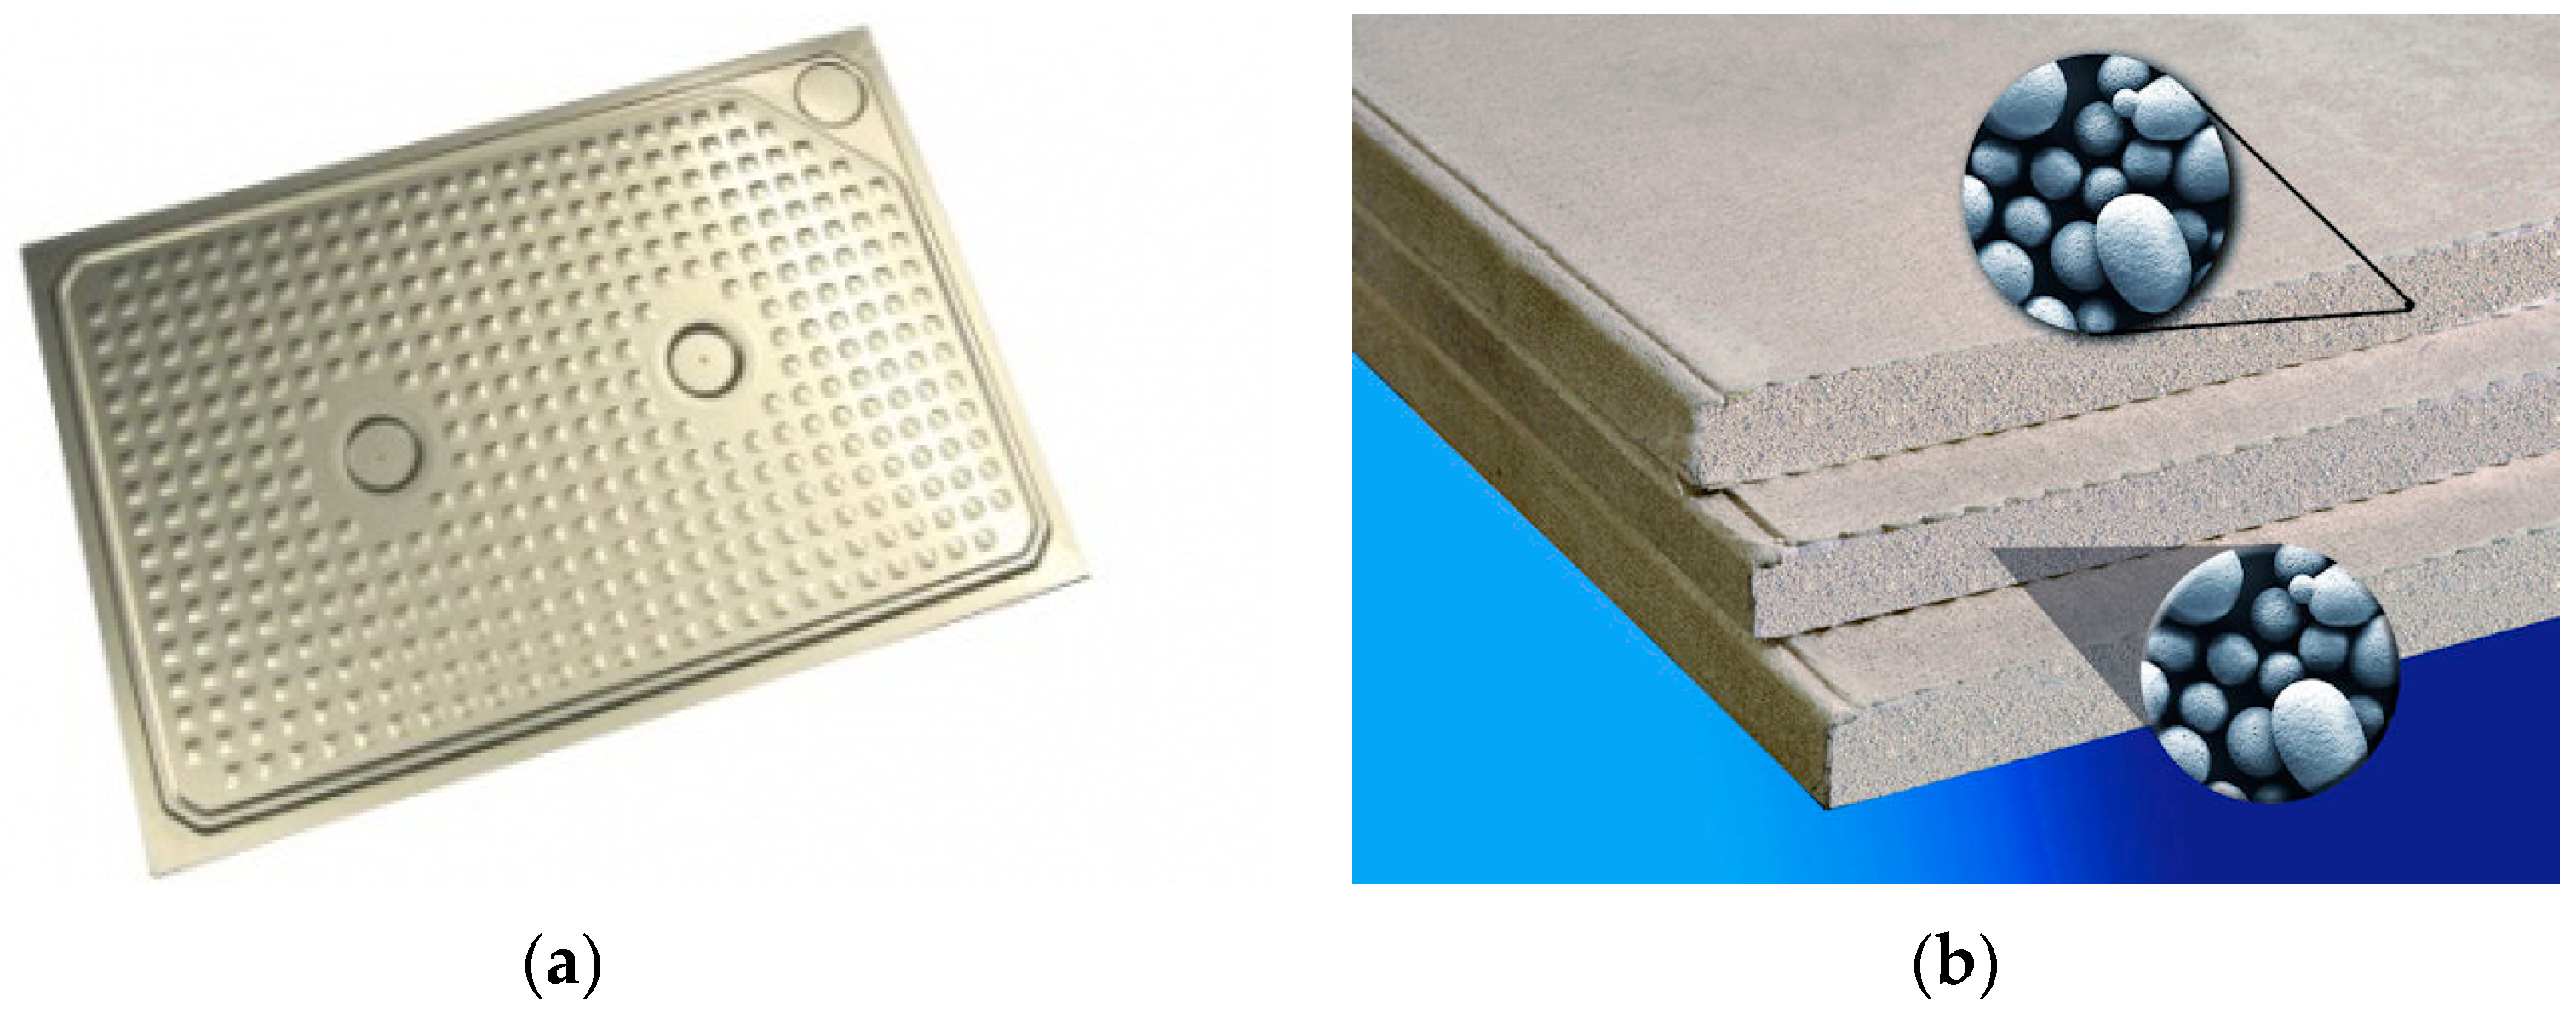
The enthalpy method is based on the simplified equation proposed by Feustel [37] to construct enthalpy–temperature (h–T) curves for PCMs. Figure 3a shows the RUBITHERM® RT organic PCM for external wall surfaces [38], and Figure 3b illustrates the Knauf smartboard as a replacement for regular gypsum used in internal walls [11]. These particular PCM panels are selected for this study because of their low thermal conductivity and high thermal energy storage. The products are well suited for office buildings, easy to install, flexible, reliable, and chemically stable.
The specific heat capacity (Cp) is written as the derivative of enthalpy with respect to the temperature. As a function of temperature, the enthalpy is nonlinear in the phase transition temperature (Tm) range. The specific heat can be described by Equation (2) as follows:
C p T = d h d T
The enthalpy is defined by Equation (3):
h = C p T d T 0 T
Generally, at the melting point, the specific heat capacity exhibits high values due to the latent heat of fusion. Outside the melting range, the thermal diffusivity (α) is linear because the thermal properties are nearly constant. The PCMs, such as crystalline substances and eutectics, exhibit a discontinuous transition, whilst some PCMs, such as mixtures, have continuous enthalpy curves. Egolf and Manz [39] described the enthalpy function with discontinuity using the following equations:
h ( T ) = C p 1 T + η 1
w i t h : T T m
h ( T ) = C p 1 T m + ( h 2 h 1 ) + C p 2 ( T T m ) η 2
w i t h : T > T m
With:
η n = ( h 2 h 1 2 ) e ( 2 T T m τ n )
w i t h : n 1 , 2
The CondFD algorithm in EnergyPlus does not model the discontinuity at the melting region. Thus, it is necessary to find a continuous equation for enthalpy, which may describe the enthalpy as a function of temperature for the entire temperature range. For PCMs that exhibit asymmetrical specific heat distribution for the melting zone, the melting temperature (Tm) can be assumed at the mid-point (refer to Figure 4).
Feustel [37] used a hyperbolic function to simplify the relationship between the specific heat and the enthalpy as follows:
h T = C p , c o n s t T + h 2 h 1 2 × 1 + tanh 2 β τ T T m
Since the specific heat capacity is the derivative of the specific enthalpy, the following equation is obtained:
C p T = C p , c o n s t + h 2 h 1 2 × 2 β τ cosh 2 2 β τ T T m
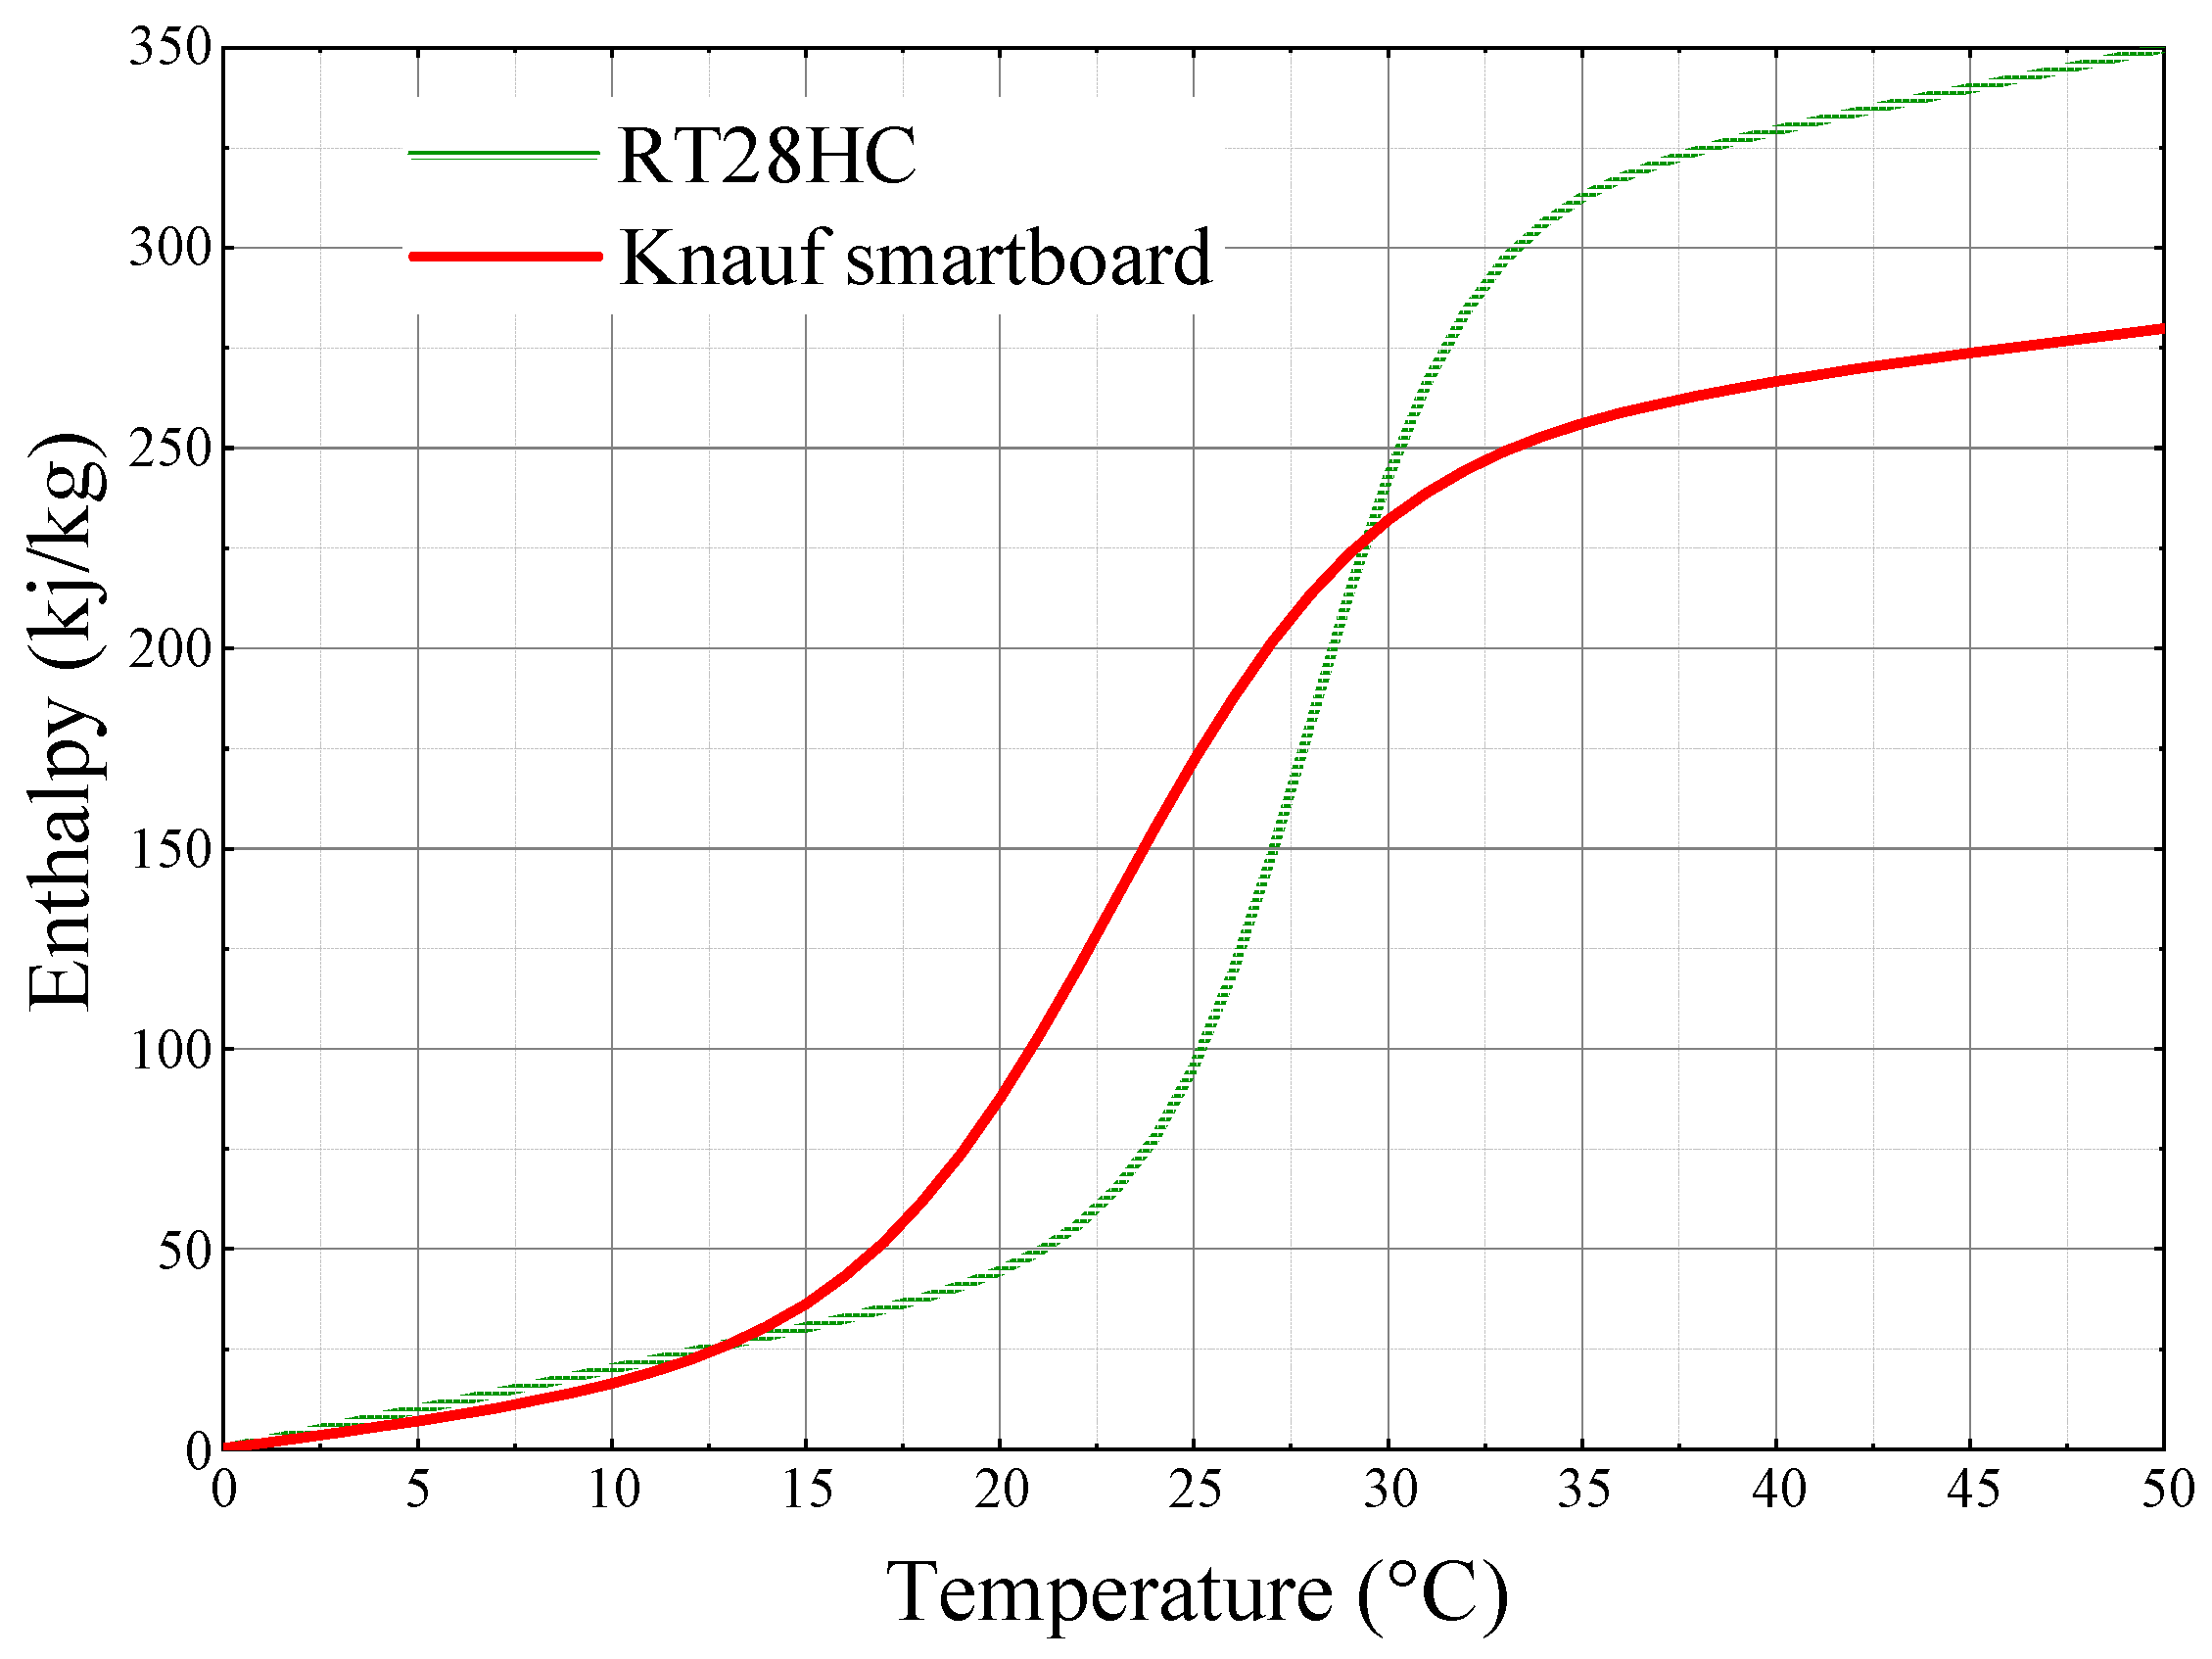
For this study, two PCMs products, namely Knauf smartboard [11] and RUBITHERM [38], are used. The thermophysical properties of both products are listed in Table 1. By using these properties and the above enthalpy equation, two h–T curves can be obtained, as shown in Figure 5. It is worth mentioning that in actual PCM integration, manufacturers may provide standard thickness based on the market or manufacture specific thickness based on the client requirement. In this study, the thickness of the PCM panel was varied to show the influence of the thickness on the energy consumption.
By using the thermophysical properties of PCMs and substituting them in the enthalpy equation, the two h–T curves can be obtained, as shown in Figure 5.

4. Results and Discussion

A building is primarily affected by various climatic conditions and internal heat gains from occupants, lights, and appliances, which may drive heat gain and/or loss. Thus, these factors may influence the energy demand needed for heating, cooling, and ventilation systems. The enhancement of the thermal performance of the exterior envelope system and the interior spatial design are considered effective passive strategies to reduce thermal loads, especially in the case of renovation. Accordingly, in this part of the study, a detailed assessment of the effect of using PCMs wall panels with various thicknesses on energy consumption is made. Other passive strategies for reducing heating and cooling loads may include controlling solar heat gain by reducing window sizes. The effects of these possibilities on the total energy consumption and thermal performance of PCMs are studied.

4.1. Impact of PCMs on Annual Energy Consumption of the HVAC System at the Building Level

As previously discussed, a complete HVAC system has been installed for the building to maintain thermal comfort. The HVAC system consumes a significant amount of annual energy consumption. The energy consumption needed for thermal comfort was estimated for the base case model. The cooling energy consumption was the highest, reaching 84.72% of the total energy, followed by the ventilation system at 13.17%. These results were mainly due to the extremely hot and dry climate and the intense solar radiation experienced in Ouargla city. The climatic conditions together with the high internal load have resulted in low demand for heating energy (i.e., less than 2.11%). Therefore, this Saharan climate can be considered a cooling-dominated climate with negligible heating demand.
Table 2 shows the effects of using both the Knauf smartboard instead of regular gypsum in the interior walls and the RUBITHERM® CSM PCM panels in the building’s exterior cladding. Taking into account the energy savings based on HVAC subcategories (i.e., cooling, heating, and ventilation), the results showed that the PCMs can be considered a promising solution for reducing the demand for heating. In particular, the reduction for 50 mm PCMs layers was 71.93% and 34.36% for electric heating and gas consumption, respectively. In addition, the results also showed that incrementing the PCM thickness has a promising potential to reduce energy consumption. For instance, PCM panels with a thickness of 10 mm reduced the total HVAC electricity (i.e., heating, cooling, and ventilations) and gas demands by 3.54% and 31.84%, respectively. In contrast, thicker PCM panels with 50 mm resulted in a reduction of 6.18% and 34.36% of total HVAC electricity and gas consumption, respectively. This is due to the capture of solar radiation on all four sides of the building and the storage of internal thermal heat that was released when the PCMs solidified due to the perceived decrease in outdoor temperatures. The design of the building that makes the core less demanding of heating energy could also be the reason for such findings.
To fully investigate the effect of PCMs on reducing heating energy consumption, the top floor of the building was taken for further analysis. For this floor, the total heating energy consumption of the perimeter zones was 356.03 kWh, and it was approximately the same for four cold months of the year (i.e., January, February, November, and December). The PCMs met a significant amount of heating demand (i.e., more than 91%) in January. In February, November, and December, the demand for heating energy in the inner core reached 17.63, 4.07, and 7.26 kWh, with a total of only 28.96 kWh during December. Meanwhile, 0.81 kWh of energy in the building reinforced with PCMs did not exceed the required energy rating, which was recorded only in January. This energy rating proved the efficiency of PCMs in storing heat.
The gained results indicated a significant reduction in cooling energy also when PCMs are utilized, as shown in Table 2. In absolute terms, the energy savings are 8.88 GJ and 23.12 GJ for 10 mm, and 50 mm PCM panels, respectively. Despite the high reduction when considering the absolute values, the maximum percentage of energy savings is only 4.34%. Likewise, the results showed that PCMs have a reasonable reduction in the energy consumption of the ventilation systems when considering the absolute values. However, when considering the relative values the saving is low compared to the reduction achieved for heating. When the temperature rises in the melting phase of the PCMs, the shift and the reduction in the peak demand provided by PCMs are directly proportional to the increase in the PCMs’ thickness. The demand for cooling energy would likely increase in other hours of the day due to the release of the stored energy in the PCMs. Based on these results, other passive methods were used in this study to complement the PCMs. This consideration may deem necessary when planning for renovation to reduce the cooling energy. The potential of the complemented passive design strategies will be further analyzed to quantify their benefits for reducing cooling energy consumption and subsequently proposed for further consideration.

4.2. Impact of PCMs on Annual Energy Consumption of the HVAC System at the Floor Levels

Figure 6 shows the electrical energy consumption of the DX cooling coil in typical floors (i.e., uppermost floor (TOP), middle floor (MID), and ground floor (BOT)) of the base case (i.e., without PCMs) building and the other three PCMs design cases (i.e., PCM with 10, 20 and 30 mm thickness). It is worth mentioning that the air is returned via the ceiling plenum on the roof floor.
The results showed that the upper floor consumed higher cooling energy than the other two floors, as shown in Figure 6. For this floor the roof is exposed to the outside environment, which increases the heat gain that has to be removed by the air conditioning system. The ground floor is the second-largest energy consumer due to the exposure of the ground floor and the reflected solar radiation from the surroundings. The PCMs have reduced the energy consumption of the uppermost floor by 2.05%, 4.1%, and 5.97% for the 10 mm PCMs, 30 mm PCMs, and 50 mm PCMs, respectively. Likewise, the energy consumption was reduced by 3.67%, 4.85%, and 5.38% when using 10, 30, and 50 mm PCMs, respectively, for the ground floor. A slight increase in energy consumption is observed for the middle floor when 10 mm PCMs are used. However, the energy consumption was reduced by 0.75% and 1.59% when using 30 mm PCMs and 50 mm PCMs, respectively. For this particular floor, the PCMs provided lower potential. It was observed that the PCMs stay in a liquid state for a longer period when compared with other floors. For instance, during July, the average temperature in the return air stream in the middle floor was 25.6 °C, which was close to the thermal comfort range, on the one hand, and close to the point of fusion of PCMs, on the other. This indicates that the discharging process of heat stored in PCMs is continuous on the middle floor compared to the other two floors. It is also worth pointing out that the other two floors have outside exposure, which may help to dissipate heat when outdoor conditions are favorable. This condition may have aided other floors in accelerating the discharging process of heat in PCMs.

4.3. Impact of PCMs on Monthly Energy Consumption of the HVAC System at the Zone Levels

The energy consumption of the HVAC systems on each floor was studied when PCMs were used. This should identify the favorable environmental conditions that may optimize the thermal performance of PCMs. This may shed light on the thermal performance of PCMs, especially when considering the orientations of the thermal zones that may be of particular importance due to the variations in solar radiation. To study this further, the impact of using PCMs on monthly energy consumption is analyzed.
Cooling load is the amount of thermal energy (sensible and latent heat) that should be removed for the thermal zone to maintain the indoor environmental conditions at an acceptable thermal comfort range. On the contrary, the heating load is defined as the amount of thermal energy that must be added to a zone. Cooling load calculations consider heat transfer by conduction, convection, and radiation, and involve the complex interaction between the building envelope, internal loads, and outside environmental conditions. The cooling load may be determined under steady-state or dynamic conditions and, in some cases, may involve complex physical phenomena. The cooling load calculation methods are described in several documents, such as the ASHRAE handbook of fundamentals [40], ISO 11855 [41], and European standards [42]. ASHRAE recommends the heat balance method and radiant time series methods for cooling load calculations. In this work, the heat balance method provided by EnergyPlus was used. The heat balance of the outer surface represents the sum of the heat flux of absorbed direct and diffused solar radiation, long-wavelength radiation flux, convective flux exchange with the outside air, and the conduction heat flux. The outside air temperature, solar radiation, and the wind are in direct contact with the external envelope of the building; therefore, the different climatic conditions, in addition to the thermo-physical properties of the layers of the walls and roof, can significantly impact the heat gain and consequently the energy needed for thermal comfort.
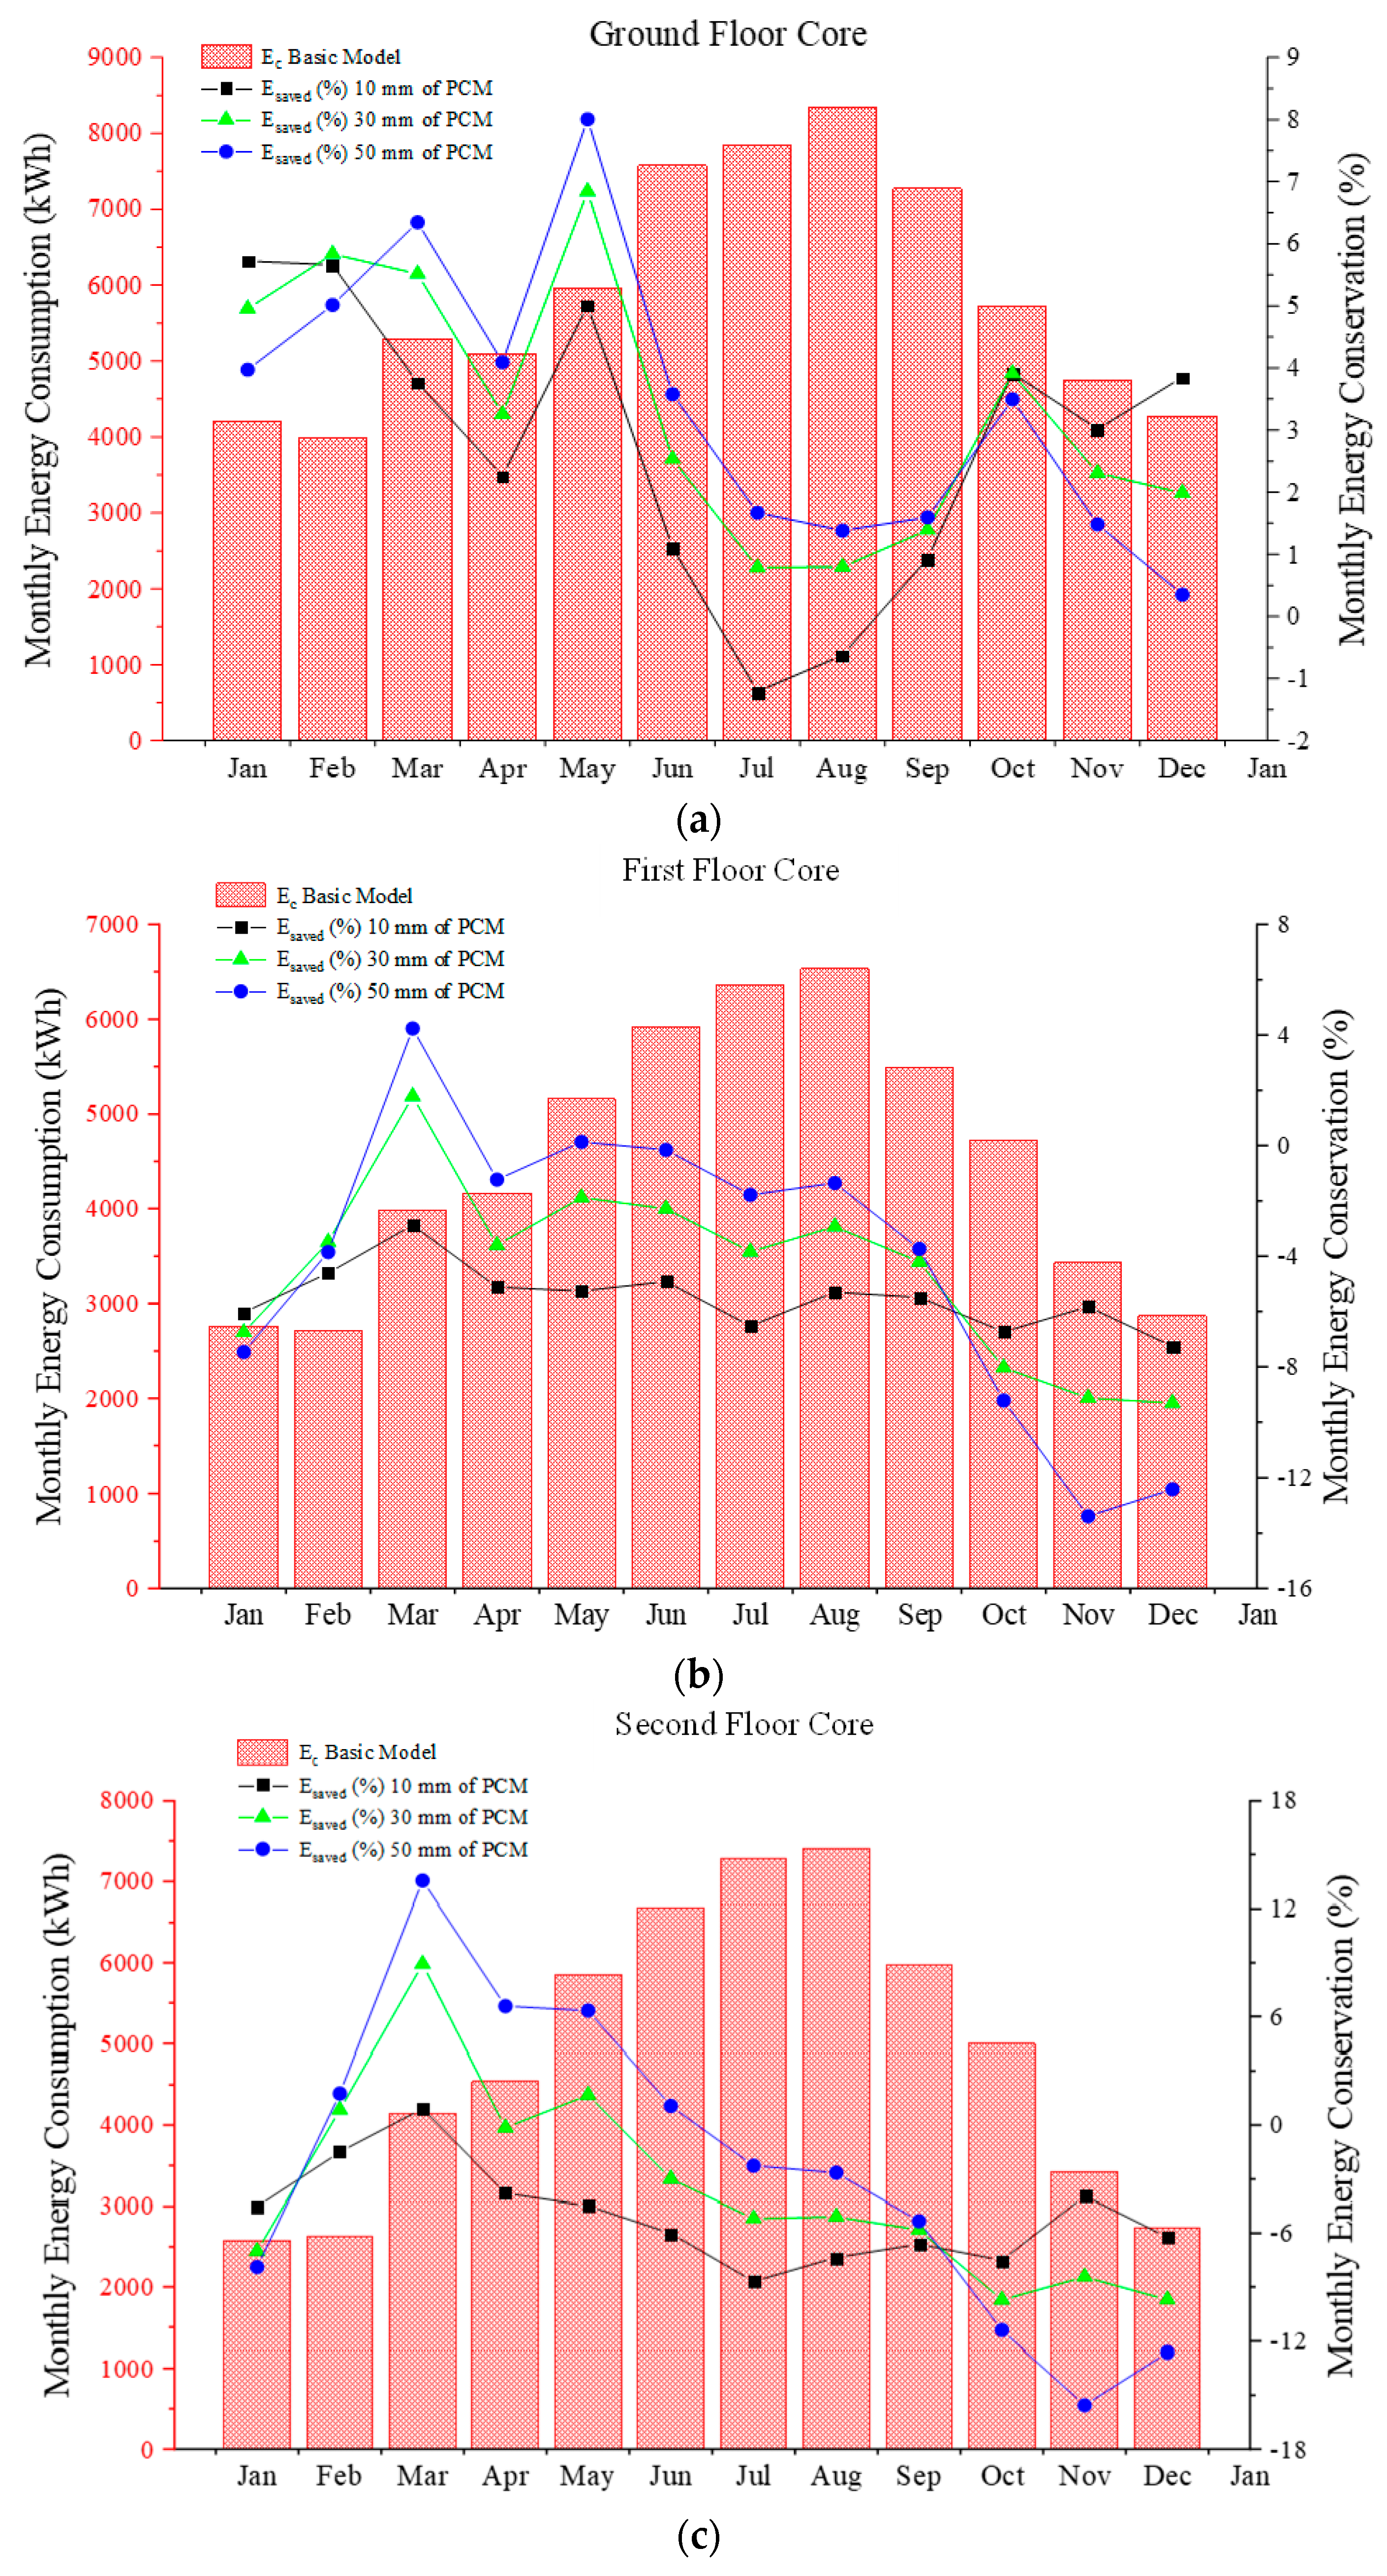
Figure 7 displays the energy requirements due to the cooling load in the core zones of the ground, first, and second floors. As shown in Figure 7, the core zone consumes high energy, even if it is not exposed to solar radiation, when compared to the perimeter zones (refer to Figure 8, Figure 9 and Figure 10). The core zone has the largest floor area (representing around 59% of the total floor), and it is characterized by high internal heat gain. On a monthly basis, the cooling energy is significant in the summer months (peaked in August) and then gradually decreases in the transition and winter months. This gradual difference is due to the variations in the outside environmental conditions, mainly characterized by high outdoor air temperatures and intense solar radiation. For example, the average daily temperature and the average direct solar radiation for August were 35.67 °C and 564.01 W/m2, respectively. These values were recorded at 19.07 °C and 554.94 W/m2 in March, while the average temperature did not exceed 10.97 °C during January, whereby the ambient temperature dropped noticeably at night. Therefore, the climatic condition is a major driver for the variation in the monthly cooling energy. The 50 mm PCMs layer was able to provide a maximum of 8%, 5%, and 13% reductions in the cooling energy in the core area for the ground floor, first floor, and second floor, respectively. The maximum reduction occurred in May for the ground floor and in March for the middle and uppermost floors. This can be related to the impact of the soil beneath the ground floor since it acted as one of the boundary conditions. The lack of solar radiation in the core areas has contributed to increasing energy consumption when PCMs are used. In general, thinner PCMs layers perform poorly in summer as they have a negative impact on the cooling energy for the upper floors. On the other hand, thicker PCMs layers perform poorly during the winter months for the upper floors. For example, on the middle floor, the use of 50 mm thick PCMs increased the cooling energy consumption in November by 13.4% and by 5.83% for 10 mm thick PCMs (Figure 7). Overall, the PCMs perform better when used for the ground floor.
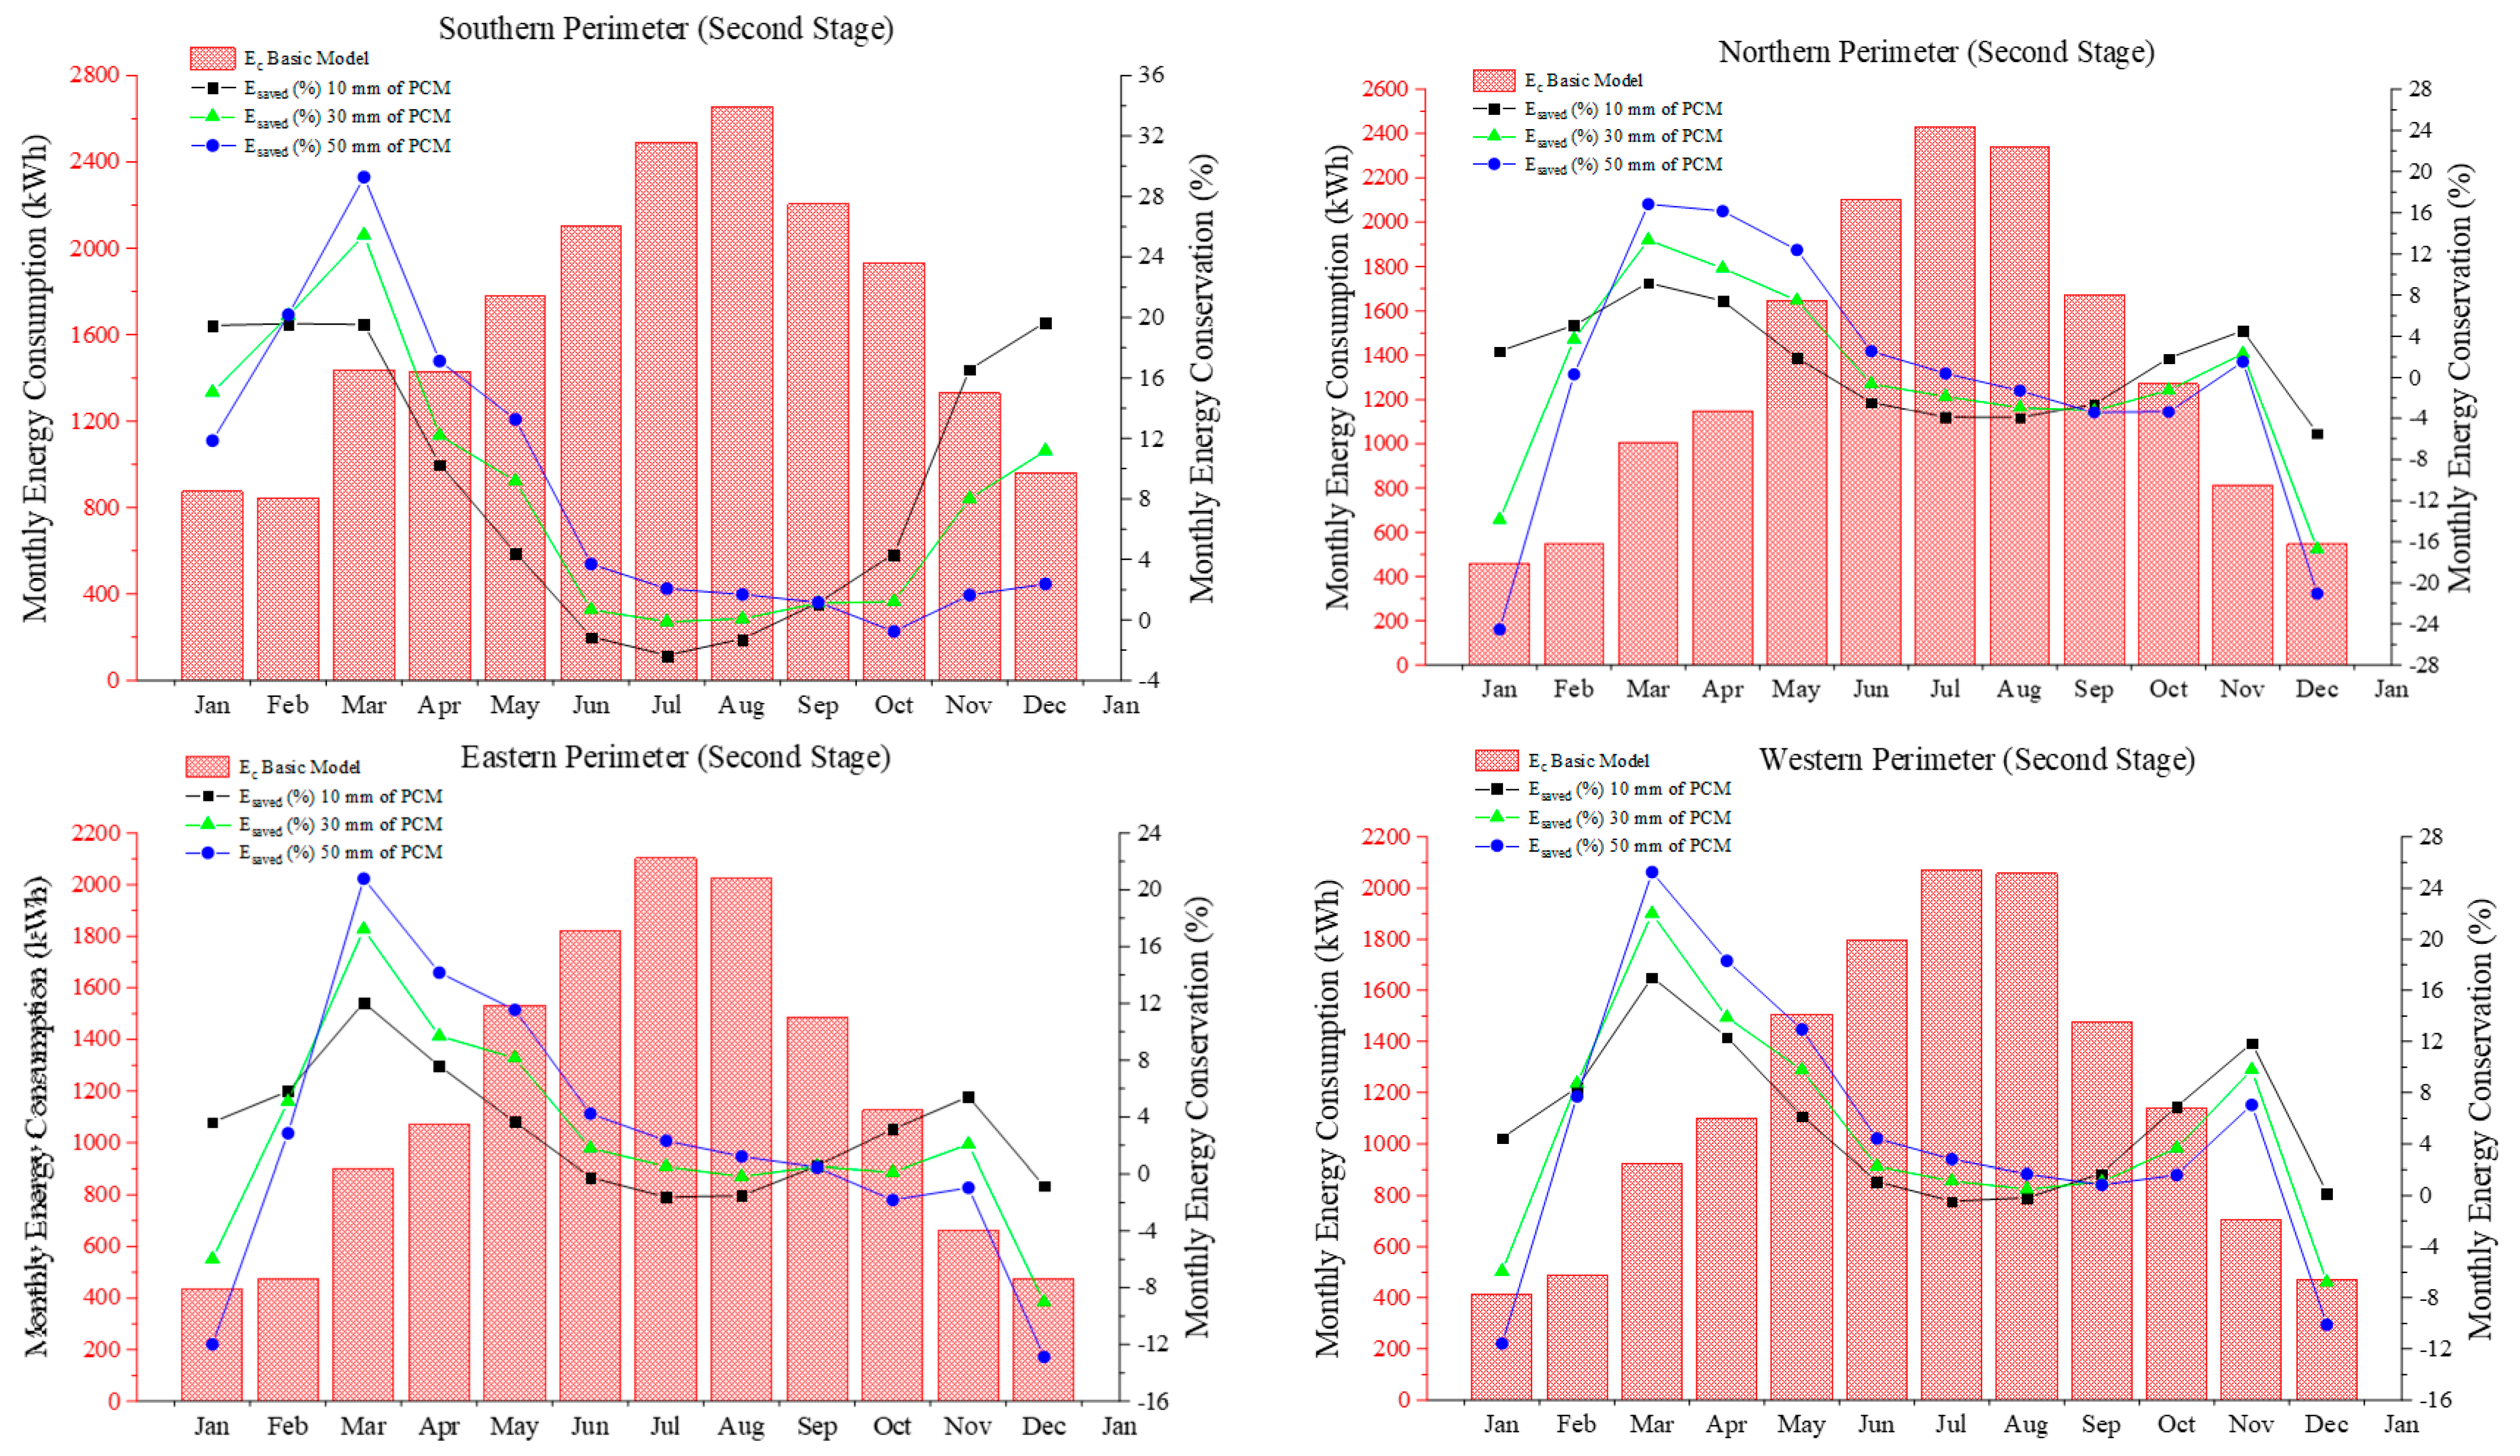
Energy consumptions for the perimeter zones for the ground, first and second floors are shown in Figure 8, Figure 9 and Figure 10, respectively. On the ground floor, the north, east, and west zones achieved high energy savings in May and October, as shown in Figure 8. For the first and second floors, the north, east, and west perimeter zones experienced high energy savings in March and November with the exception of the south zones, which achieved high energy savings in March and December, as illustrated in Figure 9 and Figure 10, respectively. In general, the south thermal zones (refer to Figure 8, Figure 9 and Figure 10) consumed more energy than other perimeter zones due to higher solar radiation. The south zone has high energy savings in March and November. Energy savings reached 13.90% in the eastern perimeter of the ground floor during the month of May, and this ratio exceeded 29.3% during March in the southern perimeter for the upper floor, as shown in Figure 10. The role of PCMs decreased dramatically during the winter, even when increasing thickness. The PCMs play a negative role in reducing the energy consumption in areas less exposed to solar radiation, as was previously shown for the core areas (refer to Figure 7). For example, the use of 50 mm thick PCMs in the northern perimeter of the middle floor resulted in 12.2% increase in energy consumption in January, as shown in Figure 9. The 10 mm thick PCMs increased the energy consumption by 5.52% for the same zone. This observation is applicable to all other zones and floors but less significant on the ground floor, as shown in Figure 8. The reduced role of PCMs or the negative impact during cold periods could be explained by the lack of a natural thermal energy source, mainly from solar radiation. Since the PCMs’ melting temperature is close to the thermostat setpoint, the PCMs utilized the heat energy from the HVAC system, which subsequently increased the energy consumption.
The results clearly indicate that the PCM plates in the perimeter zones are more noteworthy in reducing energy consumption than the PCM-enhanced gypsum boards located in the core areas, due to the high core surface areas which have negatively impacted the performance of PCMs. Therefore, the spatial design of the core area should be reconsidered, and the perimeter areas should be enlarged. This consideration is expected to enhance the thermal performance of PCMs. In addition, this may help to reduce the window areas required for passive heating on the perimeter zones, since PCMs can now help in storing more heat from the solar radiation which can be used at later stages to offset the heating requirement. This recommendation is applicable when retrofitting the building. Further strategies will be explored in the next sections.

4.4. Impact of PCMs When Combined with Potential Passive Strategies

4.4.1. Passive Strategy Scenario# 1: Reduce the Window-to-Wall Ratio (WWR)

In the first part of the study, the medium-sized office building following the ANSI/ASHRAE/IES Standard 90.1-2016 was modified for the desert climate of Ouargla, Algeria, as indicated in Figure 3. The construction layers used in the exterior walls and the roof were perfectly suited to such climatic conditions (with R-value for the external wall = 1.27 m2 K/W and the R-value for the roof = 3.53 m2 K/W). The window was a double-glazing system with an R-value of 0.21 m2 K/W, a solar transmission of 0.17, and solar reflectance of 0.30. However, the perimeter zones are with high WWR, which increases the spaces’ vulnerability to solar thermal gain, especially in summer months. With the introduction of PCMs layers, the glazing areas can be reduced since PCMs can capture the needed solar radiation, which will offset the heating requirements that otherwise would be passively provided by the windows. Therefore, this strategy is further analyzed to evaluate the potential of reducing the WWR. As shown in Figure 11, the area of each window is reduced to half to obtain model (A-1) and then reduced to a quarter to develop model (A-2). Based on the original model, the optimal model was deduced from these three models.
Table 3 lists the effect of reducing the WWR by 50% on energy requirements by category. The results revealed the use of model (A-1) instead of the base case has resulted in a 16.17% increase (or reduction of 1.46 GJ) in gas heating energy. However, the electrical heating energy was reduced by 31.9% (or 4.19 GJ). A negative effect on lighting energy consumption was observed when the WWR was reduced. The demand for indoor lighting power consumption in this model was increased by 20.22 GJ (or a 6.26% increase) compared to the base model because the daylighting control was active in the model. This increase in lighting energy is related to the need for more artificial lighting to complement the reduction in daylighting that should have been provided by large windows. The cooling and ventilation (mainly from the fan) energy demands were reduced by 6.22% and 7.06%, respectively. The reduction is primarily attributed to the resizing of the window areas, which reduces the admitted solar radiation as well as the reduction in conductive heat transfer across the glazing. This finding is backed up by a closer look into the cooling-dominated months between May and September. During this period, the heat gains through the windows were estimated at 41,788.70 kWh for the base case and became 20,986.23 kWh for the glazing model (A-1), a reduction of approximately 50% in heat transfer. This condition could explain the significant reduction in energy consumption for ventilation and cooling when the window sizes were halved.
The use of PCMs in model (A-1) improves heating energy savings, as shown in Table 4. The use of gypsum reinforced with PCMs in the interior walls and CSM plates in the exterior walls (10 mm thick) saved 35.23% and 51.85% of the heating demand from natural gas and electricity, respectively. However, the role of PCMs in reducing energy consumption for cooling and ventilation was diminished in this model. Nevertheless, the use of PCMs allowed slightly more energy saving in cooling demand in model (A-1) compared to when they were used in the base model. For example, when 10 mm CSM plates (i.e., PCMs plates) were used in model (A-1), 9.73 GJ of cooling energy (i.e., or 1.97%) was saved, while it did not exceed 8.88 GJ (i.e., 1.69%) when similar plates were used in the reference model. This difference in cooling energy savings remained, even when the thickness of the PCM panels was increased. This result can be explained by the increase in the surface areas that were enhanced with PCMs when the window sizes were reduced. The thermal performance of PCMs was also improved when heat gain in the building was reduced.
Table 5 shows the energy performance of the windows model (A-1) with PCMs compared to the base case model. These results were compared with the outputs of other improved models with PCMs to estimate the optimal model easily. As seen from the table, the combination of the two passive strategies (i.e., reducing the WWR and utilizing PCMs layers) further improves the energy efficiency of the building. The use of 10 mm CSM panels and the reduced windows saved 8.07% and 13.26% of the cooling and ventilation energy demands, respectively. A reduction of 10% in HVAC electric energy is recorded for this design option. On the other hand, the cooling energy was reduced by 11.05% in model (A-1) with 50 mm thick PCMs. For this design strategy, the annual HVAC electricity (i.e., heating, cooling, and ventilations) is reduced by 12.71%.
As shown in Table 6, the heating energy demand from the natural gas increased by 1.58 GJ (18.09%) when the windows model (A-2) was used, a 75% reduction in WWR from the base case. On the other hand, the electric heating energy was reduced by 5.44 GJ (41.49%). The energy consumption for cooling and ventilation was cut down by 8.80% and 10.15%, respectively. This was due to the significant reduction in heat gain through the windows. The negative impact became more apparent with this windows model on the electrical energy consumption demand for interior lighting of the building. The electrical energy demand for lighting had increased by 38.01 GJ, an increase of 11.76% in lighting energy.
On the other hand, the PCMs played an effective role in saving the cooling and ventilation energy when used with model (A-2), reaching 31.87 GJ for the case of 50 mm PCMs, as shown in Table 7. In addition, the results exhibited that the thermal performance of PCMs was influenced by the total heat gain in the building when windows were minimized. For example, when comparing model (A-1), model (A-2), and the base case, the 10 mm thick CSM panels, were able to save 2.30% of the cooling energy consumption, i.e., a difference of 0.61% and 0.33% in energy savings for the base building and model (A-1), respectively. This difference was increased by 1.29% (for the base case) and 0.53% (for model (A-1)) when using panels with 50 mm thick PCMs. When considering the PCMs thickness of 50 mm and model (A-2), the annual HVAC electricity (i.e., heating, cooling, and ventilations) is reduced by 15.50% compared to 12.71% for the case of model (A-1). For the thinner PCM layer (i.e., 10 mm), the HVAC electrical energy (i.e., heating, ventilation, and cooling energy) is reduced by 12.77% for this model option.
Table 8 shows very promising results in the reduction in energy consumption, particularly electrical cooling. As seen in model (A-2), improvement with PCMs in the gypsum interior walls and 50 mm thick CSM plates can save up to 86.47 GJ of cooling (a reduction of 13.98%) and ventilation energy (a reduction of 15.83%) and 9.72 GJ (74.14%) of electrical energy heating when compared to the base case model.
Regardless of the architectural and aesthetic characteristics, the results have shown that WWR in arid desert environments must be carefully considered, as their reduction can contribute to savings in cooling and ventilation energy consumption but may increase the heating and lighting energy demand. Although the reduction in WWR causes an increase in the lighting energy demand, this issue can be solved by the utilization of high-performance lighting systems such as LED lights. In addition, heating demand may be reduced by providing more space for energy storage, such as the use of glass windows filled with PCM, which may store a significant amount of energy.

4.4.2. Passive Strategy Scenario# 2: The Rezoning of the Core Areas

This part is focused on the impact of the spatial designs on improving the energy performance of building with/without PCMs. The base case office plan is characterized by a large core area on each floor which may not be appropriate for the arid climate. This floor plan has increased the demand for ventilation, cooling, and lighting energy, unlike heating energy, as previously discussed. Figure 12 shows the spatial design models that are proposed for this analysis. The core area is reduced from 59.22% for the base case to 28.58% and 7.89% for model (B-1) and model (B-2), respectively. The perimeter zones were consequently increased when each core corner was moved inwards by 4.57 m. These configurations were selected to evaluate the extent of the spatial modifications.
Table 9 shows a positive impact on the energy consumption for cooling, ventilation, and lighting when the building design is changed, even without using PCMs, compared to the reference model. Model (B-1) has saved a significant amount of electrical energy, estimated at 40.04 GJ, due to the resizing of the core areas. In addition, the demand for lighting energy has significantly reduced for the perimeter zones because they have more access to daylight. The rezoning of the floors, decreasing the core zones in this case, has an effective role in reducing the thermal gains and, therefore, reducing the demand for cooling energy. This modification has, however, increased the demand for heating energy in perimeter zones. For model (B-1), the heating energy demand has risen by 14.45 GJ (or 165.5%) and 0.42 GJ (or 3.2%) for natural gas and electric heating, respectively. This difference can be explained by the lower heating demand of the core spaces compared to the perimeter zones, which are more vulnerable to the outside environment. Since the perimeter zone areas are incremented, the heating demand has increased too.
Table 10 shows the effect of using PCMs in model (B-1), whereby a thickness of only 10 mm was able to significantly reduce heating energy consumption by 15.53% and 54.39% for natural gas and electricity demand, respectively. PCM sheets were also effective in reducing the ventilation (mainly fan energy) and cooling energy consumption. The use of PCMs with gypsum and CSM sheets 10 mm thick, for example, saved 2.41% of the cooling energy demand. These results clearly showed that the thermal performance of PCMs can be affected by the internal design of the building, i.e., 2.41% of cooling energy savings in model (B-1) compared to 1.69% in the base case model when 10 mm PCM plates are used. Although the amount of PCMs with gypsum in model (B-1) was less than the amount in the base model, this reduction was due to the decrease in the total area of the internal walls, which was 1281 m2 in the base case model and became 1193 m2 in model (B-1). More energy savings are also observed as PCMs thickness is increased.
Comparison of the architectural design scenarios of models (A-1), (A-2), and (B-1) with PCMs clearly demonstrated that the options of reducing the WWR (i.e., A-1, and A-2) are more favorable from energy-saving perspectives than modifying the spatial floor design (i.e., B-1). Table 11 presents the results of the model (B-1) with various PCMs thicknesses compared to the base case. When B-1 model is considered with a PCMs thickness of 50 mm, the annual HVAC electricity saving is 8.54%, while it is 6.19%, 12.71%, and 15.50% for the PCMs option only, the PCMs with model (A-1) and the PCMs with model (A-2), respectively. The results suggested that adopting both options (i.e., model A and model B) would further reduce heat gains in the building and, therefore, achieve more positive results in reducing energy consumption, in general, and cooling and ventilation energy, in particular.
Despite the increase in heating energy in the perimeter zones, the rezoning of the core areas has contributed to the reduction in the lighting and cooling energy. This trend is also clear for the model (B-2), as outlined in Table 12. The demand for heating energy increased to 21.13 GJ (or 242.04%) and 2.16 GJ (16.47%) for natural gas and electricity, respectively. These results were due to the increase in the perimeter zones. The results also showed the importance of spatial design, which needs careful attention to avoid unnecessary energy consumption. The spatial design is normally considering the administrative, functional issues, and architectural aesthetics with less regard to the energy demand.
The incorporation of PCMs in model (B-2) has reduced the energy consumption of the HVAC systems. The energy-saving rates are increased with increasing thickness, as shown in Table 13 and Table 14. The results also confirmed that the thermal performance of PCMs can be affected by the building design, as shown in Table 13. The use of 10 mm thick CSM panels has reduced the cooling energy consumption by 2.84%. Meanwhile, CSM panels of 50 mm have saved 5.10% of cooling energy consumption. The results have generally proved that the cooling energy demand in the building and the thermal performance of PCMs were affected by the design of the building. The annual HVAC electricity is reduced between 6.1% to 7.61% for PCMs of thickness between 10 mm and 50 mm.

4.4.3. Combing the Passive Strategies with/without PCMs

The previous sections clearly demonstrated that passive strategies are wise to consider since they have enhanced the performance of PCMs considerably. This section will evaluate the idea of combining the reduction in WWR and the resizing of the core areas with/without PCMs. It is expected that blending the two strategies may produce an attractive and improved design for reducing energy consumption. The new designs generated from this proposal are as follows:
  • The rezoning scenario model (B-1) with a 50% reduction in WWR (i.e., model (A-1)) is now designated as (B1-A1), and the version with a 75% reduction in WWR is named (B1-A2);
  • The rezoning scenario model (B-2) with a 50% reduction in WWR (i.e., model (A-1)) is designated as (B2-A1), and the version with a 75% reduction in WWR is called (B2-A2).
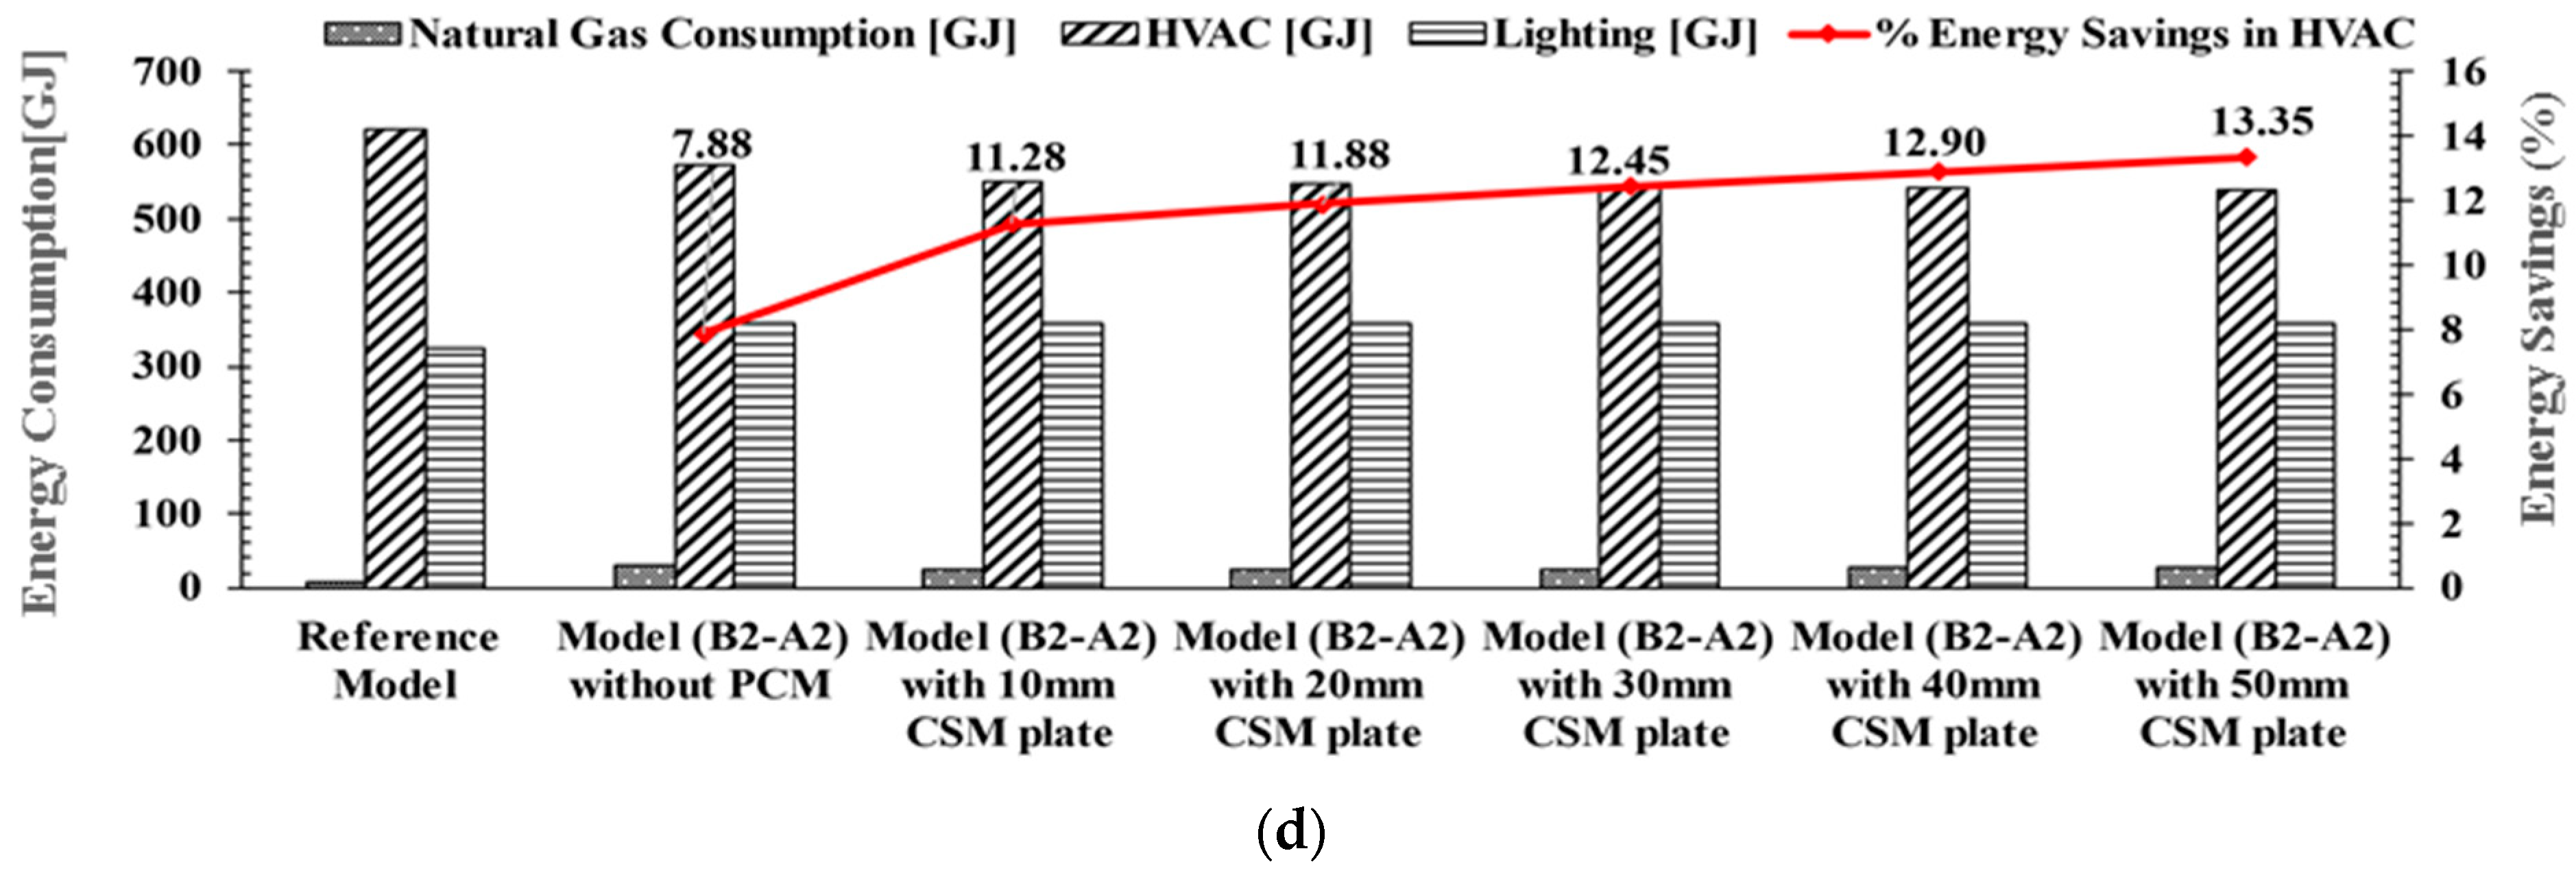
The above models were then simulated without PCMs and with different thicknesses of PCMs (i.e., 10 mm, 20 mm, 30 mm, 40 mm, and 50 mm of CSM sheets). Figure 13 displays the consumption of natural gas and the electrical energy of HVAC and lighting for the four new models, with and without PCMs, compared to the base case. Modifying the spatial design of the floors and windows together has provided very promising results in reducing the energy consumption of the HVAC, as shown in Figure 13a,b. The HVAC energy was reduced by 8.08%, 10.03%, 6.44%, and 7.88% for the model (B1-A1), model (B1-A2), model (B2-A1), model (B2-A2), respectively, without incorporating PCMs. As observed from the figure, as PCMs’ thickness is incremented, the energy saving is improved. For the case of 50 mm CSM plates, the HVAC energy consumption was reduced by 13.96%, 15.69%, 12.08%, and 13.35% for the model (B1-A1), model (B1-A2), model (B2-A1) and model (B2-A2), respectively. Regardless of the PCMs thicknesses, model (B1-A2), model (B1-A1), model (B2-A2), and model (B2-A1) are ranked from high to low potential in reducing the HVAC energy consumption.
The modifications associated with the reduction in WWR and rezoning of the core areas have increased the heating demand from the gas fuel. since more perimeter areas are now exposed to the exterior side. However, a reduction in electrical heating energy was observed when PCMs were used. For example, model (B1-A2), with a 50 mm thickness PCMs, achieved a maximum electrical heating energy savings of 9.26 GJ (or 70.63%) in comparison to the base case. In terms of cooling energy, model (B1-A2) achieved 14.54% energy savings when compared to the base case model when incorporating 50 mm thick CSMs plates. Model (B1-A1), with CSM panels of 50 mm thick, was also found to be an attractive option with a 14.25% reduction in cooling energy.
On the other hand, the results showed a negative impact on lighting energy since small size windows were introduced. It is interesting to note that reducing the WWR coupled with the enlargement of perimeter zones has reduced the negative impact on lighting energy. For instance, when reducing the WWR by 50% (Model A1), the lighting energy was increased by 6.39% (refer to Table 5). However, when this design option was coupled with Model (B-1), the lighting energy was increased by 2.07% because more perimeter zones are now exposed to daylighting, which reduces the electric energy of the artificial lights.

5. Conclusions

This research is intended to study the energy performance of an office building in a typical Saharan arid climate when PCMs are embedded in the envelope system. The work is also extended to evaluate the energy performance of the office when several configurations of the WWR (i.e., reducing the windows’ area), spatial designs (i.e., enlarging the perimeter zones), and the PCM-embedded wall designs are generated. The following can be concluded:
  • At the building level, the HVAC electrical energy can be reduced between 3.54% and 6.18% when PCMs are integrated into the wall system;
  • At floor levels, the uppermost floor and the ground floor have shown more PCMs potential in saving HVAC energy than the middle floor due to the exposure. The ground floor was the best among all floors for PCMs implementation;
  • At zone levels, the perimeter zones have shown more PCMs potential in saving energy than the core area. Hence, the PCMs should be utilized more in areas exposed to solar radiation, like the perimeter zones. The use of PCMs in the perimeter areas may also have another advantage where the need for more windows for passive heating is reduced since it can be fostered by the stored thermal energy in the PCMs;
  • The reduction in WWR for the office with PCMs provided a significant reduction in HVAC energy consumption. Depending on the PCMs’ thickness, the reduction in HVAC energy ranged between 10% and 12.71% when the WWR was reduced by half the original window areas and ranged between 12.77% to 15.5% when the WWR was reduced by three-quarters. Regardless of the architectural and aesthetic characteristics, the results have shown that WWR in arid desert environments must be carefully considered, as their reduction can contribute to savings in HVAC energy consumption but may increase the heating and lighting energy demand due to the lack of access to solar radiation and daylight;
  • The reduction in core areas (i.e., enlargement of the perimeter zones) was seen as a promising design alternative for improving the performance of the office with PCMs. When the core area was reduced by one-third and two-thirds of the total floor areas, the reduction in HVAC energy ranged between 6.1% and 8.54%, depending on the PCMs’ thickness. This concept has increased the exposure of the perimeter zones to the outside climatic, which further enhanced the performance of the PCMs layers.
The combination of the WWR and the enlargement of the perimeter zones has slightly enhanced the performance of the office with PCMs. The reduction in HVAC energy ranged between 12.08% and 15.69% for thicker PCMs. In addition, this design option has reduced the vulnerability of the office to the increase in lighting energy since more perimeter zones are now exposed to daylighting, which reduces the electric energy of the artificial lights.

Author Contributions

Conceptualization, A.S.; Formal analysis, A.S. and S.N.A.-S.; Writing—original draft, A.S.; Writing—review & editing, S.N.A.-S. and M.A.; Supervision, D.B. and H.B.; Funding acquisition, S.N.A.-S. All authors have read and agreed to the published version of the manuscript.

Funding

This research received no external funding.

Institutional Review Board Statement

Not applicable.

Informed Consent Statement

Not applicable.

Data Availability Statement

Not applicable.

Conflicts of Interest

The authors declare no conflict of interest.

References

  1. Crawley, D.B.; Lawrie, L.K. Our climate conditions are already changing—Should we care? Build. Serv. Eng. Res. Technol. 2021, 42, 507–516. [Google Scholar] [CrossRef]
  2. Krarti, M.; Aldubyan, M. Review analysis of COVID-19 impact on electricity demand for residential buildings. Renew. Sustain. Energy Rev. 2021, 143, 110888. [Google Scholar] [CrossRef] [PubMed]
  3. Koutra, S. From ‘Zero’ to ‘Positive’ Energy Concepts and from Buildings to Districts—A Portfolio of 51 European Success Stories. Sustainability 2022, 14, 15812. [Google Scholar] [CrossRef]
  4. Al-Saadi, S.N.; Shaaban, A.K. Zero energy building (ZEB) in a cooling dominated climate of Oman: Design and energy performance analysis. Renew. Sustain. Energy Rev. 2019, 112, 299–316. [Google Scholar] [CrossRef]
  5. Oh, S.; Gardner, J.F. Energy Consumption Analysis Using Measured Data from a Net-Zero Energy Commercial Building in a Cold and Dry Climate. Sustainability 2022, 14, 10346. [Google Scholar] [CrossRef]
  6. Chang, H.; Hou, Y.; Lee, I.; Liu, T.; Acharya, T.D. Feasibility Study and Passive Design of Nearly Zero Energy Building on Rural Houses in Xi’an, China. Buildings 2022, 12, 341. [Google Scholar] [CrossRef]
  7. Lohwanitchai, K.; Jareemit, D. Modeling Energy Efficiency Performance and Cost-Benefit Analysis Achieving Net-Zero Energy Building Design: Case Studies of Three Representative Offices in Thailand. Sustainability 2021, 13, 5201. [Google Scholar] [CrossRef]
  8. McKeen, P.; Fung, A.S. The Effect of Building Aspect Ratio on Energy Efficiency: A Case Study for Multi-Unit Residential Buildings in Canada. Buildings 2014, 4, 336–354. [Google Scholar] [CrossRef] [Green Version]
  9. Hemsath, T.L.; Bandhosseini, K.A. Sensitivity analysis evaluating basic building geometry’s effect on energy use. Renew. Energy 2015, 76, 526–538. [Google Scholar] [CrossRef]
  10. Konis, K.; Gamas, A.; Kensek, K. Passive performance and building form: An optimization framework for early-stage design support. Sol. Energy 2016, 125, 161–179. [Google Scholar] [CrossRef]
  11. Kośny, J. PCM-Enhanced Building Components: An Application of Phase Change Materials in Building Envelopes and Internal Structures; Springer: Berlin/Heidelberg, Germany, 2015. [Google Scholar]
  12. Tyagi, V.V.; Buddhi, D. PCM thermal storage in buildings: A state of art. Renew. Sustain. Energy Rev. 2007, 11, 1146–1166. [Google Scholar] [CrossRef]
  13. Gholamibozanjani, G.; Farid, M. A comparison between passive and active PCM systems applied to buildings. Renew. Energy 2020, 162, 112–123. [Google Scholar] [CrossRef]
  14. Farid, M.M.; Khudhair, A.M.; Razack, S.A.K.; Al-Hallaj, S. A review on phase change energy storage: Materials and applications. Energy Convers. Manag. 2004, 45, 1597–1615. [Google Scholar] [CrossRef]
  15. Zhou, D.; Zhao, C.Y.; Tian, Y. Review on thermal energy storage with phase change materials (PCMs) in building applications. Appl. Energy 2012, 92, 593–605. [Google Scholar] [CrossRef] [Green Version]
  16. Wang, X.; Djakovic, U.; Bao, H.; Torres, J.F. Experimental evaluation of heat transfer performance under natural and forced convection around a phase change material encapsulated in various shapes. Sustain. Energy Technol. Assess. 2021, 44, 101025. [Google Scholar] [CrossRef]
  17. Ascione, F.; Bianco, N.; De Masi, R.F.; de’ Rossi, F.; Vanoli, G.P. Energy refurbishment of existing buildings through the use of phase change materials: Energy savings and indoor comfort in the cooling season. Appl. Energy 2014, 113, 990–1007. [Google Scholar] [CrossRef]
  18. Jamil, H.; Alam, M.; Sanjayan, J.; Wilson, J.L. Investigation of PCM as retrofitting option to enhance occupant thermal comfort in a modern residential building. Energy Build. 2016, 133, 217–229. [Google Scholar] [CrossRef]
  19. Amoatey, P.; Al-Jabri, K.; Al-Saadi, S. Influence of phase change materials on thermal comfort, greenhouse gas emissions, and potential indoor air quality issues across different climatic regions: A critical review. Int. J. Energy Res. 2022, 46, 22386–22420. [Google Scholar] [CrossRef]
  20. Arıcı, M.; Bilgin, F.; Nižetić, S.; Karabay, H. PCM integrated to external building walls: An optimization study on maximum activation of latent heat. Appl. Therm. Eng. 2020, 165, 114560. [Google Scholar] [CrossRef]
  21. Piselli, C.; Prabhakar, M.; de Gracia, A.; Saffari, M.; Pisello, A.L.; Cabeza, L.F. Optimal control of natural ventilation as passive cooling strategy for improving the energy performance of building envelope with PCM integration. Renew. Energy 2020, 162, 171–181. [Google Scholar] [CrossRef]
  22. Sarri, A.; Bechki, D.; Bouguettaia, H.; Al-Saadi, S.N.; Boughali, S.; Farid, M.M. Effect of using PCMs and shading devices on the thermal performance of buildings in different Algerian climates. A simulation-based optimization. Sol. Energy 2021, 217, 375–389. [Google Scholar] [CrossRef]
  23. Kottek, M.; Grieser, J.; Beck, C.; Rudolf, B.; Rubel, F. World map of the Köppen-Geiger climate classification updated. Meteorol. Z. 2006, 15, 259–263. [Google Scholar] [CrossRef] [PubMed]
  24. Climat Ouargla: Pluviométrie et Température Moyenne Ouargla, Diagramme Ombrothermique Pour Ouargla–Climate-Data.org. [Archive]. Available online: https://fr.climate-data.org (accessed on 24 November 2020).
  25. Armature Urbaine—Office National des Statistiques, Collections Statistiques No 163/2011 Série S: Statistiques Sociales. Available online: https://www.ons.dz/IMG/pdf/armature_urbaine_2008.pdf (accessed on 30 December 2022).
  26. U.S. Department of Energy. EnergyPlus v8.8.0 Documentation, Engineering Reference; U.S. Department of Energy: Washington, DC, USA, 2017; Available online: https://energyplus.net/documentation (accessed on 13 December 2018).
  27. U.S. Department of Energy. EnergyPlus v8.8.0 Documentation, Input Output Reference; U.S. Department of Energy: Washington, DC, USA, 2017; Available online: https://energyplus.net/documentation (accessed on 13 December 2018).
  28. Al-Saadi, S.N.; Zhai, Z.J. Modeling phase change materials embedded in building enclosure: A review. Renew. Sustain. Energy Rev. 2013, 21, 659–673. [Google Scholar] [CrossRef]
  29. Morgan, K.; Lewis, R.W.; Zienkiewicz, O.C. An improved algrorithm for heat conduction problems with phase change. Int. J. Numer. Methods Eng. 1978, 12, 1191–1195. [Google Scholar] [CrossRef]
  30. Tabares-Velasco, P.C.; Christensen, C.; Bianchi, M. Verification and validation of EnergyPlus phase change material model for opaque wall assemblies. Build. Environ. 2012, 54, 186–196. [Google Scholar] [CrossRef]
  31. Zhuang, C.-L.; Deng, A.-Z.; Chen, Y.; Li, S.-B.; Zhang, H.-Y.; Fan, G.-Z. Validation of Veracity on Simulating the Indoor Temperature in PCM Light Weight Building by EnergyPlus. In Life System Modeling and Intelligent Computing; Li, K., Fei, M., Jia, L., Irwin, G., Eds.; Springer: Berlin/Heidelberg, Germany, 2010; pp. 486–496. [Google Scholar] [CrossRef]
  32. Campbell, K.R. Phase Change Material as a Thermal Storage Device for Passive Houses; Portland State University: Portland, OR, USA, 2011. [Google Scholar]
  33. Chan, A. Energy and environmental performance of building façades integrated with phase change material in subtropical Hong Kong. Energy Build. 2011, 43, 2947–2955. [Google Scholar] [CrossRef]
  34. Kuznik, F.; Virgone, J.; Roux, J.-J. Energetic efficiency of room wall containing PCM wallboard: A full-scale experimental investigation. Energy Build. 2008, 40, 148–156. [Google Scholar] [CrossRef]
  35. ANSI/ASHRAE/IES, ASHRAE Standard 90.1-2016; Energy Standard for Buildings except Low-Rise Residential Buildings. DOE Building Energy Codes Program: Washington, DC, USA, 2016.
  36. Thornton, B.A.; Rosenberg, M.I.; Richman, E.E.; Wang, W.; Xie, Y.; Zhang, J.; Cho, H.; Mendon, V.V.; Athalye, R.A.; Liu, B. Achieving the 30% Goal: Energy and Cost Savings Analysis of Ashrae Standard 90.1-2010. Available online: http://www.osti.gov/scitech/biblio/1015277 (accessed on 30 December 2022).
  37. Feustel, H.E. Simplified Numerical Description of Latent Storage Characteristics for Phase Change Wallboard; Indoor Environment Program, Energy and Environment Division, Lawrence Berkeley Laboratory, University of California: Berkeley, CA, USA; U.S. Department of Energy: Washington, DC, USA, 1995. [Google Scholar] [CrossRef] [Green Version]
  38. RUBITHERM, Rubitherm Technologies GmbH. Available online: http://www.rubitherm.de/ (accessed on 30 December 2022).
  39. Egolf, P.W.; Manz, H. Theory and modeling of phase change materials with and without mushy regions. Int. J. Heat Mass Transf. 1994, 37, 2917–2924. [Google Scholar] [CrossRef]
  40. ASHRAE 2013 ASHRAE Handbook—Fundamentals, SI ed.; ASHRAE: Peachtree Corners, GA, USA, 2013.
  41. Lim, J.-H.; Kim, K.-W. ISO 11855—The International Standard on the Design, Dimensioning, Installation and Control of Embedded Radiant Heating and Cooling Systems. REHVA J. 2016, 53, 46–53. [Google Scholar]
  42. Mazzarella, L.; Hogeling, J. CEN Standard EN 16798-3:2017 on Ventilation for Non-Residential Buildings: PERFORMANCE REQUIREMENTS. REHVA J. 2018. [Google Scholar]
Figure 1. Geographic location of Ouargla city.
Sustainability 15 01196 g001
Figure 2. Geometrical description of the building model: (a) Perspective view of the modified. Mid-Rise-Office model; (b) Top view of the building without the exterior roof.
Sustainability 15 01196 g002
Figure 3. Phase change materials used: (a) RUBITHERM® CSM panel [38]; (b) PCM with gypsum (Knauf smartboard) [11].
Sustainability 15 01196 g003
Figure 4. Enthalpy–temperature curve: Curve (A) is for a pure substance, and Curve (B) is for a homogeneous substance.
Sustainability 15 01196 g004
Figure 5. h–T curves of the PCMs used.
Sustainability 15 01196 g005
Figure 6. Electrical energy consumption due to the cooling system for each floor.
Sustainability 15 01196 g006
Figure 7. Effect of PCMs on the monthly cooling energy of the core zone of: (a) the ground floor core; (b) the first floor; and (c) the second floor.
Sustainability 15 01196 g007
Figure 8. Effect of PCMs on the ground floor perimeter cooling load.
Sustainability 15 01196 g008
Figure 9. Effect of PCMs on first floor perimeter cooling load.
Sustainability 15 01196 g009
Figure 10. Effect of PCMs on the second floor perimeter cooling load.
Sustainability 15 01196 g010
Figure 11. Descriptive diagram showing the window sizes in each model.
Sustainability 15 01196 g011
Figure 12. Top view of the building with different spatial designs.
Sustainability 15 01196 g012
Figure 13. Energy consumption in the new improved models with PCMs: (a) Model (B1-A1); (b) Model (B1-A2); (c) Model (B2-A1); and (d) Model (B2-A2).
Sustainability 15 01196 g013aSustainability 15 01196 g013b
Table 1. Thermal and physical properties of Knauf smartboard [11] and RUBITHERM® CSM-Panel [38].
Physical PropertyKnauf SmartboardRUBITHERM® CSM-Panel
Specific heat [kJ/kg·K]1.22
Melting temperature [°C]2328
Thermal conductivity at liquid state0.200.20
Thermal conductivity at solid state0.190.20
Enthalpy of fusion of PCM [J/g]110250
Latent heat capacity [kJ/m2]330-
Thickness [m]0.016from 0.01 to 0.05
Table 2. Reduction in the HVAC energy consumption based on the thickness of the Knauf smartboard and RUBITHERM® CSM panels.
ModelHeating (Gas)Heating (Elect)Cooling (Elect)Ventilation (Elect)
Reference Model
EConsumed [GJ]8.7313.11525.8681.73
with 10 mm of CSM
EConsumed [GJ]5.955.67516.9876.09
ESavings [GJ]2.787.448.885.64
ESavings [%]31.8456.751.696.90
with 20 mm of CSM
EConsumed [GJ]5.684.86512.5075.96
ESavings [GJ]3.058.2513.365.77
ESavings [%]34.9462.932.547.06
with 30 mm of CSM
EConsumed [GJ]5.664.30508.5875.98
ESavings [GJ]3.078.8117.285.75
ESavings [%]35.1767.203.287.04
with 40 mm of CSM
EConsumed [GJ]5.673.94505.5675.95
ESavings [GJ]3.069.1720.305.78
ESavings [%]35.0569.953.867.07
with 50 mm of CSM
EConsumed [GJ]5.733.68502.7475.88
ESavings [GJ]3.009.4323.125.85
ESavings [%]34.3671.934.397.16
Table 3. Effect of using windows model (A-1) on energy consumption.
ModelHeating (Gas)Heating (Elect)Cooling (Elect)Ventilation (Elect)Lighting (Elect)
Reference Model
EConsumed [GJ]8.7313.11525.8681.73323.19
Model (A-1) without PCM
EConsumed [GJ]10.198.93493.1575.96343.41
ESavings [GJ]−1.464.1832.715.77−20.22
ESavings [%]−16.7231.886.227.06−6.26
Table 4. Effect of using PCMs on energy consumption in model (A-1).
ModelHeating (Gas)Heating (Elect)Cooling (Elect)Ventilation (Elect)Lighting (Elect)
Model (A-1)
EConsumed [GJ]10.198.93493.1575.96343.41
with 10 mm of CSM
EConsumed [GJ]6.604.30483.4270.89343.85
ESavings [GJ]3.594.639.735.07−0.44
ESavings [%]35.2351.851.976.67−0.13
with 20 mm of CSM
EConsumed [GJ]6.303.82478.2170.83343.85
ESavings [GJ]3.895.1114.945.13−0.44
ESavings [%]38.1757.223.036.75−0.13
with 30 mm of CSM
EConsumed [GJ]6.293.54474.2770.83343.85
ESavings [GJ]3.905.3918.885.13−0.44
ESavings [%]38.2760.363.836.75−0.13
with 40 mm of CSM
EConsumed [GJ]6.323.40470.9670.78343.85
ESavings [GJ]3.875.5322.195.18−0.44
ESavings [%]37.9861.934.506.82−0.13
with 50 mm of CSM
EConsumed [GJ]6.383.34467.7670.69343.85
ESavings [GJ]3.815.5925.395.27−0.44
ESavings [%]37.3962.595.156.94−0.13
Table 5. Energy consumption of the window model (A-1) with PCMs compared to the reference model.
ModelHeating (Gas)Heating (Elect)Cooling (Elect)Ventilation (Elect)Lighting (Elect)
Reference Model
EConsumed [GJ]8.7313.11525.8681.73323.19
Model (A-1) with 10 mm of CSM
EConsumed [GJ]6.604.30483.4270.89343.85
ESavings [GJ]2.138.8142.4410.84−20.66
ESavings [%]24.3967.208.0713.26−6.39
Model (A-1) with 20 mm of CSM
EConsumed [GJ]6.303.82478.2170.83343.85
ESavings [GJ]2.439.2947.6510.90−20.66
ESavings [%]27.8370.869.0613.34−6.39
Model (A-1) with 30 mm of CSM
EConsumed [GJ]6.293.54474.2770.83343.85
ESavings [GJ]2.449.5751.5910.90−20.66
ESavings [%]27.9573.009.8113.34−6.39
Model (A-1) with 40 mm of CSM
EConsumed [GJ]6.323.40470.9670.78343.85
ESavings [GJ]2.419.7154.9010.95−20.66
ESavings [%]27.6074.0610.4413.39−6.39
Model (A-1) with 50 mm of CSM
EConsumed [GJ]6.383.34467.7670.69343.85
ESavings [GJ]2.359.7758.1011.04−20.66
ESavings [%]26.9274.5211.0513.51−6.39
Table 6. Effect of using the window model (A-2) on energy consumption.
ModelHeating (Gas)Heating (Elect)Cooling (Elect)Ventilation (Elect)Lighting (Elect)
Reference Model
EConsumed [GJ]8.7313.11525.8681.73323.19
Model (A-2) without PCM
EConsumed [GJ]10.317.67479.5673.43361.20
ESavings [GJ]−1.585.4446.308.30−38.01
ESavings [%]−18.0941.498.8010.15−11.76
Table 7. Effect of using PCMs on energy consumption in model (A-2).
ModelHeating (Gas)Heating (Elect)Cooling (Elect)Ventilation (Elect)Lighting (Elect)
Model (A-2)
EConsumed [GJ]10.317.67479.5673.43361.20
with 10 mm of CSM
EConsumed [GJ]6.624.02468.5468.89361.53
ESavings [GJ]3.693.6511.024.54−0.33
ESavings [%]35.7947.592.306.18−0.09
with 20 mm of CSM
EConsumed [GJ]6.293.69463.1168.94361.53
ESavings [GJ]4.023.9816.454.49−0.33
ESavings [%]39.0051.893.436.11−0.09
with 30 mm of CSM
EConsumed [GJ]6.263.51458.9368.99361.53
ESavings [GJ]4.054.1620.634.44−0.33
ESavings [%]39.2854.244.306.05−0.09
with 40 mm of CSM
EConsumed [GJ]6.293.43455.4268.92361.53
ESavings [GJ]4.024.2424.144.51−0.33
ESavings [%]39.0055.285.036.14−0.09
with 50 mm of CSM
EConsumed [GJ]6.363.39452.3368.79361.53
ESavings [GJ]3.954.2827.234.64−0.33
ESavings [%]38.3155.805.686.32−0.09
Table 8. Energy consumption of model (A-2) with PCMs compared to the reference model.
ModelHeating (Gas)Heating (Elect)Cooling (Elect)Ventilation (Elect)Lighting (Elect)
Reference Model
EConsumed [GJ]8.7313.11525.8681.73323.19
Model (A-2) with
10 mm of CSM
EConsumed [GJ]6.624.02468.5468.89361.53
ESavings [GJ]2.119.0957.3212.84−38.34
ESavings [%]24.1769.3410.9015.71−11.86
Model (A-2) with
20 mm of CSM
EConsumed [GJ]6.293.69463.1168.94361.53
ESavings [GJ]2.449.4262.7512.79−38.34
ESavings [%]27.9571.8511.9315.65−11.86
Model (A-2) with
30 mm of CSM
EConsumed [GJ]6.263.51458.9368.99361.53
ESavings [GJ]2.479.6066.9312.74−38.34
ESavings [%]28.2973.2312.7315.58−11.86
Model (A-2) with
40 mm of CSM
EConsumed [GJ]6.293.43455.4268.92361.53
ESavings [GJ]2.449.6870.4412.81−38.34
ESavings [%]27.9573.8413.3915.67−11.86
Model (A-2) with
50 mm of CSM
EConsumed [GJ]6.363.39452.3368.79361.53
ESavings [GJ]2.379.7273.5312.94−38.34
ESavings [%]27.1574.1413.9815.83−11.86
Table 9. Energy consumption of model (B-1) without PCMs compared to the reference model.
ModelHeating (Gas)Heating (Elect)Cooling (Elect)Ventilation (Elect)Lighting (Elect)
Reference Model
EConsumed [GJ]8.7313.11525.8681.73323.19
Model (B-1)
EConsumed [GJ]23.1813.53512.6881.20296.86
ESavings [GJ]−14.45−0.4213.180.5326.33
ESavings [%]−165.52−3.202.510.658.15
Table 10. Energy consumption of model (B-1) with PCMs compared to model (B-1) without PCMs.
ModelHeating (Gas)Heating (Elect)Cooling (Elect)Ventilation (Elect)Lighting (Elect)
Model (B-1)
EConsumed [GJ]23.1813.53512.6881.20296.86
with 10 mm of CSM
EConsumed [GJ]19.586.17500.3476.38297.36
ESavings [GJ]3.607.3612.344.82−0.50
ESavings [%]15.5354.392.415.94−0.17
with 20 mm of CSM
EConsumed [GJ]19.535.37496.2376.31297.36
ESavings [GJ]3.658.1616.454.89−0.50
ESavings [%]15.7560.313.216.02−0.17
with 30 mm of CSM
EConsumed [GJ]19.654.80492.6976.34297.36
ESavings [GJ]3.538.7319.994.86−0.50
ESavings [%]15.2364.523.905.98−0.17
with 40 mm of CSM
EConsumed [GJ]19.904.45489.8576.26297.36
ESavings [GJ]3.289.0822.834.94−0.50
ESavings [%]14.1567.114.456.08−0.17
with 50 mm of CSM
EConsumed [GJ]20.164.27487.2676.15297.36
ESavings [GJ]3.029.2625.425.05−0.50
ESavings [%]13.0368.444.966.22−0.17
Table 11. Energy consumption of model (B-1) with PCMs compared to the reference model.
ModelHeating (Gas)Heating (Elect)Cooling (Elect)Ventilation (Elect)Lighting (Elect)
Reference Model
EConsumed [GJ]8.7313.11525.8681.73323.19
Model (B-1) with
10 mm of CSM
EConsumed [GJ]19.586.17500.3476.38297.36
ESavings [GJ]−10.856.9425.525.3525.83
ESavings [%]−124.2852.944.856.557.99
Model (B-1) with
20 mm of CSM
EConsumed [GJ]19.535.37496.2376.31297.36
ESavings [GJ]−10.807.7429.635.4225.83
ESavings [%]−123.7159.045.636.637.99
Model (B-1) with
30 mm of CSM
EConsumed [GJ]19.654.80492.6976.34297.36
ESavings [GJ]−10.928.3133.175.3925.83
ESavings [%]−125.0863.386.316.597.99
Model (B-1) with
40 mm of CSM
EConsumed [GJ]19.904.45489.8576.26297.36
ESavings [GJ]−11.178.6636.015.4725.83
ESavings [%]−127.9566.056.856.697.99
Model (B-1) with
50 mm of CSM
EConsumed [GJ]20.164.27487.2676.15297.36
ESavings [GJ]−11.438.8438.605.5825.83
ESavings [%]−130.9367.437.346.837.99
Table 12. Energy consumption of model (B-2) without PCMs compared to the reference model.
ModelHeating (Gas)Heating (Elect)Cooling (Elect)Ventilation (Elect)Lighting (Elect)
Reference Model
EConsumed [GJ]8.7313.11525.8681.73323.19
Model (B-2) without PCM
EConsumed [GJ]29.8615.27517.2082.80278.53
ESavings [GJ]−21.13−2.168.66−1.0744.66
ESavings [%]−242.04−16.471.65−1.3113.82
Table 13. Energy consumption of model (B-2) with PCMs compared to model (B-2) without PCMs.
ModelHeating (Gas)Heating (Elect)Cooling (Elect)Ventilation (Elect)Lighting (Elect)
Model (B-2)
EConsumed [GJ]29.8615.27517.2082.80278.53
with 10 mm of CSM
EConsumed [GJ]26.277.04502.5377.66279.09
ESavings [GJ]3.598.2314.675.14−0.56
ESavings [%]12.0253.892.846.21−0.20
with 20 mm of CSM
EConsumed [GJ]26.226.11498.9677.71279.09
ESavings [GJ]3.649.1618.245.09−0.56
ESavings [%]12.1959.983.536.15−0.20
with 30 mm of CSM
EConsumed [GJ]26.645.42495.9777.85279.09
ESavings [GJ]3.229.8521.234.95−0.56
ESavings [%]10.7864.514.105.98−0.20
with 40 mm of CSM
EConsumed [GJ]27.014.94493.5277.86279.09
ESavings [GJ]2.8510.3323.684.94−0.56
ESavings [%]9.5467.654.585.96−0.20
with 50 mm of CSM
EConsumed [GJ]27.824.70490.8177.96279.09
ESavings [GJ]2.0410.5726.394.84−0.56
ESavings [%]6.8369.225.105.85−0.20
Table 14. Energy consumption of model (B-2) with PCMs compared to the reference model.
ModelHeating (Gas)Heating (Elect)Cooling (Elect)Ventilation (Elect)Lighting (Elect)
Reference Model
EConsumed [GJ]8.7313.11525.8681.73323.19
Model (B-2) with
10 mm of CSM
EConsumed [GJ]26.277.04502.5377.66279.09
ESavings [GJ]−17.546.0723.334.0744.10
ESavings [%]−200.9246.304.444.9813.65
Model (B-2) with
20 mm of CSM
EConsumed [GJ]26.226.11498.9677.71279.09
ESavings [GJ]−17.497.0026.904.0244.10
ESavings [%]−200.3453.395.124.9213.65
Model (B-2) with
30 mm of CSM
EConsumed [GJ]26.645.42495.9777.85279.09
ESavings [GJ]−17.917.6929.893.8844.10
ESavings [%]−205.1558.665.684.7513.65
Model (B-2) with
40 mm of CSM
EConsumed [GJ]27.014.94493.5277.86279.09
ESavings [GJ]−18.288.1732.343.8744.10
ESavings [%]−209.3962.326.154.7313.65
Model (B-2) with
50 mm of CSM
EConsumed [GJ]27.824.70490.8177.96279.09
ESavings [GJ]−19.098.4135.053.7744.10
ESavings [%]−218.6764.156.664.6113.65
Disclaimer/Publisher’s Note: The statements, opinions and data contained in all publications are solely those of the individual author(s) and contributor(s) and not of MDPI and/or the editor(s). MDPI and/or the editor(s) disclaim responsibility for any injury to people or property resulting from any ideas, methods, instructions or products referred to in the content.