Abstract
Robot usage has become an intrinsic requirement to drive the intelligence transformation of the manufacturing industry, providing a key driver for carbon emission reduction in China’s manufacturing industry. This paper examines the carbon emission reduction effect of robot usage at three levels: theoretical, empirical, and decomposition. On the basis of the pollution emission data of segments of China’s manufacturing industry from 2006 to 2020, the paper takes matching robot stock and incremental data from the International Federation of Robotics statistics, and applies the instrumental variable method to identify and estimate the role played by industry robot stock and incremental improvement in reducing pollution emissions. The empirical results show that the usage of robots does significantly reduce the carbon emissions of the manufacturing industry in China. Further, mechanism testing revealed that robot use reduces corporate pollution emissions mainly through channels such as R&D investment and manual substitution. The research provides microscopic evidence for objectively assessing the impact of robot use on environmental pollution emissions from the perspective of promoting robot applications, and suggests policy recommendations for reducing pollution emissions from China’s manufacturing sector, which can help achieve harmonious economic and environmental development.
1. Introduction
In recent years, with the emergence of artificial intelligence, the usage of robots is becoming increasingly common in enterprises, but the long-term reliance on a high-energy-consuming development model has become a great challenge to achieve the “ dual carbon” goal [1,2]. As artificial intelligence continues to be used in environmental governance, intelligence and information technology will become a future trend of environmental governance and will have a revolutionary impact on environmental governance. Artificial intelligence provides holistic solutions for urban environmental governance; for example, the ET Environment Brain project initiated by Ali Cloud provides panoramic ecological analysis and intelligent environmental supervision using artificial intelligence technology [3]. According to the International Federation of Robotics (hereinafter referred to as IFR), the number of industrial robots globally reached 3 million in 2020, of which China’s industrial robot shipments represent up to 168,400 units, ranking first in the world. The large-scale usage of industrial robots will inevitably have a profound impact on the development of the industry, with the most direct effects occurring in both economic growth [4,5,6] and social efficiency [7,8,9], and consequently on social employment [10,11,12] and labor relations [13,14]. At the same time, the usage of robots enhances production technology and thereby reduces the pollution emissions of the industry, which helps to build a scientific environmental management system. Therefore, what is the relationship between robot use and the pollution emissions of Chinese manufacturing companies? What are the driving factors? This is the current realistic question that needs to be addressed urgently by a wide range of scholars and policy makers. The response to the above questions will facilitate the development of appropriate policies for the usage of robots in the era of digital economy, which is of great practical significance for the harmonious development of the economy and environment.
On the basis of this, this paper takes the Chinese manufacturing industry as the research object, selects robot use to influence industrial pollution emissions as the entry to conduct research, explores the mechanism of robot use to reduce industrial pollution emissions, and applies the instrumental variable approach to assess the impact of robots on industrial wastewater emissions, industrial waste gas emissions, and general industrial solid waste emissions, then finally proposes corresponding policy recommendations based on the mechanism and empirical research findings.
Compared with the existing literature, the research contribution of this paper is mainly in three aspects as follows: First, this paper explores the impact of the usage of industrial robots on pollution in manufacturing industry segments. Current scholars have mainly analyzed the impact of artificial intelligence and robotics on the environment, with less focus on the impact on environmental pollution itself. Second, this paper adopts industry-level microdata by using the instrumental variables approach to systematically examine the impact of robot applications on pollution emissions in manufacturing industries on the basis of solving the model endogeneity problem. Existing studies lack strict economic theoretical analysis or empirical support, nor do they focus on the micro level of the industry. To this end, this paper provides new evidence on the relationship between the application of industrial robots and environmental pollution emissions from a microscopic perspective. Thirdly, this paper verifies that the usage of industrial robots mainly reduces the pollution emission of the industry through the R&D growth effect and the artificial substitution effect, which is of great practical significance to how to improve environmental quality and build an environmental governance system.
This paper is organized as follows: the first part is related work; the second part is theoretical hypotheses; the third part is the research methodology and data; the fourth part is the empirical results and analysis; the fifth part is the heterogeneity analysis; the sixth part is impact mechanism testing; and the last part is the conclusion and future work.
2. Related Work
Although the existing literature has focused on the effects of technologies such as artificial intelligence for monitoring and environmental management, none of it has addressed the effects of robot use on corporate pollution. There are two major categories of literature that are closely relevant to this paper at the social science level. The first type of literature focuses on the negative impact of AI on environmental monitoring and environmental governance. Artificial intelligence techniques have been proposed as an effective tool for studying environmental problems as early as the beginning of the 20th century, promoting the effective integration of environmental science and artificial intelligence [15,16]. In recent years, with the continuous research of artificial intelligence on environmental governance, intelligence and information technology have had a revolutionary impact on environmental governance [17,18]. Artificial intelligence provides holistic solutions and ecological analysis for environmental governance; for example, Zhang et al. 2019, summarize five types of risks that may arise from the application of AI to environmental governance, including inherent algorithmic flaws, data bias, etc. [19,20,21]. Cheng showed that AI can bring about a significant increase in electricity consumption and a dramatic increase in CO2 emissions by using statistics from the U.S. Environmental Protection Agency (EPA) [22]. In conclusion, the development of AI has the potential to have non-negligible or even very serious negative effects on environmental governance or the environment itself. Although such literature lays a possible logical foundation for the study of this paper, they lack rigorous data support and argumentation because they are limited to status quo descriptions and logical deductions.
Foreign research has also applied artificial intelligence to regulatory and control systems for waste disposal: for instance, Huang et al. 2022, applied artificial intelligence technology to automatic odor-sensing systems in waste treatment plants [1]. Ye et al. 2020, found that artificial intelligence technology promoted the upgrading of sewage treatment equipment by optimizing the production conditions of enterprises, which in turn improved the efficiency of pollution control. In addition, in the field of environmentally assisted decision making [6], Paggio et al. 1999, developed the first environmental-decision support systems by integrating different AI techniques with numerous studies subsequently focusing on how AI can provide decision support for environmental policy making [23].
Another type of literature focuses on the impact of artificial intelligence and robotics shocks on labor markets. Most of the existing studies focus on labor markets in developed economies such as Europe and the United States; for instance, Autor et al. 2003, were early to identify the potential impact of AI on the labor market. Acemoglu and Restrepo used industrial robot stock data from 19 American industries between 1990 and 2007, finding that the use of robots reduced employment population rates and worker wages [7]. Aghion and Howitt, Autor et al., and Fordalso conclude that the usage of robots leads to unemployment [14,24,25]. In contrast, Dauth et al. 2017, found that the usage of robots does not cause total employment loss, on the basis of data from Germany between 1994 and 2014 [26]. Graetz and Michaels use a cross-country panel of 17 countries to reach similar conclusions [4]. Therefore, Furman and Seamans argue that there are national and industrial differences in the impact of robots on the labor market [27]. This literature does not directly link robot use and pollution emissions, nor do the studies themselves reach consistent conclusions.
The literature above reveals that these studies provide important empirical evidence for understanding the impact of robotics applications on the energy environment, but there are still obvious gaps. On the one hand, these studies have investigated the environmental aspects of AI and robotics applications, but most of them are from the perspective of environmental regulation and environmental governance, and only stay on the status quo of portrayal and logical derivation, lacking the theoretical connection between robotics applications and energy environment from the perspective of technological progress, and thereby fail to provide an in-depth understanding of the driving factors of the carbon emission reduction effect formed by robotics applications. On the other hand, the existing studies lack theoretical and empirical examination of the impact of robot applications on carbon emissions, and more importantly, do not answer how the usage of robots affect the emission behavior of micro and small enterprises or what the routes of action and the underlying mechanisms are. These are rarely addressed in economics research, which is not conducive to the construction of a realistic path for the synergistic evolution of carbon emission reduction and high-quality development of the Chinese economy from a practical perspective.
3. Theoretical Hypothesis
The impact of robot use on manufacturing pollution emissions is mainly achieved by R&D investment and labor substitution. The former improves the energy utilization efficiency and the ability to use new energy sources, thus reducing pollution emissions, while the latter improves the production efficiency of enterprises, reduces pollution emissions per unit of output, and thus decreases pollution generation.
Energy consumption is not only an important driver for China’s economic growth, but also a major source of environmental pollution [12]. Environmental economics usually considers energy consumption as a direct source of environmental pollution [23]. Currently, China’s use of traditional energy sources such as coal is relatively inefficient, resulting in more pollution. According to the 2013 Global Energy Industry Efficiency Study, China ranks only 74th in the world in terms of energy-use efficiency. Although energy-use efficiency has dramatically increased in recent years, there is a lot of energy loss and waste in the process from development, processing, conversion, transmission, distribution to end use, and low energy use efficiency has also brought serious environmental pollution problems to China.
The large-scale use of artificial intelligence and robotics can improve the industry’s technology and provide new ideas for solving problems such as energy-use efficiency. Intelligent technologies improve energy productivity by reducing energy use and adding value [8].The usage of robot operation in enterprises can directly improve the cleaning technology of coal combustion and coal conversion into clean fuel, enhance energy efficiency and reduce the intensity of pollution emissions of enterprises. On the other hand, R&D investments for the usage of robots can help accelerate the spread and utilization of renewable energy and equipment. For instance, the new energy sources such as wind, solar, and biomass can be transformed into convenient energy for production and daily life, and generally need to be matched with the corresponding technical equipment. While new energy sources are required to meet the needs of industrial production, and are further used to transform production, refining, and purification equipment, the technical requirements are even greater. Therefore, increasing R&D investment in the industry can improve the traditional energy efficiency and enhance the ability of new energy use, thus ultimately reducing pollution emissions. This is the “R&D growth effect”. Based on the above analysis, this paper proposes Hypothesis 1.
Hypothesis 1.
The usage of robots generates R&D growth effects and reduces industry pollution through increased R&D investment.
The manual substitution effect generated by the usage of robots is another mechanism to decrease industrial pollution emissions. The rapid development of artificial intelligence and robotics has accelerated replacement in the labor market, avoiding or mitigating the serious pollution that simply cannot be prevented by manual operations [28]. Under the same output, on the one hand, robot operation greatly reduces the raw materials required for manual operation, improves the production efficiency of the enterprise and reduces the pollution emission per unit of output; on the other hand, manual operation causes contamination due to the failure to achieve the required accuracy, while robots can achieve sufficient accuracy by replacing manual labor. For instance, in industrial-scale painting, the usage of robots can improve the quality of painting and material utilization, reduce the waste of paint and solvent that may be caused by manual operation, and boost the productivity of the enterprise, thereby reducing pollution. It can be seen that the replacement of manual labor with robots improves production efficiency and reduces the pollution emission of unit output, which is called the “manual substitution effect”. Based on the above analysis, this paper proposes Hypothesis 2.
Hypothesis 2.
The usage of robots generates a manual substitution effect by replacing manual labor, which reduces pollution emissions in the industry.
4. Research Methods and Data
4.1. Data Sources
There are four major sources of data in this study. First, the industrial robot data comes from the IFR, which conducts annual surveys of global robot manufacturers to form an authoritative database of robotics in more than 70 countries, and most of the data provided by this database belongs to manufacturing industry segments. Due to the difference between IFR’s industry classification and China’s National Industry Classification (NIC) standard, according to Lu Yue et al. 2020, this study matches the industries in the robotics data with the two-digit codes in the NIC by cross-referencing based on the industry names. Second, the database of Chinese industrial enterprises from 2006 to 2020 (ASIF) and <<The Chinese Industrial Statistical Yearbook>> provide control variables for a range of Chinese sub-industries. Third, the 2006~2020 Chinese Enterprise Pollution Database (CES) and <<The China Environmental Statistics Yearbook>> supported the raw data gathered by the National Bureau of Statistics from industrial enterprises, which are the most comprehensively available industry pollution emission data. Fourth, each country’s manufacturing industry subdivision in 1990 (two-digit industry code) and employment data are from <<The International Statistical Yearbook 1995>>. Finally, the data was matched.
4.2. Model Design and Variable Description
On the one hand, technological progress will change the factor structure of enterprise production, reduce the energy input per unit of enterprise output, improve energy use efficiency and reduce carbon emissions; on the other hand, the improvement of energy efficiency by robot usage mainly comes from the increase in output rather than the reduction in energy consumption in the production process, as shown in Figure 1; robot application mainly relies on the R&D growth effect and manual substitution effect to reduce pollutant emissions, through front-end productivity.
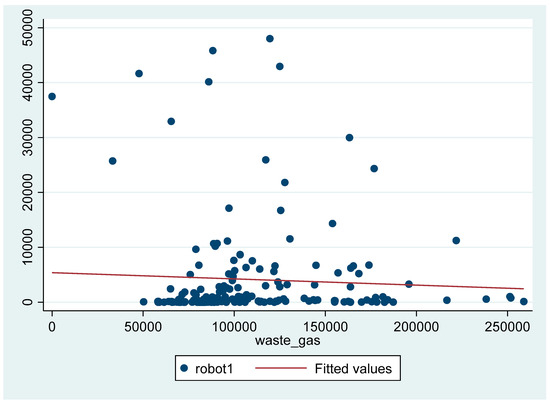
Figure 1.
The relationship between robot1 and waste_gas.
In this paper, robot stock and increment are used as dependent variables, and the scale of emissions of various industrial pollutants is used as the independent variable. A direct linear regression may have an estimation bias because of the serious endogeneity of both robot stock and increment, performing a horizontal spatial inspection. On the one hand, changes in stock and increment of robots and industry pollution emissions are mutually causal. Although, the increase in robot stock and incremental production reduces industrial pollution emissions, industries with low pollution emissions may also have a higher level of technology and thereby invest in the development and usage of robots. On the other hand, industries with high average profitability and value-added products may have both more robots and less pollution emissions, which can cause a selective bias. In any of these cases, a direct linear regression would result in inconsistent estimates and thus would not accurately evaluate the impact of robot utilization on pollution emissions. To overcome endogeneity, this paper uses an instrumental variables model to replace the direct linear regression, constructing the following instrumental variables two-stage equation (2SLS).
Here, denotes the emissions of various pollutants from industry 𝑖 during the 𝑡 period. The core dependent variable in this paper is , representing robot stock and increment. represents a group of control variables. 𝑖 represents industry and 𝑡 represents time. represents industry fixed effects. denotes time fixed effects. and are the random perturbation term. To eliminate possible autocorrelation and heteroskedasticity, all regressions are clustered on an industry level. We are concerned with the estimated coefficient , whose economic implication is the elasticity of substitution of industrial robot usage on manufacturing pollution emissions.
4.3. Endogeneity and its Processing
The literature on robotics usage research has focused extensively on the endogeneity of robotics variables and related economic variables. Companies where robots are widely used may have a reverse causality, although theoretically it is beneficial to reduce the level of corporate pollution emissions. Companies will increase their usage of robots to meet pollution emission requirements, which creates a certain endogeneity between robot usage and corporate pollution emissions. Severe endogeneity can make the least squares estimates biased or non-consistent. The usual improvement approach is to seek a variable as an instrumental variable for a two-stage least squares estimation, which is closely related to the usage of industrial robots in China but independent of corporate pollution emissions. For this reason, this paper selects the U.S. industrial robot installations as an instrumental variable for Chinese industrial robot utilization. To this end, following the approach of Wang et al. 2020, this paper selects the number of industrial robot installations (robotusa) in the United States during the same period as an instrumental variable.
The reason for adopting US industrial robot data to construct instrumental variables is based on three main concerns. First, although the U.S. robotics usage level is more advanced than that of China, its development trend is closer to that of China. Second, the U.S. industrial robot has been a global leader, and its industrial robot development trend can reflect the technological progress trend for the industry. Third, industrial robot applications in the U.S. are less likely to be influenced by Chinese economic factors, not to mention directly affect Chinese pollution emissions. Therefore, this instrumental variable satisfies the exogeneity condition, as long as the instrumental variable robotrusa satisfies cov(robotusa, robot) ≠ 0 and cov(robotusa, μ) = 0. The estimate of will then be a consistent estimate of , that is →.
4.4. Variable Descriptions
- (1)
- Independent variables: The Independent variable in this paper is , which indicates the emissions of various pollutants in manufacturing industry segment in period , including industrial waste gas emissions, industrial wastewater emissions, and general industrial solid waste generation. Industrial waste gas emissions refer to the total amount of various gases containing pollutants discharged into the air during the reporting period, which is generated during the fuel combustion and production process in the enterprise. Industrial wastewater emissions refer to the volume of industrial wastewater discharged to the outside of the enterprise through all discharge outlets of the enterprise in the reporting period, including production wastewater, direct cooling water discharged outside, mine groundwater discharged in excess of the standard and plant domestic sewage mixed with industrial wastewater, excluding indirect cooling water discharged outside. General industrial solid waste includes domestic sewage sludge, construction waste, industrial sludge, scrap steel, plastic, industrial waste, etc.
- (2)
- Dependent variables: The dependent variables in this paper are the scale of robot usage in manufacturing subsectors. In this paper, the stock and increment of robots in manufacturing industry segments are used as indicators of the scale of robot usage. Specifically, robot stock (robot1) refers to the number of robots available for use in the industry as of the year of the data, which takes into account the impact of the number of robots added and scrapped in the industry each year. Robot increment (robot2) refers to the number of new robots added in the year of the statistics, which is mainly used to indicate the new demand for robots in the industry.
- (3)
- Control variables: The control variables in this paper are other variables besides the scale of robot usage that affect the industry’s pollution emissions, mainly including the industry’s total assets (asset), main business income (revenue), total R&D staff (RD_staff), and value of finished goods (vfd).The industrial total assets (asset) reflect the level of the industry’s asset stock, which directly affects the industrial production and technological progress intervals, and therefore necessarily affects the industry’s pollution emissions. Revenue from main business (revenue) and value of finished goods (vfd) reflect the industry’s production and main operating results, which are also closely related to the industry’s scale of pollution emissions; total R&D staff (RD_staff) measures the industry’s R&D reserves and capabilities, while R&D will bring pollution-reducing technologies and equipment to the industry.
- (4)
- Industrial fixed effects and time fixed effects: The study may produce an estimation bias on the results due to ignoring the differences across industries and time, so it is necessary to control both industry and time fixed effects.
5. Analysis of Empirical Results
5.1. Baseline Regression Results
Table 1 reports the results of OLS benchmark regressions of the impact of industrial robot usage on manufacturing pollution emissions. It was found that after controlling both industry and time fixed affects, both the stock and increment of robots significantly reduced industrial emissions and general industrial solid waste generation. The estimated coefficients are significantly negative at the 1% statistical level, indicating that the industry faces a decrease in pollution emissions of 0.0643% and 0.026% for each 1% increase in the usage of industrial robots, but there is no significant effect on industrial wastewater.

Table 1.
OLS results of robot use affecting pollution emissions.
The reason is that, in comparison to industrial waste gas and industrial solid waste, the discharge of industrial wastewater does not differ much in terms of manual and artificial intelligence processing. Under the existing technology, the main method of purifying water to obtain tap water is to add coagulants of different compositions according to the different proportions of various impurities in the incoming water, with the help of manual and robotic operation of certain equipment, which can equally ensure accurate operation, and the use of robots does not reduce wastewater discharge. From the F-test and fit goodness, the overall significance of the OLS estimation passes, the fit goodness is good, and the model has some explanatory power.
5.2. Tests of Instrumental Variables
5.2.1. Validity of Instrumental Variables
To mitigate the model endogeneity, two-stage least squares estimation (2SLS) was performed using U.S. industrial robot installations as an instrumental variable. Validation of instrumental variables can be conducted using two tests: first, Staiger et al. 1997, proposed that in two-stage least squares estimation, the instrumental variable can be considered to have no weak identification problem if the first-stage F value is greater than 10. Second, the K-P rk LM statistic constructed by Kleibergen and Paap, which is used to test whether the instrumental variables are identifiable. The instrumental variable is considered identifiable if the original hypothesis of the K-P rk LM test is rejected. Table 2 reports the results of the 2SLS estimation and instrumental variables validity tests, and it can be found that the instrumental variables regression results are largely consistent with the OLS results. The estimated coefficients of robotusa are all significantly negative at the 1% statistical level, with each 1% increase in the stock of industrial robots leading to a decrease of 0.584% and 0.023% in industrial waste and industrial solid waste, respectively, and each 1% increase in the use of industrial robots leads to a decrease of 3.445% and 0.138% in industrial waste and industrial solid waste, respectively. Therefore, industrial robots do significantly reduce pollutant emissions other than industrial wastewater, using the number of industrial robots installed in the same industry in the United States as an valid instrumental variable for robot scale. The reasons for these results may be that, on the one hand, robots have a greater comparative advantage over manual operations in terms of some complicated labor. The usage of robots replaces the complex labor of manual operation and can avoid problems such as the waste of raw materials caused by improper manual operation, thereby improving energy efficiency and utilization, and reducing pollution caused by the underutilization of raw materials. At the same time, by intelligently programming the robot, robot operation can achieve a precision that cannot be achieved by manual operation and meet the accuracy requirements of production. On the other hand, robotic operation can meet a series of requirements such as advanced science and technology and the advanced technical equipment required for the application of clean energy in industrial production, such as refining and purification, monitoring, and protection, promoting the transformation of enterprises from traditional energy to clean energy and controlling the generation of pollution from the production side. In addition, the usage of robots has prompted companies to install more pollution control devices to replace manual operations and improve their pollution treatment capacity.
Table 2.
2SLS results for the impact of robot use on pollution emissions.
5.2.2. Exogeneity of Instrumental Variables
Strictly speaking, at the technical level, no commonly accepted test for exogeneity of instrumental variables has emerged so far. Three tests for the exogeneity of instrumental variables have been proposed in the literature, and the following methodological tests were conducted, combining the characteristics of the data and the research context of this paper.
The first is Angrist [29] who used a sample in which the instrumental and explanatory variables were not correlated to test whether the instrumental and independent variables were correlated. If the instrumental variables are exogenously reliable, then the instrumental variables will only affect the explanatory variables through the dependent variables, so that from a sample where the instrumental variables are not correlated with the dependent variables, it is inevitable to observe that the instrumental variables are unrelated to the independent variables. However, it is unlikely that there is a sample of sub-industry data used in this paper in which the instrumental variables are not relevant to the dependent variables.
Second, Angrist and Krueger [28] suggested putting dependent variables suspected of being endogenous into the regression equation along with instrumental variables. The exogeneity of the instrumental variables can be demonstrated if the effect of the instrumental variables on the results is not significant, conditional on controlling for the other dependent variables, by demonstrating that the instrumental variables affect the results only by influencing the endogenous variables. The regression results of introducing the installation of industrial robots in the same industry in the United States are shown in Table 3.
Table 3.
Exogeneity test for instrumental variables: controlling for the number of industrial robots installed in the same industry in the United States.
Third, Num and Wantchekon [30] proposed the idea of a “falsification test”, arguing that if the instrumental variables are truly and strictly exogenous, then putting them directly into the regression for samples that do not have a background of core explanatory variables will not have a significant effect on the dependent variable in the same direction as the baseline regression. While there were no industries that did not use robots at all between 2006 and 2020, some industries added almost no robots in many years, such as the textile and apparel products industry. The regression results including only these industries in the equation are shown in Table 4.
Table 4.
Exogeneity test for instrumental variables: low robotics incremental industries.
The results show that there is no significant effect of U.S. industrial robot installations on pollution emissions in the same industries when controlling both core dependent variables and instrumental variables; and for low robot increment industries, controlling U.S. industrial robot installations in the same industries alone also has no significant effect on pollution emissions, suggesting that employing U.S. industrial robot installations as an instrumental variable in the same industries for China’s sub-industry robot stock and increment can satisfy the exogeneity requirement.
5.3. Robustness Tests
- (1)
- Introduction of lag items: To test the effect of industrial robot usage on pollution emissions with a time lag, that is, the amount of time for robot usage to reduce pollution emissions, the study introduces the lag term of robot stock and increment, repeating the 2SLS work. The regression results are shown in Table 5, where the estimated coefficients of the lagged period of robot stock and increment on industrial waste gas and industrial solid waste are significantly negative, both significant at the 1% level, taking robot stock as an example, indicating that each 1% increase in industrial robot stock significantly reduces industrial waste gas by 0.668% in the next period and significantly reduces industrial solid waste by 0.027% in the next period, thus indicating that industrial robot use significantly reduces the level of pollution emissions except for industrial wastewater.
Table 5. Robustness tests: introduction of lagged terms.
- (2)
- Excluding low pollution emission industries: For industries with very limited pollution emissions themselves, the reduction in pollution emissions is more influenced by other factors and contingent changes in conditions, which can easily lead to an overestimation of the reduction effect of robot usage, thus making the overall regression results tend to be significant. In order to eliminate interference to obtain more accurate results, the results of the 2SLS regression were repeated after excluding the 20% of industries with the lowest pollution emissions, and the results are shown in Table 6. The estimated coefficients are significantly negative at the 1% statistical level, indicating that the industry faces a decrease in waste_gas of 0.584% for each 1% increase in the usage of industrial robots, but there is no significant effect on industrial wastewater. After excluding the low-pollution-emission industries, there was no change in the effect of reducing pollution emissions with the use of robots.It is worth noting that the method to compare the high and low pollution emissions of industries is that the annual industrial waste gas (billion cubic meters), industrial waste water (million tons), and general industrial solid waste generation (million tons) of industries are summed up according to their respective units, and then the average annual emissions are calculated, with the average annual emissions as the standard for comparison, and this method is still used in the next industry heterogeneity analysis.
Table 6. Robustness test: excluding industries with the lowest 20% of pollution emissions.Table 6. Robustness test: excluding industries with the lowest 20% of pollution emissions.
Independent Waste_Gas Waste_Water Wate_Solid Waste_Gas Waste_Water Wate_Solid dependent Robot1 −0.584 *** −0.078 −0.023 *** (0.099) (0.052) (0.004) Robot2 −3.445 *** −0.466 −0.138 *** (0.827) (0.304) (0.033) control YES YES YES YES YES YES industry YES YES YES YES YES YES time YES YES YES YES YES YES R2 0.933 0.573 0.933 0.920 0.574 0.920 Instrumental variable validity test First stage F 106.877 106.877 106.877 69.644 69.644 69.644 K-P rk LM 19.781 *** 19.781 *** 19.781 *** 25.160 *** 25.160 *** 25.160 *** Note: Standard errors of heteroskedasticity in ( ); *** indicate significant at 1% confidence levels. The first stage F-value is greater than 10, and the instrumental variable is considered non-weakly identifiable; the original hypothesis of K-P rk LM value is “the instrumental variable is not identifiable”. - (3)
- Changing the test method: In this paper, we estimated Equation (1) by using a two-step optimal GMM to make sure that the results are not altered by using a different regression method. The estimated coefficients are significantly negative at the 1% statistical level, indicating that the industry faces a decrease in waste_gas of 0.668% for each 1% increase in the usage of industrial robots, but there is no significant effect on industrial wastewater. Theoretically, if there is heteroskedasticity or autocorrelation in the random error term u of Equation (1), then the GMM is more valid relative to the 2SLS method. Verifying that the regression results will not be sensitive relative to the method, i.e., sensitivity analysis, is a better guarantee of reliable results. The results of the sensitivity analysis are shown in Table 7.
Table 7. Sensitivity analysis: two-step optimal GMM.
From the analysis of the above results, there is almost no difference between the two-step optimal GMM and 2SLS, which indicates that the conclusion that robot stock and incremental improvement can reduce industry pollution is not changed by the different estimation methods.
6. Heterogeneity Analysis
According to the preceding analysis, in order to test whether the pollution emissions of different industries have different effects on environmental pollution due to the usage of robots, this paper classifies all industries into low-pollution, medium-pollution and heavy-pollution industries according to the interval where the annual average emissions of the three main substances are located. Further, to avoid the coincidence problem due to the amount of data, the average annual emissions that are below 30,000 units, between 30,000 and 150,000 units, and above 150,000 units are used as the division criteria, respectively, for the low-pollution, medium-pollution, and heavy-pollution industries for the 2SLS work, and the estimated results are shown in Table 8, Table 9 and Table 10.
Table 8.
Industry heterogeneity: low-pollution industries.
Table 9.
Industry heterogeneity: medium-pollution industries.
Table 10.
Industry heterogeneity: heavy-pollution industries.
The results of the above analysis show that, firstly, the usage of robots is not effective in reducing emissions from low- and medium-pollution industries, but significantly reduces emissions from heavy-polluting industries. Secondly, the effect of robots to reduce industrial wastewater discharge only appeared in heavy-polluting industries, but not in low- or medium-polluting industries.
The reason for these results may be the existence of diminishing marginal effects and the increasing marginal costs of reducing pollution emissions. For industries with serious pollution emissions, upgrading abatement technologies, optimizing abatement programs, and updating abatement equipment often have rapid results. As for industries whose pollution emission level is very low, their emission reduction technology may have been more mature, their emission reduction program more sophisticated, their emission reduction equipment more comprehensive, the space to further reduce pollution emissions is relatively small, and the cost to further enhance technology, optimize the program, and update equipment is relatively high. The diminishing marginal effect and increasing marginal cost cause the robot to have no significant effect on reducing emissions in low- and medium-polluting industries.
7. Impact Mechanism Testing
In general, manufacturing sub-sectors usually take two approaches to reduce pollution emissions. First, by increasing investment in research and development, companies may be able to reduce the pollution generated during production by changing the production process. For example, the application of cleaner energy or more efficient production equipment, e.g., installation of exhaust gas treatment facilities, etc., thus reduces pollution emissions. The second is the labor substitution effect, where the usage of robots produces a labor substitution effect that requires much less labor at the same level of output, increasing the labor productivity and capital productivity of the industry. To test the existence of the R&D input effect, two-stage least squares estimation of instrumental variables was conducted with R&D input as the dependent variable and robot stock and increment as the independent variables, respectively, and results are shown in Columns 2 and 3 of Table 11.
Table 11.
Mechanism test: R&D growth effect and artificial substitution effect.
As can be seen, the improvement of both the robot stock and increment of the industry will significantly contribute to the growth of R&D investment, and the increase is large. The significant increase in R&D investment will improve the technology level of the industry, including pollution treatment technology, which will reduce the pollution emission of the industry. Based on the above analysis, Hypothesis 1 is confirmed.
Robot operation instead of manual operation is mainly reflected in the impact on employment and productivity of enterprises, reducing or even eliminating the pollution caused by manual operation without sufficient efficiency. The massive usage of robots in the industry is bound to have an impact on the labor market, especially on employment. Columns 4 and 5 of Table 11 report the estimated impact of machine stock and increment on industry employment levels, with the usage of robots having a significant effect on labor replacement. Each 1% increase in the stock and increment of robots resulted in a 0.036% and 0.209% decrease in employment in the industry. The scale of employment in the manufacturing industry is huge, and microwave enhancement will put tens of thousands of people out of work, so the “artificial substitution effect” cannot be ignored. Based on the above analysis, Hypothesis 2 is confirmed
To sum up, the usage of industrial robots in China to reduce pollution emissions in manufacturing sub-sectors is mainly through two mechanisms. First, increasing investment in pollution control R&D, improving pollution treatment capacity, and increasing the amount of pollution treated by enterprises to reduce their pollution emissions. Secondly, by replacing manual operation with robot operation, we can reduce the employment level, improve productivity, reduce the pollution problem due to the lack of fine manual operation, and reduce the pollution generation of the industry from the R&D investment side.
8. Conclusions and Future Work
8.1. Conclusions
In the context of the full emergence of artificial intelligence and industrial robotics, the usage of robots has become a topic of significant academic interest as it brings far-reaching effects to the economy and society. To this end, this paper matched the pollution emission and industrial enterprise data by using Chinese manufacturing industry segments from 2006 to 2020, and selected industrial waste gas, industrial wastewater, and general industrial solid waste as pollution emission indicators. The relationship between industrial robot usage and industry emissions was examined from an industry perspective using industrial robot data published by the International Robotics Consortium. To effectively identify the relationship, this paper selects U.S. industrial robot data as the instrumental variable and conducts an empirical study using the 2SLS model.
This paper found that the usage of industrial robots significantly reduced industrial waste gas and general solid waste emissions, with no significant effect on industrial wastewater. To effectively identify the impact of robot usage on industrial pollution emissions, we also carried out robustness and sensitivity tests by excluding abnormal indicators and changing the test method, and the results remained significant. Further mechanism analysis shows that robot usage reduces industry pollution emissions mainly through R&D investment and manual substitution. In addition, heterogeneity analysis shows that robot usage has no significant impact on low- and medium-polluting industries and a significant impact on heavily polluting industries. Overall, this paper provides new evidence to the existing literature on AI and environmental performance from the usage of industrial robots, and affirms the rationality of the increasing usage of industrial robots in China from a new perspective of micro-industry. Based on the above research findings, this paper proposes the following policy recommendations.
First, enterprises are encouraged to improve their R&D investment, and the study shows that robot use may reduce corporate pollution emissions through emissions technology enhancement. The government can provide the necessary financial and policy support for enterprise technology innovation, provide special funds and policies for research and development of technologies for environmental protection, implement precise assistance for enterprises to develop environmentally friendly technologies, and provide policy support for technology development and environmental protection for small and micro enterprises that are not strong enough.
Secondly, this paper finds that the usage of robots instead of manual operation reduces the problem of environmental pollution due to the lack of efficiency of manual operation. To this end, companies can conduct assessments on the scale of pollution emissions per capita and introduce robots targeted for production in jobs where manual pollution operations are serious due to routine, mechanical labor.
Finally, an industry-level environmental monitoring and governance system is constructed. Industry heterogeneity studies have found that the scale of pollution emissions varies widely across industries, and therefore, the emission reduction strategies adopted for different industries should be different. For low-pollution industries and medium-pollution industries, the scale of their own pollution emissions is already relatively low, so further reduction in emissions is more difficult, and the effect of using robots is not obvious; while for heavy-pollution industries, the introduction of robots to promote research and development and the reduction of manual emissions is of great significance. In China’s current situation, it is necessary to implement differentiated and targeted emission reduction measures for different industries in terms of the scale of pollution emissions.
8.2. Future Work
Future research focuses on the following two aspects: on the one hand, constructing a theoretical link between robot usage and the energy environment from multiple perspectives, and a more in-depth understanding of the drivers of energy saving and emission reduction driven by robot usage; on the other hand, future research should investigate the impact of robot usage on carbon emissions in various industries from both theoretical and empirical levels, constructing a realistic path for the synergistic evolution of carbon emission reduction and high-quality economic development.
Author Contributions
Conceptualization, methodology, software, validation, formal analysis, wring, X.L.; investigation, resources, data curation, Q.T. All authors have read and agreed to the published version of the manuscript.
Funding
This research received no external funding.
Informed Consent Statement
We confirm that we have given due consideration to the protection of intellectual property associated with this work and that there are no impediments to publication, including the timing of publication, with respect to intellectual property. In so doing, we confirm that we have followed the regulations of our institutions concerning intellectual property. Written informed consent has been obtained from the patient(s) to publish this paper.
Data Availability Statement
Data of the paper can be obtained through the correspondent author’s email.
Acknowledgments
We are grateful to the anonymous referees for invaluable feedback.
Conflicts of Interest
We wish to confirm that there are no known conflicts of interest associated with this publication and there has been no significant financial support for this work that could has influenced its outcome.
References
- Huang, G.; He, L.Y.; Lin, X. Robot Adoption and Energy Performance: Evidence from Chinese Industrial Firms. Energy Econ. 2022, 107, 105837. [Google Scholar] [CrossRef]
- Li, K.; Lin, B. How to Promote Energy Efficiency through Technological Progress in China. Energy 2018, 143, 812–821. [Google Scholar] [CrossRef]
- Ting, G.; Lan, X.; Jing, Z. Technology Enabled Governance Innovation: A Case Study Based on China’s Environmental Sector; Chinese Administration: Beijing, China, 2019; Volume 4. [Google Scholar]
- Graetz, G.; Michaels, G. Robots at Work. Rev. Econ. Stat. 2018, 100, 753–768. [Google Scholar] [CrossRef]
- Gasteiger, E.; Prettner, K. A Note on Automation, Stagnation, and the Implications of a Robots Tax; School of Business & Economics Discussion Paper, No. 2017/17; Freie Universität Berlin: Berlin, Germany, 2017. [Google Scholar]
- Ye, Z.; Yang, J.; Zhong, N.; Tu, X.; Jia, J.; Wang, J. Tackling Environmental Challenges in Pollution Controls Using Artificial Intelligence: A Review. Sci. Total Environ. 2020, 699, 134279. [Google Scholar] [CrossRef] [PubMed]
- Acemoglu, D.; Restrepo, P. Robots and Jobs: Evidence from US Labor Market. J. Political Econ. 2020, 128, 2188–2244. [Google Scholar] [CrossRef]
- Kromann, L.; Skaksen, J.R.; Srensen, A. Automation, Labor Productivity and Employment: A Gross Country Comparison; CEBR, Copenhagen Business School: Copenhagen, Denmark, 2011. [Google Scholar]
- Super, S.D.; Graziano, D.J.; Riddle, M.E.; Nimbalkar, S.U.; Das SShehabi, A.; Gresko, J. A Framework for Quantifying Energy and Productivity Benefits of Smart Manufacturing Technologies. Procedia CIRP 2019, 80, 699–704. [Google Scholar]
- Dauth, W.; Findeisen, S.; Suedekum, J.; Woessner, N. Ajusting to Robots: Worker-Level Evidence; Opportunity & Inclusive Growth Institute Wording Paper No. 13; Federal Reserve Bank of Minneapolis: Minneapolis, MN, USA, 2018. [Google Scholar]
- Lei, L.; Xiaoxia, W.; Qun, B. The employment effect of robots: Mechanisms and the Chinese experience. Manag. World 2021, 9, 32–45. [Google Scholar]
- Wang, Y.Q.; Dong, W. How does the rise of robots affect China’s labor market?—Evidence from Listed Companies in Manufacturing Industry. Econ. Res. 2020, 10, 240–254. [Google Scholar]
- Acemoglu, D.; Restrepo, P. Automatioan and New Tasks: How Technology Displaces and Reinstates Labor. J. Econ. Pespectives 2019, 33, 3–30. [Google Scholar] [CrossRef]
- Ford, M. Rise of the Robots: Technology and the Threat of a Jobless Future; Basic Books: New York, NY, USA, 2015. [Google Scholar]
- Cortes, U.; Sanchez-Mrare, M.; R-Roda, I.; Riao, D. Binding Environmental Science and Artificial Intelligence on ECAI98. AI Commun. 1999, 12, 261–265. [Google Scholar]
- Guang, Y.; Yu, H. Industrial Robot Use, Technology Upgrading and Economic Growth. China Ind. Econ. 2020, 10, 45–60. [Google Scholar]
- Shen, H.; Han, P.G. The change of governance and its path selection in the context of artificial intelligence. Seeking 2021, 6, 74–81. [Google Scholar]
- Shao, S.; Zhang, K.; Dou, J. Energy-saving and emission reduction effects of economic agglomeration: Theory and Chinese experience. Manag. World 2019, 35, 36–60. [Google Scholar]
- Zhang, Y.; Wu, J.; Zhang, R.; Deng, S.; Zhang, Y.; Wu j Li, Y.; Lin, L.; Li, L.; Wang, Y.; Wang, L. Evaluating the Relationship among Economic Growth, Energy Consumption, Air Emissions and Air Environmental Protection Investment in China. Renew. Sustain. Energy Rev. 2013, 18, 259–270. [Google Scholar] [CrossRef]
- Zhang, W. Artificial Intelligence in Environmental Governance. Front. Foreign Soc. Sci. 2019, 10, 51–66. [Google Scholar]
- Zhang, W.; Zhou, F. Analysis of Environmental Governance Changes and Coping Strategies in the Context of Artificial Intelligence. Soc. Sci. 2019, 7, 34–46. [Google Scholar]
- Cheng, P. A First Look at the Environmental Issues Raised by Artificial Intelligence. J. Cradle 2020, 2, 20–21. [Google Scholar]
- Paggio, R.; Agre, G.; Dichev, C.; Umann, G.; Rozman, T.; Batachia, L.; Stocchero, M. A Cost-effective Programmable Environment for Developing Environmental Decision Support Systems. Environ. Model. Softw. 1999, 14, 367–382. [Google Scholar] [CrossRef]
- Aghion, P.; Howitt, P. Growth and Unemployment. Rev. Econ. Stud. 1994, 61, 477–494. [Google Scholar] [CrossRef]
- Autor, D.H.; Levy, F.; Murnane, R.J. The Skill Content of Recent Technological Change: An Empirical Exploration. Q. J. Econ. 2003, 118, 1279–1333. [Google Scholar] [CrossRef]
- Dauth, W.; Findensen, S.; Jens, S. German Robots-The Impact of Industrial Robots on Workers; CEPR Discussion Papers; Centre for Economic Policy Research: London, UK, 2017. [Google Scholar]
- Furman, J.; Seamans, R. AI and the Economy. Innov. Policy Econ. 2018, 19, 161–191. [Google Scholar] [CrossRef]
- Angrist, J.; Krueger, A.B. Does Compulsory School Attendance Affect Schooling and Earnings. Q. J. Econ. 1991, 106, 979–1014. [Google Scholar] [CrossRef]
- Angrist, J. Life Time Earnings and the Vietnam Era Draft Lottery: Evidence from Social Security Administrative Records. Am. Econ. Rev. 1990, 80, 313–336. [Google Scholar]
- Nunn, N.; Wantchekon, L. The Slave Trade and the Origins of Mistrust in Africa. Am. Econ. Rev. 2011, 101, 3221–3252. [Google Scholar] [CrossRef]
Disclaimer/Publisher’s Note: The statements, opinions and data contained in all publications are solely those of the individual author(s) and contributor(s) and not of MDPI and/or the editor(s). MDPI and/or the editor(s) disclaim responsibility for any injury to people or property resulting from any ideas, methods, instructions or products referred to in the content. |
© 2023 by the authors. Licensee MDPI, Basel, Switzerland. This article is an open access article distributed under the terms and conditions of the Creative Commons Attribution (CC BY) license (https://creativecommons.org/licenses/by/4.0/).