Abstract
Sustainable consumption and production strive for the rational management of natural resources, which implies a transition to the production of fewer goods with the greatest consumer value. Consequently, the consumer value assessment is a key task in the product and service design. However, a large number of applied practices for assessing consumer value is a challenge for researchers. Multiple heterogeneous solutions without a common classification and structure do not allow comparing methods with each other. Thus, there is a demand for some universal algorithm for assessing consumer value, which would be a model for the development of individual industry practices. Therefore, the present research aims to develop a universal algorithm for assessing consumer value, which is a unified sample. The work analyzes the current expertise in assessing consumer value. The paper provides a comparison of mathematical tools for aggregate indicators in order to develop a general formula for assessing consumer value. As a result, an algorithm for assessing consumer value has been developed, which includes the following stages: market segmentation by consumer groups, taking into account their personal characteristics and needs; product hierarchical division into groups according to indicators valuable to the consumer; selection of a scale for evaluating indicators; hierarchical convolution, calculation of the consumer value of selected indicators and their aggregation into a final assessment in accordance with coefficients obtained as a result of the initial data analysis. As part of the algorithm verification, an example of the implementation of the algorithm steps based on expert assessment of the tourist product characteristics is proposed. At the next stage of the study, a register of mathematical tools will be specified to ensure the implementation of the algorithm steps, and practical testing on real data on several products from different industries.
1. Introduction
The worldwide environmental degradation, overpopulation, and overproduction crisis have led to a trend towards sustainable consumption and production. By 2020, about 700 national strategies have been announced as part of the Ten-Year Action Strategy for the Transition to the Use of Rational Consumption and Production Models [1]. Sustainable consumption and production strive for the rational management of natural resources, which implies a transition to the production of fewer goods with the greatest consumer value. Moreover, digital transformation has also changed the expectation of goods and services. Consumers are focused on affordable, high-quality, and personalized products, which makes customization necessary to maintain the competitiveness of companies [2]. The Industry 4.0 and Lean approach gives manufacturers access to extra-customization of goods through in-stock manufacturing, custom assembly, and custom manufacturing [3]. Thus, there is a transition from mass production to mass customization.
Therefore, in order to achieve a competitive edge, it is necessary to pick an individual approach to customers, e.g., analyze their interests and features, purchase methods, etc. [4]. However, the shift towards sustainable consumption and production contributes to additional risks. Production customization requires additional research and new tools to support decision-making [5,6,7]. Enterprises are beginning to apply data mining and personal data analysis in order to increase customer loyalty [8]. When complete data are available, it is possible to create user behavior models having the form of segmentation. In this case, we are talking about understanding consumer buying patterns and needs, or the customer knowledge value (CKV) [9]. The issue of analyzing consumer value in the context of individual consumer groups requires new techniques and algorithms that allow considering the product from the customer value perspective. Analyzing consumer value, a company will be able to trace individual behavior and make the most acceptable personalized offer. In the present instance, the personalized price and the personalized offer will directly depend on the “consumer value” indicator. Upon that, the “consumer value” will represent a quality balance, customization degree, and reasonable price.
A large number of applied practices for assessing consumer value is a challenge for researchers. Multiple heterogeneous solutions without a common classification and structure do not allow comparing methods with each other. The commitment to develop a practical tool tailored to solving specific tasks is understandable and efficient within a highly specialized issue. However, we are increasingly faced with complex products/services that do not fit into the general concept of industry products. Therefore, there are two following ways to resolve the situation: to develop a methodology for each product individually or to develop a general theoretical algorithm that adapts to specified products/services. The second way was selected within the current study. Thus, this research aims to develop a universal algorithm for assessing consumer value, which would be a model for the development of individual industry practices. It is assumed that the industry differences in products and services do not change the algorithm logic, since it is based on the consumer needs. In this case, the general formula for assessing consumer value will be uniform, the fundamental difference will be at the level of coefficients and the implementation of algorithm steps for a specific product.
The work analyzes the current expertise in assessing consumer value. Based on the information received, the algorithm steps reflecting the psychological and functional aspects of consumer value are identified. The paper provides a comparison of mathematical tools for aggregate indicators in order to develop a formula for assessing consumer value in a general way. The research outcome is an algorithm for assessing consumer value implemented for packages of tourist products based on the following expert data: market segmentation by consumer groups, taking into account their individual characteristics and needs; product hierarchical division into groups according to indicators that are valuable to the consumer; selection of a scale for evaluating indicators; hierarchical convolution and a general formula for calculating consumer value development. At the next stage of the study, a register of mathematical tools will be specified to ensure the implementation of the algorithm steps and practical testing on real data on several products from different industries. The project will provide grounds for the development of a common business model for customer-oriented companies seeking lean manufacturing.
2. Materials and Methods
The article represents a theoretical study on the development of a general methodology for assessing consumer value. Based on the literature review, a theoretical underpinning for a general approach is being developed; therefore, it is important to describe the process of selecting literature to be analyzed. Within the research, we were guided by the following principles: the compliance of the article to the subject area, the compliance of the article to the topic, the relevance of the article (the sources for the last ten years), and the presence of fundamental or unique results. It was necessary to provide a variety of methods for further analysis of the aspects of assessing consumer value, so preference was given to articles containing a comparison of several methods.
We have analyzed the articles from the Scopus scientific publication database by the following keywords: consumer/customer value assessment/estimation, sustainable production, sustainable consumption, customer satisfaction. The search for the given keywords yielded plenty of solutions that related to the research topic only indirectly (the vast majority of papers dealt with supply chains), so the decision was made to add extra restrictions to the required sources. Since the purpose of the study is to develop a formalized algorithm for calculating consumer value, it was agreed to limit queries to subject areas using mathematical calculation tools. The economic, mathematical, and other technical science disciplines were specified. Finally, we limited our research by subject area: Business, Management and Accounting; Computer Science; Decision Sciences; Economics, Econometrics and Finance; Multidisciplinary; Social Sciences; Mathematics. When searching for sources, we tried to avoid strict limitations on disciplines and subject areas, assuming we would find promising approaches in interdisciplinary works. As a result of the study, 184 articles were found, each of which, to one degree or another, dealt with the issue of the consumer value importance. However, only 10 of them included some description of the approach to assessing consumer value and did not duplicate each other in the aspects of interest to us.
3. Results
3.1. Consumer Value Assessment
The consumer value assessment is based on a comparative analysis of costs and benefits perceived by the consumer, while determining value using the formula of the benefits and costs ratio is not the best option, since it is univariate and does not take into account the complexity of the value concept [10]. Therefore, the dual nature of consumer value (economic and psychological) must be considered when assessing the value. In fact, due to the complexity of the consumer value concept, it is mistakenly often compared with the price of goods in the belief that the higher the price, the higher the value. At the same time, pricing can be based on the product value estimation results [11]. This approach describes the economic nature of consumer value, ignoring the psychological one. The psychological nature of consumer value is expressed through functional, social, conditional, emotional, and epistemological features of the product. As part of our research, we are interested in the psychological nature as a perceived benefit acquired on the basis of functional qualities. Functional benefit is considered as the ability of a product to satisfy a set of needs.
The studies proposing approaches to measuring value in different fields have results that cannot be compared, because they are tied to the specifics of the business, industry, type of product, consumer, etc. [10,12]. This is the reason for the lack of a unified method for assessing consumer value. Nevertheless, there are three approaches: monetary, non-monetary, and synthetic. These methods can be applied taking into account all the factors.
When using the monetary approach, the task of consumer value cost estimation is set. The approach reveals the structure of the consumer’s costs, and the economic value is estimated as the benefit of purchasing the product compared to purchasing a substitute product [10]. Thus, the value is taken as the economic benefit of choosing a product. Within this approach, the dual nature of value, which includes the psychological aspect of customer satisfaction, is not considered.
The non-monetary approach to assessing consumer value explores the correlation between “perceived quality”, “perceived price”, “perceived value”, “satisfaction”, and “loyalty”. The approach uses the model of the “value-based structures relationship”, which highlights the relationship between quality, price, and value, as well as the fact that value is the basis for satisfaction, which, in turn, is the basis for loyalty.
Customer satisfaction can be assessed via the following methods: SERQUAL (subject to the satisfaction assessment as a consequence of the service quality), Kano, CSI (customer satisfaction index) [10]. Determining the correlation between the indicators of product quality, service, relationships, and the degree of customer satisfaction is the purpose of CSI indices development. The contribution of each factor to customer satisfaction is built using statistical methods, such as factor and structural analysis.
The synthetic (integrated) method is used most often [10,12]. The value is estimated based on expert assessments or consumer surveys (as in the non-monetary approach), and then this index is compared to the price of the product on the “price-value” chart. In this case, the price-value ratio is compared to the market leader: if the product point lies above the leader’s line, the product has a competitive edge; if it lies below, the product is poorly competitive.
The value can be assessed using the customer survey method [11]. There are several approaches to it: a survey via direct questions (e.g., “How much are you willing to pay?”, “What is the probability of your purchase at price X?”, “At what price difference would you forgo purchasing product A in favor of product B?”) (*this method is applicable to industrial trade, since consumers have complete information about the market), decomposition method (survey via control points), and compositional approach (survey via direct questions about the value of commodity properties). This method is sophisticated to apply correctly, because all the rules of sociological research must be taken into consideration. Instead of this method, the expert evaluation method can be applied. It is easier to implement, but difficulties are associated with the expert subjective assessment, because it is most commonly carried out in manufacturing companies internally.
One of the methods of changing the loyalty program focus to different global types of customers (Present-Oriented, Future-Oriented, and Past-Oriented) is to divide customers into the following subtypes: Present-Hedonic, Present-Fatalist, Future-Oriented, Past-Positive, Past-Negative [13]. The literature review performed allowed to determine each type’s features that were used to develop personalized programs. Thus, the emotions each customer type experiences the most vividly were identified (relaxation, surprise, joy for Present-Oriented; excitement, hopefulness, motivation for Future-Oriented; sadness for Past-Oriented). In fact, all the customers make purchases in the company for approximately the same sum of money, but if loyalty programs are implemented considering customer types and their features, their loyalty and value will increase. Developing the best loyalty program for each customer type (long-term, short-term) in this way personalizes the approach to each customer, which is the contemporary trend.
Before the loyalty formation, customers first form value, then satisfaction [10]. In this case, the increase of the product value is based on its [value] psychological component (the value consists of material and psychological aspects) [13]. This personalizes the approach for each customer by making up an idea of them, then, taking into account the “bottlenecks” of consumer psychology and mindset, forms an offer.
The approach to assessing the level of customer satisfaction can be traced on the basis of the hotel business [14]. Travel behavior very much depends on the cultural group (nationality*) of the hotel visitors. Satisfaction with tourism depends on the material and psychological needs that vary according to tourists’ native countries and cultures, which is why they experience different emotions and different levels of satisfaction. In this case, the consumer value is evaluated variously due to the discrepancies in the material and psychological aspects it is formed from. Thus, cultural features influence the consumer value formation and evaluation. Evaluation models should take this fact into account when assessing a multinational sample of consumers. A hybrid system based on fuzzy numbers and a system similar to FTOPSIS (Fuzzy hybrid Technique for Order of Preference by Similarity to Ideal Solution) was used as a methodology for calculating user satisfaction.
The development of a product that would meet the needs of the consumer is supported by the elaboration of the Quality Function Deployment (QFD) modification [15]. QFD converts the user’s needs into technical features, such as design requirements, quality parameters, and the product/service specifications. To design the system, TOPSIS (Technique for Order of Preference by Similarity to Ideal Solution) decision-making methods, introducing a realistic view of the weight indicators of quality factors to meet the needs of the consumer, were used.
The duality of the consumer value nature is described using the example of the consumer value evaluation methods for cinema services [12]. The economic benefits highlighted by the authors are as follows: a discount system, a loyalty program, various bonus and cumulative systems, accommodation convenience, i.e., all factors that cut the cost of going to the cinema. Assessing the satisfaction of service consumers is provided by using the Kano method.
The Kano method identifies a list of needs that the service or a set of services under study should satisfy. Then the customer requirements (attributes that exist in the consumer’s perception; not specifications) for the service (set of services) that satisfy the needs are highlighted. After that it is necessary to study the nature of the consumer’s perception of these attributes.
A separate direction of creating and estimation of consumer value is co-creation. An entire series of consumer value studies consider innovations in the field of products and services in the context of customer experience management, thus creating long-term emotional bonds with their customers. In this case, the task of a particular brand is to create new meanings that would meet the desires of the client. However, the researchers note that by getting more opportunities, consumers realize their role as contributors to the market value, which leads to a partial loss of brand influence.
The category attribute is assigned through user surveys. The formation of the maximum possible consumer value is the task of the quality management system. Based on the research conducted on the value of each attribute according to the Kano method, the formation of maximum value becomes available. The results of research on factors affecting the product/service value [13,14] are potential catalysts for making managerial decisions to increase the product/service value. The task of the enterprise is to increase its competitiveness [16], which can be achieved through value chain management and quality management.
The general table of methods is presented below (Table 1).

Table 1.
Methods of consumer value estimation.
There is no single formula and approach for calculating consumer value. To calculate the product or service value, the specifics of the business, industry, type of product, consumer, etc., should be taken into account. Thus, existing studies consider and describe differences in the perception of value by consumers depending on different cultures [14], specifics of consumer behavior [15] and so on. The most common approach to assessing consumer value is the synthetic (integrated) one, which does not impose the method of calculating the indicator. No method can be used for each product/service, i.e., there is no unified method for evaluating and calculating consumer value, because they do not have a multidimensional structure of customer satisfaction.
Moreover, we are talking about multifunctional value for the client. Using the example of packages of tourist products, the possibility of meeting various customer needs is considered, from the quality of the product, its safety to uniqueness and entertainment attractiveness. The dual nature of consumer value defines the incentive for creating a general assessment methodology that will allow translating qualitative assessments of the psychological perception of a product in combination with functional characteristics into quantitative assessments.
3.2. Aggregation Methods
Any unified system or approach is based on clear rules, most often described by mathematical tools. Considering that consumer value as a combination of the indicators ranges from psychological perception to the product or service quality, it is necessary to select a unified system for evaluating these indicators. Thus, it should resemble a system with a point or rating structure as the most common option for analyzing quantitative and qualitative indicators. Moreover, the system of indicators should come to a unified assessment of the consumer value final indicator. The approach with regard to multiple indicators in a unified assessment is called aggregation [22] and requires additional analysis before developing an approach to assessing consumer value. The analysis and comparison of the aggregation methods are given in Table 2.
Table 2.
Aggregation methods.
The linear weighted method can be applied for aggregation in simple groups of indicators with conditionally equivalent elements without their strong correlation, so it is inappropriate for calculating tourist products, since tourist elements are not equivalent, and this method contains constant coefficients. A certain spectrum has a greater impact than others. For example, the housing availability and comfort are more important to a tourist than the souvenir availability in certain destination. The A.A. Denisov Information Approach is designed for tasks with the features having many intercorrelations. So, depending on whether a certain criterion changes, other criteria will also change, and so on. In this task, tourist products do not have specific and strong correlation with each other, so this approach is not appropriate.
The Saati Hierarchical Method (Hierarchy Analysis Method) compares criteria within one nested group, which imposes certain limitations. Thus, the method is based on a rationally balanced approach. Comparisons are carried out in an expert way, while the subjective expert assessment is the method’s restrictive element, which should be balanced by obtaining additional information further. In the common version of the method, a comparison is made in “each with each” mode, which imposes limitations on the size of the indicator group and a set of alternatives for comparison. There are modifications of the method that allow reducing the number of pairwise comparisons while maintaining the computational stability. Although a hierarchical model will be built further, the modified hierarchy analysis method is too abrupt. In this case, it is difficult to distribute the importance points of the 10-point scale by elements.
Maximin convolution (selection by the worst criterion), and Hermeyer’s convolution use the pessimism strategy. In this case, the method is not the best one, since with its help the enterprise will be able to identify a product or service that is not of particular value to a consumer.
The main criterion method allows improving only by one, the main criterion. However, due to the fact that the target audiences are different, it will be difficult to identify the main criterion. This method is not appropriate. The PATTERN method, linear convolution method, ontological approach, multiplicative convolution, and goal programming are more appropriate methods for forming the tourist products value for the consumers’ part.
The ontological approach implies qualitatively described relationships between elements, which imposes additional restrictions on the size of indicator groups [34,35]. Moreover, the non-linearity of the relationships between the elements leads to additional complexity of the mathematical evaluation of system indicator variety. In this case, it is necessary to choose a simpler solution to translate quality indicators into quantitative estimates.
The PATTERN method allows goals to be clearly articulated by levels [26,27,28]. It is used to evaluate a system of indicators in a hierarchical form according to an established template with pre-provided recommendations for the weight coefficient distribution within groups of indicators. Such an approach is able to become a reasonable basis for strategies in the simulation agent model. However, this method implies a high degree of detail and can only be applied to well-studied homogeneous groups of users. On the one hand, the assessment by this method will be more accurate, but on the other hand, collecting data on the behavior and goals of each individual user group will require significant resources.
Goal programming allows determining the most suitable option for the criterion with the smallest deviation from the goal, which is applicable to categories of tourists who make short trips with specified goals (attending an event, shopping) [24,32]. However, most tourists pursue several goals at once (rest and recreation, rest and event attendance, and so on), which necessitates the selection of a method that considers a set of indicators.
Let us compare linear and multiplicative convolution. Advantages of using additive convolution: it translates absolute values into relative ones, which allows comparing heterogeneous criteria; it brings the criteria value to the range [0; 1] of the absolute scale, which allows for permissible algebraic operations in it. Specifying the criterion proportion from its maximum value allows comparing the estimates obtained in different scales. The main difference is that a low score on one of the indicators with multiplicative convolution will significantly affect the overall score, while with linear convolution, the value of one indicator does not significantly affect the overall score [23,24,25,32]. As part of the tourist product evaluation, multiplicative convolution will allow the most balanced options to be immediately identified, minimizing the possibility for the situation in which one of the components spoils a good impression of everything else during the vocation. Moreover, this approach immediately focuses the tourist product owners’ attention on the main drawbacks, which allows making informed managerial decisions on further development and financing. As a result, the multiplicative convolution was selected from the methods considered. It is used for any number of indicators, independent correlations between criteria, and equal features.
3.3. Description of the Approach
The assessment of consumer value is based on the needs of certain groups of tourists. Within the study, four enlarged groups were identified as an example of market segments with individual features and characteristics. We propose to divide all tourists into segments according to demographic, social, behavioral, and psychographic features. Such features are age, living standard, income level, hobbies, and opportunities. Thus, the division of tourists will allow considering the target audience in more detail, as well as to identify the needs of different groups of consumers.
Within the study, four categories of tourists were identified [37]:
- The first segment includes people whose income level is average or below average. The purpose of their trips is to fully enjoy all the amenities at the lowest possible price. This segment is attracted to a stable environment that does not require a change of habits. This applies both to accommodation (it should provide all the amenities that tourists are used to at home) and food, which should be focused on international cuisine. Staying in hotels of low categories, they, at the same time, show a great interest in various kinds of recreation, nightclubs, bars. In most cases, this category performs short-distance travel, mainly to the nearest seaside.
- The second segment of the tourist market includes people with above-average income (upper middle class). Such tourists commonly have higher education. The main purpose of the trip for them is rest in combination with cognitive interests, while the second motive is in choosing the destination. As previously stated, the main motive of their trip is rest: outdoor activities that give the opportunity to do sports, take guided tours, visit theaters and concerts. This market segment includes long-distance travel enthusiasts who are interested in the culture and customs of the country visited. Since the cognitive motive prevails among these tourists, they can accept the lack of comfort when visiting the region of interest to them. However, this does not mean that such tourists are not demanding of the accommodation and food quality at all.
- The third segment is formed by high-income individuals. Since they have higher education in most cases, they are interested in study tours, striving for a change of impressions. There are two age categories: middle and “third” age. If people of the “third” age travel in groups, middle-aged tourists prefer individual trips or trips with small groups of friends and acquaintances. For this segment, a long-distance trip lasting 2–3 weeks is the most common option. Tourists are interested in purchasing souvenirs;
- The fourth segment consists of highly educated people who are interested in studying nature, culture, lifestyle, and customs of other nationalities. It is formed by people of various age categories and with different income levels, but they are ready to spend significant funds on travel, often using their savings. The main factor uniting this group of tourists is the desire to acquire personal experience. If the purpose of the trip is to get acquainted with the other nationalities’ lifestyle, then tourists live among local residents, eat their food, and show a great interest in folklore. This segment of the tourist market is quite small, but it has grown significantly in recent years and is tending to grow further.
In addition to the consumer’s view, it is possible to classify products by offer segments, i.e., to apply a structured approach and combine common and essential tour products into global segments of the tourism industry in a vacation destination.
Based on the structure of tourists’ expenses and the description of tourist products in the WTO methodology, several main segments of the tourism industry were considered [38]:
- Transport;
- Accommodation;
- Food;
- Leisure and recreation;
- Additional services.
Then the decision to divide these segments into component parts, on which the consumers interest depends, was made. This was done via a hierarchical model (Figure 1, Figure 2, Figure 3, Figure 4 and Figure 5). The transport segment is responsible for both making the convenient transportation when travelling (public transport) and transportation to destination (planes, trains) (Figure 1).
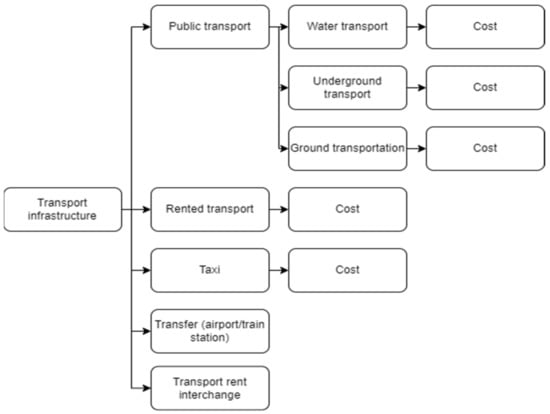
Figure 1.
Transport infrastructure.
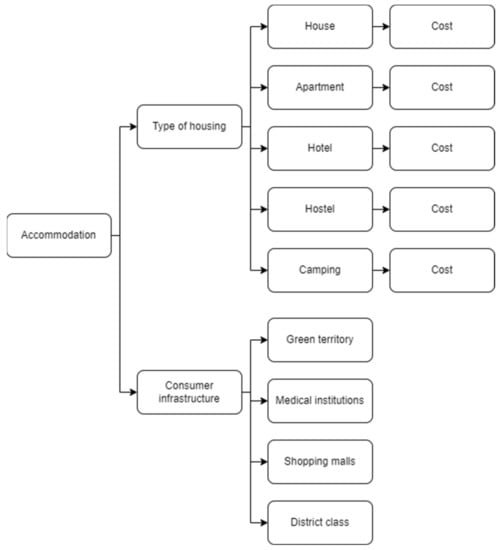
Figure 2.
Accommodation segment.
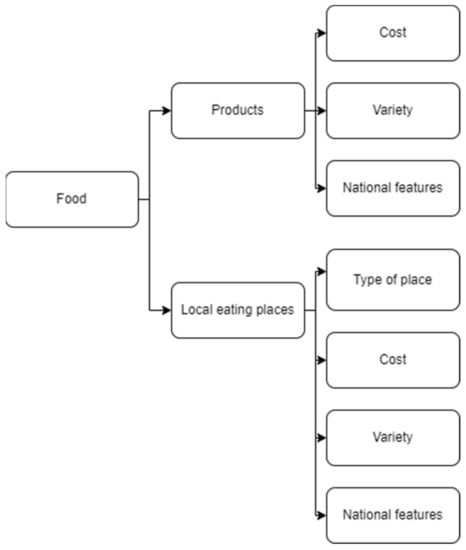
Figure 3.
Food segment.
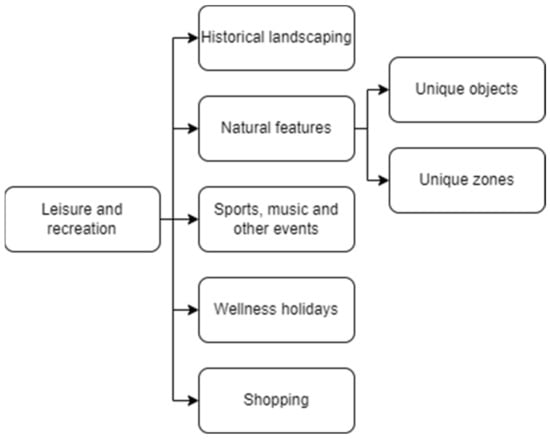
Figure 4.
Leisure and recreation segment.
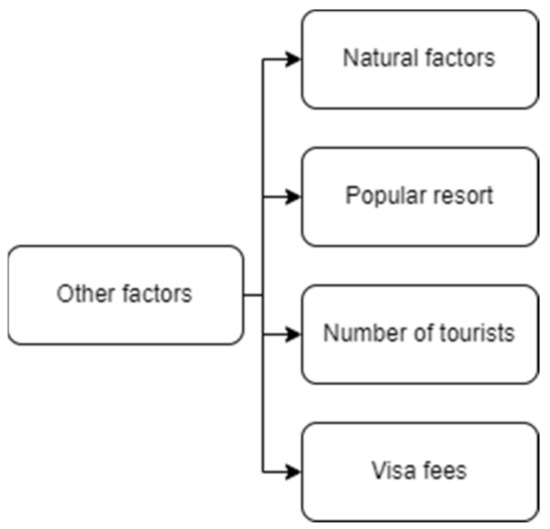
Figure 5.
Other factors.
Table 3 provides a description of the indicators.
Table 3.
Transport.
As far as translating qualitative indicators into quantitative ones needs a single approach for further consistency of the results, it was decided to set a range of values from 0 to 1. Such a range of values allows switching to binary indicators 0 or 1, if needed.
Accommodation is an important segment of the tourism industry and consists of many aspects, which are the district elitism, accessibility of parks, shopping malls, or other shops, and the accommodation comfort (Figure 2). Different groups of tourists need different accommodation conditions: some need a hostel, and some need a 5-star hotel. This will also affect the needs of consumers and, accordingly, the services provided by companies and organizations.
Table 4 provides a description of the indicators.
Table 4.
Accommodation segment.
The tourism industry food sector involves individual nutrition: ready meals (food service) and grocery shops (Figure 3). As for the tourists living in a hotel, the food aspect is included in the accommodation segment in this case.
Table 5 provides a description of the indicators.
Table 5.
Food segment.
The segment includes various attractions that can be found only in a particular destination, as well as various recreation programs (Figure 4).
Table 6 provides a description of the indicators.
Table 6.
Leisure and recreation segment.
Additional factors include the possibility of a visa fee (if the destination requires it), the resort popularity (accommodation and events congestion), and natural factors (Figure 5).
Table 7 provides a description of the indicators.
Table 7.
Additional services and factors.
Thus, based on the selected segments of the target audience and the compiled hierarchical model, it is possible to estimate the consumer value according to the formula:
where α, β, γ, φ, ω are coefficients reflecting each indicator’s significance in the overall assessment. These coefficients are determined experimentally based on the initial data and are in the range of [0,1].
The simplest way to calculate coefficients is component analysis, already successfully used to assess the impact of various parameters on consumer value [39]. It consists in detecting the relationship between the selected parameters and the final indicator. Factor analysis allows determining the degree of impact of each of the parameters on both the final result and each other. Factor analysis can be divided into deterministic and stochastic analysis. Stochastic analysis allows analyzing the existing indirect relationships. The method is used if it is impossible to find direct connections; therefore, it is used as an additional stage of data analysis. An indirect connection implies a change in the argument, followed by a change in several indicators at once. It is often sufficient to use deterministic analysis, which analyzes direct connections [40].
To shift the assessment into a 5-point scale, it is possible to estimate the consumer value according to the formula:
4. Discussion
The approach developed within this paper is based on market segmentation into consumer groups according to their features and needs. The division is based on actual behavior, i.e., the cost structure, the class of selected goods and services, and personal attributes such as age, income and education levels. This approach allows considering the needs of consumers in enlarged groups but guarantees a personalized approach due to the possibility of dividing consumer segments into smaller nested groups. Then subjective characteristics of the cultural characteristic type can be reflected at the segmentation level [14]. Therefore, the degree of personification can vary depending on the product under consideration, which provides flexibility in assessing consumer value. In comparison with existing studies, the developed approach does not focus on the impact of price [9,10]. The essence of the approach lies in the product quality evaluation through satisfaction and perceived value [41]. The selection of parameters and the establishment of dependencies between them are carried out via factor analysis [39].
At this stage, the algorithm does not include the possibility of taking into account the influence of the brand, customer loyalty and their feedback [10,12,13]. There are two reasons for this. First of all, it should be considered that consumers tend to give feedback [11] when adverse situations occur and rarely evaluate the product or service benefits. Thus, there is a possibility of value elements distortion. The second reason is that the algorithm is planned as a tool for designing consumer value with an emphasis on quality while omitting the effects of brand satisfaction or loyalty to it. However, these parameters should certainly be included as part of further work on the algorithm.
Thus, the developed algorithm is based on the concepts and tools (factor analysis to determine correlations between parameters and the value of consumer value [39]) of existing approaches, reflecting the most complete and at the same time easily scalable and adaptable vision of consumer value. In this case, the concept of price influence is certainly taken into account for each individual product, not in contrast to other functional characteristics, but as one of the equivalent elements of the indicator set. At the next stage of the study, a register of mathematical tools that ensure the implementation of the algorithm steps is to be developed, and practical testing on real data on several products from different industries is to be carried out.
5. Conclusions
As part of the study, an algorithm for assessing consumer value, which is a key tool for the transition to sustainable production, was developed. The developed solution is based on the concepts and tools of existing approaches and reflects the most complete and at the same time easily scalable and adaptable vision of consumer value. Within the research, existing practices for assessing consumer value were analyzed. The paper provides a comparison of mathematical tools for aggregate indicators in order to develop a formula for assessing consumer value in a general way. The research outcome is an algorithm for assessing consumer value implemented for packages of tourist products based on the following expert data: market segmentation by consumer groups, taking into account their individual characteristics and needs; product hierarchical division into groups according to indicators valuable to the consumer; selection of a scale for evaluating indicators; hierarchical convolution and a general formula for calculating consumer value development. At the next stage of the study, a register of mathematical tools that ensure the implementation of the algorithm steps is to be developed, and practical testing on real data on several products from different industries is to be carried out. The study is part of a project to develop industry-specific production models for client-oriented companies seeking lean manufacturing.
Author Contributions
Conceptualization, M.V.B.; Methodology, Z.V.B.; Validation, D.E.F.; Formal analysis, A.M.G.; Data curation, A.A.P.; Visualization, D.A.Z. All authors have read and agreed to the published version of the manuscript.
Funding
The research is funded by the Ministry of Science and Higher Education of the Russian Federation (contract No. 075-03-2022-010 dated 14 January 2022).
Institutional Review Board Statement
Not applicable.
Informed Consent Statement
Not applicable.
Data Availability Statement
Publicly available datasets were analyzed in this study. This data can be found here: [https://www.unwto.org/ (accessed on 20 December 2022)].
Conflicts of Interest
The authors declare no conflict of interest.
References
- United Nations. The Sustainable Development Goals Report; Department of Economic and Social Affairs: New York, NY, USA, 2021.
- Aheleroff, S.; Philip, R.; Zhong, R.Y.; Xu, X. The Degree of Mass Personalisation Under Industry 4.0. In Proceedings of the 52nd CIRP Conference on Manufacturing Systems (CMS 2019), Ljubljana, Slovenia, 12–14 June 2019. [Google Scholar] [CrossRef]
- Aheleroff, S.; Mostashiri, N.; Xu, X.; Zhong, R.Y. Mass Personalisation as a Service in Industry 4.0: A Resilient Response Case Study. Adv. Eng. Inform. 2021, 50, 101438. [Google Scholar] [CrossRef]
- Zhao, J. Synergy between Customer Segmentation and Personalization. J. Syst. Sci. Syst. Eng. 2021, 30, 276–287. [Google Scholar] [CrossRef]
- Itkis, D.; Daim, T.; Basoglu, N. Balancing Efficiency and Competitiveness in Outsourcing Decisions. Int. J. Serv. Oper. Manag. 2009, 5, 662. [Google Scholar] [CrossRef]
- Itkis, D.; Arbak, J.; Robar, H.; Kennedy, E. Managing Risks and Maintaining a Competitive Edge in Today’s Outsourcing Environment. In Proceedings of the PICMET’07—2007 Portland International Conference on Management of Engineering & Technology, Portland, OR, USA, 5–9 August 2007; pp. 1437–1450. [Google Scholar] [CrossRef]
- Information Resources Management Association. Global Business Expansion: Concepts, Methodologies, Tools, and Applications; IGI Global: Hershey, PA, USA, 2018. [Google Scholar] [CrossRef]
- Sony, M.; Antony, J.; Douglas, J.A. Essential ingredients for the implementation of Quality 4.0. TQM J. 2020, 32, 779–793. [Google Scholar] [CrossRef]
- Grönroos, C.; Voima, P. Critical service logic: Making sense of value creation and co-creation. J. Acad. Mark. Sci. 2013, 41, 133–150. [Google Scholar] [CrossRef]
- Yuldasheva, O.U.; SHubaeva, V.G.; Orekhov, D.B. Methodology of Measurement and Evaluation of Consumer Value: Differentiation of Approaches. Vestn. Nauchno-Issledovatel’skogo Cent. Korporativnogo Prava Upr. I Venchurnogo Investig. Syktyvkarskogo Gos. Univ. 2014, 3, 198–210. [Google Scholar]
- Hendler, F.; LaTour, K.A.; Cotte, J. Temporal Orientation and Customer Loyalty Programs. Cornell Hosp. Q. 2021, 63, 19389655211008413. [Google Scholar] [CrossRef]
- Bychkova, N.V.; Okol’nishnikova, I.Y.U.; Kuz’menko, Y.U.G. Review of methods for assessing the consumer value of cinema services. Vestn. YUzhno-Ural. Gos. Univ. Ekon. I Menedzhment 2015, 9, 140–148. [Google Scholar]
- Martín, J.; Rudchenko, V.; Sánchez-Rebull, M.-V. The role of nationality and hotel class on guests’ satisfaction. A fuzzy-topsis approach applied in saint petersburg. Adm. Sci. 2020, 10, 68. [Google Scholar] [CrossRef]
- Singh, A.K.; Rawani, A.M. Improving the weight of Technical Attributes in Quality Function Deployment by the Integration of Techniques for Order of Preference by Similarity to Ideal Solution method. Int. J. Product. Perform. Manag. 2022, 71, 386–404. [Google Scholar] [CrossRef]
- Shchegolev, V.V. Methods of assessing the consumer value of industrial products. Nauchno-Tekhnicheskie Vedom. SPbGPU 2010, 3, 197–201. [Google Scholar]
- Nazarenko, N.V.; Andreeva, N.A. Service quality management. Aktual. Vopr. Sovrem. Nauk. 2015, 42, 20–30. [Google Scholar]
- Forbis, J.L.; Mehta, N.T. Economic value to the customer. McKinsey Q. 2000, 4, 49–52. [Google Scholar]
- Golub, H.; Henry, J. Market strategy and the price-value model. McKinsey Q. 2000, 4, 47–49. [Google Scholar]
- ECR Europe. How to Create Consumer Enthusiasm—Road Map to Growth; ECR Europe: London, UK, 1998. [Google Scholar]
- Christopher, M. Logistics and Supply Chain Management; Pearson Education Limited: Harlow, UK, 1992. [Google Scholar]
- Virgil, P. Customer Value Measurement. Proposal for Value Measurement Model. 2022. Available online: https://www.researchgate.net/publication/361412052_Customer_Value_Measurement_Proposal_for_Value_Measurement_Model (accessed on 30 September 2022).
- Hudonogova, L.I. Aggregation of Interval Measurement Data by Aggregation of Preferences; National Research Tomsk Polytechnic University: Tomsk, Russia, 2017; Volume 142. [Google Scholar]
- Zeng, M.; Wei, W.; Zhang, X.; Ju, Y. The Risk Evaluation of Human Resources for Power Supplying Company Based on Cloud Model Beijing. In Proceedings of the 2009 International Conference on Management and Service Science, Beijing, China, 20–22 September 2009. [Google Scholar] [CrossRef]
- Barinov, N.P.; Abbasov, M.E. The Method of Qualimetric Modeling. Application Boundaries. 2016. Available online: http://www.cpa-russia.org/information-for-appraisers/methodology2 (accessed on 30 September 2022).
- Bugaeva, M.N. Making Managerial Decisions in Quality Management Using a Project Approach. Master’s Thesis, Peter the Great St. Petersburg Polytechnic University, St. Petersburg, Russia, 2015. [Google Scholar]
- Balan, O.; Moskalyk, H.; Peredalo, K.; Hurman, O.; Samarchenko, I.; Revin, F. Using the pattern method for the comprehensive organization of recruitment and selection of personnel. Int. J. Adv. Res. Eng. Technol. 2020, 11, 290–300. [Google Scholar] [CrossRef]
- Gashenko, A. Pattern method in urban studies and practices. Archit. Eng. 2019, 2, 33–39. [Google Scholar] [CrossRef]
- Aoki, T.; Traichaiyaporn, K.; Chiba, Y.; Matsubara, M.; Nishi, M.; Narisawa, F. Modeling safety requirements of ISO26262 using goal trees and patterns. Commun. Comput. Inf. Sci. 2016, 596, 206–221. [Google Scholar] [CrossRef]
- Volkova, V.N.; Loginova, A.V.; Shirokova, S.V.; Iakovleva, E.A. Models for the study of the priorities of innovative companies. In Proceedings of the 19th International Conference on Soft Computing and Measurements (SCM 2016), Saint Petersburg, Russia, 25–27 May 2016. [Google Scholar] [CrossRef]
- Saaty, T.L. How to make a decision: The analytic hierarchy process. Eur. J. Oper. Res. 1990, 48, 9–26. [Google Scholar] [CrossRef]
- Dweiri, F.; Kumar, S.; Khan, S.A.; Jain, V. Designing an integrated AHP based decision support system for supplier selection in automotive industry. Expert Syst. Appl. 2016, 62, 273–283. [Google Scholar] [CrossRef]
- Grivachev, A.V.; Sazonov, S.Y.U. Comparative analysis of approaches and methods of multi-criteria selection of complex mobile systems. Izv. YUgo-Zapadn. Gos. Univ. 2016, 5, 35–43. [Google Scholar]
- Vasetskaya, T.N. Modeling of the modified method of hierarchy analysis by means of constructive and productive structures. Vestn. Dnepropetr. Nac. Univ. Zheleznodorozhnogo Transp. 2016, 4, 64. [Google Scholar]
- Uspenskij, M.B.; Shirokova, S.V.; Mamoutova, O.V.; Zhvarikov, V.A. Complex Expert Assessment as a Part of Fault Management Strategy for Data Storage Systems. Lect. Notes Netw. Syst. 2020, 95, 592–600. [Google Scholar] [CrossRef]
- Mamoutova, O.; Shirokova, S.V.; Uspenskij, M.B.; Loginova, A.V. The ontology-based approach to data storage systems technical diagnostics. E3S Web Conf. 2019, 91, 08018. [Google Scholar] [CrossRef]
- Chan, F.T.S.; Kumar, N.; Tiwari, M.K.; Lau, H.C.W.; Choy, K.L. Global supplier selection: A fuzzy-AHP approach. Int. J. Prod. Res. 2008, 46, 3825–3857. [Google Scholar] [CrossRef]
- Goryshkina, N.E.; Gaifutdinova, T.V.; Logvina, E.V.; Redkin, A.G.; Kudryavtsev, V.V.; Shol, Y.N. Basic Principles of Tourist Services Market Segmentation. Int. J. Econ. Bus. Adm. 2019, 7, 139–150. [Google Scholar] [CrossRef]
- United Nations. International Recommendations for Tourism Statistics 2008; Department of Economic and Social Affairs: New York, NY, USA, 2010.
- Tzavlopoulos, Ι.; Gotzamani, K.; Andronikidis, A.; Vassiliadis, C. Determining the impact of e-commerce quality on customers’ perceived risk, satisfaction, value and loyalty. Int. J. Qual. Serv. Sci. 2019, 11, 576–587. [Google Scholar] [CrossRef]
- Jollife, I.T.; Cadima, J. Principal component analysis: A review and recent developments. Philos. Trans. R. Soc. A Math. Phys. Eng. Sci. 2016, 374, 20150202. [Google Scholar] [CrossRef]
- Ana, P.S.; Jesus, G.-M. A conceptual framework for customer value management. Rev. De Mark. Y Public. 2022, 5, 43–65. [Google Scholar] [CrossRef]


Disclaimer/Publisher’s Note: The statements, opinions and data contained in all publications are solely those of the individual author(s) and contributor(s) and not of MDPI and/or the editor(s). MDPI and/or the editor(s) disclaim responsibility for any injury to people or property resulting from any ideas, methods, instructions or products referred to in the content. |
© 2023 by the authors. Licensee MDPI, Basel, Switzerland. This article is an open access article distributed under the terms and conditions of the Creative Commons Attribution (CC BY) license (https://creativecommons.org/licenses/by/4.0/).