Article

Insightful Electric Vehicle Utility Grid Aggregator Methodology Based on the G2V and V2G Technologies in Egypt

1
Electrical Engineering Department, Faculty of Engineering, The British University of Egypt (BUE), El-Sherouk 11837, Egypt
2
Electrical and Electronic Engineering Division, School of Engineering, London South Bank University, 103 Borough Road, London SE1 0AA, UK
3
School of Engineering, Faculty of STEM, Arden House, Middlemarch Park, Coventry CV3 4FJ, UK
*
Authors to whom correspondence should be addressed.
Sustainability 2023, 15(2), 1283; https://doi.org/10.3390/su15021283
Submission received: 13 December 2022 / Revised: 4 January 2023 / Accepted: 5 January 2023 / Published: 10 January 2023

Abstract

:
Due to the exponential expansion of the global fleet of electric vehicles (EVs) in the utility grid, the vehicle-to-grid paradigm is gaining more attention to alleviate the pressure on the grid. Therefore, an EV aggregator acts as a resilient load to enhance the power deficiency in the electrical grid. This paper proposes the vital development of a central aggregator to optimize the hierarchical bi-directional technique throughout the vehicle-to-grid (V2G) and grid-to-vehicle (G2V) technologies. This study was implemented using three different types of EVs that are assumed to penetrate the utility grid throughout the day in an organized pattern. The aggregator determines the number of EVs that would participate in the electric power trade during the day and sets the charging/discharging capacity level for each EV. In addition, the proposed model minimized the battery degradation cost while maximizing the revenue of the EV owner using the V2G technology and ensuring a sufficient grid peak load demand shaving based on the genetic algorithm (GA). Three case studies were investigated based on the parking interval time where the battery degradation cost was minimized to reach approx. 82.04%. However, the revenue of the EV owner increased when the battery degradation cost was ignored. In addition, the load demand decreased by 26.5%. The implemented methodology ensured an effective grid stabilization service by shaving the load demand to identify the average required power throughout the day. The efficiency of the proposed methodology is ensured since our output findings were in good agreement with the literature survey.

1. Introduction

The fast development of EVs has caused a significant load on power grid systems, which require efficient control frameworks [1]. The EV charging process places an excessive overload on the power grid and can cause fluctuations in the voltage and shortages in the supply [2]. The mentioned issues were revealed during the peak demand period. In the peak demand period, the ancillary power generators enter the network to avoid fluctuations which increase the operational and maintenance costs. In the off-demand period, the unused and extra-generated power is wasted [2,3]. Generally, the distribution of the utility grid is designed with a limited margin and overloading capacity due to the dynamic behavior of the EV charging process [4]. Additional loads would increase the risk of overloads for power lines and transformers, which can lead toy extra energy losses and power quality degradation [4]. Therefore, vehicle-to-grid (V2G), vehicle-to-building (V2B) and vehicle-to-vehicle (V2V) concepts have been introduced to solve the mentioned obstacles and issues based on smart charging and discharging schedules to reduce the peak load and shape the load profile in the power grid [5].
According to a study in the USA, 90–95% of an EVs’ daily use is spent in idle or parked in parking lots [6]. In the V2G and V2V processes, the coordinated EVs need to be charged and discharged frequently to receive power and send extra power to the grid and other EVs. These processes increase the internal residence and consequently decrease the battery’s usable capacity. Therefore, the battery degradation costs have a significant influential effect on the feasibility of the V2G and V2V technologies [2].
Researchers targeted the minimum cost of recharging [7,8], minimum waiting time based on the final SOC, charging protocol, charging time [9,10,11] and maximum profit [12,13]. In [14], a comprehensive analysis of the impact of e-mobility in positive energy districts (PEDs) was analyzed. Millions of green kilometers were provided and a potential 71% of carbon emissions was saved through the use of EVs alone compared to the use of fossil fuel vehicles. In [13], a novel smart techno-economic operation of the electric vehicle charging station (EVCS) in Egypt was controlled by the aggregator based on mixed integer linear programming (MILP) and Markov decision process reinforcement learning (MDP-RL). This operation was used to maximize the charging station profit while minimizing the EV charging tariff. However, a deterministic charging schedule of the EVs was used to balance the generated and consumed power of the station and mitigate the surplus power supplied to the utility grid where the consumed power was decreased by a 4.5 kW. In [15], the total cost of building a battery energy management system (BEMS) in the presence of a PV system was minimized using the plug-in electric vehicles (PEVs) charging/discharging schedule. The actual payment for the PEV owners decreased by 17.6% and 52.3%. However, the degradation effect of the battery and the charging/discharging aspects were not investigated. A general framework was proposed in [16] to formulate a day-ahead EV recharging schedule problem. The EVs are considered to arrive between 6:00 a.m. and 8:00 a.m. with a state of charge (SOC) varying between 10% and 50% and leave at random between 4:00 p.m. and 8:00 p.m. with a SOC between 70% and 100%. However, the impact on the grid and the degradation effect were not mentioned. In [17], the V2G concept coupled with an integrated energy system (IES) was investigated to minimize the annual total cost (ATC) and annual carbon emission (ACE). However, the benefits gained from growing the EV penetration would gradually decrease when the number of EVs reaches 300 and the impact on the grid becomes less apparent. In [18], an optimization issue regarding the electricity prices and the battery degradation cost was proposed. However, this study did not consider the EV charging/discharging levels.
Two stochastic linear programming models for scheduling EV charging processes were discussed in [19]. Three applications were investigated consisting of load flattening, load peak shaving, and demand response where EV charging behaviors respond to the volatile output of wind energy. However, the battery degradation effect was ignored. In [20], an approach was introduced to reduce the peak demand by 7.8%. However, the charging and discharging levels and limits were ignored. In [21,22], the authors emphasized the battery degradation cost in the bids to ensure that the revenue will at least covers the true cost of operation. In [5], a flexible power transfer based on the V2V concept was investigated to reduce the energy consumption. However, the initial and targeted SOC and the battery degradation factors were not mentioned. A brief of the literature survey concerning the same research field is presented in Table 1. The findings of the stated articles declared the need to minimize the battery degradation cost and maximize the V2G revenue utilizing various optimization algorithms (OAs), the battery degradation cost with and without using the corresponding OA, the initial and final SOC, the number of participated EVs and a summarized conclusion. Our proposed methodology dealt with the various EV categories and specifications, investigated in the trailing sections.
In this paper, three main EV categories were used in the charging and discharging process where the integration satisfied the energy production and consumption to charge the EVs while shaving the load demand to reduce the pressure on the utility grid. The proposed approaches could be used throughout the day including for commercial and residential hours. The main challenge of this paper was designing a framework that dealt with the initial SOC, arrival and departure time, charging and discharging required power, degradation effect and V2V and V2G impact.

2. V2G Proposed Optimization Framework

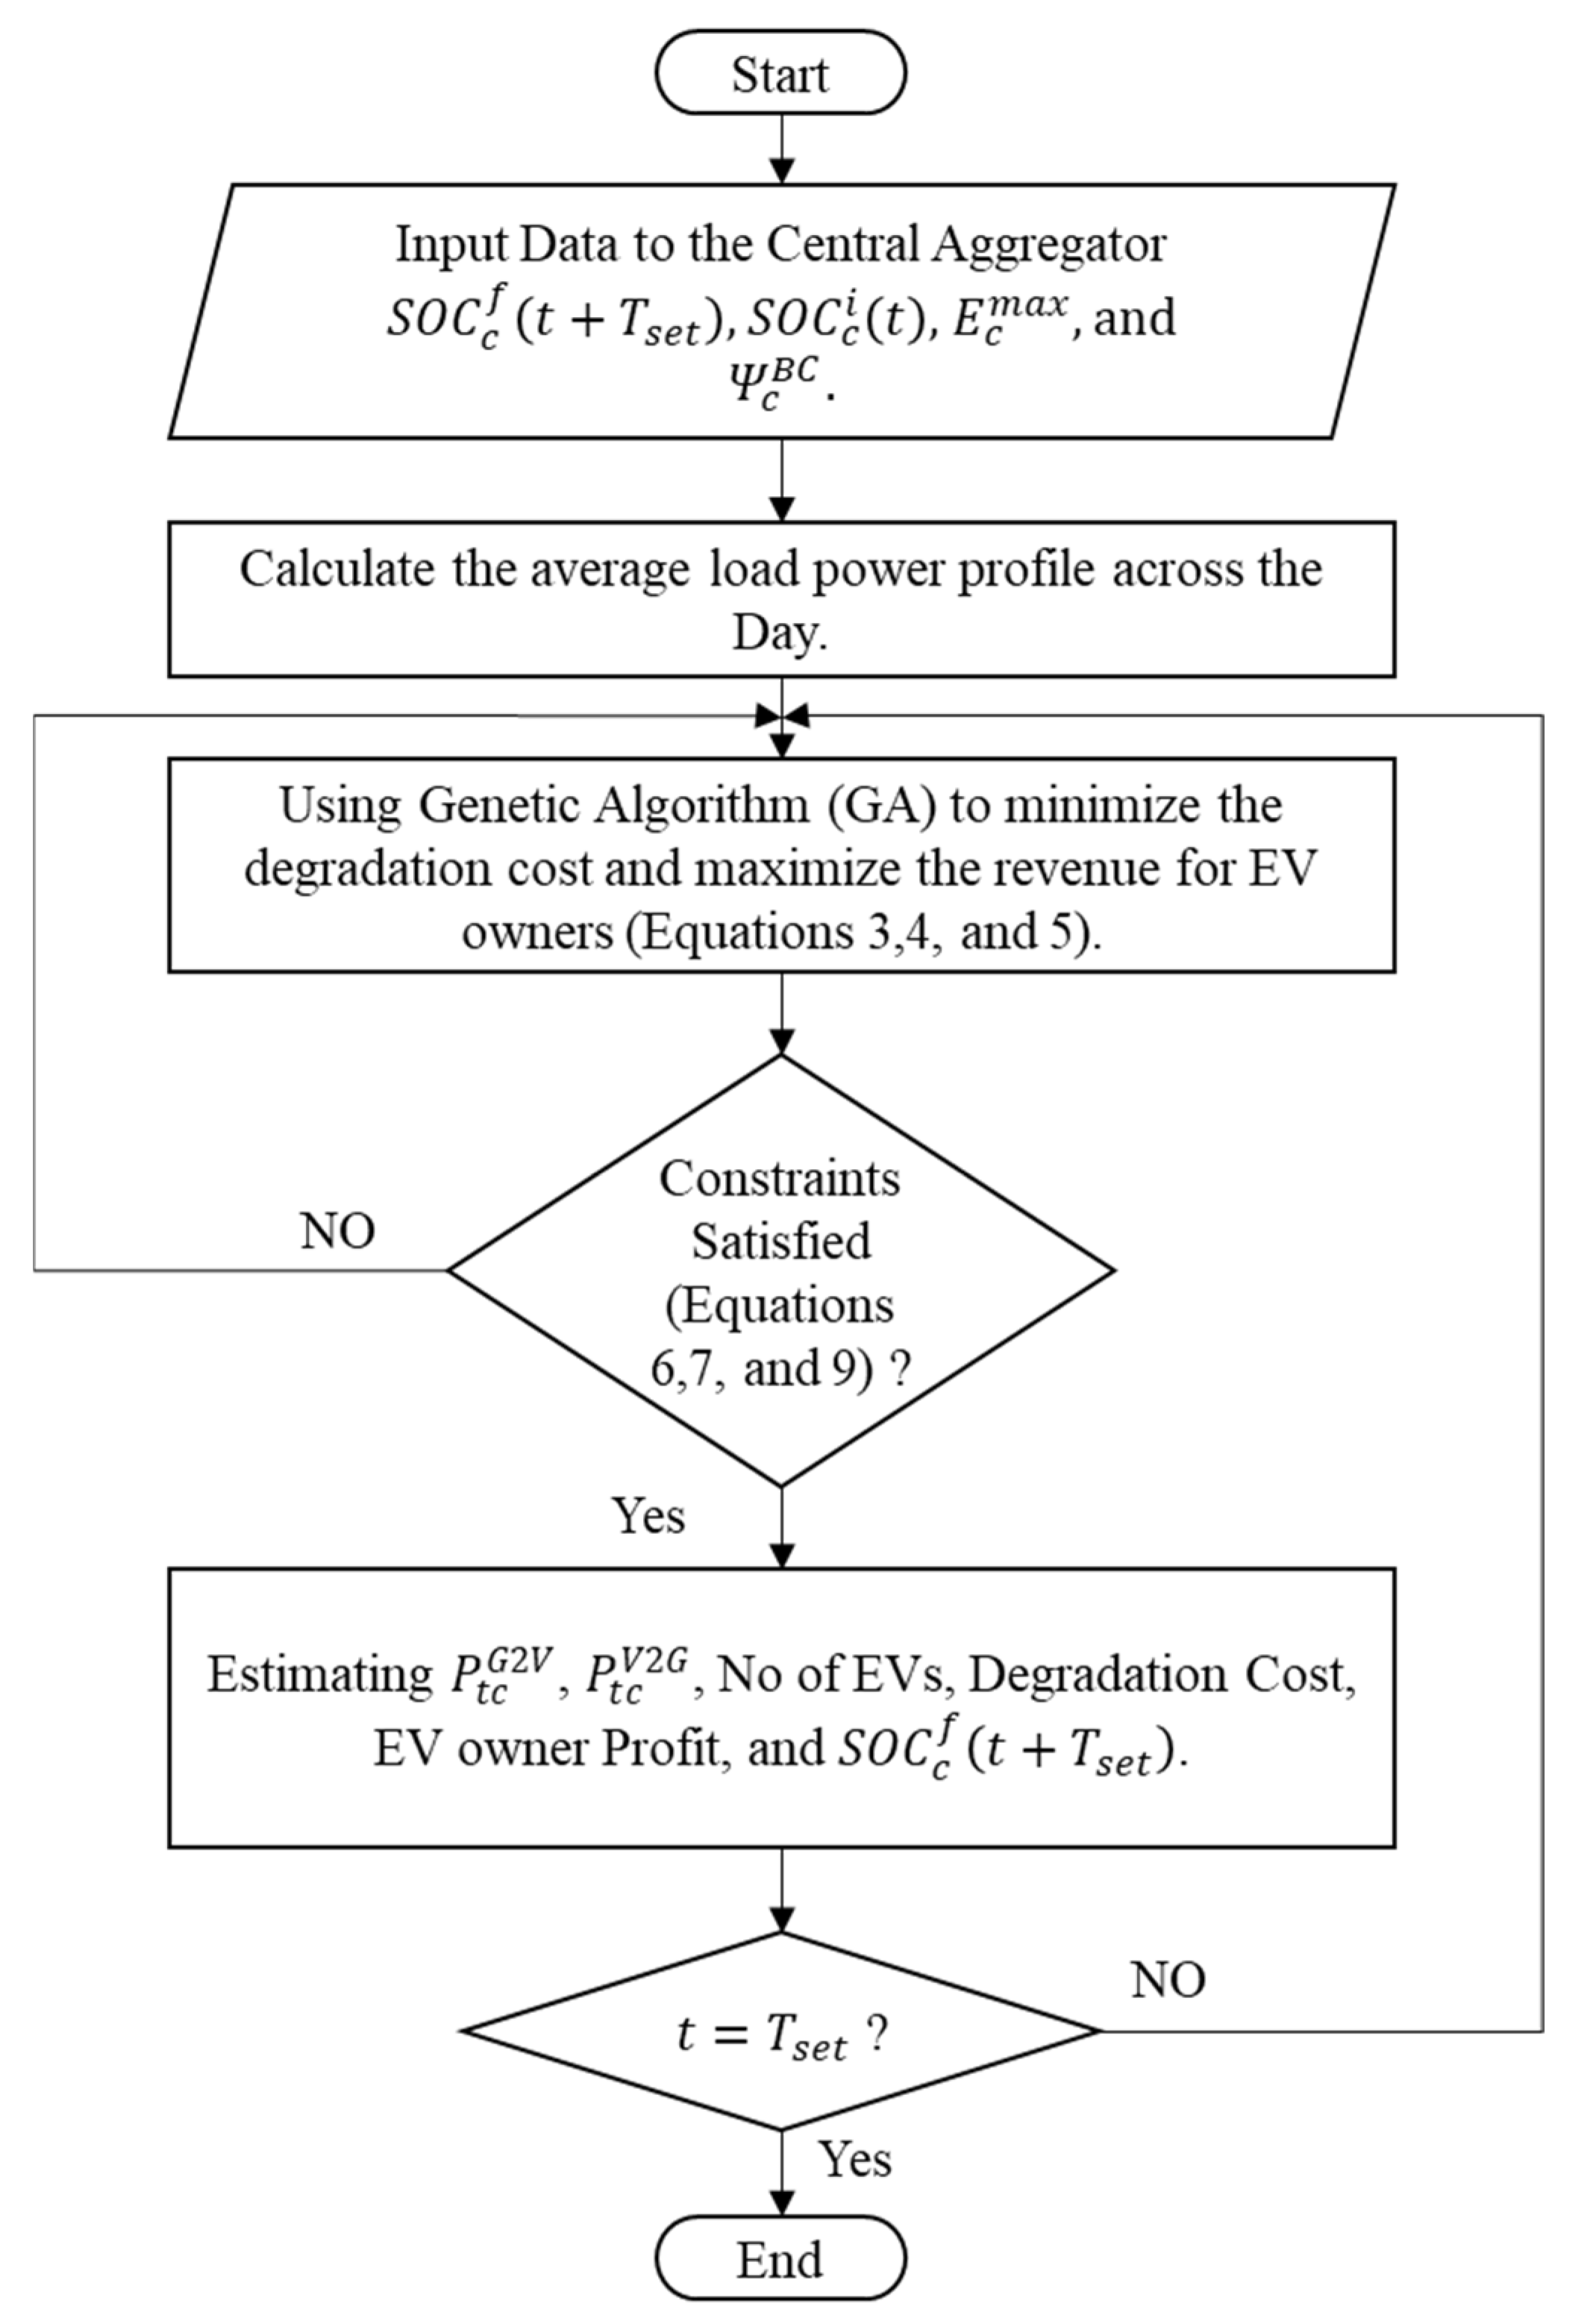
2.1. Proposed Framework

This paper proposes the vital development of a central aggregator which regulates the charging and discharging process of various EV categories while balancing the consumed and supplied power of the utility grid. The proposed framework depends on the arrival time, departure time, initial SOC, required final SOC, EV category and energy price for both the V2G and G2V technologies as shown in Figure 1. We assumed that the EVs had the information and communication devices installed and were in direct contact with the central aggregator. The specifications of the three random EVs categories used for this study (Nissan Leaf (2020), Tesla Model S (p100d) and Mustang Mach-E) are stated in Table 2. It was assumed that the EVs had an initial SOC of 50%, the tariff for using the electrical energy from the grid was 3.75 EGP/kWh [13,27,28], and the revenue from using the V2G technology was 5.625 EGP/kWh as an incentive for the EVs owners. All the stated specifications and assumptions were used for testing and proving the robust dynamic effectiveness of the proposed aggregator methodology based on the G2V and V2G technologies.
The hierarchical control of the proposed framework was to minimize the degradation cost of the EV energy storage capacity and maximize the EV owner’s profit while shaving the load power demand, as discussed in the following sections.

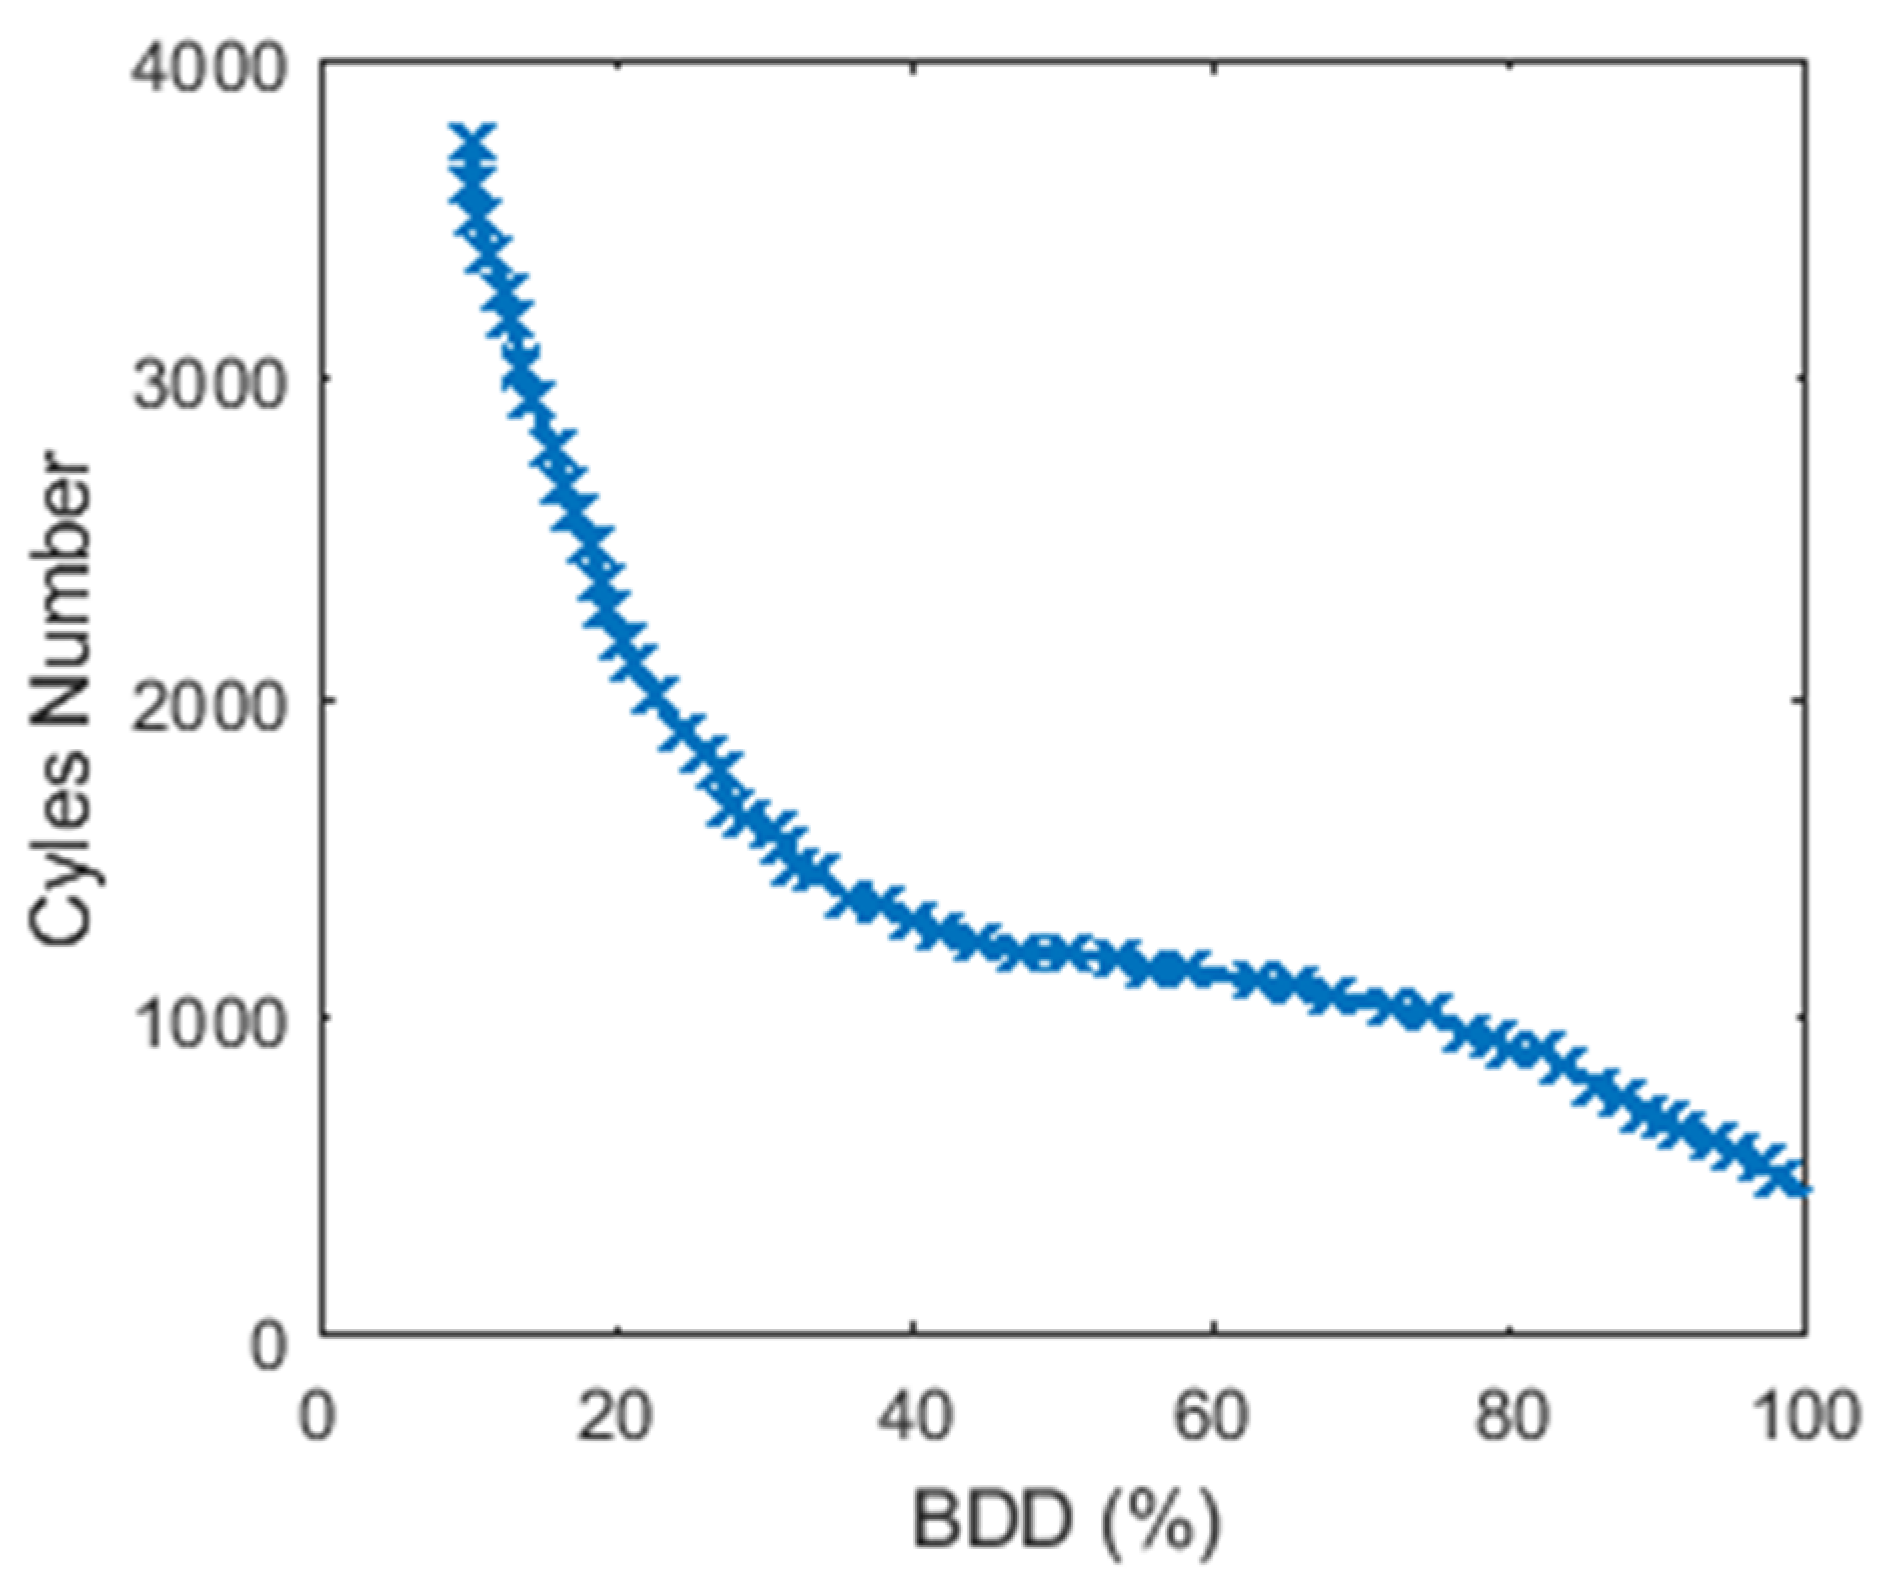
2.2. Battery Degradation Cost Model

Battery degradation is considered the key factor for evaluating the performance and quality of EV batteries based on their capacity and efficiency [2]. The battery discharging depth (BDD) and lifecycle of the lithium-ion batteries are presented in Figure 2. These statistics were collected from an empirical datasheet of various lithium-ion batteries [25]. The analysis perfectly matches the outcomes of the following equation as in [23,25]
N c l ( d ) = α d β
where, N c l is the life span charging/discharging cycles of an EV battery with an overall depth of discharge
d and α , β are the coefficients of battery specifications.
As shown in Figure 2, the relation between the BDD and lifecycle was a non-linear function. In [23,24], the battery degradation function was considered a linear function at every time step and the corresponding scenario and can be represented by Equation (2)
Ψ t c B D C = t = 1 T P s e t c = 1 C E V 2.03 · a 0 · Ψ c B C · D O D · P t c V 2 G E c m a x · η D
where c is the category of EV, t is the parking interval time, Ψ c B C is the price of the battery (EGP), E c m a x is the maximum battery capacity (kWh), η D is the discharging efficiency (assumed to be 95%), D O D is the maximum depth of the discharge in each segment and can be represented by the state of charge 1 S O C c f ( t + T s e t ) , a 0 is the polynomial coefficient of the cycle depth degradation function (5.24 × 10⁻⁴) and P t c V 2 G is the discharging of power from the EV to the utility grid (kW).

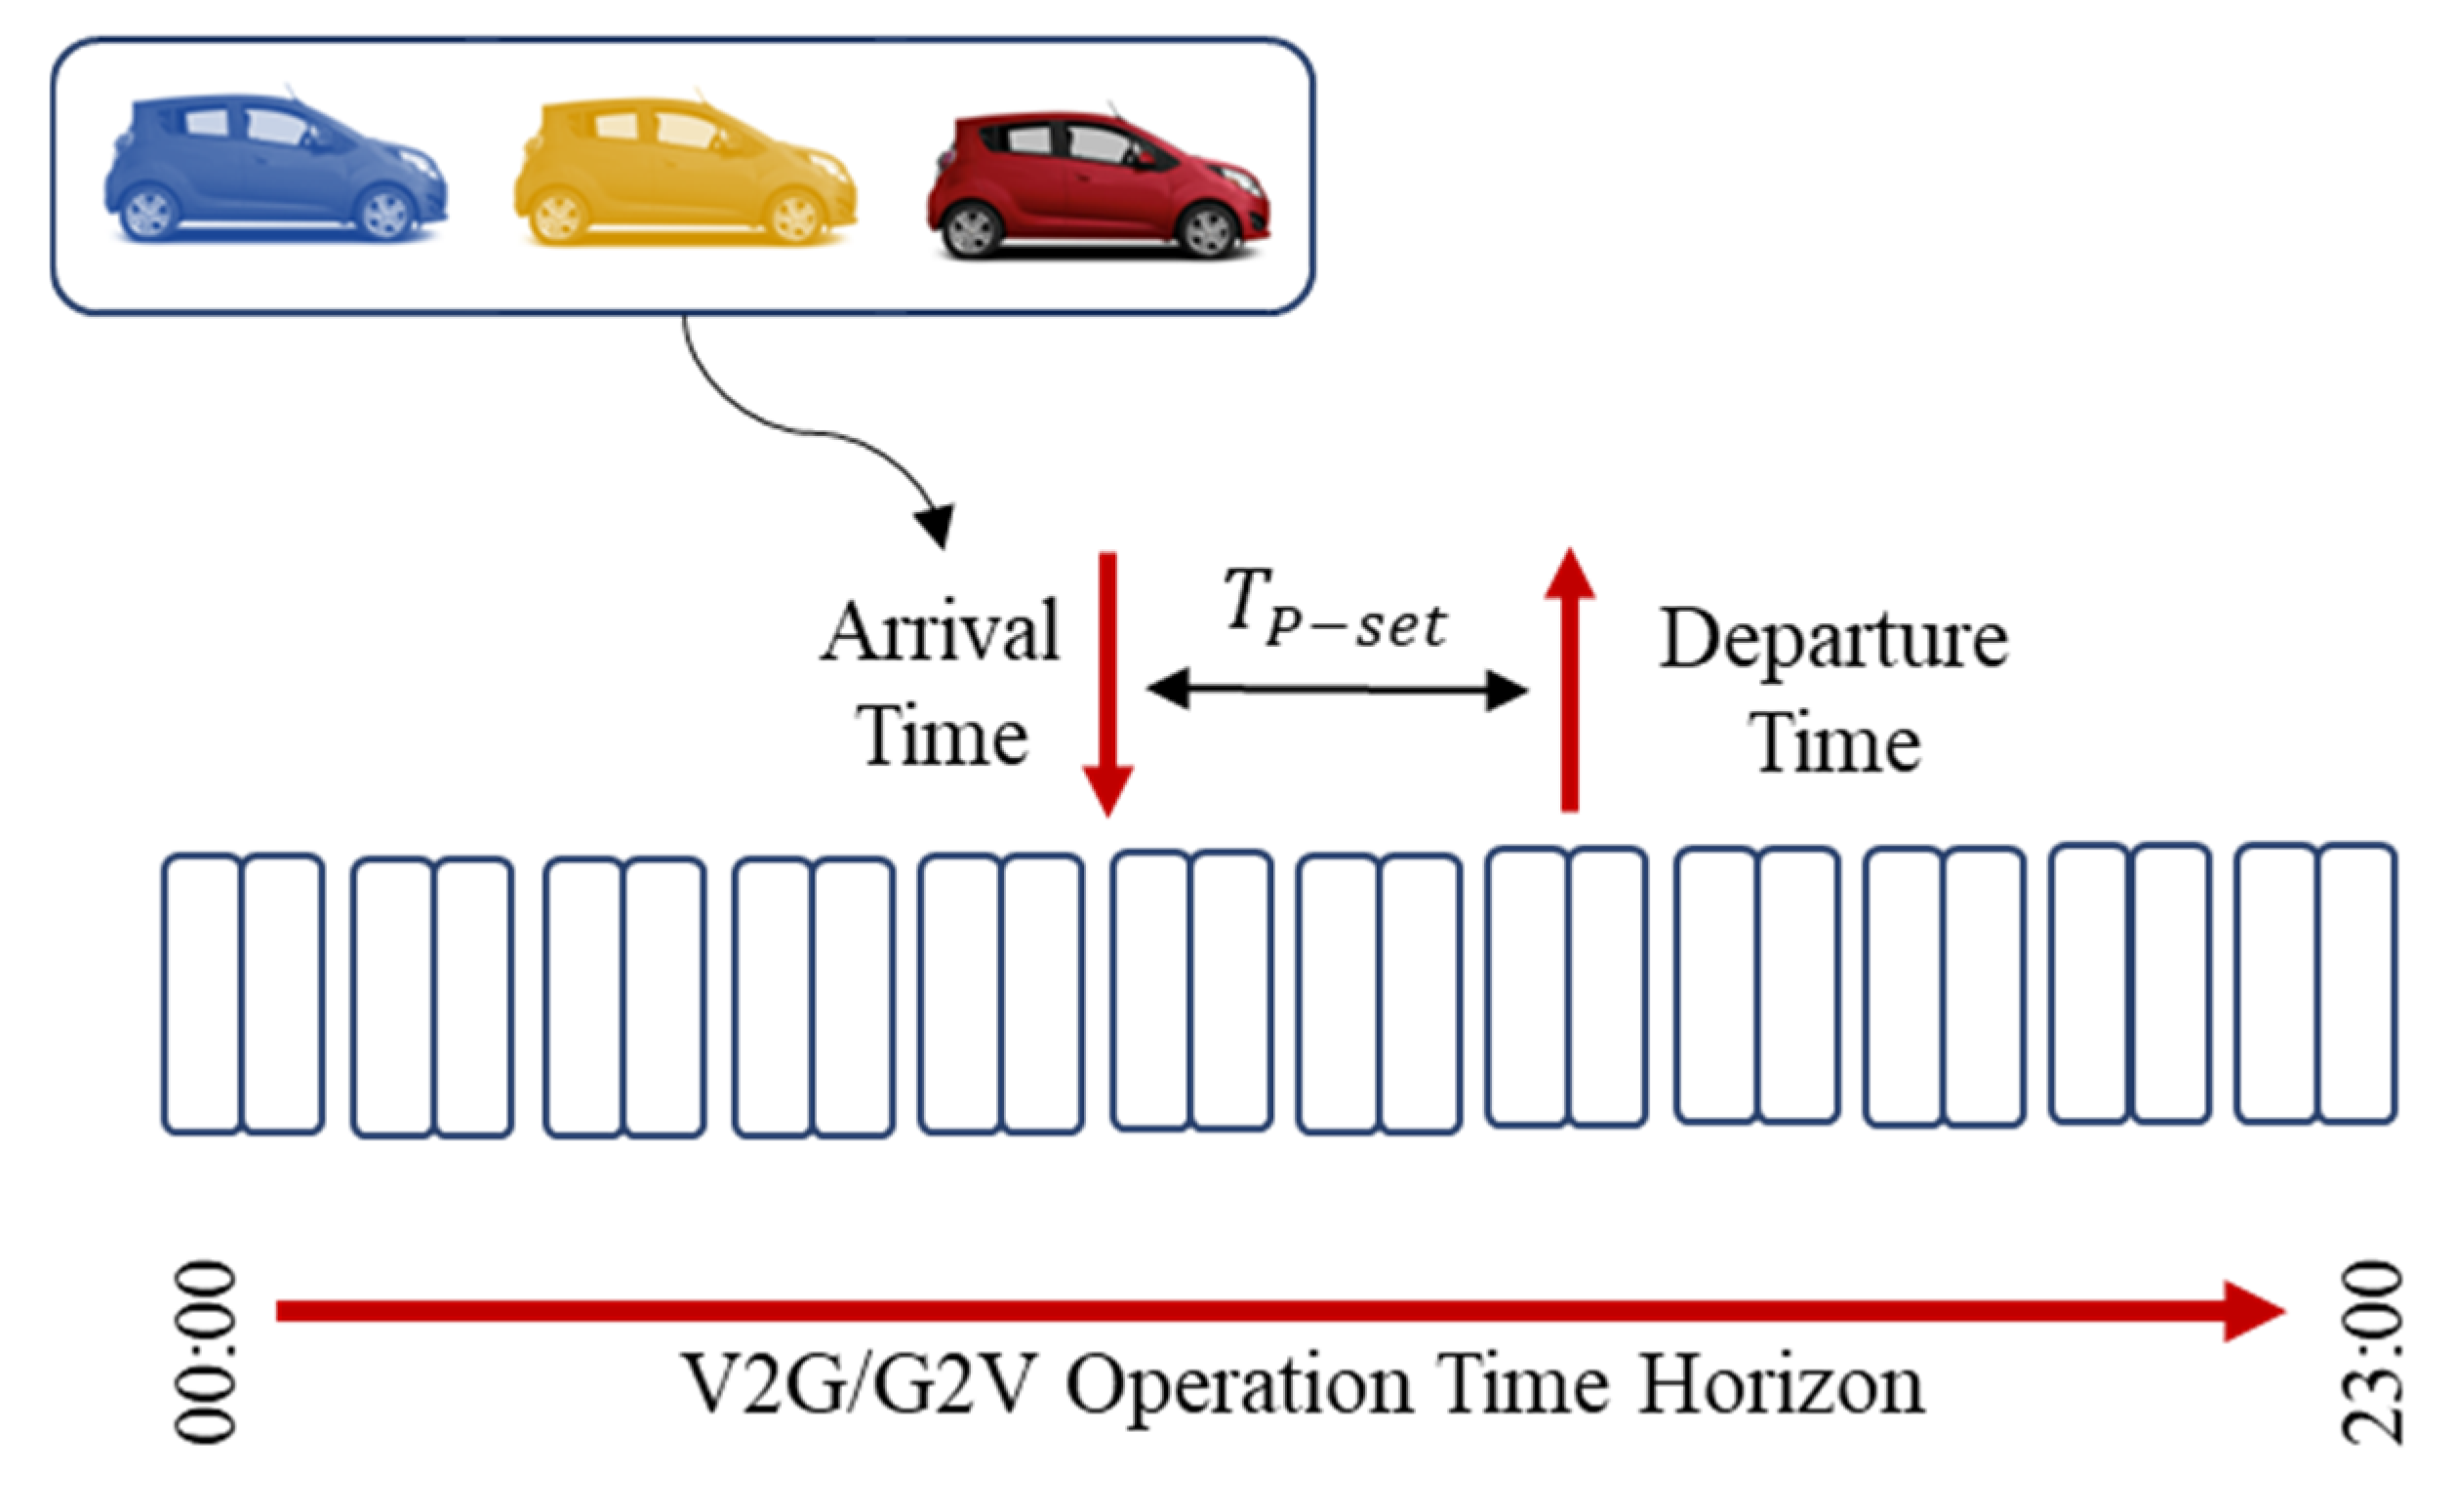
2.3. Proposed V2G Scheduling Modelling and Constraints

The objective function to minimize the degradation cost and maximizes the revenue for EV owners after the V2G operation while parking can be represented by Equations (3)–(5). This formulation is considered a complex constraint comprised of two objective functions.
M i n i m i z e   K 1 K 2
K 1 = t = 1 T P s e t c = 1 C E V Ψ t c B D C · T s e t
K 2 = t = 1 T P s e t c = 1 C E V ( ( ε · P t c V 2 G · Ψ t c R C _ V 2 G ) ( ( 1 ε ) · P t c G 2 V · Ψ t c T C _ G 2 V ) ) · T s e t
where, P t c G 2 V is the EV charging power from the utility grid (kW), Ψ t c T C _ G 2 V is the EV charging tariff cost while using the V2G technology (EGP/kWh), Ψ t c R C _ V 2 G is the EV owner discharging revenue cost while using the G2V technology (EGP/kWh) and ε is a switching binary number (1 or 0) to ensure using either the V2G or G2V technology at the corresponding interval time.
The constraints used in this paper were represented by Equations (6)–(9) where the SOC at the beginning and end of each interval time were less than 95% and more than 20%, and the average power demand of the utility grid was equal to the average required power throughout the day.
0.2 S O C t c f ( t + T s e t ) 0.95
0.2 S O C t c i ( t ) 0.95
S O C c f ( t + T s e t ) = S O C c i ( t ) + t = 1 T P s e t ( ε · P i j G 2 V · η i j G 2 V ( 1 ε ) · P i j V 2 G η i j V 2 G E c m a x ) · T s e t
P t c A v e r a g e = t = 1 T P s e t c = 1 C E V ( P t c V 2 G P t c G 2 V )
where, S O C i j f ( t + T s e t ) is the final SOC for each EV category, S O C c i ( t ) is the initial SOC for the interval time segment and T P s e t is the set of parking time slots with a similar charge/discharge power.

2.4. Solving Based on the Genetec Algorithm (GA)

The proposed fitness function accompanied by the previous constraints was solved using the genetic algorithm (GA). The topology of the genetic algorithm is based on the biological evolution process of the computational data and the mechanism of natural genetics selection. The GA is composed of three main significant operators, namely reproduction, crossover and mutation. These operators result in an optimum solution using a fitness function that maps the natural objective function [29]. The GA is a heuristic algorithm that can easily choose satisfactory solutions using its own characteristics stemming from its good global search performance and low complexity [30]. The GA can find the near-optimal solution faster than the MILP method as stated in [31]. In this paper, we utilized the GA to minimize the degradation cost while maximizing the profit of the EV owner by using the V2G technology. The obtained results had a strong impact concerning the literature survey, as summarized in Table 1.
A complete flow chart of the proposed electric vehicle utility grid aggregator methodology based on the G2V and V2G technologies is expressed in Figure 3.

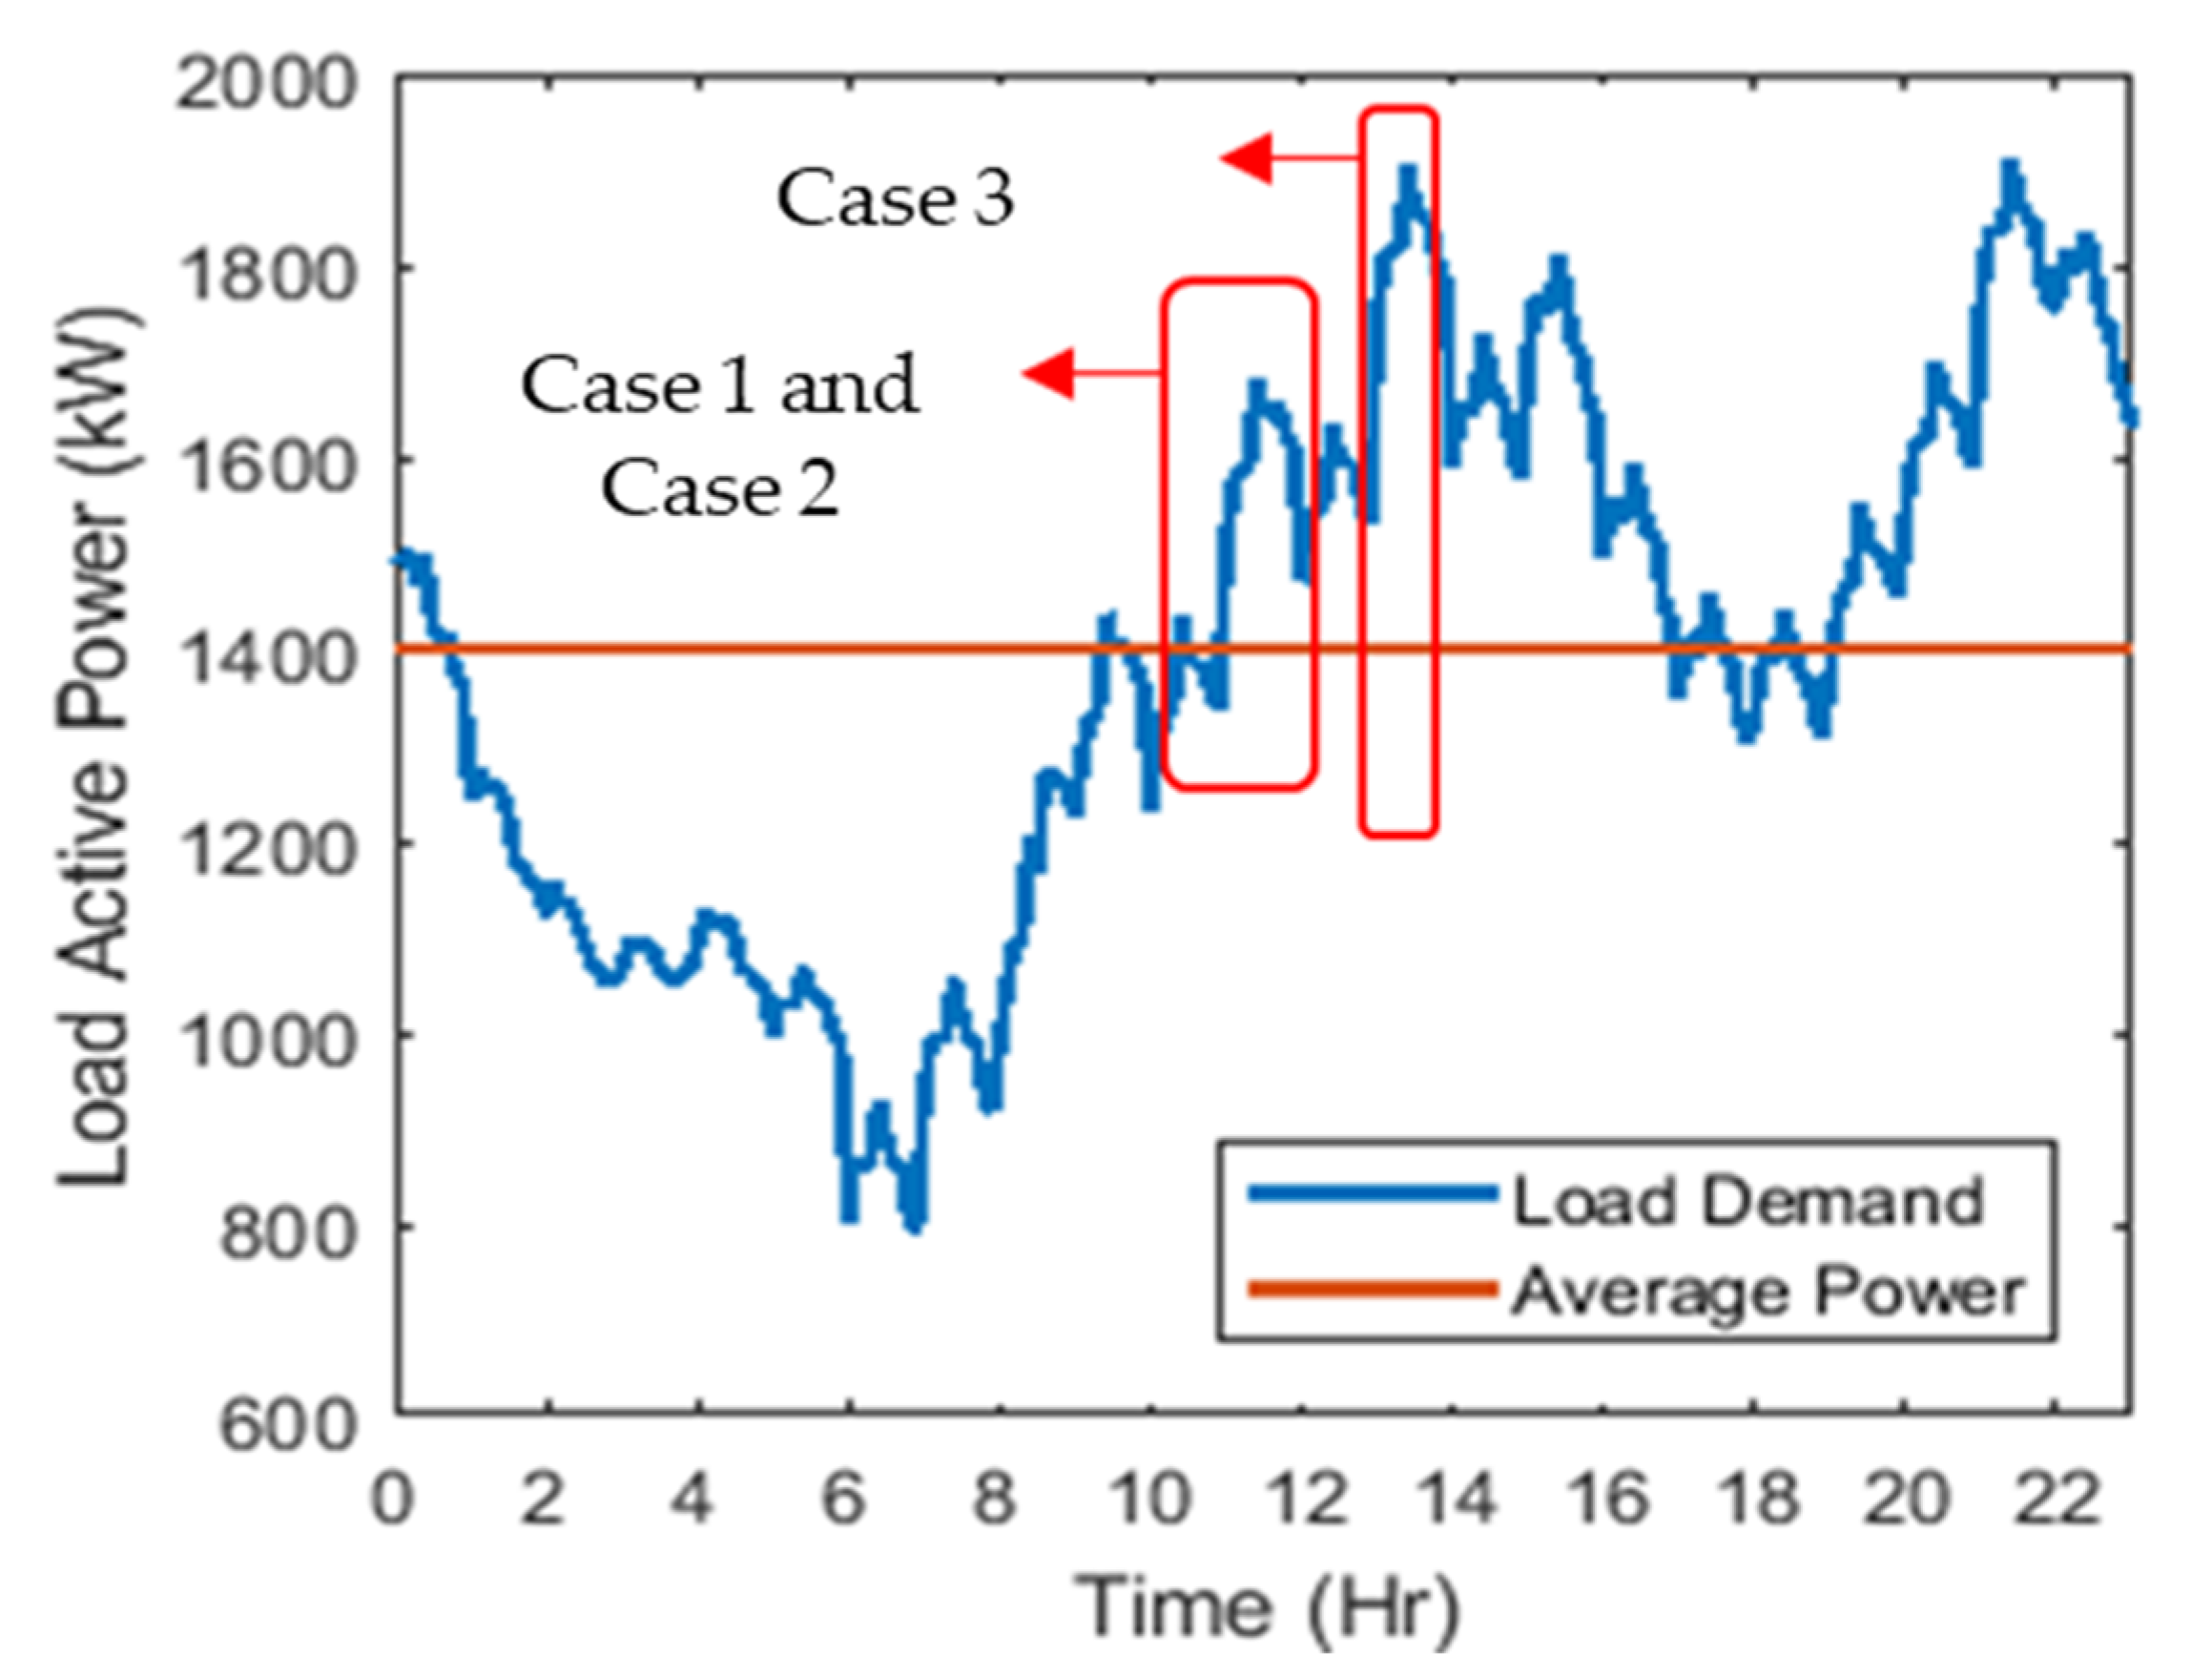
3. Results and Discussion

The Egyptian Electrical Unified Network (EEUN) consists of six geographical regions: Cairo, Canal, Delta, Alexandria/West Delta, Middle Egypt and Upper Egypt [32,33]. The transmission system of the utility grid electricity was designed at 500 kV, 400 kV, 220 kV, 132 kV and 66 kV levels, the distribution networks at 11 kV and the loads at 400 V. The power quality was measured on the primary substation (11 kV) as active power load within 24 h, as shown in Figure 4. The stated power demand represented the deficiency of the utility grid in the presence of fast-charging electric vehicle charging stations and normal grid loads as discussed in our previous work [13]. The target was utilizing smart charging and discharging schedules to reduce the peak load and shape the load profile in the power grid to reach an average load profile throughout the day, as shown in Figure 4.
In this paper, two scenarios were investigated and compared to each other at different hours throughout the day. The first scenario is implemented using the fitness function with the battery degradation impact function and the second scenario was implemented while ignoring the battery degradation cost. Both scenarios were investigated in various case studies throughout the day as represented in Figure 4.

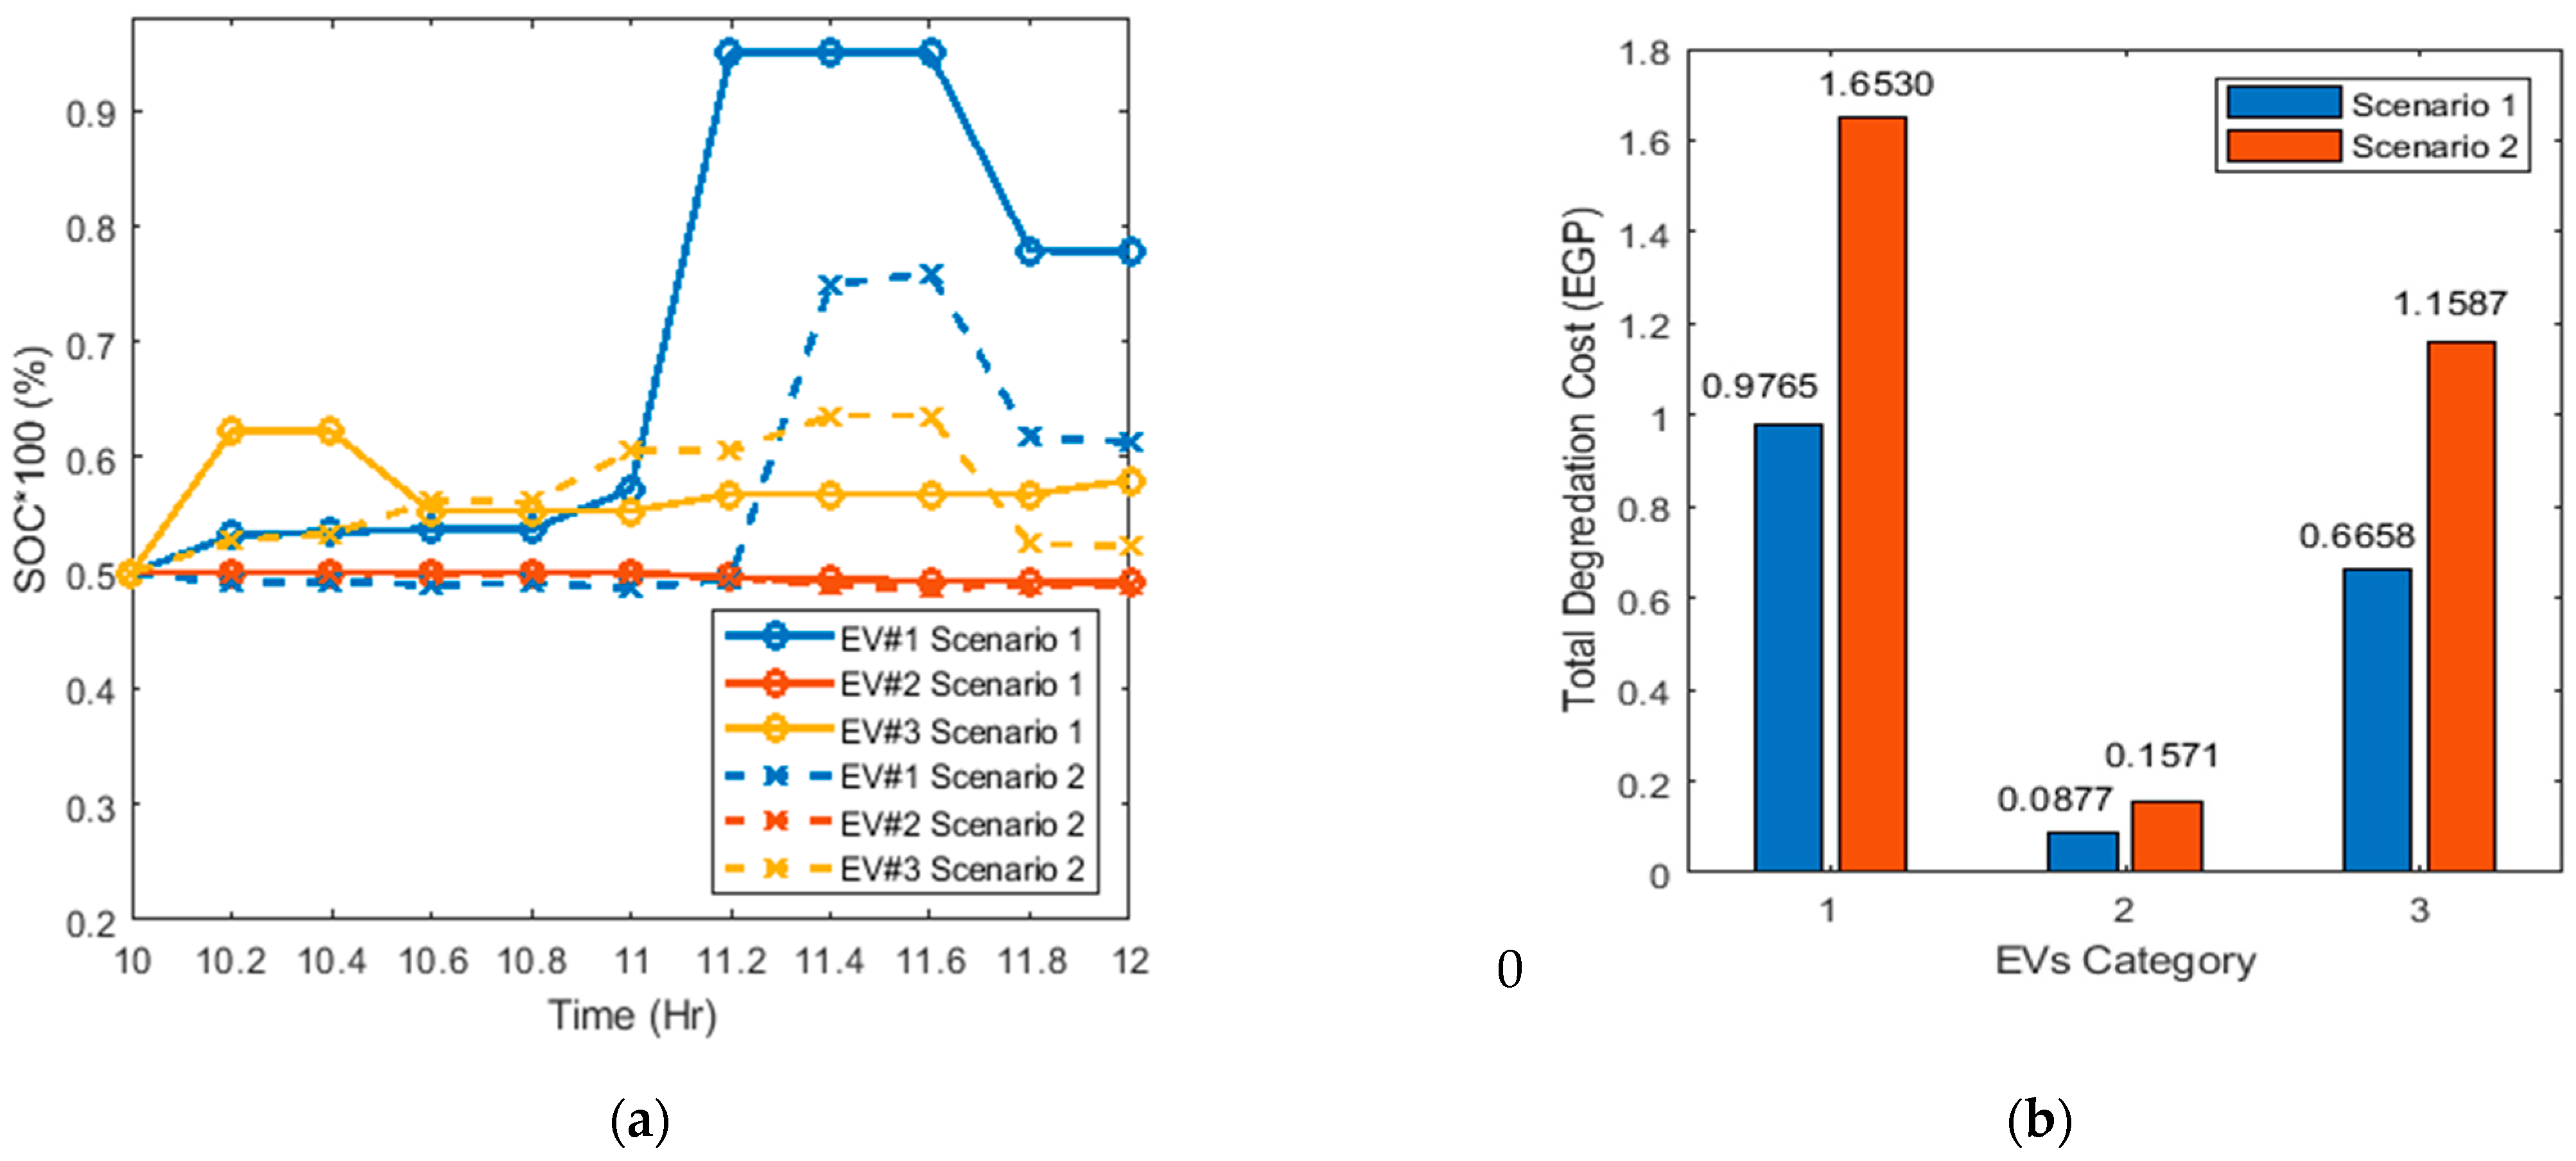
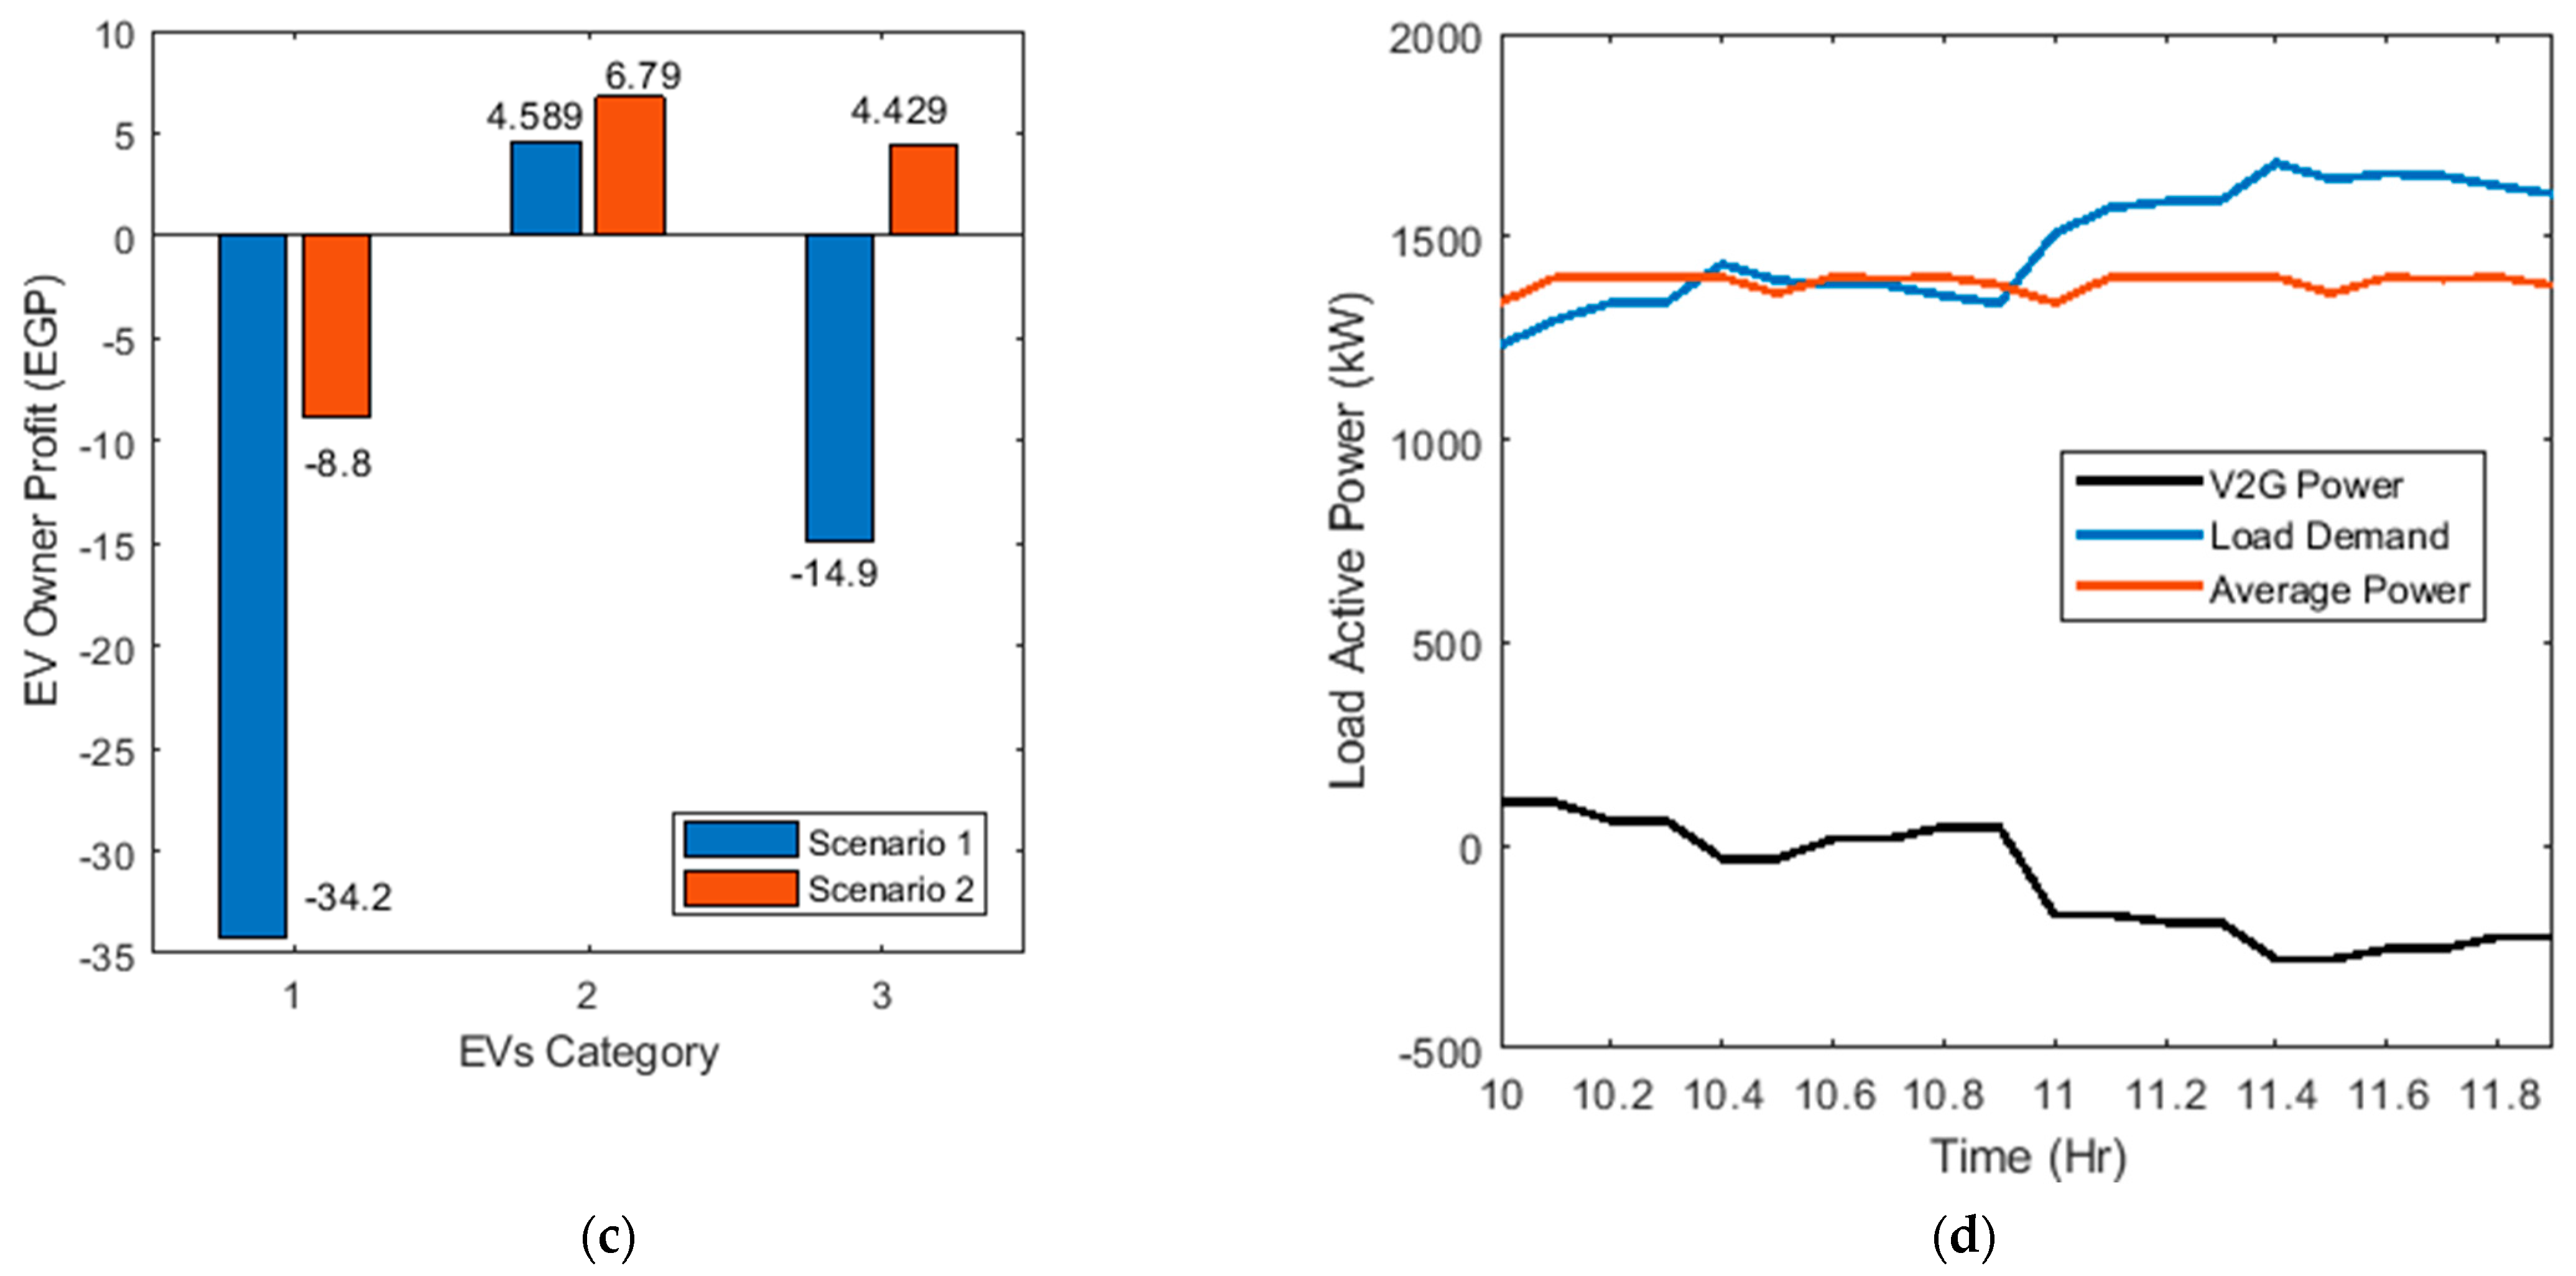
3.1. Case 1: Continuous Parking for a 2 h Interval Time

In Case 1, we assumed that all the EVs would remain continuously parked for 2 h from 10:00 to 12:00. The target was to shave the peak load demand of the utility grid using the G2V/V2G techniques to reach the required average power.
The aggregator rule in this paper was to select the number of EVs for each category to participate in the V2G/G2V technique and determine the required charging/discharging power while maximizing the SOC and revenue of the EV owner and minimizing the battery degradation cost. The number of EVs, final SOC, degradation cost and EV owner profit for each hour are expressed in Table 3 and represented in Figure 5.
The simulation interval time was 6 min to ensure the accuracy of the model. The EV SOC levels are expressed in Figure 5a where the EVs of the first and third categories were charged with various capacities for both scenarios while minimizing the degradation cost and maximizing the profit. However, the second EV category was discharged by 0.85% and 1.16% respectively for both scenarios to compensate for the deficiency in the utility grid. The battery degradation cost was investigated for each EV category, as shown in Figure 5b. The degradation cost using the GA was decreased by 40.9256%, 44.1757% and 42.544% for EV Categories 1, 2, and 3, respectively, with respect to the objective function without considering the degradation cost. It was observed that the revenue for each EV owner in Scenario 2 was higher than in Scenario 1, as shown in Figure 5c. The load demand of the utility grid was reduced by 17.125% at 11:30 a.m. and remianed almost equal to the calculated average required power across the parking interval time as shown in Figure 5d.

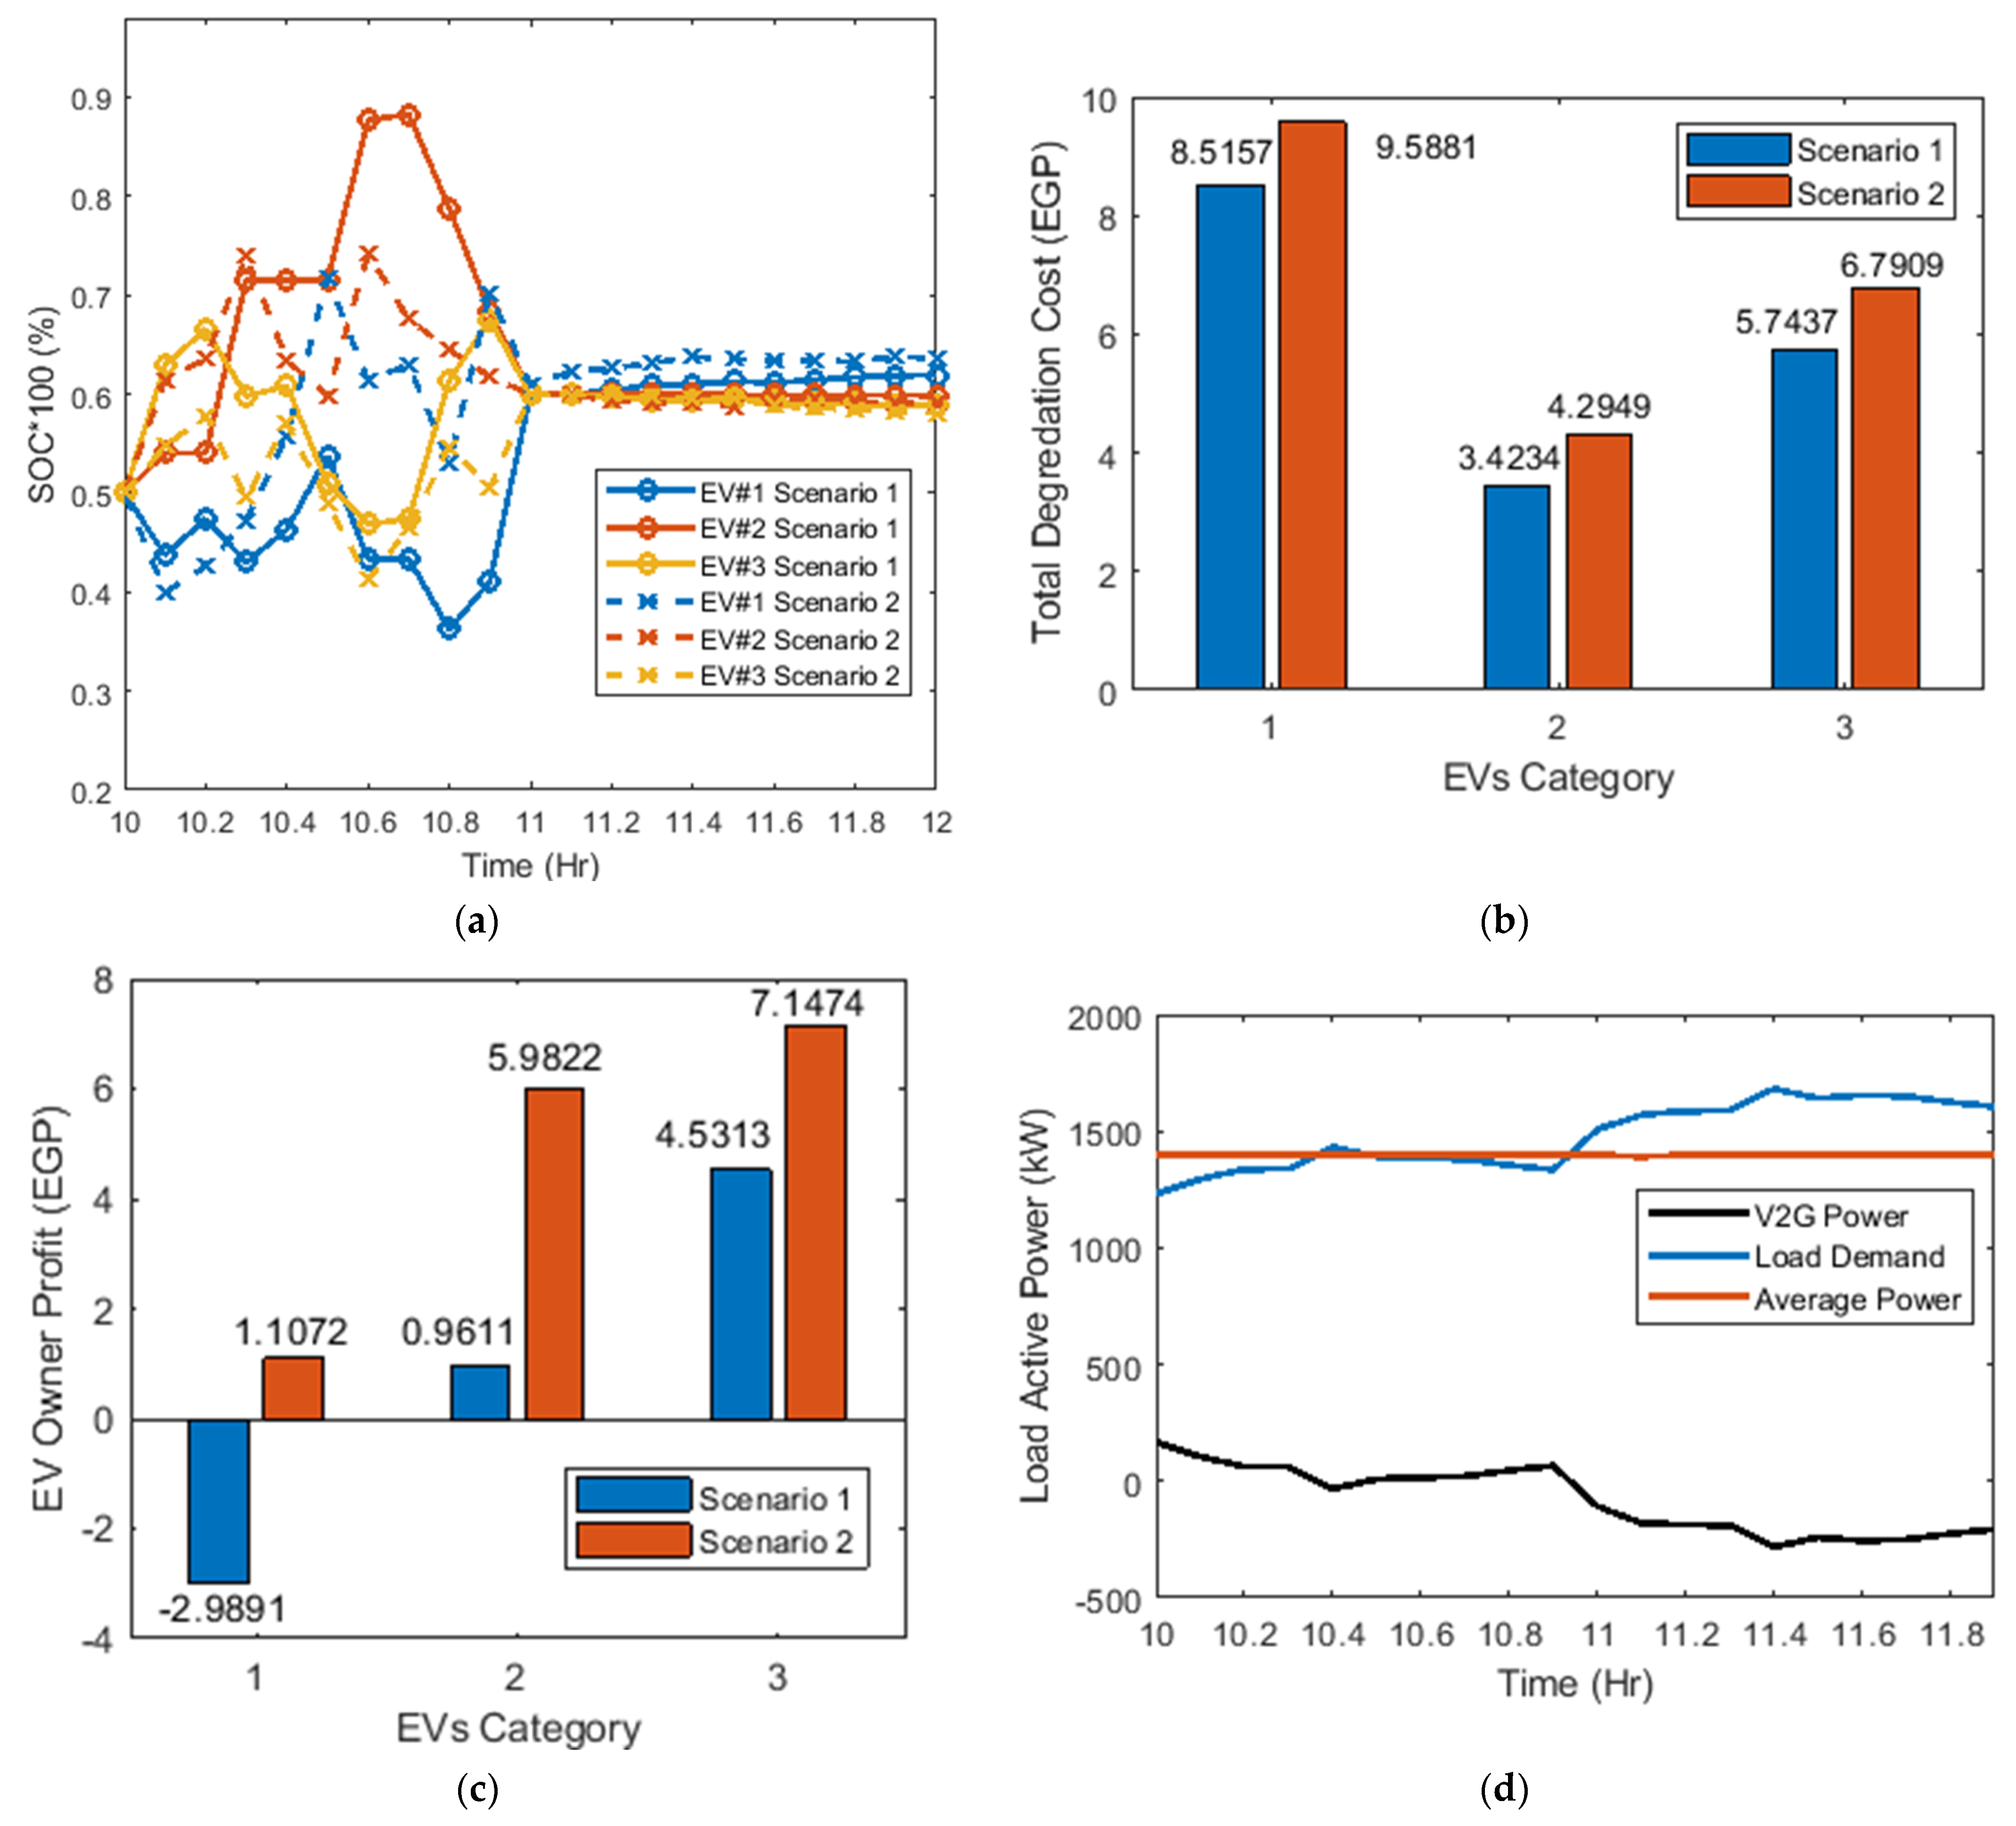
3.2. Case 2: Stochastic Parking for a 2 h Interval Time

In Case 2, we assumed that various numbers of EVs would be stochastically parked for 2 h from 10:00 to 12:00. The model ensured the effectiveness of selecting the appropriate number of EVs and the charging/discharging power for each hour. The target was to shave the peak load demand of the utility grid using the G2V/V2G techniques and the variance of the parked EVs.
The aggregator rule was to select the number of EVs for each category to participate in the V2G/G2V technique while maximizing the SOC and revenue of the EV owner and minimizing the battery degradation cost. The number of EVs, final SOC for each hour, degradation cost and EV owner profit for each hour are expressed in Table 4 and introduced in Figure 6.
A detailed schematic for the EV SOC levels after every 6 min is expressed in Figure 6a. Almost all the EVs reached a capacity of more than 60% for both scenarios while minimizing the degradation cost and maximizing the profit. The battery degradation cost was investigated for each EV category, as shown in Figure 6b. The degradation cost decreased by 11.18%, 20.29% and 15.42% for EV Categories 1, 2, and 3, respectively. However, the revenue for each EV category owner in Scenario 2 was higher than in Scenario 1, as shown in Figure 6c. The load demand of the utility grid was reduced to almost 16.7718% at 11:24 and remained equal to the calculated average required power throughout the day, as shown in Figure 6d.

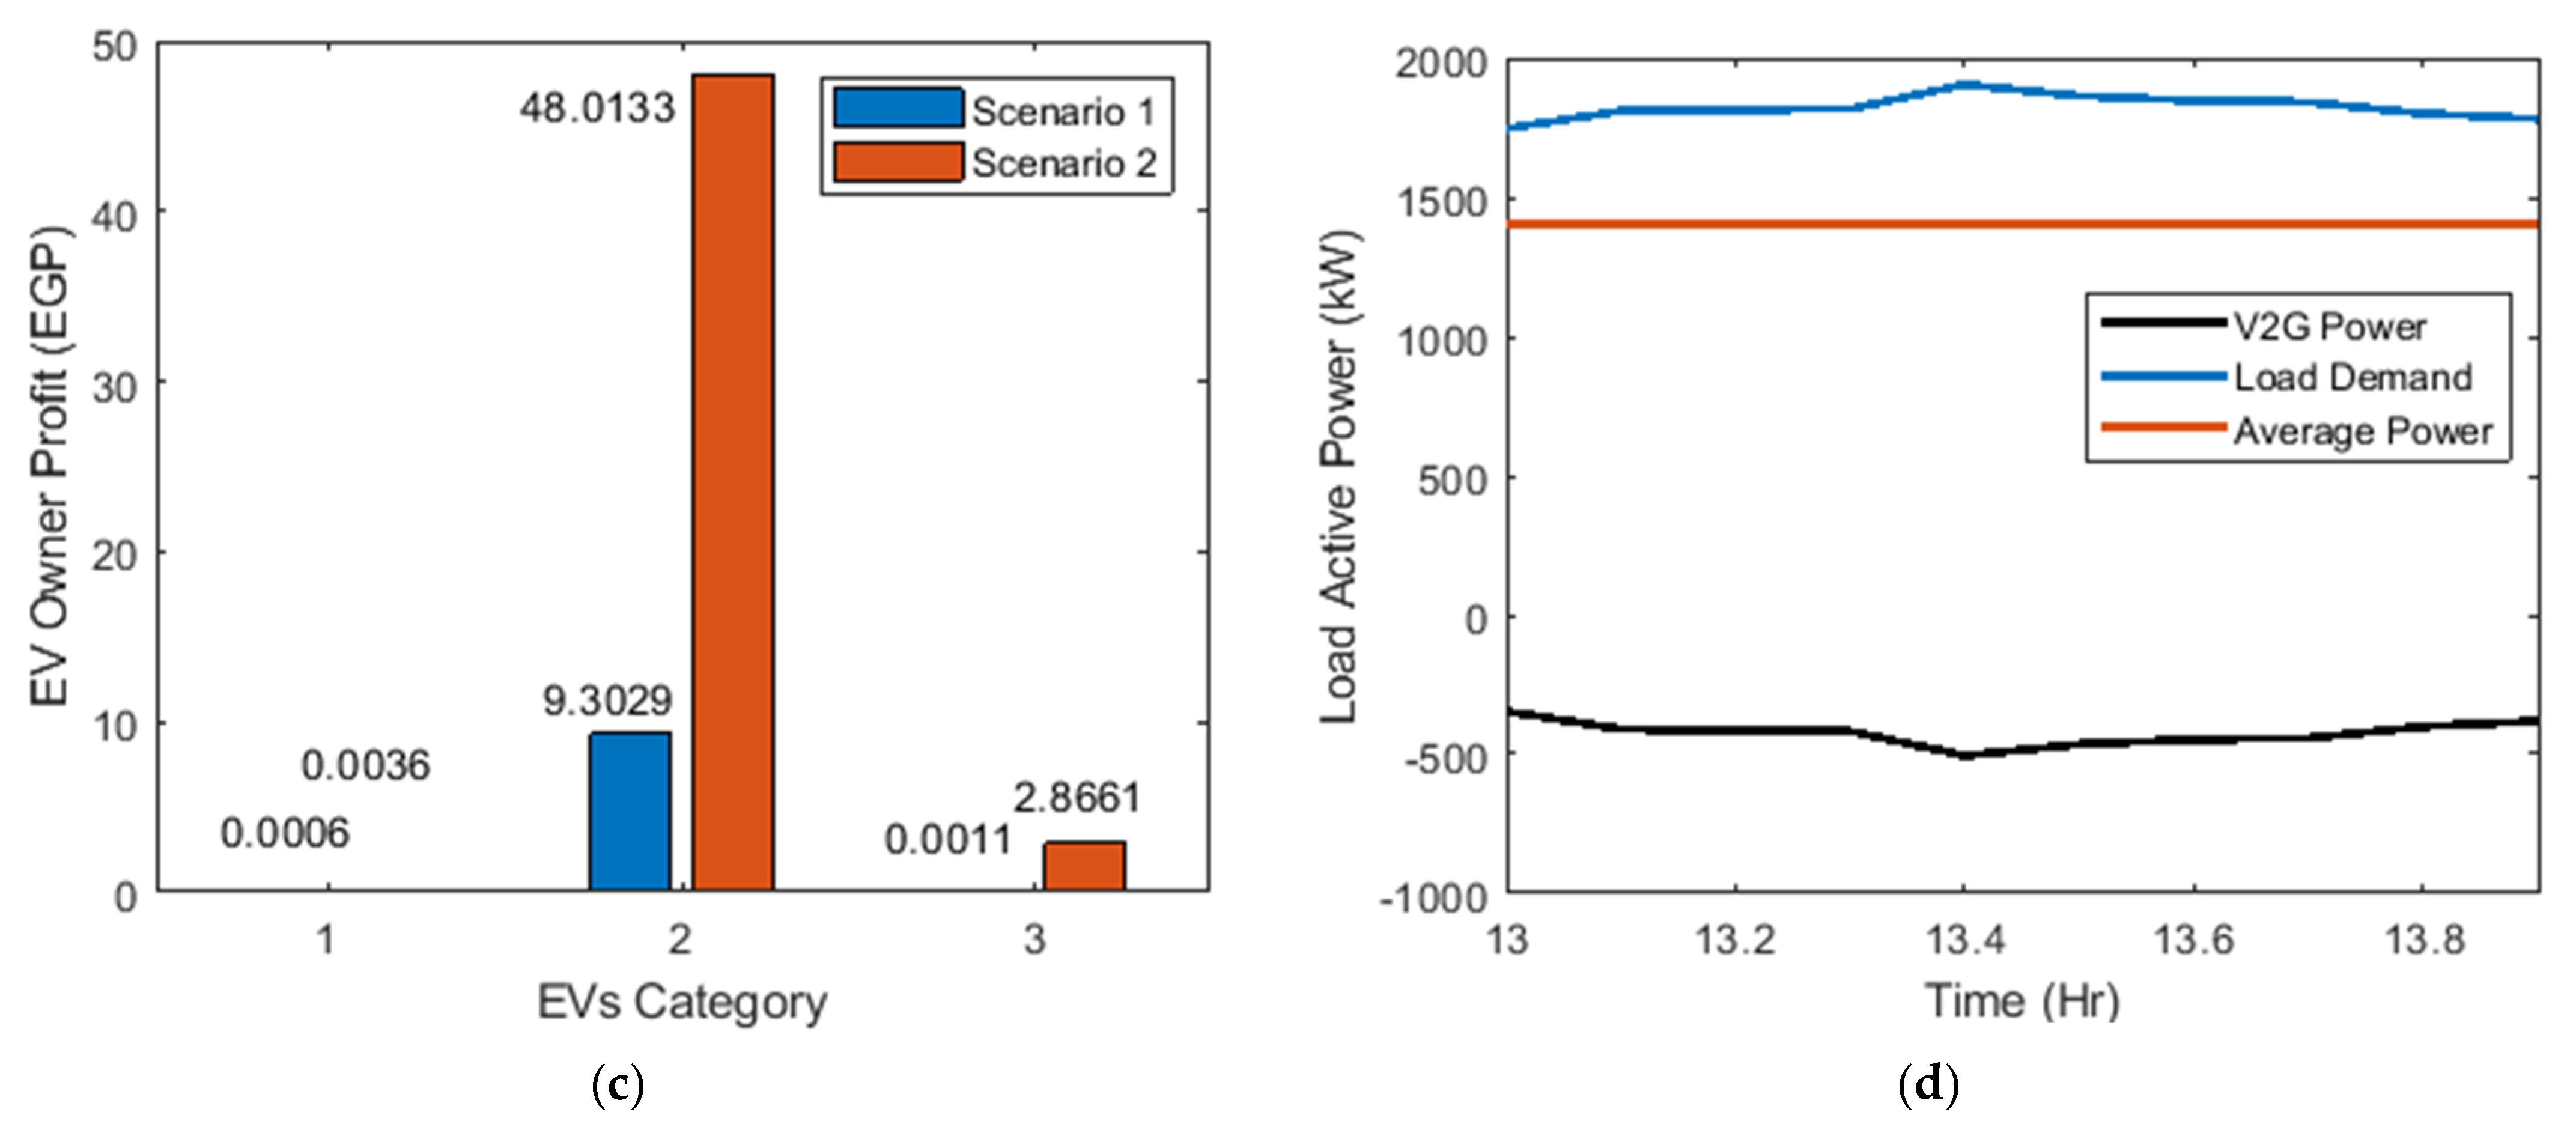
3.3. Case 3: Parking for a 1-h Interval Time

In Case 3, we assumed that all EVs would only park for 1 hr across the day from 13:00 to 14:00. The required EVs for each category to participate are stated in Table 5.
The SOC level is introduced in Figure 7a where EV categories 1 and 3 reached 60% of the SOC. However, EV Category 2 reached 48% of the SOC in Scenario 1 and 41% of the SOC in Scenario 2. The battery degradation cost was investigated for each EV category, as shown in Figure 7b, where the degradation cost decreased by 28.05%, 82.04% and 36.41% for EV Categories 1, 2, and 3, respectively. The profit for each EV category owner is expressed in Figure 7c. It concluded that the EVs would be charged with an incentive revenue from the grid. EV category 2 discharged by approx. 2% and 9% for Scenario 1 and Scenario 2, respectively, while showing a profit of 9.3029 EGP and 48.0133 EGP, respectively, to compensate for the power deficiency in the utility grid. Figure 7d reveals the effectiveness of the GA in tracing the aggregator’s constrained objective function to minimize the load demand to 1400 kW where the power reduction reached approx. 26.5%.
The stated cases charged the EVs with minimum battery degradation cost and maximum EV owner revenue, and minimized the peak load profile to the required average power of the utility grid throughout the day. In addition, the results obtained in this paper ensure the applicability for utilizing the proposed methodology for any EVs models, specifications and brands.

4. Conclusions

In this paper, a novel and robust central aggregator hierarchical optimization algorithm based on the genetic algorithm (GA) was implemented and investigated. The proposed model minimized the battery degradation cost and maximized the EV owner profit by selecting the number of EVs that would participate in the V2G and G2V technologies to shave the load demand of the grid. Two scenarios were stated. The first scenario combined the degradation effect while the second scenario ignored the degradation cost of the battery. Three types of EV categories were assumed to penetrate the grid. The battery degradation cost for each EV category was minimized by 40.93%, 44.18% and 42.544% in the first case, 11.18%, 20.29% and 15.42% in the second case and 28.05%, 82.04% and 36.41% in the third case. However, the EV owner profit in Scenario 1 decreased with respect to Scenario 2. The model effectively minimized the load demand to reach the average power of the utility grid throughout the day. In future research, the methodology will further extend to using the reactive power to stabilize the deficiency of the utility grid. Therefore, the performance of the GA would be compared to the other optimization algorithms to obtain effective fitness functions and corresponding constraints.

Author Contributions

Conceptualization, P.M., H.A.G., S.M. and F.D.; methodology, P.M., H.A.G., S.M. and F.D.; software, P.M.; validation, P.M., H.A.G., S.M. and F.D.; formal analysis, P.M., H.A.G., S.M. and F.D.; investigation, P.M., H.A.G., S.M. and F.D.; resources, P.M., H.A.G., S.M. and F.D.; data curation, P.M., H.A.G., S.M. and F.D.; writing—original draft preparation, P.M.; writing—review and editing, H.A.G., S.M. and F.D.; visualization, P.M., H.A.G., S.M. and F.D.; supervision, H.A.G., S.M. and F.D.; project administration, H.A.G., S.M. and F.D. All authors have read and agreed to the published version of the manuscript.

Funding

This research received no external funding.

Institutional Review Board Statement

Not applicable.

Informed Consent Statement

Not applicable.

Data Availability Statement

Not applicable.

Acknowledgments

This work was supported by the Faculty of Engineering, Electrical Engineering Department, British University in Egypt (BUE) and the Division of Electrical and Electronic Engineering, London South Bank University (LSBU).

Conflicts of Interest

The authors declare no conflict of interest.

Nomenclature

BEMSBattery Energy Management System S O C i Initial State of Charge
EVCSElectric Vehicle Charging Station S O C f Final State of Charge
G2VGrid-to-Vehicle N c l EV Battery Life Span Charging/Discharging Cycles
GAGenetec Algorithm α , β Coefficients of Battery Specifications
MILPMixed-integer Linear Programming d Depth of Discharge
PEVsPlug-in Electric Vehicles E c m a x Maximum Battery Capacity (kWh)
SOCState of Charge Ψ c B C Price of the Battery (EGP)
V2BVehicle-to-Building c Category of EV
V2GVehicle-to-Grid t Parking Interval Time
V2VVehicle-to-Vehicle η D Discharging Efficiency (%)
P t c G 2 V EV Charging Power (kW) D O D Maximum Depth of the Discharge in each segment
Ψ t c T C _ G 2 V EV Charging Tariff Cost (EGP/kWh) a 0 Polynomial Coefficient of the Cycle Depth Degradation Function
Ψ t c R C _ V 2 G EV Owner Discharging Revenue Cost (EGP/kWh) P t c V 2 G Discharging Power (kW)
ε Switching Binary Number 1 or 0 T P s e t Set of Parking Time Slots (h)

References

  1. Lopes, J.A.P.; Soares, F.J.; Almeida, P.M.R. Integration of electric vehicles in the electric power system. Proc. IEEE 2010, 99, 168–183. [Google Scholar] [CrossRef] [Green Version]
  2. Bibak, B.; Tekiner-Moğulkoç, H. A comprehensive analysis of Vehicle to Grid (V2G) systems and scholarly literature on the application of such systems. Renew. Energy Focus 2021, 36, 1–20. [Google Scholar] [CrossRef]
  3. Zhou, Y.; Li, X. Vehicle to grid technology: A review. In Proceedings of the 2015 34th Chinese Control Conference (CCC), Hangzhou, China, 28–30 July 2015; pp. 9031–9036. [Google Scholar]
  4. Yu, H.; Niu, S.; Shang, Y.; Shao, Z.; Jia, Y.; Jian, L. Electric vehicles integration and vehicle-to-grid operation in active distribution grids: A comprehensive review on power architectures, grid connection standards and typical applications. Renew. Sustain. Energy Rev. 2022, 168, 112812. [Google Scholar] [CrossRef]
  5. Zhang, R.; Cheng, X.; Yang, L. Flexible energy management protocol for cooperative EV-to-EV charging. IEEE Trans. Intell. Transp. Syst. 2018, 20, 172–184. [Google Scholar] [CrossRef] [Green Version]
  6. Sovacool, B.K.; Hirsh, R.F. Beyond batteries: An examination of the benefits and barriers to plug-in hybrid electric vehicles (PHEVs) and a vehicle-to-grid (V2G) transition. Energy Policy 2009, 37, 1095–1103. [Google Scholar] [CrossRef]
  7. Rezaei, P.; Frolik, J.; Hines, P.D. Packetized plug-in electric vehicle charge management. IEEE Trans. Smart Grid 2014, 5, 642–650. [Google Scholar] [CrossRef]
  8. Hu, J.; You, S.; Lind, M.; Østergaard, J. Coordinated charging of electric vehicles for congestion prevention in the distribution grid. IEEE Trans. Smart Grid 2013, 5, 703–711. [Google Scholar] [CrossRef] [Green Version]
  9. Makeen, P.; Ghali, H.A.; Memon, S. A Review of Various Fast Charging Power and Thermal Protocols for Electric Vehicles Represented by Lithium-Ion Battery Systems. Future Transp. 2022, 2, 281–301. [Google Scholar] [CrossRef]
  10. Makeen, P.; Ghali, H.A.; Memon, S. Experimental and theoretical analysis of the fast charging polymer lithium-ion battery based on Cuckoo Optimization Algorithm (COA). IEEE Access 2020, 8, 140486–140496. [Google Scholar] [CrossRef]
  11. Makeen, P.; Ghali, H.A.; Memon, S.; Duan, F. Impacts of electric vehicle fast charging under dynamic temperature and humidity: Experimental and theoretically validated model analyses. Energy 2022, 261, 125335. [Google Scholar] [CrossRef]
  12. Liu, S.; Etemadi, A.H. A dynamic stochastic optimization for recharging plug-in electric vehicles. IEEE Trans. Smart Grid 2017, 9, 4154–4161. [Google Scholar] [CrossRef]
  13. Makeen, P.; Ghali, H.A.; Memon, S.; Duan, F. Smart techno-economic operation of electric vehicle charging station in Egypt. Energy 2022, 264, 126151. [Google Scholar] [CrossRef]
  14. Castillo-Calzadilla, T.; Alonso-Vicario, A.; Borges, C.E.; Martin, C. E-Mobility in Positive Energy Districts. Buildings 2022, 12, 264. [Google Scholar] [CrossRef]
  15. Saber, H.; Ranjbar, H.; Fattaheian-Dehkordi, S.; Moeini-Aghtaie, M.; Ehsan, M.; Shahidehpour, M. Transactive Energy Management of V2G-Capable Electric Vehicles in Residential Buildings: An MILP Approach. IEEE Trans. Sustain. Energy 2022, 13, 1734–1743. [Google Scholar] [CrossRef]
  16. Vignali, R.; Falsone, A.; Ruiz, F.; Gruosso, G. Towards a comprehensive framework for V2G optimal operation in presence of uncertainty. Sustain. Energy Grids Netw. 2022, 31, 100740. [Google Scholar] [CrossRef]
  17. Wei, H.; Zhang, Y.; Wang, Y.; Hua, W.; Jing, R.; Zhou, Y. Planning integrated energy systems coupling V2G as a flexible storage. Energy 2022, 239, 122215. [Google Scholar] [CrossRef]
  18. Badawy, M.O.; Sozer, Y. Power flow management of a grid tied PV-battery system for electric vehicles charging. IEEE Trans. Ind. Appl. 2016, 53, 1347–1357. [Google Scholar] [CrossRef]
  19. Wang, Z.; Jochem, P.; Fichtner, W. A scenario-based stochastic optimization model for charging scheduling of electric vehicles under uncertainties of vehicle availability and charging demand. J. Clean. Prod. 2020, 254, 119886. [Google Scholar] [CrossRef]
  20. Ginigeme, K.; Wang, Z. Distributed optimal vehicle-to-grid approaches with consideration of battery degradation cost under real-time pricing. IEEE Access 2020, 8, 5225–5235. [Google Scholar] [CrossRef]
  21. Xu, B.; Zhao, J.; Zheng, T.; Litvinov, E.; Kirschen, D.S. Factoring the cycle aging cost of batteries participating in electricity markets. IEEE Trans. Power Syst. 2017, 33, 2248–2259. [Google Scholar] [CrossRef]
  22. Farzin, H.; Fotuhi-Firuzabad, M.; Moeini-Aghtaie, M. A practical scheme to involve degradation cost of lithium-ion batteries in vehicle-to-grid applications. Ieee Trans. Sustain. Energy 2016, 7, 1730–1738. [Google Scholar] [CrossRef]
  23. ur Rehman, U. A robust vehicle to grid aggregation framework for electric vehicles charging cost minimization and for smart grid regulation. Int. J. Electr. Power Energy Syst. 2022, 140, 108090. [Google Scholar] [CrossRef]
  24. Zeynali, S.; Rostami, N.; Ahmadian, A.; Elkamel, A. Stochastic energy management of an electricity retailer with a novel plug-in electric vehicle-based demand response program and energy storage system: A linearized battery degradation cost model. Sustain. Cities Soc. 2021, 74, 103154. [Google Scholar] [CrossRef]
  25. Amamra, S.-A.; Marco, J. Vehicle-to-grid aggregator to support power grid and reduce electric vehicle charging cost. IEEE Access 2019, 7, 178528–178538. [Google Scholar] [CrossRef]
  26. Zheng, Y.; Shao, Z.; Lei, X.; Shi, Y.; Jian, L. The economic analysis of electric vehicle aggregators participating in energy and regulation markets considering battery degradation. J. Energy Storage 2022, 45, 103770. [Google Scholar] [CrossRef]
  27. Ministry of Electricity and Energy Company in Egypt. Ministry of Electricity and Energy Company in Egypt. 2022. Available online: http://moee.gov.eg/ (accessed on 15 October 2022).
  28. NERA. Electric Feeding Tariff; Ministry of Electricity and Renewable Energy: Cairo, Egypt, 2022.
  29. Michalewicz, Z.; Schoenauer, M. Evolutionary algorithms for constrained parameter optimization problems. Evol. Comput. 1996, 4, 1–32. [Google Scholar] [CrossRef]
  30. Lü, X.; Wu, Y.; Lian, J.; Zhang, Y.; Chen, C.; Wang, P.; Meng, L. Energy management of hybrid electric vehicles: A review of energy optimization of fuel cell hybrid power system based on genetic algorithm. Energy Convers. Manag. 2020, 205, 112474. [Google Scholar] [CrossRef]
  31. Kuendee, P.; Janjarassuk, U. A comparative study of mixed-integer linear programming and genetic algorithms for solving binary problems. In Proceedings of the 2018 5th International Conference on Industrial Engineering and Applications (ICIEA), Singapore, 26–28 April 2018; pp. 284–288. [Google Scholar]
  32. Radwan, A.A.; Zaki Diab, A.A.; Elsayed, A.-H.M.; Haes Alhelou, H.; Siano, P. Active distribution network modeling for enhancing sustainable power system performance; a case study in Egypt. Sustainability 2020, 12, 8991. [Google Scholar] [CrossRef]
  33. Tolba, M.A.; Rezk, H.; Tulsky, V.; Diab, A.A.Z.; Abdelaziz, A.Y.; Vanin, A. Impact of optimum allocation of renewable distributed generations on distribution networks based on different optimization algorithms. Energies 2018, 11, 245. [Google Scholar] [CrossRef]
Figure 1. Operational V2G/G2V time across the day.
Sustainability 15 01283 g001
Figure 2. Relationship between the charging/discharging cycles and the battery degradation depths (BDDs) during their life span [25].
Sustainability 15 01283 g002
Figure 3. Complete flowchart architecture of the proposed aggregator methodology.
Sustainability 15 01283 g003
Figure 4. Load active power demand across the day without EVs penetration.
Sustainability 15 01283 g004
Figure 5. Framework outputs while continuously parking for a 2 h interval time for both scenarios (a) state of charge levels of all EV categories, (b) total degradation cost, (c) EV owner revenue from the V2G technology and (d) resultant load profile.
Sustainability 15 01283 g005aSustainability 15 01283 g005b
Figure 6. Framework outputs while stochastic parking for a 2 h interval time for both scenarios (a) state of charge levels of all EV categories, (b) total degradation cost, (c) EV owner revenue from the V2G technology and (d) resultant load profile.
Sustainability 15 01283 g006
Figure 7. Framework outputs while parking for 1 h interval time for both scenarios (a) state of charge levels of all EV categories, (b) total degradation cost, (c) EV owner revenue from the V2G technology and (d) resultant load profile.
Sustainability 15 01283 g007aSustainability 15 01283 g007b
Table 1. A glancing overview of the literature survey.
Refs.Battery Degradation CostV2G RevenueOptimization Algorithm (OA)Battery Degradation Cost without Using the OABattery Degradation Cost Using the OA S O C i S O C f Number of EVsFindings Brief
[23]Nonlinear Programming (NLP)0.4970 $/day0.4347 $/day≈40%80%1050
  • The system either uses EV in the V2G mode to regulate the grid or charges it according to the owner’s request.
  • The optimization is proposed across the day (24 h).
[24]XMixed-Integer Linear Problem (MILP)135.02 $/day6.36 $/day≈25%≈35%400
  • The proposed system is supported by a battery energy storage system (BESS).
  • The linearized BESS degradation cost is presented in this row.
  • The optimization is proposed across the day (24 h).
[22]Mixed-Integer Linear Problem (MILP)N/A0.834, 1.119, 2.477 and 2.146 $/kWh70%100%N/A
  • The degradation cost varies based on the charging time across the day at 10:00, 14:00, 18:00 and 22:00.
  • The charging period is assumed to be 14 h.
N/A0.834, 0.834, 1.119 and 1.811 $/kWh70%100%N/A
  • The degradation cost varies based on the charging duration of 6, 8, 10 and 12 h.
  • The charging period is assumed to be 14 h.
[20]CVX39 $/day23 $/dayN/AN/A100
  • This approach can reduce the peak demand by 7.8%.
  • However, the degradation cost increased from 28 $ to 86 $ based on the scenario used.
[25]Nonlinear Programming (NLP)0.4969 $/day0.4348 $/day≈40%80%1000
  • The system introduced day-ahead scheduling for EVs.
  • The system’s objectives have been verified on real-time UK National Grid regulation data.
[26]Generalized Reduced Gradient (GRG)N/A168.18 $/day20–50%80%1000
  • EV aggregators can charge the EVs during the valley periods and discharge during peak periods.
  • The New York market has been taken as the case study for the economic evaluation.
Table 2. EVs specifications [23,25].
EVCategoryRated Battery Capacity (kWh)Battery Cost per kWh (LE/kWh)
EV_1Nissan Leaf (2020)404837.89
EV_2Tesla Model S (p100d)1003677.58
EV_3Mustang Mach-E684051.24
Table 3. Case 1 summary output.
Scenario 1
Time: 10:00 to 12:00
Scenario 2
Time: 10:00 to 12:00
Number of EVs (EVs)
EV_1814
EV_2362272
EV_3111
Final SOC (%)
EV_177.77%61.31%
EV_249.15%48.84%
EV_358.01%52.36%
Degradation Cost (EGP)
EV_10.9765 EGP1.6530 EGP
EV_20.0877 EGP0.1571 EGP
EV_30.6658 EGP1.1588 EGP
EV owner Profit (EGP)
EV_1−34.2 EGP−8.8 EGP
EV_24.589 EGP6.79 EGP
EV_3−14.9 EGP4.429 EGP
Table 4. Case 2 summary output.
Scenario 1Scenario 2
Time: 10:00 to 11:00Time: 11:00 to 12:00Time: 10:00 to 11:00Time: 11:00 to 12:00
Number of EVs (EVs)
EV_13323
EV_21510142
EV_321862148
Final SOC (%)
EV_159.99%61.92%61.02%63.6%
EV_260.01%59.85%59.99%59.09%
EV_359.99%58.81%59.99%58.06%
Degradation Cost (EGP)
EV_18.5 EGP0.0158 EGP9.4623 EGP0.1258 EGP
EV_23.3875 EGP0.0359 EGP4.0179 EGP0.277 EGP
EV_35.4939 EGP0.2498 EGP6.4311 EGP0.3598 EGP
EV owner Profit (EGP)
EV_10−2.9891 EGP4.8152 EGP−3.708 EGP
EV_200.9611 EGP0.0528 EGP5.9294 EGP
EV_304.5313 EGP0.0235 EGP7.1238 EGP
Table 5. Number of EVs that participated in Case 3.
Scenario 1Scenario 2
Time: 13:00 to 14:00Time: 13:00 to 14:00
Number of EVs (EVs)
EV_111
EV_227752
EV_331
Final SOC (%)
EV_160.23%60.33%
EV_248.26%41.01%
EV_360.39%63.78%
Degradation Cost (EGP)
EV_14.6919 EGP6.5213 EGP
EV_20.3471 EGP1.9322 EGP
EV_34.9929 EGP7.8514 EGP
EV owner Profit (EGP)
EV_10.0006 EGP0.0036 EGP
EV_29.3029 EGP48.0133 EGP
EV_30.0011 EGP2.8661 EGP
Disclaimer/Publisher’s Note: The statements, opinions and data contained in all publications are solely those of the individual author(s) and contributor(s) and not of MDPI and/or the editor(s). MDPI and/or the editor(s) disclaim responsibility for any injury to people or property resulting from any ideas, methods, instructions or products referred to in the content.

