Article

Walking for Sustainable Cities: Factors Affecting Users’ Willingness to Walk

by
Natalia Distefano
,
Salvatore Leonardi
* and
Nilda Georgina Liotta
Department of Civil Engineering and Architectural, University of Catania, Viale Andrea Doria, 6, 95125 Catania, Italy
*
Author to whom correspondence should be addressed.
Sustainability 2023, 15(7), 5684; https://doi.org/10.3390/su15075684
Submission received: 1 March 2023 / Revised: 21 March 2023 / Accepted: 22 March 2023 / Published: 24 March 2023

Abstract

:
In the context of urban sustainability, promoting pedestrian travel is fundamental. Residents’ needs are critical to creating truly pedestrian-friendly streets. The objective of this study was to answer the following questions: What aspects most increase the willingness of citizens to walk? Is the extent to which these aspects are prioritized related to the context in which citizens move on a daily basis? Two linked surveys, conducted through the institutional website of the Department of Civil Engineering and Architectural of the University of Catania, allowed the inclusion of more than 1000 respondents residing in the metropolitan areas of eastern Sicily. The large database was first reduced using Principal Component Analysis (PCA) and then statistically processed using Path Analysis. Thus, it was found that in the residential areas of the respondents that were not very “pedestrian friendly”, the macro factors of “safety”, “comfort”, and “quality” of pedestrian infrastructures were equally desirable for citizens to adapt to the existing pedestrian routes and thus promote walking. On the other hand, the “attractiveness” of the urban environment as a whole was a non-statistically significant variable for residents’ decision to walk. These results are not valid for every urban context, but the method used is generalizable and applicable in any urban setting. If the quality, safety, and comfort of pedestrian infrastructure results are important, urban planning should prioritize the provision of safe and accessible sidewalks, crosswalks, and pedestrian streets. Furthermore, if the attractiveness of a neighborhood result is significant, urban design and planning should go beyond functional requirements and also focus on creating a vibrant and livable urban environment.

1. Introduction

The current challenges faced by cities in meeting their sustainability goals and combating the climate crisis have necessitated a paradigm shift in urban mobility toward active transportation. As a result, cities around the world are investing in infrastructure measures to promote pedestrian-friendly urban areas.
Improving the walkability of cities has been proposed as a means of achieving these goals. Walking is a nearly universal human activity that provides mobility, exercise, and pleasure. Walking involves zero emission of any greenhouse gas, it is free, and as an additional plus, it is a good form of exercise for the body. Walkability, instead, can be defined as any urban planning- and design-related factor that affects people’s propensity to walk. The rationale is that a more pedestrian-friendly environment can positively influence walking behavior by increasing pedestrian activity and thus encouraging more people to walk more. In fact, walking has been associated with numerous social, health, and economic benefits, as it is the most basic means for people to get around, integrate and experience urban space, and engage in health-enhancing physical activity. The scientific literature has found that various aspects of the street affect walking volume. Several studies have shown that the built environment plays a critical role in promoting or hindering walking. For example, high-quality sidewalks have a positive influence on the willingness to walk [1]. A study based on a method to determine pedestrian satisfaction with a set of characteristics that influence the safety and walkability of sidewalks found that physical separation from traffic, sidewalk width, sidewalk continuity, and sidewalk cleanliness are the most important characteristics of sidewalks [2].
To encourage walking, it is undoubtedly necessary to create pedestrian-friendly streets [3]. A pedestrian-friendly street is one that meets the needs of its users through the quality of the built environment in terms of physical and functional features, safety, and social aspects. However, the effectiveness of a pedestrian- friendly street depends heavily on how users perceive its physical and functional elements [4]. There are several aspects that can positively or negatively affect the perception of the effectiveness of urban streets in promoting walking, such as the quality and quantity of equipment and measures to promote amateur sports [5], the presence of measures to reduce acoustic and atmospheric pollutants generated by road vehicles [6], and the adoption of criteria to improve the aesthetic and livability qualities of public and/or green spaces [7]. Therefore, the interrelationships between all of these aspects are critical to achieving good results from a pedestrian-friendly street in terms of pedestrian volume growth.
Some studies have attempted to understand why pedestrians have different perceptions that influence their walking experience under similar pedestrian path conditions [8,9]. Studies of pedestrian perceptions on urban streets are extremely important because they provide decision makers with useful information about what people think of streets; i.e., are people more willing to walk when the street is clean, when the sidewalk condition is good, or when vehicles travel at moderate speeds? An individual’s perception is the result of the interplay between his or her past experiences and culture [10]. In determining the factors that positively influence users’ willingness to walk, neglecting cultural characteristics can lead to the establishment of ineffective policies, as the experiences associated with walking are deeply embedded in certain cultural traditions and depend on specific historical and geographic contexts [11].
More recently, studies have found that users’ willingness to walk is influenced not only by objective elements but also by subjective aspects and the perceived suitability and ease of walking [12,13].
An empirical approach to the subjective understanding of pedestrian friendliness is essential for planners and others involved in the decision-making process to develop a built environment that encourages users to walk. However, in the current literature, there is no consensus on the aspects that encourage users to walk or not. Studies conducted in different countries have come to different conclusions.
It is well known that in countries where the culture of road safety is low and the built environment basically favors vehicular traffic, the willingness of users to walk is low [14]. A study conducted in Valencia and Granada (Spain) found that the main factors that negatively affected the willingness to walk were the feeling of insecurity related to the crime rate, a high density of traffic lights, and having to walk along the main road [15]. In addition, a walkability audit survey in the city center of Serres (Greece) found that people did not want to walk due to poor infrastructure and environmental conditions [16]. A study conducted in India (New Delhi) concluded that the built environment must meet pedestrians’ expectations in a way that makes them feel in control of the street and public space [17]. A study that examined these aspects in Kuala Lumpur (Malaysia) concluded that the reasons for choosing not to walk were due to climate, comfort, and convenience, while the conditions of pedestrian facilities such as cleanliness and good pavement positively influenced the decision to walk. The availability of public transportation also had a positive effect [18].
In countries where the street environment is designed to meet the needs of vulnerable road users (pedestrians, cyclists, etc.), the aspects that most influence pedestrians’ perceptions of the practicality of pedestrian paths are different. The results of a study conducted in the Boston metropolitan area in the U.S. state of Massachusetts suggested that usefulness, sense of belonging, and pleasurability were most important in the hierarchy of pedestrians’ needs [19]. In this context, street furniture also had a greater positive effect on users’ willingness to walk than sidewalk quality [20]. The lack of emphasis on safety and comfort can be understood in the context. In urban areas that are considered safe places and where the street environment has been designed as a comfortable, pedestrian-friendly environment, these aspects seem to be secondary for pedestrians when evaluating walkability.
The literature review shows that more research is needed on pedestrians’ perceptions of the street environment. Indeed, it is necessary to add studies that examine these aspects in different contexts (infrastructural, socioeconomic, and cultural). The present study has exactly this objective. This study investigates the aspects that influence the willingness of road users to walk in an urban area in eastern Sicily (Italy).
Specifically, the questions this study seeks to answer are: What aspects most increase citizens’ willingness to walk? Is the extent to which these aspects are prioritized related to the context in which citizens move on a daily basis?

2. Materials and Methods

This study used two different analytical methods to investigate the relationships between users’ perceptions of different aspects of the built environment and their willingness to walk in an urban area in eastern Sicily, Italy. The results of this research are based on data from two online surveys. Both questionnaires were created ad hoc using Google Forms, applied and published on the DICAr website (the website of the Department of Civil Engineering and Architectural of the University of Catania), and promoted through the social media of the University of Catania. All responses to the questionnaires were anonymous. The first questionnaire was thoroughly tested and revised during some face-to-face interviews with professors and researchers from the University of Catania. This was done to ensure the suitability and understanding of the questions and test the duration of the survey. In the first questionnaire, respondents were asked to rate the influence of certain attributes on their willingness to walk on a five-point Likert scale ranging from 1 (high unwillingness) to 5 (high willingness). The questionnaire consisted of a series of multiple-choice questions divided into two sections. The first section was used to collect personal information such as gender and age. The second section considered all aspects of the built environment (Table 1) that had been examined in numerous previous studies to determine their influence on users’ decision to walk. An example of a question in the questionnaire is: “Does the continuity of the sidewalk affect your choice to walk?” The survey remained online for three months, from March 2022 to May 2022.
A sample of 562 participants responded to the first online questionnaire. Respondents were divided almost equally between males and females, most were between 21 and 35 years old (41.99%), and only a small part of the respondents (15.66%) were elderly.
The second questionnaire was also divided into two parts: the first part, equal to that of the first questionnaire, was related to the characteristics of the respondents. In the second part of the questionnaire, only four questions were asked to the respondents. In particular, respondents were explicitly asked how much each of the 4 factors identified with the PCA increased their willingness to walk. An example of a question is: “Does the road safety affect your choice to walk?” Again, respondents had to use a 5-point Likert scale to answer the questions.
The survey was held on the DICAR website until the number of responses obtained was similar to that of the previous survey (from September to October 2022). There were 521 respondents to the second questionnaire.
Before responders answered the questions, it was made clear that the data collected would be treated in accordance with the legislation on the protection of personal data and in compliance with the Legislative Decree of 30 June 2003 No. 196–Code for the Protection of Personal Data and the General Data Protection Regulation–EU 2016/679 (GDPR).
The factors contained in Table 1 were used as variables in the subsequent data analysis.

Analytical Methods

The investigation was divided into two parts: first it was necessary to define a set of unrelated factors, and then, for each of these factors, it was possible to determine its weight in influencing users’ willingness to walk. For this purpose, principal component analysis (PCA) was combined with path analysis.
The hypothesis underlying this study was that the aspects that emerged as influencing users’ willingness to walk (derived from the literature review) were interdependent. In terms of statistical accuracy, dimensionality reduction and variable selection indeed play a key role in the analysis of high-dimensional data. Moreover, high dimensionality leads to spurious correlations between the response and unrelated covariates, which may lead to erroneous statistical inferences and incorrect scientific conclusions [21]. For this reason, the authors decided to reduce the variables by a technique of reduction in the database containing the data from the survey. For this purpose, different techniques have been used in different scientific fields. For this study, the authors chose principal component analysis (PCA) because it is one of the oldest and most widely used techniques, and it also offers several advantages over other size reduction methods. Some of these advantages are:
Retention of most of the information in the data: PCA aims to retain as much information as possible from the original data while reducing the dimensionality of the problem, thus minimizing the loss of relevant information.
Speed of calculation: PCA is relatively fast compared to other dimension reduction methods, such as linear discriminant analysis (LDA) or factor analysis. This makes PCA suitable for working with large amounts of data.
Ease of interpretation: PCA provides a visual representation of the data in a new coordinate system in which the dimensions are ordered according to their importance. This makes it possible to visualize the relationships between variables and identify hidden patterns in the data.
Reduction of correlation: PCA is able to reduce the correlations between variables, simplifying the problem and making it easier to understand the data.
This meant finding new variables that were linear functions of the variables in the original dataset, maximized variance, and were not intercorrelated [22]. PCA is a mathematical procedure that allows the researcher to reduce the number of correlated variables into a smaller number of components (linear combination of such variables) that are linearly independent and represent a percentage of the total covariance. To determine the number of principal components that explain most of the variation in the data, the cumulative proportion is used to determine the proportion of the variance that the principal components explain using eigenvalues. The first method considers the principal components that explain an acceptable amount of variance.
The second method uses the magnitude of the eigenvalues. The principal components with the largest eigenvalues are retained. The eigenvalues are coefficients that indicate how much of the variance in the original data can be attributed to each principal component. The first eigenvalue indicates the proportion of the variance explained by the first principal component, the second eigenvalue indicates the proportion of the variance explained by the second principal component, and so on. The sum of all eigenvalues is equal to the total variance in the original data. In other words, the sum of the eigenvalues is equal to the number of original variables used in the PCA. The proportion of the variance explained by a principal component is given by the ratio of its eigenvalue to the sum of all eigenvalues. The eigenvalues are also used to determine the number of principal components to be used in the analysis. Typically, only the first few principal components that explain most of the variance in the data are used. For example, when using the Kaiser criterion, only the principal components with eigenvalues greater than 1 are used.
The goal of PCA is to extract the important information from the database, representing it as a set of new orthogonal variables (principal components), and display the similarity pattern of the observations and the variables as points in maps. PCA provides the weights of the individual factors for each identified component and allows visualization of multidimensional datasets in two- or three-dimensional plots with minimal loss of information. The PCA plot, such as the one shown in Figure 1, can be used to visualize similarities and differences within data contained in a large database. In this plot, the distances between variables are compared, with a small distance indicating a strong correlation. This plot can also be used to find clusters of similar variables. Often, principal components are named to assign meaning to them.
Once the principal components were identified, a new survey was conducted. In this second survey, respondents were asked only a few questions. The number of questions corresponded to the number of principal components that emerged from the PCA. The answers to these new questions were used as independent variables to determine their weight on the dependent variable, which was represented by the users’ willingness to walk. To achieve this goal, path analysis was performed.
Path analysis belongs to a more general type of statistical analysis known as structural equation modeling. The distinctive feature of path analysis that distinguishes it from general structural equation modeling is that path analysis is restricted to measured or observed variables and not to latent variables, i.e., those that are not directly observable but are thought to exist and influence the observed variables.
For the purposes of this study, path analysis was considered a particularly appropriate method for the following reasons [23,24,25]:
Ability to test complex causal models: Path analysis allows researchers to test complex models that include multiple variables and pathways. This allows researchers to investigate the direct and indirect effects of variables on each other, which can be useful for understanding the underlying mechanisms of complex phenomena.
Ability to handle multiple dependent variables: Path analysis can be used to simultaneously analyze multiple dependent. This is particularly useful in situations where there are multiple outcomes of interest that are interrelated.
Allows for the inclusion of measurement error: Path analysis can account for measurement error in the variables being studied. This is important because measurement error can lead to biased estimates of the relationships between variables.
Provides a visual representation of the relationships between variables: Path analysis produces a diagram that shows the relationships between variables in the model. This can be useful for communicating the results of the analysis to others and for generating new hypotheses for future research.
Can be used to test alternative hypotheses: Path analysis allows researchers to test alternative hypotheses about the relationships between variables. This can be useful for exploring different theoretical perspectives and comparing the fit of different models to the data.
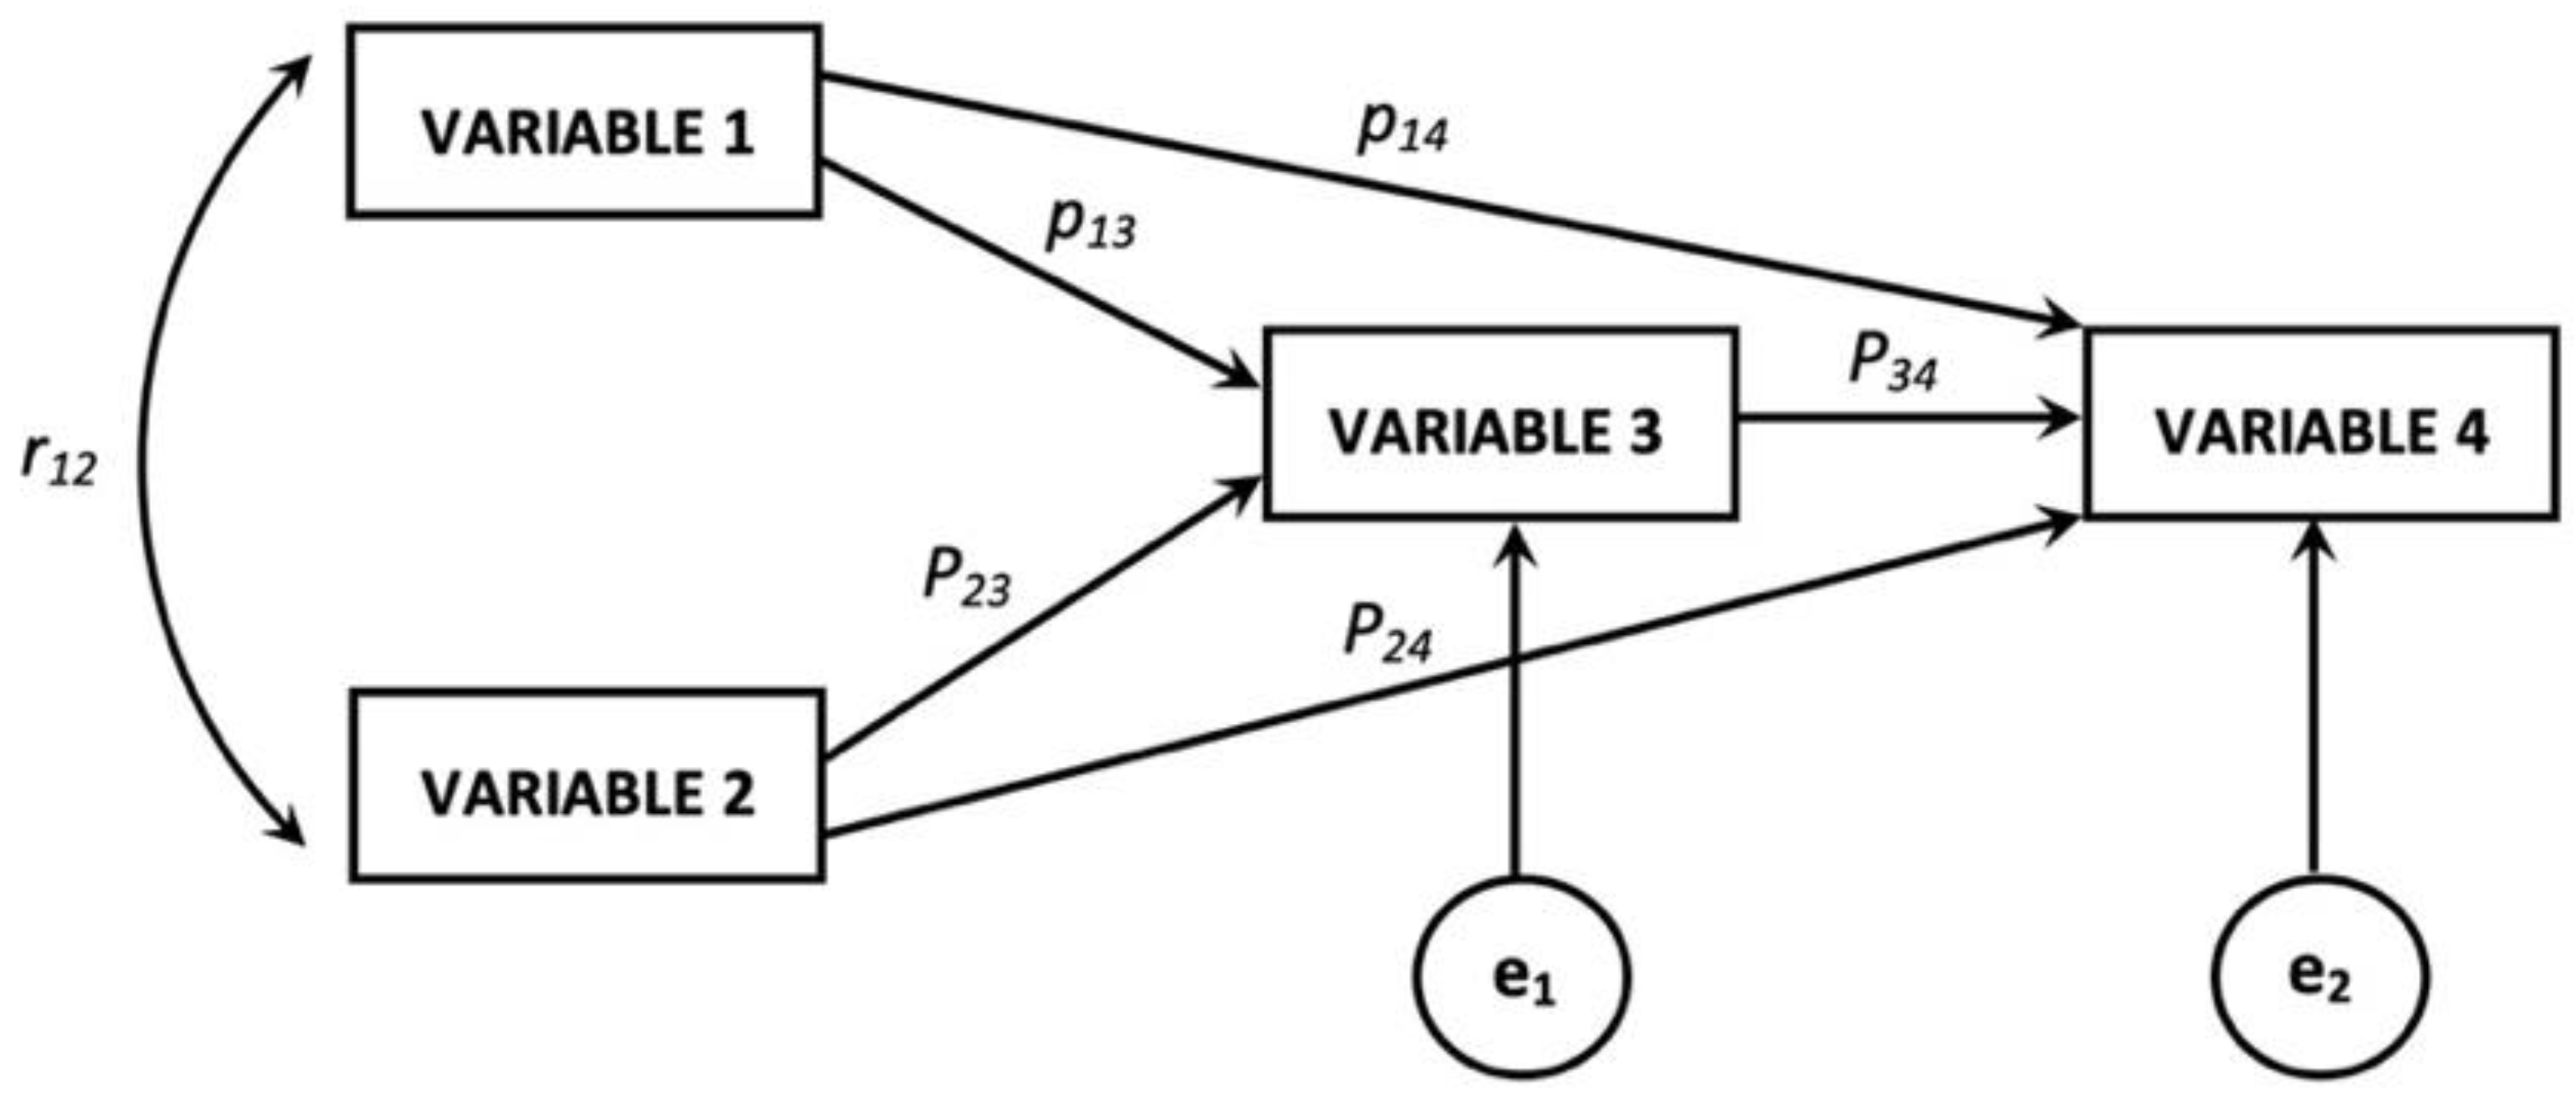
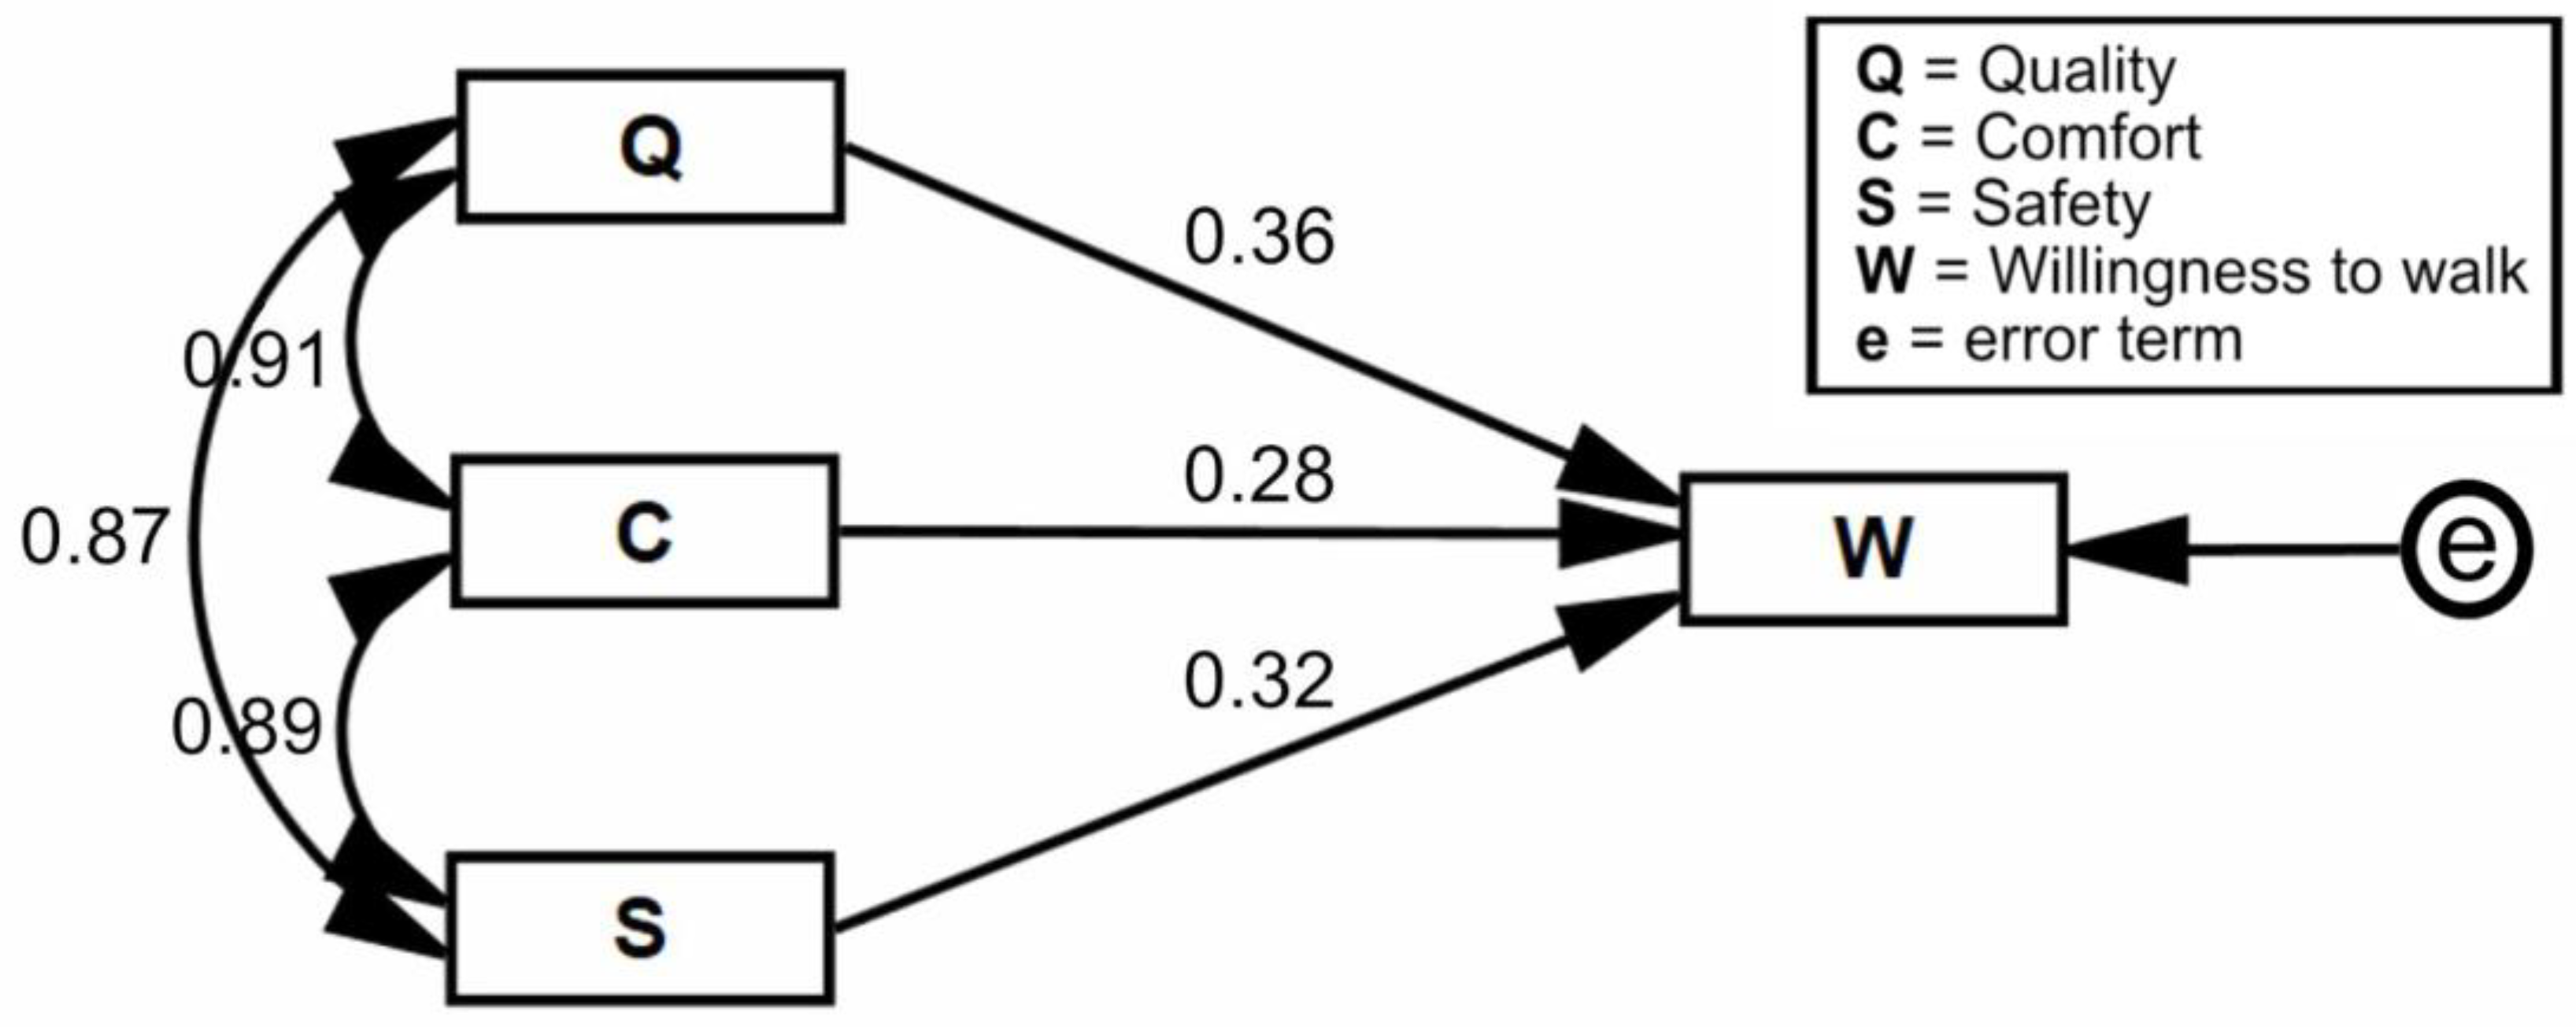
To perform path analysis, a path diagram must be constructed, distinguishing between input and output path diagrams. An input path diagram is drawn by researchers in advance to plan the analysis and represents the causal links predicted by the researchers’ hypothesis. An output path diagram represents the results of a statistical analysis and shows what was actually found as a result of the analysis. Thus, the path diagram is a visual representation of the path model and the results of the path analysis (Figure 2).
In a path diagram, the measured variables are usually represented as squares or rectangles. An arrow with a point (path or direct effect) drawn from one variable to another means that a change in the first variable tends to cause a change in the second variable. Mathematical algorithms will estimate both the magnitude of the effect and its positivity or negativity. A double-headed arrow (correlation in standardized path diagrams) means that the two connected variables are assumed to be associated with one another (positively or negatively) but with no particular cause assumed. With the path diagram, it is possible to graphically represent the relationships that exist between the variables of interest, and with path analysis, it is possible to make a numerical evaluation of these relationships to determine their intensity. The principle of this method is to express the covariances or correlations between two variables as the sum of all the composite paths connecting the two variables through coefficients placed on said paths, called path coefficients. Path analysis thus consists of estimating these coefficients (representing the extent of linear association between variables) and using these estimates to obtain information about an assumed underlying causal process [23,24,25]. The values of the standardized coefficients shown on the arrows of the path diagram can range from −1.0 (perfect negative relationship), 0.0 (no relationship), and 1.0 (perfect positive relationship) and, as with all regression models, represent the standardized relationship between the variables. That is, if variable X has an effect of 0.50 on variable Y, Y increases by 0.50 standard deviations for every standard deviation that X increases. Indirect effects are interpreted by multiplying the coefficients along a path.

3. Results

3.1. Principal Component Analysis

A sample of 562 participants responded to the first online questionnaire. Respondents were divided almost equally between males and females, most were between 21 and 35 years old (41.99%), and only a small part of the respondents (15.66%) were elderly.
PCA was used to reduce the number of aspects that influenced users’ willingness to walk by grouping similar aspects. The partial aim was to group the 25 factors identified by the literature review into a few groups according to their similarities in individual respondents’ evaluations. The initial assumption was that respondents who responded similarly to multiple factors would respond the same way to a single aspect representing all factors. In this way, the number of factors to evaluate would significantly decrease and so the questionnaire might be simplified.
In this study, SPSS software was used to conduct a correlation analysis of the 25 variables (Table 1) using principal component analysis. In order to test the adequacy of the sample size, the Kaiser–Meyer–Olkin (KMO) test and Bartlett’s test of sphericity were applied (Table 2). The tests measured the sampling adequacy for each variable in the model and for the complete model. KMO values vary from 0 to 1. KMO values between 0.8 to 1.0 indicate the sampling is adequate, those between 0.7 to 0.79 are middling, and values between 0.6 to 0.69 are mediocre. KMO values less than 0.6 indicate the sampling is not adequate [19]. For Bartlett’s test of sphericity, a significant value < 0.05 indicates that a factor analysis may be worthwhile for the dataset [26]. Both tests (KMO = 0.872 and Sig = 0) showed that the data sample was adequate for the application of PCA.
Table 3 shows the explained variance and the eigenvalues of the extracted principal components. Considering the components that had an eigenvalue greater than 1 to be significant, PCA extracted 6 significant components, accounting for 73% of the overall variance (Table 3). Table 4 shows the correlation matrix.
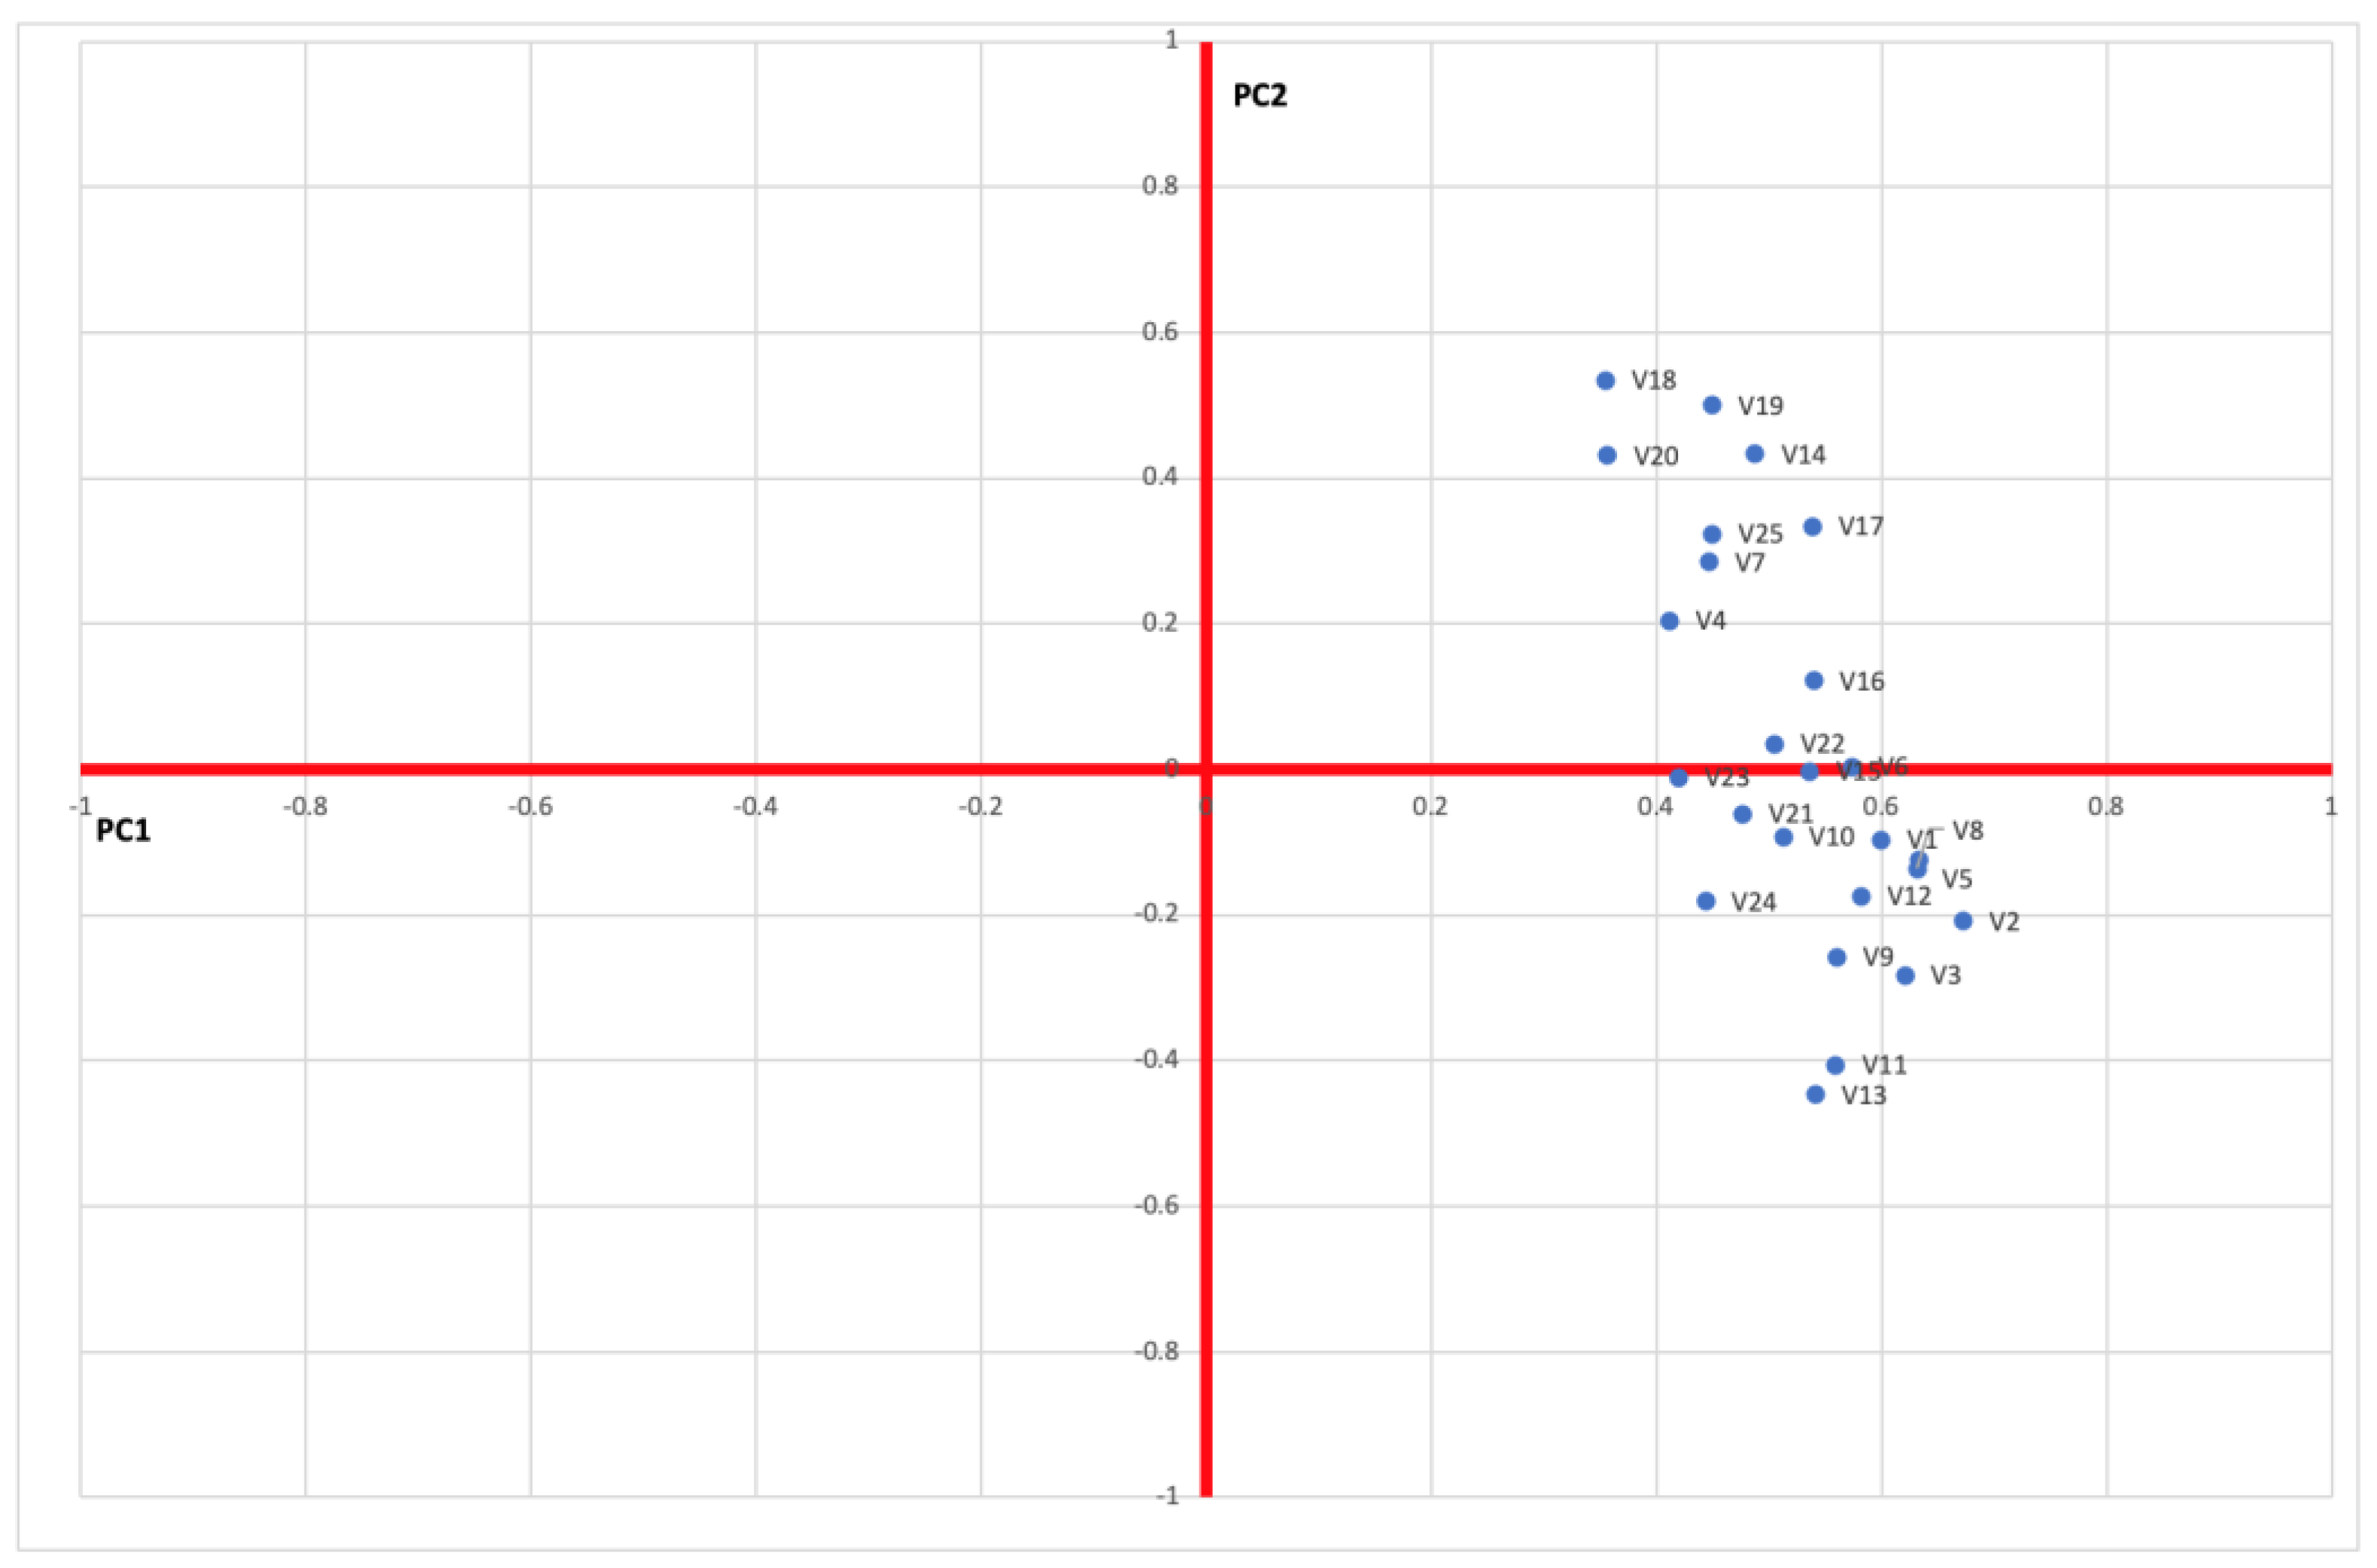
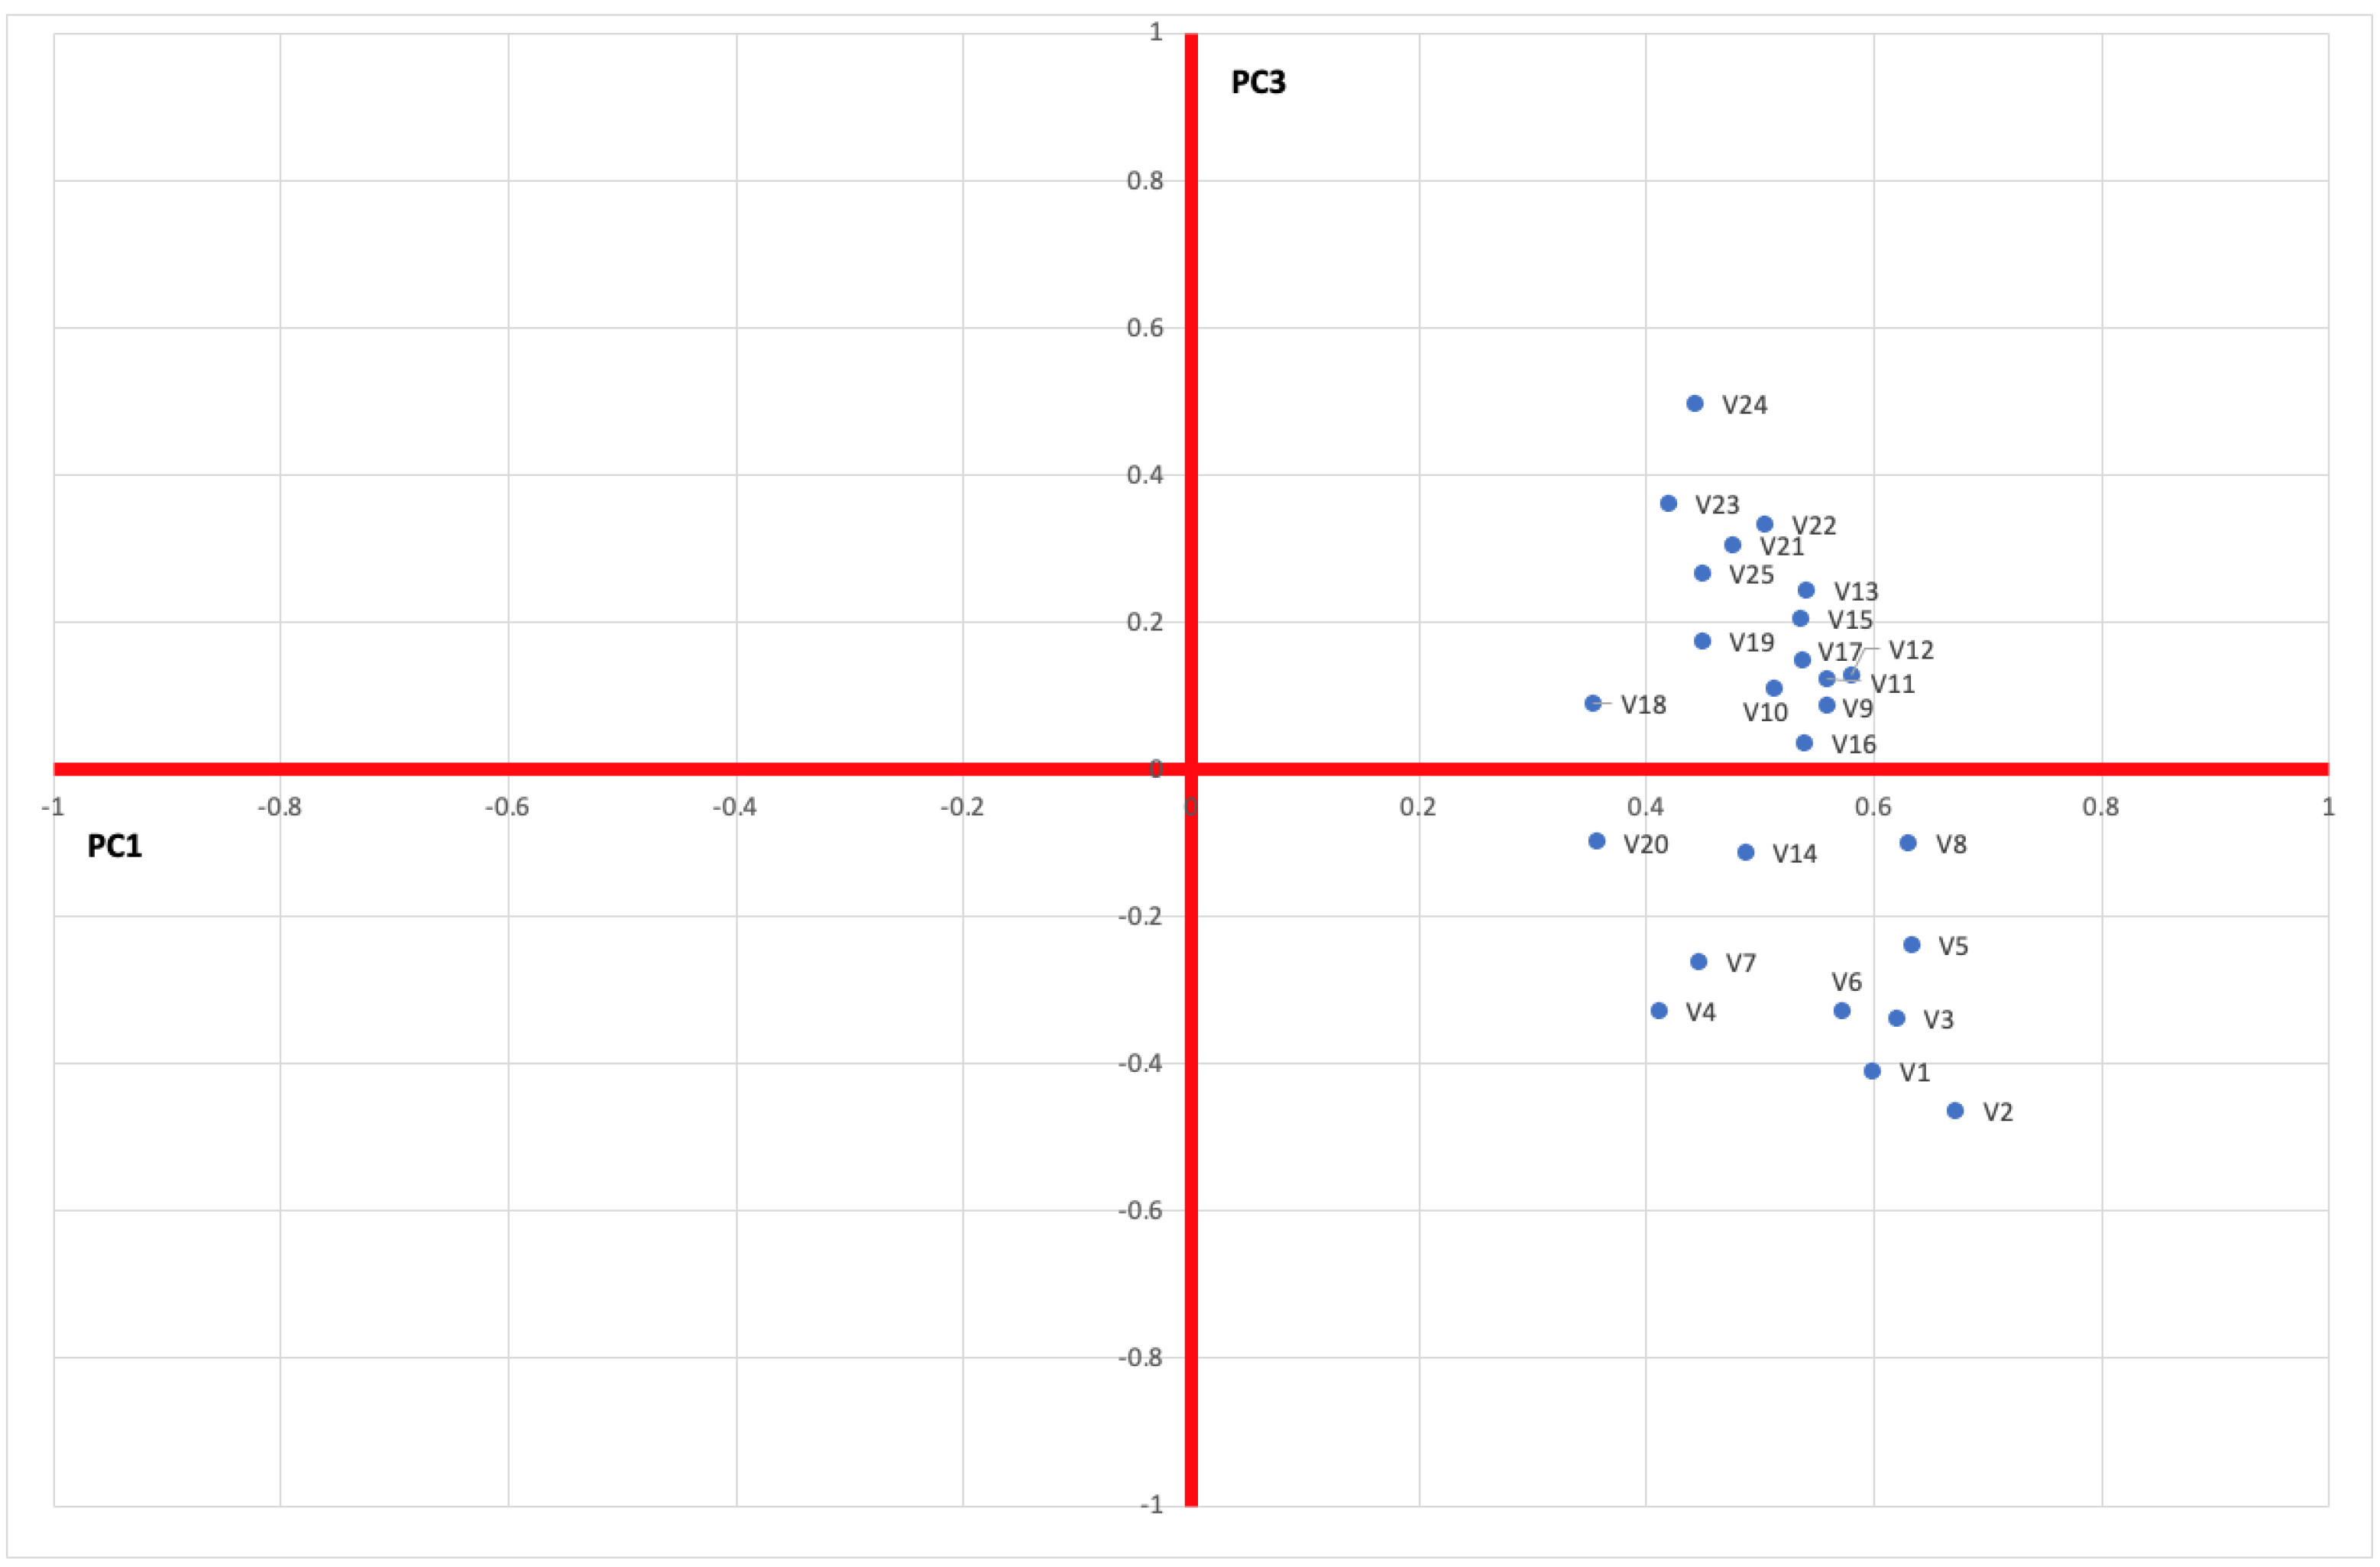
The first principal component explained the maximum amount of variation (32.3%). Other principal components contributed 14.76%, 9.95%, 6.99%, 5.03%, and 3.68% towards the variation explained among the factors, respectively (Table 2). Furthermore, Table 3 shows that the weights of each factor on each principal component were high in the first three principal components, while for PC4, PC5, and PC6, these weights were low. In light of these results, the authors decided to continue the analysis considering only PC1, PC2, and PC3.
To group the variables according to similar aspects deduced from the answers to the first questionnaire, the weight distribution of each factor on the three principal components was analyzed (Figure 3, Figure 4 and Figure 5).
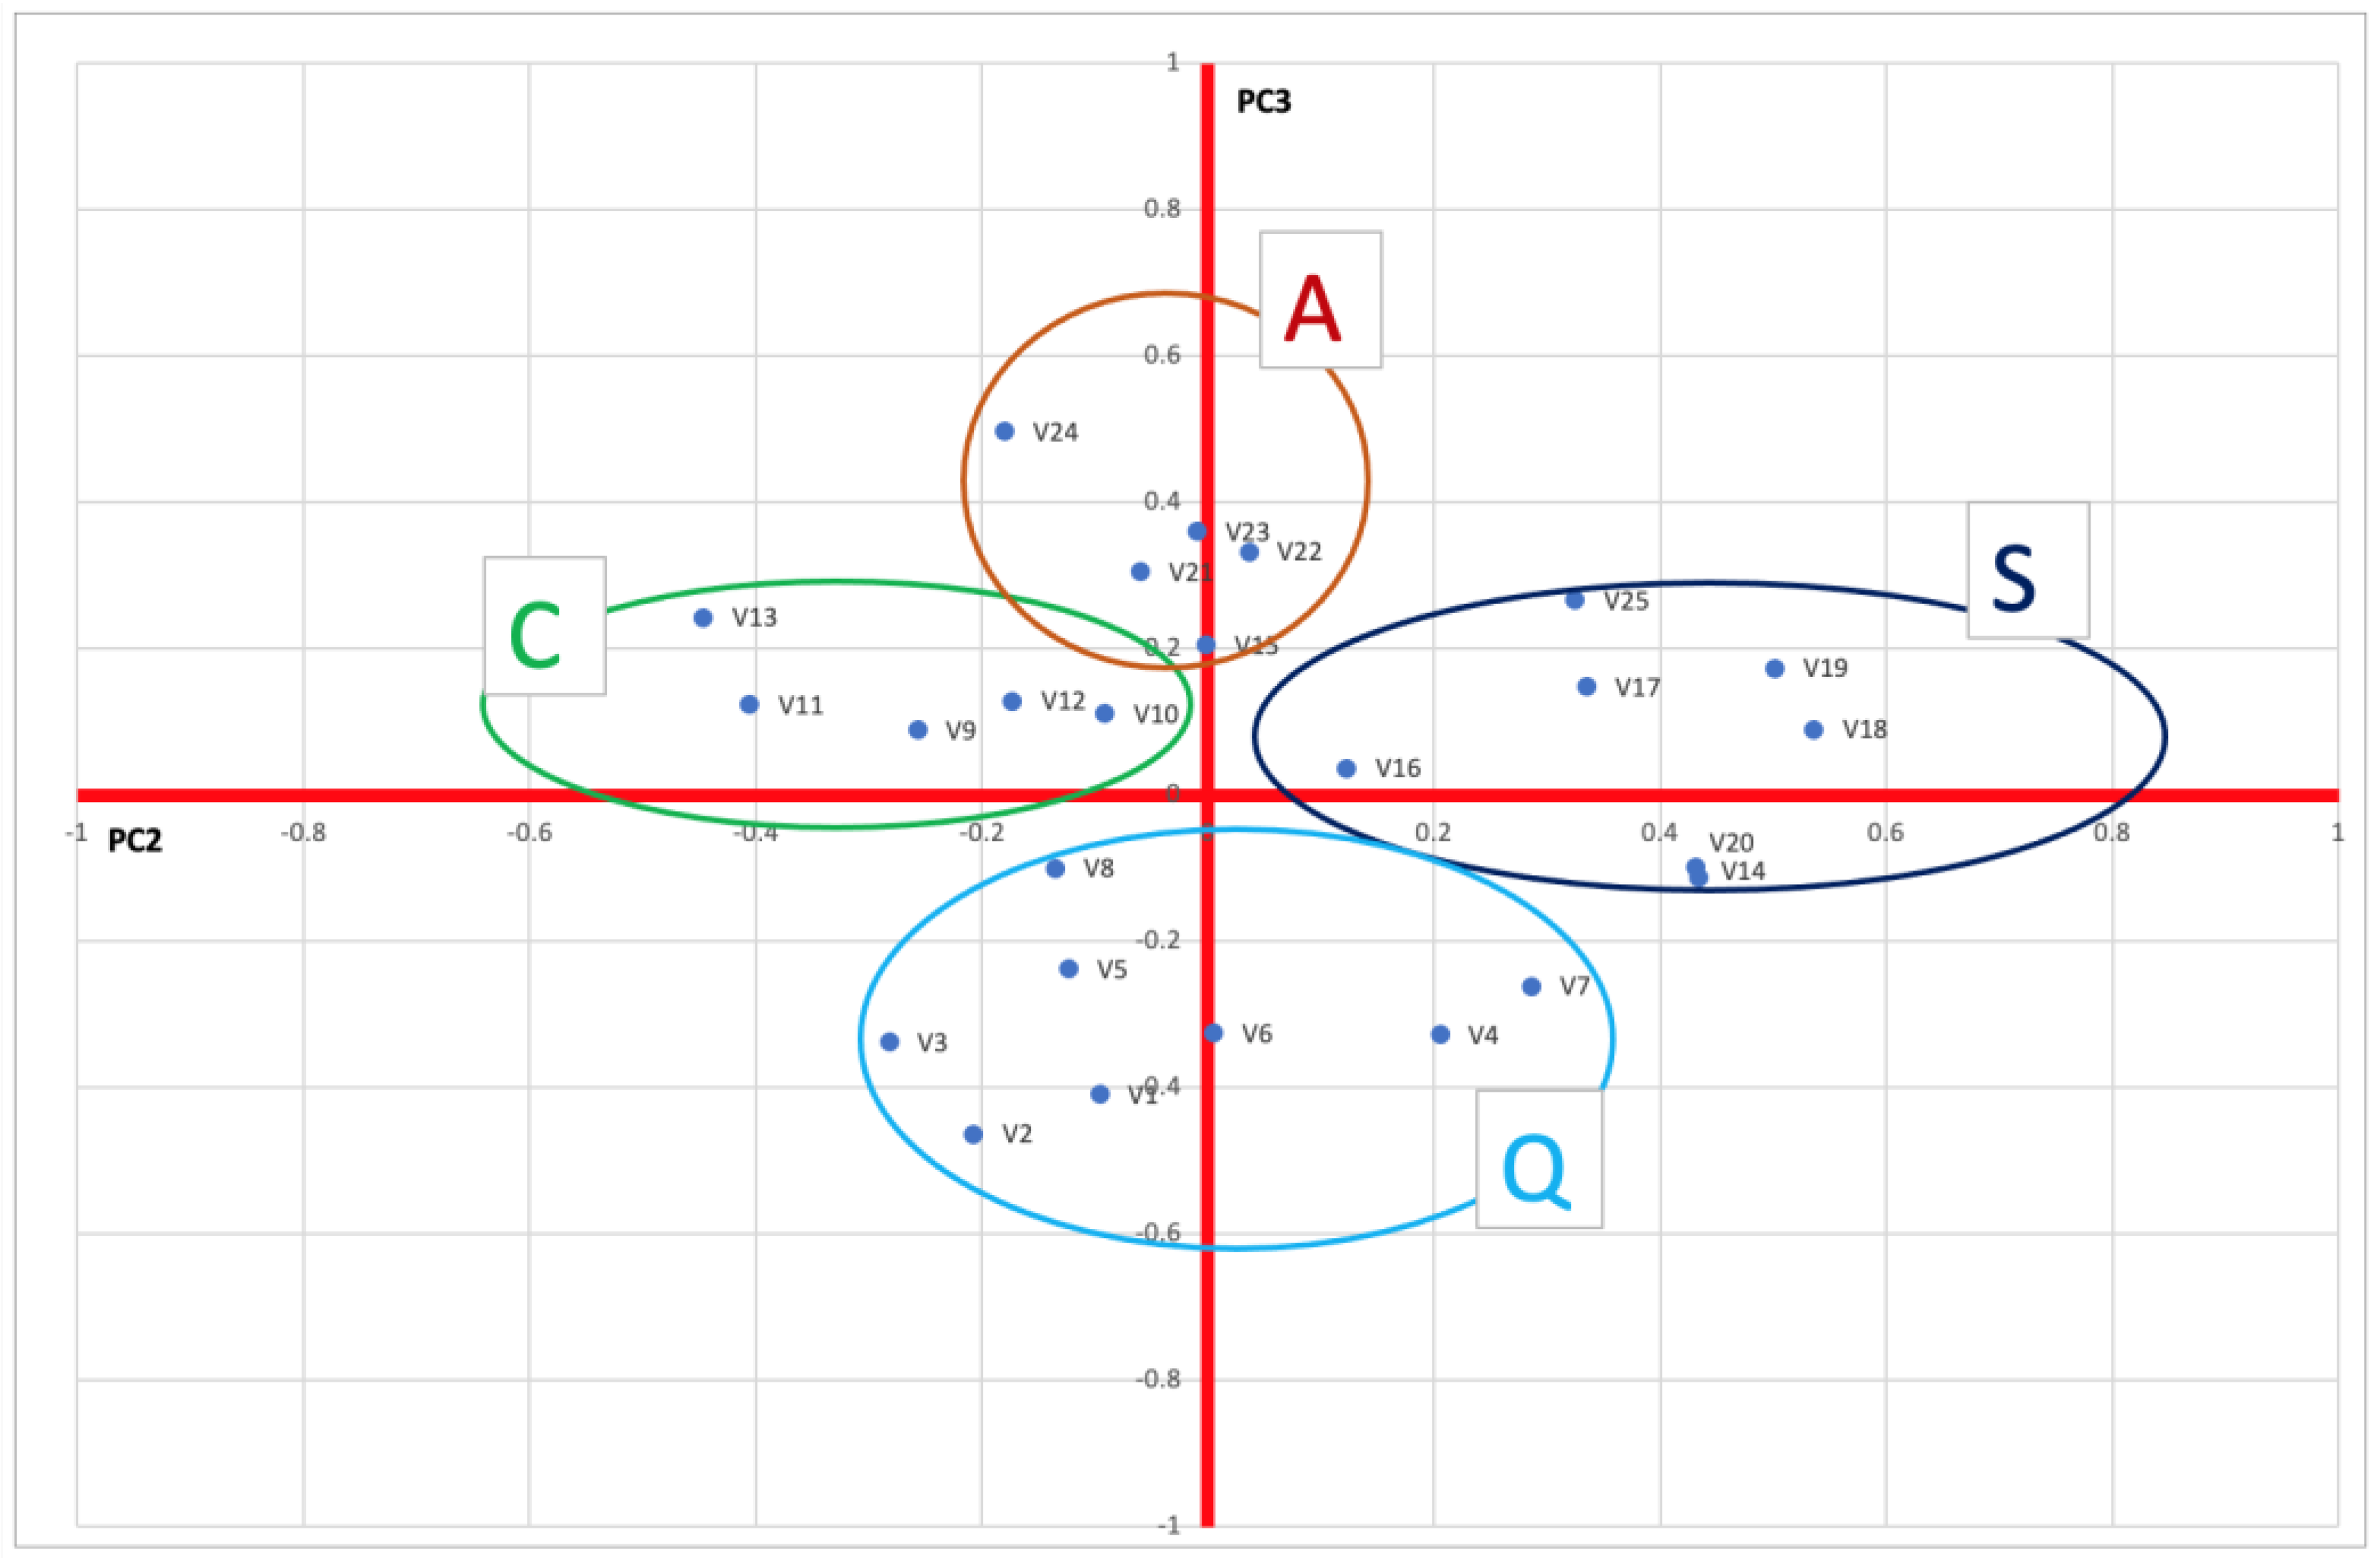
The plots of component weights containing the first factor (Figure 3 and Figure 4) did not provide any distinct clusters of similar variables. All points in both plots for individual variables lay in the right part of the plot, which was caused by the positive first factor coordinate for all variables. The positive weights, of very similar value, of all variables on PC1 could be interpreted as the close compatibility of PC1 with users’ expectations. This result was to be expected given the survey setup. Therefore, in order to define similar clusters of variables, PC1 was uninteresting. The plot of component weights for PC2 and PC3 (Figure 5) already showed the possibility of grouping variables in clusters. Four clusters were identified (Figure 6):
  • The first was formed by variables that have a high positive weight with respect to PC2 and a low weight with respect to PC3. This cluster contained V14, V16, V17, V18, V19, V20, and V25.
  • The second was formed by variables that had a high negative weight with respect to PC2 and a low weight with respect to PC3. This cluster contained V9, V10, V11, V12, and V13.
  • The third was formed by variables that had a high positive weight with respect to PC3 and a low weight with respect to PC2. This cluster contained V15, V21, V22, V23, and V24.
  • The fourth was formed by variables that had a high negative weight with respect to PC3 and a low weight with respect to PC2. This cluster contained V1, V2, V3, V4, V5, V6, V7, and V8.
Analyzing the variables of the first cluster indicated that this cluster contained all interventions in favor of the safety of the pedestrian path (for example, the presence of interventions to limit the speed of vehicles or the presence of zones that distance the pedestrian path from that of vehicles). The first cluster was therefore named Safety (S). The second cluster contained the variables that satisfy the comfort needs of users, such as the presence of benches, shelters from atmospheric agents, and a lighting system. Hence, it was named Comfort (C). The third cluster included variables such as the presence of commercial activities or places characterized by high artistic value and low traffic flows. Therefore, it was named Attractiveness (A). Finally, the last cluster consisted of all the variables that contribute to the quality of the pedestrian path (Q), including path width, slope, cleanliness, absence of obstacles, etc.

3.2. Path Analysis

There were 521 respondents to the second questionnaire. The survey was held on the DICAR website until the number of responses obtained was similar to that of the previous survey. In the second questionnaire, only four questions were asked to the respondents. In particular, respondents were explicitly asked how much each of the 4 factors identified with PCA increased their willingness to walk. In the present study, a supposed model was first designed in order to identify the influential factors on users’ willingness to walk, based on the questions included in the questionnaire (Figure 7). The initial hypothesis was that all the factors identified with PCA had an effect on users’ willingness to walk.
The model fit indices used in the present study included the root mean square error of approximation (RMSEA), the normal fit index (NFI), and the comparative fit index (CFI). According to the available literature, RMSE of approximation must be <0.10, NFI has to be larger than 0.95, and CFI has to be higher or close to 0.95 [27]. Applying the model fit tested to what extent the conceptual framework was supported by the actual data. In other words, it indicated the fit of the experimental model (based on data) with the theoretical model (conceptualized by the researcher).
According to the results, the hypothesis that the attractiveness (A) of the pedestrian path affects the willingness of users to walk was not significant (p > 0.005); therefore, it was removed in the final path diagram (Figure 8).
The fit values for the final version of the path diagram after A was removed from the model were 0.09 for RMSEA (less than 0.10), 1.00 for NFI (greater than 0.95), and 1.00 for CFI (greater than 0.95). Considering that the fit indices of the model satisfied all conditions, the model was considered as a good model for estimating the effect of the factors considered.
To estimate the model parameters, it was necessary to analyze the correlation matrix implied by the model (Table 5), which was obtained as a function of the path coefficients.

4. Discussion

Various walking needs and some aspects of street design influence users’ willingness to walk. The first part of this study showed through principal component analysis that all variables with an impact on users’ willingness to walk, based on the literature review conducted in Section 1 of this work, could be attributed to four main factors: safety, comfort, attractiveness, and quality of the pedestrian path.
Pedestrian infrastructure quality refers to the conditions and characteristics of the pedestrian path (e.g., width, pavement, barriers) that make it physically possible to walk from one destination to another. These are very important in a street network such as the one in which the study was conducted, since the conditions of the sidewalks vary and very often present critical conditions for pedestrians or even actual deterioration. In some cases, there were no sidewalks, the path may have been dirty, the pavement was often damaged, or the path was constantly interrupted by driveways to buildings. Numerous other studies have found that this factor significantly increases pedestrian mobility [28,29].
Pedestrian safety refers to whether a user feels safe from the risk of conflict with vehicles. Among the possible interventions that can contribute to the safety of pedestrians on the road, which were grouped in this macro factor after analysis of the data obtained with the survey, were all the design measures that contribute to improving the safety of pedestrians by imposing restrictions on the movement of motor vehicles, such as traffic-calming measures, narrow roadway widths, safety zones, etc. [30,31]. Safety is an important need when walking, which was also frequently found in previous research [32,33].
Numerous studies have been published on comfort being an important need in walking [34,35,36,37,38]. Comfort refers to the degree of ease and pleasure with which a person walks along a pedestrian path. Design measures that feed into this macro factor and can contribute to pedestrian comfort include street furniture and functional furnishing measures that respondents considered appropriate to encourage their willingness to walk, such as weather protection, benches or seating, street lighting, etc.
Attractiveness simply refers to whether an individual finds a pleasant and interesting area to walk. Recent studies have included attractiveness among the factors that influence users’ willingness to walk [39,40,41]. The factors that make a pedestrian path attractive are many and include various aspects, most of which have nothing to do with the characteristics of the path itself but with the context surrounding the pedestrian path, such as the presence of commercial activities, high artistic/landscape value of the streetscape, low vehicle flows, etc.
Having defined the macro factors that influence people’s willingness to walk, we wanted to define the hierarchy of these needs in the context of the study, in line with ref. [42]. Considering that ref. [19] showed that this hierarchy was strongly related to users’ perceptions of the street context in which the pedestrian path was located, the weight of each macro factor was evaluated through path analysis.
The results of the path analysis showed that all factors that were significant to this analysis had positive effects on users’ willingness to walk. Moreover, the weights corresponding to the aforementioned effects assumed very similar values for each of the three macro factors considered. From the correlation matrix (Table 5), the effect of pedestrian path safety on users’ willingness to walk was 0.879, while the effect of comfort was 0.888, and the effect of pedestrian path quality was 0.890. However, as mentioned earlier, the attractiveness of the urban environment in which the pedestrian path was embedded was not significant. This result was contrary to that of other studies [19,43] in which the environment could even be considered the most important aspect in attracting young people to walk, while the characteristics of the sidewalk were not significant. However, it should be noted that the same studies concluded that the low weight given to safety and comfort must be seen in the context in which the study was conducted, which in their case were streets where improvements had recently been made to create a comfortable pedestrian-friendly road environment.
Contrary to previous studies that defined pyramids of hierarchies of walking needs [19,42,44], this study showed that the respondents in their context of analysis did not perceive a hierarchical scale of priorities for the factors that were significant, i.e., quality, safety, and comfort, and therefore they were all placed at the same level of need. In fact, it can be observed that in the pyramid proposed by ref. [42], the quality of the pedestrian path, embedded in a broader concept of accessibility, was among the fundamental levels of need to be satisfied, while safety and comfort were associated with subordinate levels of need. Another study, instead, showed that usefulness, sense of belonging, and enjoyment were most important to people in the hierarchy of walking needs [19].
Thus, the results of the survey presented here, as well as other studies in the literature, showed that the willingness to walk depends on those factors that are now generally recognized as essential to encouraging users to leave their cars and walk in their neighborhoods. However, the urban infrastructure characteristics of the users who participated in the survey have resulted in power relationships among the identified macro factors that are markedly different from those that appear consolidated in contexts where attention and sensitivity to pedestrian mobility is high. In particular, the “attractiveness” macro factor was weakest among the factors studied and therefore proved to have the least influence on users’ willingness to walk. Thus, in terms of their willingness to walk, the users who participated in the survey showed that they attached little importance to the attractiveness of the neighborhoods in which they live on a daily basis, clearly subordinating it to the characteristics of quality, safety, and comfort of pedestrian infrastructures and elements of street furniture in the neighborhoods themselves. From this it can be deduced that the stated requirements for the quality, safety, and comfort of the urban realities to which the respondents belong are severely inadequate, and that the users interviewed mentally elaborated the following three sets of arguments: (1) even if a neighborhood is esthetically pleasing and attractive, it is preferable to use other modes of transportation if it is not easy to walk or the pedestrian infrastructure is poor; (2) walking is discouraged if pedestrian routes are perceived as dangerous or if there are areas where safety is low; (3) even if a neighborhood is attractive, other modes of transportation may be preferred if the pedestrian infrastructure is not comfortable (e.g., sidewalks that are dirty or have obstacles and/or obstructions), resulting in a clear disinclination to walk in the affected areas.
The other three macro factors, “quality”, “safety”, and “comfort”, were at the same level of influence in terms of users’ willingness to walk. In fact, the Italian reality considered has led to a flattening of the values attributed to those aspects that play the most important role in promoting urban walkability. Therefore, in the context studied, it was not possible to define a hierarchical pyramid that would have led, among other things, to identify potential priorities in intervention strategies that would allow administrations to allocate resources in the best possible way to improve the mobility of vulnerable users in urban areas while promoting quality of life in neighborhoods.
It can be deduced that in contexts where pedestrian routes and the quality of the urban environment in general are not well maintained, the people who live in them on a daily basis are not able to identify the boundaries that delimit the specificities of the three macro factors mentioned above, even while correctly perceiving the design elements and other intervention strategies that should be implemented to improve the quality, safety, and comfort of pedestrian paths. In other words, the more or less unconscious awareness of the low level of performance offered by all three macro factors leads users to be inclined to be satisfied with any improvement in any of the three mentioned areas without having a preference.
It is therefore evident that administrations must plan broad improvement actions in an urban reality characterized by different types of deficiencies in pedestrian mobility infrastructures. Moreover, it is considered that, based on the results of this study, the attractiveness of neighborhoods should also be strongly considered, since it is obvious that once the problems related to safety, comfort, and quality of infrastructures are addressed and a solution for pedestrian mobility is found, it will also find its rightful place in the hierarchy of strategies aimed at promoting the willingness of the residents of neighborhoods to make many trips on foot. Given what has just been discussed, it is possible to reflect on the important implications this could have for urban design and planning. If the quality, safety, and comfort of pedestrian infrastructures are considered important, urban planning should prioritize the provision of safe and accessible sidewalks, crosswalks, and pedestrian-friendly streets. This requires an integrated approach to urban and transportation planning that includes the participation of stakeholders, urban planners, and architects.
Furthermore, when neighborhood attractiveness is also considered, urban design and planning should go beyond functional requirements and also focus on creating vibrant and livable urban environments. This could include the creation of mixed-use neighborhoods with a diverse range of services, amenities, and green spaces that can promote the social and economic vitality of the community. In addition, designing public spaces that are safe, comfortable, and esthetically pleasing can encourage people to walk and use public transportation, which can reduce traffic congestion and air pollution.
In summary, a comprehensive and integrated approach to urban design and planning that considers both the quality of pedestrian infrastructures and the attractiveness of neighborhoods is critical to creating sustainable and livable urban environments. This can improve the quality of life of residents, reduce traffic congestion, and promote healthier and more sustainable modes of transportation.

5. Conclusions

The main objective of transportation policies, finally implemented by many administrations in recent years, is to facilitate the accessibility of urban areas while meeting goals such as environmental sustainability, safety, efficiency, and social equity. As a result, transportation planning strategies increasingly target the promotion of walking and cycling. Today, planning cities for pedestrians is no easy task, especially where the road network is primarily designed for cars. To create more pedestrian-friendly cities, planners and policymakers must address the following challenges: streets designed only for the needs of drivers, excessive travel distances due to urban sprawl, and lack of knowledge about pedestrians’ needs, how they perceive the built environment, and how it affects their mode of travel.
Based on these observations, this study aimed to provide insight into pedestrians’ needs and the factors that most influence their willingness to walk. Specifically, principal component analysis identified four main factors that influence users’ willingness to walk. These are: safety, comfort, attractiveness, and quality of the pedestrian path. The results of the path analysis showed that the attractiveness of the urban environment in which the pedestrian path is embedded was not significant and all other factors had positive effects on users’ willingness to walk. Moreover, the weights for the safety, comfort, and quality of the pedestrian path had very similar values. Therefore, it was not possible to define a hierarchy of pedestrian needs. The difference between the results of this study and other studies that have been able to define a pedestrian needs pyramid indicate that there is no panacea for increasing pedestrian travel. A variety of individual, cultural, and physical–environmental factors come into play. In accordance with previous studies, it is possible to confirm that walkability is a specific issue of the studied area and it is influenced by various local factors [45,46,47].
It seems evident then that the results of this study are strongly conditioned by the context of the analysis and therefore cannot be generalized, as they are specific to environments where infrastructures supporting pedestrian mobility are often inadequate. However, this is not a limitation of the present study, since it is assumed that the type of approach used to rigorously examine the actual needs of pedestrians can be generalized. This approach, when applied in other contexts, could reveal different power relationships among the factors that influence people’s willingness to walk and clearly define hierarchies in pedestrian needs. Surveying neighborhood populations through a survey campaign of the type proposed and conducting analyses similar to those in this study could help administrators make the best decisions. It is imperative then that policy makers consider their settings and populations carefully and adopt a multi-objective approach to program interventions aimed at increasing walking [48,49].
The results of this study, as well as those obtained in other contexts, can be used as a basis for walkability assessment procedures to give different weights to the various aspects considered. Indeed, many walkability assessment methods described in the literature give different weights to the factors considered [50,51].
With regard to the further application potential of this research, it should first be noted that it was conducted without differentiating the opinions according to the different types of users but the sample of respondents was considered as a whole. In the near future, further analyses will be carried out differentiating users by categories, e.g., children, young people, the elderly, users in small towns, users in large cities, etc. In this way, administrations will have more flexible tools to plan pedestrian mobility improvement measures in an even more rational and objective way. Indeed, different categories of pedestrians have different needs that must be taken into account to ensure safe and accessible pedestrian mobility. For example, sidewalks leading to schools should be designed to be easy for children to walk on, with proper signage and no dangerous obstacles. Similarly, footpaths leading to hospices and nursing homes should be accessible to the elderly or disabled, with safe ramps and crossings.
Thus, further research could better support the urban planning strategies already discussed. Indeed, planning pedestrian routes that take into account the needs of different user categories promotes greater participation and social inclusion, healthy lifestyles, and thus a sense of overall safety in the urban environment.
Finally, addressing the mobility needs of pedestrians, differentiated by user categories, can also have an impact on the allocation of funding by administrations. Designing high-quality, comfortable, and safe pedestrian walkways requires a higher initial investment but can be cost-effective for the city in the long run by reducing the need for costly remedies following problems related to safety, comfort, and quality deficiencies.

Author Contributions

Conceptualization, N.D. and S.L.; methodology, N.D.; software, N.D. and S.L.; validation, S.L.; formal analysis, N.D. and S.L.; investigation, N.D., N.G.L. and S.L.; resources, N.D. and S.L.; data curation, N.D. and N.G.L.; writing—original draft preparation, N.D.; writing—review and editing, N.D. and S.L.; visualization, N.D. and N.G.L.; supervision, S.L. All authors have read and agreed to the published version of the manuscript.

Funding

This research received no external funding.

Institutional Review Board Statement

Not applicable to this study because effects on humans are essentially nonexistent.

Informed Consent Statement

Not applicable to this study because no subjects were involved in the research trials.

Data Availability Statement

No new data has been created.

Conflicts of Interest

The authors declare no conflict of interest.

References

  1. Larranaga, A.M.; Arellana, J.; Rizzi, L.I.; Strambi, O.; Cybis, H.B.B. Using best–worst scaling to identify barriers to walkability: A study of Porto Alegre, Brazil. Transportation 2019, 46, 2347–2379. [Google Scholar] [CrossRef]
  2. Majumdar, B.B.; Sahu, P.K.; Patil, M.; Vendotti, N. Pedestrian Satisfaction-Based Methodology for Prioritization of Critical Sidewalk and Crosswalk Attributes Influencing Walkability. J. Urban Plann. Dev. 2021, 147, 04021032. [Google Scholar] [CrossRef]
  3. Bornioli, A.; Parkhurst, G.; Morgan, P.L. Affective experiences of built environments and the promotion of urban walking. Transp. Res. Part. A Policy Pract. 2019, 123, 200–215. [Google Scholar] [CrossRef]
  4. Glebova, E.; Desbordes, M. Smart sports in smart cities. In Smart Cities and Tourism: Co-Creating Experiences, Challenges and Opportunities; Chapter 4; Goodfellow Publishers: Oxford, UK, 2022; p. 60. [Google Scholar] [CrossRef]
  5. Distefano, N.; Leonardi, S. Experimental investigation of the effect of speed bumps in sequence on noise emission level from motor vehicles. Noise Control Eng. J. 2015, 63, 582–597. [Google Scholar] [CrossRef]
  6. Montella, A.; Chiaradonna, S.; Claudi de Saint Mihiel, A.; Lovegrove, G.; Nunziante, P.; Rella Riccardi, M. Sustainable Complete Streets Design Criteria and Case Study in Naples, Italy. Sustainability 2022, 14, 13142. [Google Scholar] [CrossRef]
  7. Kim, S.; Park, S.; Lee, J.S. Meso- or micro-scale? Environmental factors influencing pedestrian satisfaction. Transp. Res. D Trans. Environ. 2014, 30, 10–20. [Google Scholar] [CrossRef]
  8. Lee, E.; Dean, J. Perceptions of walkability and determinants of walking behaviour among urban seniors in Toronto, Canada. J. Transp. Health 2018, 9, 309–320. [Google Scholar] [CrossRef]
  9. McCormack, G.R.; Friedenreich, C.M.; Giles-Corti, B.; Doyle-Baker, P.K.; Shiell, A. Do motivation-related cognitions explain the relationship between perceptions of urban form and neighborhood walking? J. Phys. Act Health 2013, 10, 961–973. [Google Scholar] [CrossRef]
  10. Ewing, R.; Handy, S. Measuring the unmeasurable: Urban design qualities related to walkability. J. Urban Des. 2009, 14, 65–84. [Google Scholar] [CrossRef]
  11. Bruner, J.S. Acts of Meaning; Harvard University Press: Cambridge, MA, USA, 1990. [Google Scholar]
  12. Van der Vlugt, A.L.; Curl, A.; Scheiner, J. The influence of travel attitudes on perceived walking accessibility and walking behaviour. Travel Behav. Soc. 2022, 27, 47–56. [Google Scholar] [CrossRef]
  13. Otsuka, N.; Wittowsky, D.; Damerau, M.; Gerten, C. Walkability assessment for urban areas around railway stations along the rhine-alpine corridor. J. Transp. Geogr. 2021, 93, 103081. [Google Scholar] [CrossRef]
  14. Villaveces, A.; Nieto, L.A.; Ortega, D.; Ríos, J.F.; Medina, J.J.; Gutiérrez, M.I.; Rodríguez, D. Pedestrians’ perceptions of walkability and safety in relation to the built environment in Cali, Colombia, 2009–2010. Inj. Prev. 2012, 18, 291–297. [Google Scholar] [CrossRef] [PubMed] [Green Version]
  15. Ferrer, S.; Ruiz, T. The impact of the built environment on the decision to walk for short trips: Evidence from two Spanish cities. Transp. Policy 2018, 67, 111–120. [Google Scholar] [CrossRef]
  16. Sdoukopoulos, A.; Verani, E.; Nikolaidou, A.; Gavanas, N.; Pitsiava-Latinopoulou, M.; Mikiki, F.; Mademli, E.; Pallas, C. Development and implementation of walkability audits in Greek medium-sized cities: The case of the Serres’ city centre. Transp. Res. Proc. 2017, 24, 337–344. [Google Scholar] [CrossRef]
  17. Singh, R. Factors affecting walkability of neighborhoods. Procedia Soc. Behav. Sci. 2016, 216, 643–654. [Google Scholar] [CrossRef] [Green Version]
  18. Shamsuddin, S.; Bilyamin, S.F.I. Factors Influencing the Walkability Characteristics of Kuala Lumpur City Centre. Int. J. Eng. Technol. Manag. Appl. Sci. 2012, 3, 1–21. [Google Scholar]
  19. Metha, V. Walkable streets: Pedestrian behavior, perceptions and attitudes. J. Urban. Intern. Res. Place. Urb. Sust. 2008, 1, 217–245. [Google Scholar] [CrossRef]
  20. Lee, J.; Kim, D.; Park, J. A Machine Learning and Computer Vision Study of the Environmental Characteristics of Streetscapes That Affect Pedestrian Satisfaction. Sustainability 2022, 14, 5730. [Google Scholar] [CrossRef]
  21. Fan, J.; Han, F.; Liu, H. Challenges of Big Data Analysis. Natl. Sci. Rev. 2014, 1, 293–314. [Google Scholar] [CrossRef] [PubMed] [Green Version]
  22. Jolliffe, I.T.; Cadima, J. Principal component analysis: A review and recent developments. Phil. Trans. R. Soc. A 2016, 375, 1–16. [Google Scholar] [CrossRef] [Green Version]
  23. Carver, A.; Salmon, J.; Campbell, K.; Baur, L.; Garnett, S.; Crawford, D. How do perceptions of local neighborhood relate to adolescents’ walking and cycling? Am. J. Health Promot. 2005, 20, 139–147. [Google Scholar] [CrossRef] [PubMed]
  24. Fairchild, A.J.; Mac Kinnon, D.P. A General Model for Testing Mediation and Moderation Effects. Prev. Sci. 2009, 10, 87–99. [Google Scholar] [CrossRef] [PubMed] [Green Version]
  25. Distefano, N.; Leonardi, S.; Pulvirenti, G. Home-school Travel: Analysis of Factors Affecting Italian Parents’ Mode Choice. Civ. Eng. Archit. 2019, 7, 75–87. [Google Scholar] [CrossRef]
  26. Shrestha, N. Factor Analysis as a Tool for Survey Analysis. Am. J. Appl. Math. 2021, 9, 4–11. [Google Scholar] [CrossRef]
  27. Boukarta, S.; Berezowska-Azzag, E. The influence of build environment and socio-economic factors on commuting energy demand: A path analysis-based approach. Quaest. Geogr. 2022, 41, 19–39. [Google Scholar] [CrossRef]
  28. Fonseca, F.; Fernandes, E.; Ramos, R. Walkable Cities: Using the Smart Pedestrian Net Method for Evaluating a Pedestrian Network in Guimarães, Portugal. Sustainability 2022, 14, 10306. [Google Scholar] [CrossRef]
  29. Vallejo-Borda, J.A.; Ortiz-Ramirez, H.A.; Rodriguez-Valencia, A.; Hurtubia, R.; de D. Ortúzar, J. Forecasting the Quality of Service of Bogota’s Sidewalks from Pedestrian Perceptions: An Ordered Probit MIMIC Approach. Transp. Res. Rec. 2020, 2674, 205–216. [Google Scholar] [CrossRef]
  30. Distefano, N.; Leonardi, S. Evaluation of the Effectiveness of Traffic Calming Measures by SPEIR Methodology: Framework and Case Studies. Sustainability 2022, 14, 7325. [Google Scholar] [CrossRef]
  31. Distefano, N.; Leonardi, S. Evaluation of the Benefits of Traffic Calming on Vehicle Speed Reduction. Civ. Eng. Archit. 2019, 7, 200–214. [Google Scholar] [CrossRef]
  32. Kweon, B.S.; Rosenblatt-Naderi, J.; Ellis, C.D.; Shin, W.H.; Danies, B.H. The Effects of Pedestrian Environments on Walking Behaviors and Perception of Pedestrian Safety. Sustainability 2021, 13, 8728. [Google Scholar] [CrossRef]
  33. Rella Riccardi, M.; Galante, F.; Scarano, A.; Montella, A. Econometric and Machine Learning Methods to Identify Pedestrian Crash Patterns. Sustainability 2022, 14, 15471. [Google Scholar] [CrossRef]
  34. Øvstedal, L.; Ryeng, E.O. Understanding pedestrian comfort in European cities: How to improve walking conditions? In Proceedings of the European Transport Conference Proceedings 2002, Cambridge, UK, 28 March 2002; Association for European Transport: Henley-In-Arden, UK. [Google Scholar]
  35. Asadi-Shekari, Z.; Moeinaddini, M.; Aghaabbasi, M.; Cools, M.; Zaly Shah, M. Exploring effective micro-level items for evaluating inclusive walking facilities on urban streets. Sustain. Cities Soc. 2019, 49, 101563. [Google Scholar] [CrossRef]
  36. Johansson, M.; Laureshyn, A.; Nilsson, M. Video Analysis of Pedestrian Movement (VAPM) under Different Lighting Conditions—Method Exploration. Energies 2020, 13, 4141. [Google Scholar] [CrossRef]
  37. Ertin, D.G.; Karakaya, A.B.; Ozyavuz, M. Edirne Saraclar street pedestrian comfort analysis. J. Environ. Prot. Ecol. 2018, 19, 738–751. [Google Scholar]
  38. Moura, F.; Cambra, P.; Gonçalves, A.B. Measuring walkability for distinct pedestrian groups with a participatory assessment method: A case study in Lisbon. Landsc. Urban Plan. 2017, 157, 282–296. [Google Scholar] [CrossRef]
  39. Basu, R.; Sevtsuk, A. How do street attributes affect willingness-to-walk? City-wide pedestrian route choice analysis using big data from Boston and San Francisco. Transp. Res. Part. A Policy Pract. 2022, 163, 1–19. [Google Scholar] [CrossRef]
  40. Sousa, N.; J Monteiro, J.; Natividade-Jesus, E.; Coutinho-Rodrigues, J. The impact of geometric and land use elements on the perceived pleasantness of urban layouts. Environ. Plan. B Urban Anal. City Sci. 2023, 50, 740–756. [Google Scholar] [CrossRef]
  41. Calafiore, A. Measuring beauty in urban settings. In Proceedings of the GISRUK 2020 Proceedings, Cambridge, UK, 21–23 June 2020; pp. 1–9. [Google Scholar]
  42. Alfonzo, M.A. To walk or not to walk? The hierarchy of walking needs. Environ. Behav. 2005, 37, 808–836. [Google Scholar] [CrossRef]
  43. Bellizzi, M.G.; Forciniti, C.; Mazzulla, G. A Stated Preference Survey for Evaluating Young Pedestrians’ Preferences on Walkways. Sustainability 2021, 13, 12434. [Google Scholar] [CrossRef]
  44. Mateo-Babiano, I. Pedestrian’s needs matter: Examining Manila’s walking environment. Transp. Policy 2016, 45, 107–115. [Google Scholar] [CrossRef]
  45. Wolek, M.; Suchanek, M.; Czuba, T. Factors influencing walking trips. Evidence from Gdynia, Poland. PLoS ONE 2021, 16, e0254949. [Google Scholar] [CrossRef] [PubMed]
  46. Van Wee, B. Accessible accessibility research challenges. J. Transp. Geogr. 2016, 51, 16. [Google Scholar] [CrossRef] [Green Version]
  47. Clifton, K.J.; Singleton, P.A.; Muhs, C.D.; Schneider, R.J. Representing pedestrian activity in travel demand models: Framework and application. J. Transp. Geogr. 2016, 52, 111–122. [Google Scholar] [CrossRef]
  48. Nicolosi, V.; Augeri, M.G.; Leonardi, S.; Distefano, N. Cross-Asset Resource Allocation and the Impact on Road Network Performance. Transp. Res. Proc. 2023, 69, 799–806. [Google Scholar] [CrossRef]
  49. Vallejo-Borda, J.A.; Cantillo, C.; Rodriguez-Valencia, A. A perception-based cognitive map of the pedestrian perceived quality of service on urban sidewalks. Transp. Res. F Traffic Psychol. Behav. 2020, 73, 107–118. [Google Scholar] [CrossRef]
  50. Eboli, L.; Forciniti, C.; Mazzulla, G.; Bellizzi, M.G. Establishing Performance Criteria for Evaluating Pedestrian Environments. Sustainability 2023, 15, 3523. [Google Scholar] [CrossRef]
  51. Canale, S.; Distefano, N.; Leonardi, S. Comparative analysis of pedestrian accident risk at unsignalized intersection. Bjrbe 2015, 10, 283–292. [Google Scholar] [CrossRef]
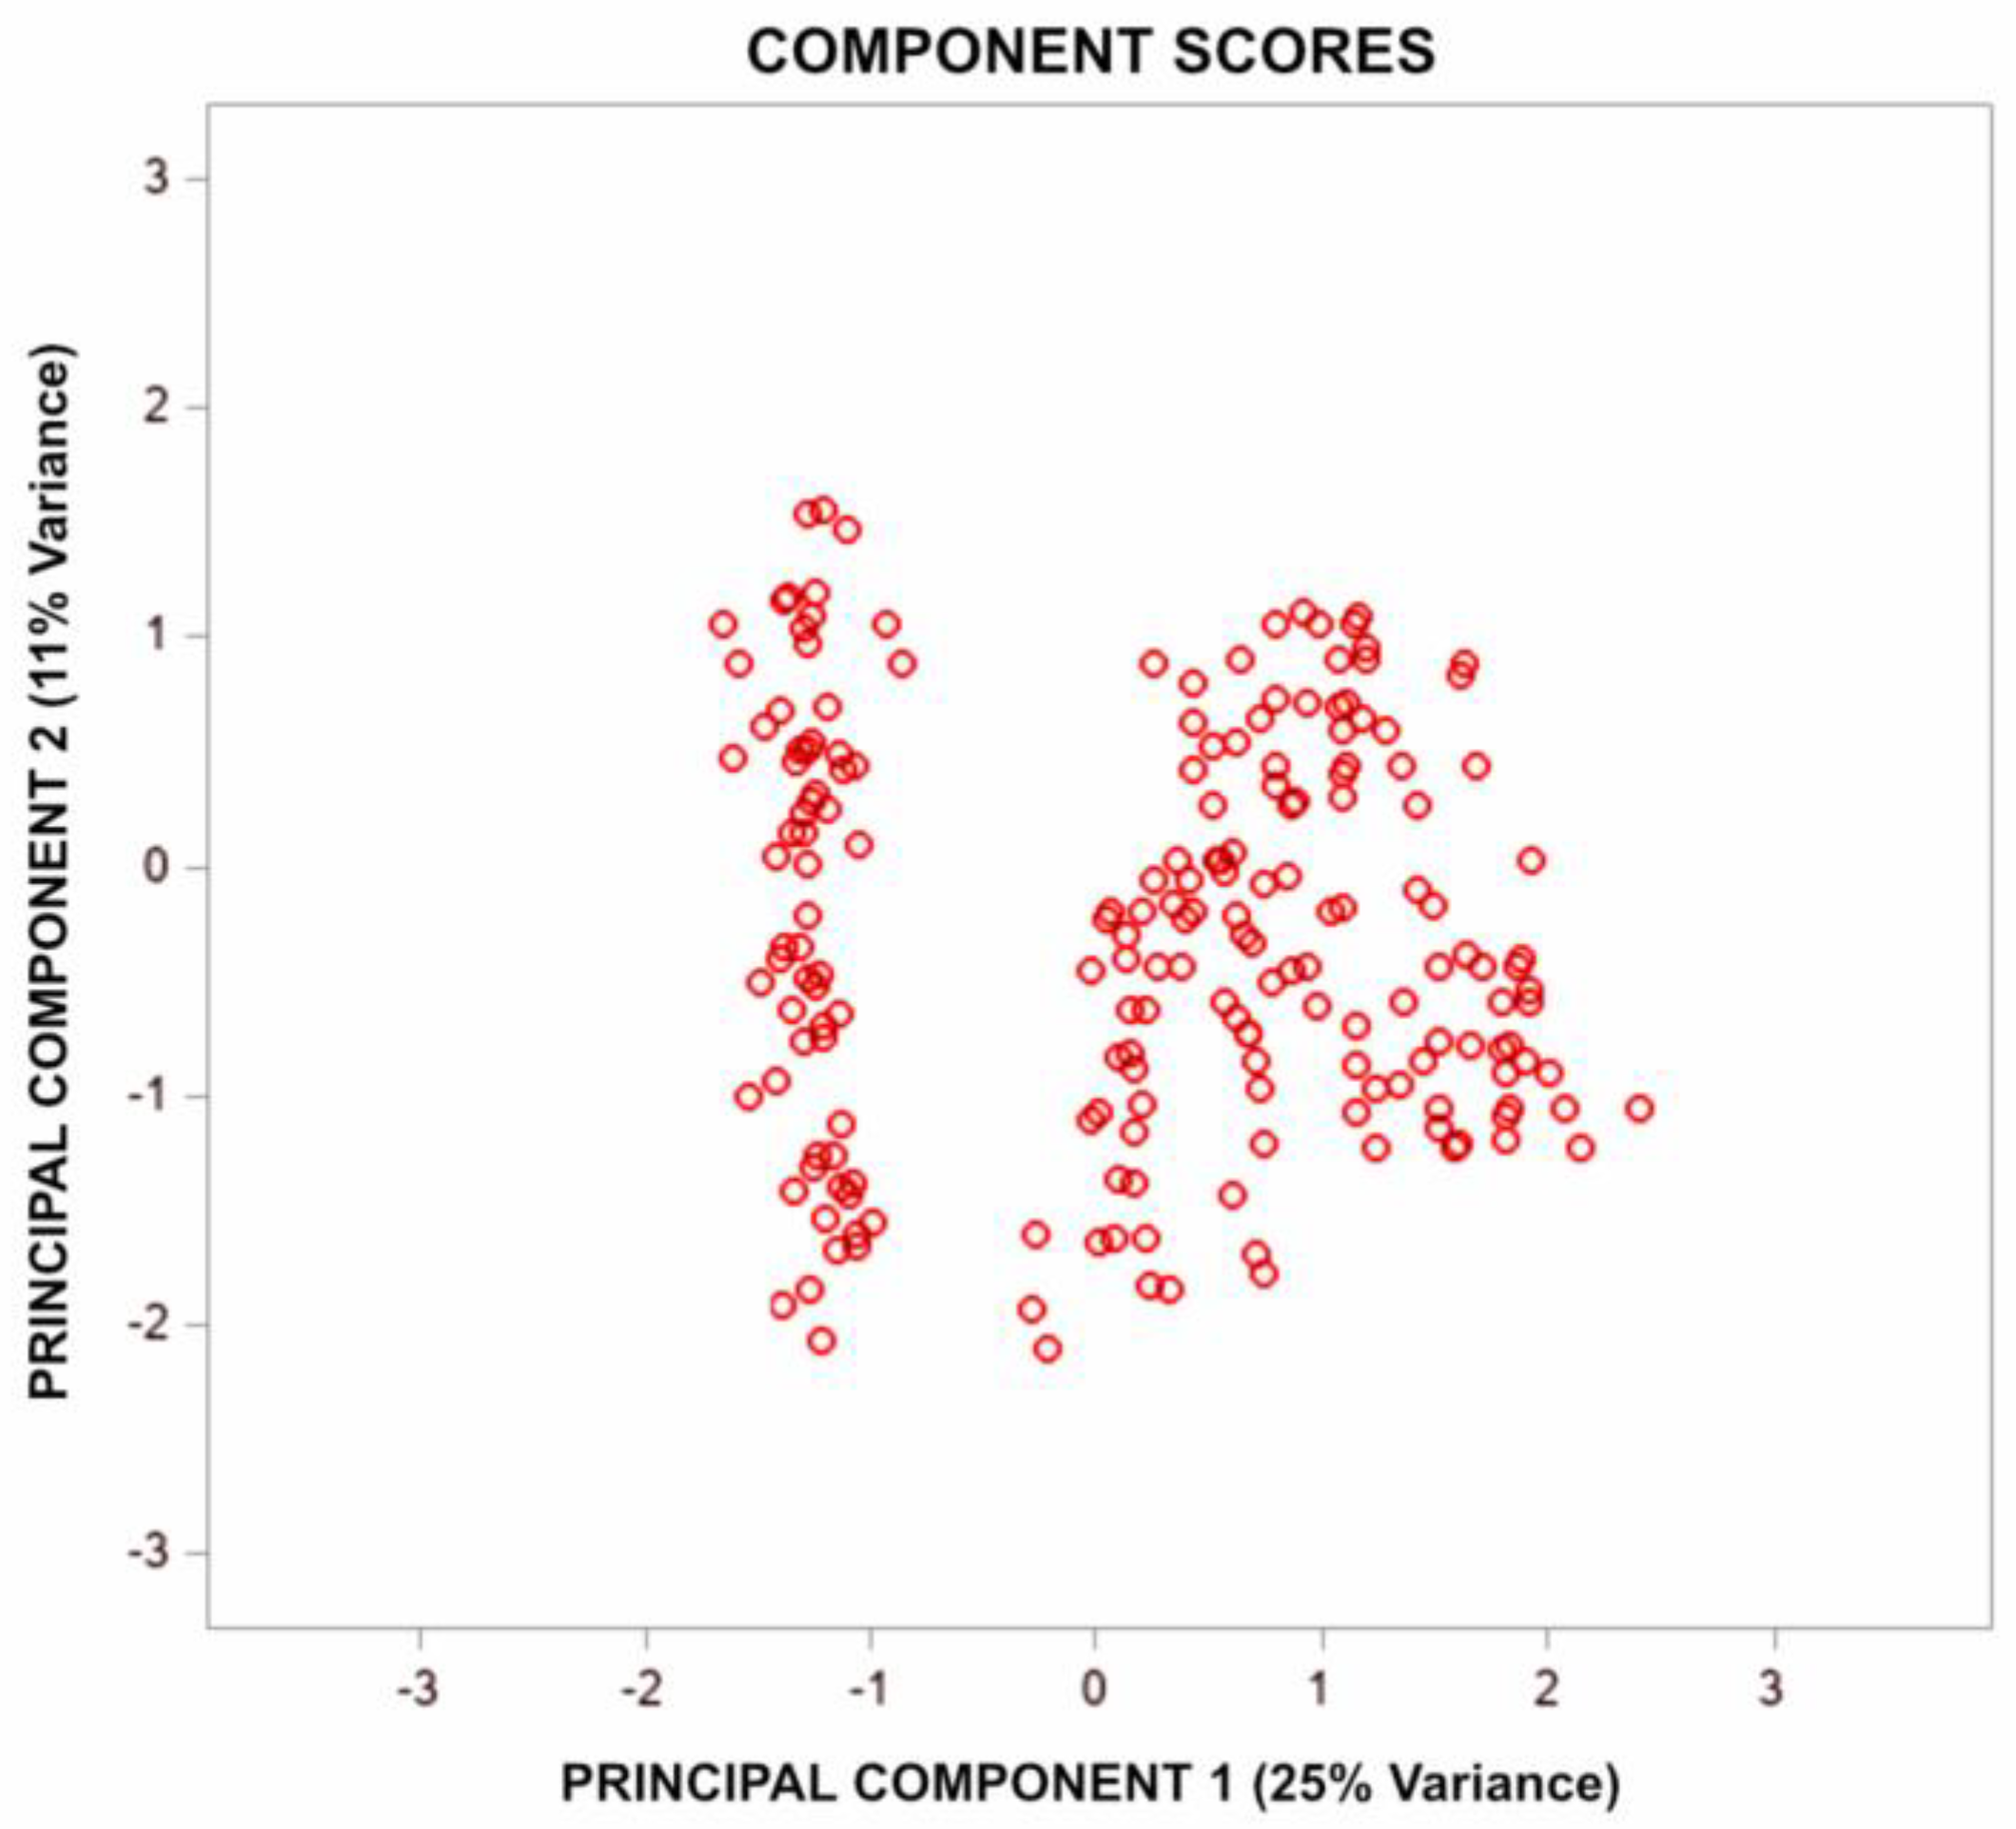
Figure 1. Example of PCA Plot.
Sustainability 15 05684 g001
Figure 2. Example of Path Diagram.
Sustainability 15 05684 g002
Figure 3. Plot components weights for PC1-PC2.
Sustainability 15 05684 g003
Figure 4. Plot components weights for PC1-PC3.
Sustainability 15 05684 g004
Figure 5. Plot components weights for PC2-PC3.
Sustainability 15 05684 g005
Figure 6. Identification of clusters.
Sustainability 15 05684 g006
Figure 7. Hypothesized path model.
Sustainability 15 05684 g007
Figure 8. Final path diagram.
Sustainability 15 05684 g008
Table 1. List of the factors concerning pedestrian mobility included in the study.
Factor
V1Continuity of the sidewalk
V2Sidewalk width
V3Good condition of the sidewalk surface
V4Reduced slope of the path
V5Absence of fixed obstacles (trees, poles, etc.)
V6Absence of obstacles and obstructions (parked vehicles, merchandise from shops, etc.)
V7Absence of driveways
V8Cleanliness of the pedestrian path
V9Presence of protection from atmospheric agents (trees, porches, etc.)
V10Presence of benches or seats
V11High perception of security
V12Ease of getting to a public transport stop
V13Good artificial lighting system of the path
V14Not excessive width of the carriageway
V15Low flows of vehicular traffic
V16Presence of speed limits for vehicular flows
V17Presence of traffic-calming measures on the carriageway
V18Presence of a bike lane adjacent to the pedestrian path
V19Presence of a parking lane adjacent to the pedestrian path
V20Absence of large parking areas
V21Ease of crossing at intersections
V22Ease of crossing out of intersections
V23Presence of commercial activities (bars, shops, etc.)
V24High artistic/landscape value of the streetscape
V25Presence of other pedestrians
Table 2. KMO and Bartlett’s Tests.
KMO and Bartlett’s Tests
KMO of Sampling Adequacy 0.872
Bartlett’s Test of SphericityApprox. Chi-Square2203.336
df300
Sig.0
Table 3. Eigenvalues and % of variance for principal components.
ComponentInitial EigenvaluesExtraction Sums of Squared Loadings
Total% of VarianceCumulative %Total% of VarianceCumulative %
16.82132.28332.2836.82132.28332.283
21.9414.7647.0431.9414.7647.043
31.7379.94856.9911.7379.94856.991
41.3366.99863.9891.3366.99863.989
51.0945.0369.0191.0945.0369.019
61.0073.68472.7031.0073.68472.703
70.9663.42276.125
80.9173.32579.45
90.8753.15882.608
100.8182.82885.436
110.7422.62488.06
120.7252.45590.515
130.6492.17792.692
140.6241.95194.643
150.5981.86496.507
160.5591.71198.218
170.3631.35299.57
180.1960.43100
Table 4. Matrix of component weights.
Principal Component
PC1PC2PC3PC4PC5PC6
V10.599−0.096−0.4090.38−0.0130.111
V20.672−0.207−0.4630.297−0.0640.023
V30.62−0.282−0.3380.39−0.132−0.051
V40.4110.205−0.3280.0840.3470.05
V50.633−0.123−0.238−0.2480.0130.025
V60.5730.005−0.326−0.212−0.1720.061
V70.4460.286−0.261−0.2960.209−0.262
V80.631−0.135−0.1−0.204−0.2430.136
V90.56−0.2570.089−0.414−0.072−0.113
V100.512−0.0910.112−0.332−0.2050.399
V110.559−0.4050.124−0.1280.35−0.097
V120.581−0.1730.129−0.210.0350.158
V130.541−0.4460.243−0.0480.0560.027
V140.4870.434−0.113−0.040.172−0.04
V150.536−0.0020.2060.1880.192−0.12
V160.5390.1230.037−0.1750.004−0.515
V170.5380.3350.148−0.047−0.296−0.355
V180.3540.5360.09−0.065−0.1880.321
V190.4490.5010.1740.037−0.2880.117
V200.3560.432−0.0990.1060.3290.276
V210.476−0.060.3050.353−0.196−0.06
V220.5040.0360.3330.323−0.203−0.121
V230.419−0.010.361−0.0070.3690.223
V240.443−0.180.4970.1830.0880.107
V250.4490.3250.2670.1230.201−0.105
Table 5. Matrix of correlation.
SCQW
S1.000
C0.8911.000
Q0.8720.9091.000
W0.8790.8880.8901.000
Disclaimer/Publisher’s Note: The statements, opinions and data contained in all publications are solely those of the individual author(s) and contributor(s) and not of MDPI and/or the editor(s). MDPI and/or the editor(s) disclaim responsibility for any injury to people or property resulting from any ideas, methods, instructions or products referred to in the content.