Abstract
The value created by enterprise digitalization is not only reflected in economic value but also has social and environmental value. Using data on A-share listed companies in Shanghai and Shenzhen from 2010 to 2020 as research samples, empirically tested the impact and mechanism of enterprise digital transformation on the environmental, social, and governance (ESG) performance. Overall, enterprise digital transformation can significantly improve the ESG performance of enterprises. Further, the mechanism testing shows that there are three main driving factors in promoting digital transformation: restraining the short-sightedness of management; improving the transparency of the internal information of enterprises; and improving the technological innovation of enterprises. The conclusion of the study enriches the strategic level of enterprise sustainable development from the perspective of “resource allocation”, and reveals the “black box” of the causal relationship between digital transformation and enterprise ESG performance.
1. Introduction
ESG was first proposed by the United Nations Global Compact in the Environmental Planning and Financial Action agency [1]. The three letters in the ESG acronym stand for environmental, social, and corporate governance, respectively. In September 2015, the United Nations highlighted the role of digital technologies in enhancing sustainability in the 2030 Agenda’s Sustainable Development Goals (SDGs) [2], which included 17 goals and 169 specific projects. According to existing research, most digitalization has a positive impact on the sustainable development of enterprises, with the research starting from the macro perspective. ElMassah et al. (2020) used a sustainable development target (DESI) to study the inter-relationship between digitization and the Sustainable Development Goal (SDG) indicators [3]. The main characteristics of digitalization in promoting the sustainable development of Visegrad Group member countries have been proved through empirical study. Jinhui and Raghupathi (2015) demonstrated the relationship between digital factors (such as access, affordability, and institutional efficiency) and sustainability [4]. Further, Raul Gouvea et al. demonstrated the positive effect of digital transformation on economic and educational sustainability from the perspective of the interaction effect mechanism [5]. This study completed the transition from a macro to a micro level. Cartwright et al. introduced digital transformation into the field of business administration, establishing a relationship between digital transformation and production factors at the enterprise, such as human capital [6], operational efficiency [7], and financial performance [8] at the enterprise level [9]. As a new resource for enterprises, digitalization is an important part of the sustainable development of enterprises.
According to the above research, both the external environment and micro individuals have reached a consensus on the impact of digitalization on enterprise ESG performance. However, there is little research on the mechanism by which digital transformation affects enterprise ESG performance. As a comprehensive index of “management and environment”, how does digital transformation change the organizational ecosystem of enterprises? What is the driving force of digital transformation affecting enterprise ESG performance? The paper aims to answer these research questions. In addition to the external driving factors, it is crucial to enhance the ESG practice ability of enterprises and stimulate the internal motivation of enterprises.
Enterprise digitalization reshapes enterprise resource allocation through the information—sharing effect and the information—integration effect [10], and the information effect has greatly weakened the barriers to enterprise ESG disclosure. We intend to take the “logic (resource allocation structure)—foundation (resource flow)—realization (enterprise sustainable development)” system created by digital transformation as the main focus. Under this theoretical framework, we explore the collaborative relationship between them. This paper expounds on how enterprise digital transformation drives enterprise sustainable development from the above perspective.
Based on the above views, the contribution of this paper is as follows: First, this paper integrates environmental, social responsibility, and corporate governance (ESG) into a research system. From the perspective of organizational ecology theory, we investigate the systematic influence of enterprise digital transformation on enterprise sustainable development. It enriches the application of the theory in practical phenomena. Second, this paper enriches the mechanism of sustainable development. After explaining that enterprise digitalization can enable the high-quality development of enterprises, the transmission mechanism between the two is further clarified. This paper expounds on the underlying logic of digital transformation to enterprise sustainable development from a resource-driven perspective.
2. Literature Review and Hypothesis Development
2.1. Digitalization and Enterprise ESG Performance
According to the theory of enterprise organization ecology, organizations with a shared value proposition as the core depend on each other, co-evolve, and eventually form a multi-component self-organization consortium [10]. On the one hand, the ecosystem in the context of business management is based on the organization’s conscious strategic approach. It can optimize the internal members and resource allocation structure, which can continuously improve the vitality of the ecosystem. On the other hand, the evolution of a natural ecosystem is based on natural selection, and the change in internal resource structure (the increase/decrease in species) will reshape the ecological balance [11].
Over the past two decades, scholars in the field of strategic management [12] and information systems [13] have begun to pay special attention to digital transformation, and since 2019, a new round of research has been conducted. Top international journals such as Research Policy [14] and MIS Quarterly Executive [15] have even published special issues on the topic. Enterprise digital transformation challenges traditional management organizations. Enterprises combine digital technologies, such as information, computing, communication, and connectivity, to conduct a comprehensive, collaborative transformation of products, services, processes, models, and organizations [16]. Ultimately, business improvements build competitive advantage and produce ecological, industrial, and social effects [17].
Starting from the field of information systems, enterprise digital transformation mainly focuses on the disruptive restructuring of traditional product and service innovation theory via digital technology [18]. Digital technologies have infiltrated business opportunities, innovative products and services, and new business models [19]. We believe that digitalization, as a new form of resource, forms a logical chain of resource structuring, resource bundling, and resource allocation patterns [20]. First, enterprises define their strategic needs and formulate corresponding digital strategies through digital resources. Digital construction is a process of filtering out unnecessary resources in digital transformation and adjusting the enterprise resource structure changes [21]. Second, the combination of digitalization and enterprise resources can consolidate the existing digital resource base of enterprises while at the same time enriching and developing new digital resources and improving the digital level [22]. Finally, after forming the digital resources and capabilities required by the enterprise, the digital resources that can mobilize enterprise innovation need to be used to coordinate the distribution of digital resources among various departments [23]. The internal control [24], strategic management [25], and innovation capability [26] advantages of enterprises are improved, which facilitates the realization of the sustainable development of enterprises [27]. These changes changed the existing governance framework from strategic control to financial control. This innovative management mechanism and management control help to cope with industrial transformation to meet the needs of key stakeholders [28], which in turn promotes the development of enterprise ESG. Therefore, we hypothesize the following:
H1:
There is a positive relationship between enterprise digitalization and ESG performance.
2.2. Enterprise Digital Transformation, Management Myopia and Enterprise ESG
Although the existing literature on enterprise digital transformation and enterprise ESG has increased in size and scope, a review of the above research reveals that there is still a lack of studies examining the mechanism of environmental practice (change) at the enterprise level. Manager short-termism reflects the personal characteristics of managers’ time cognition. Managers are not only responsible for enterprise planning but also for participating in the implementation process of the plan. Therefore, managers are both planners and implementors, influencing managers’ behaviors and strategic choices [29]. On the one hand, under the planner–executor model of behavioral economics, managers have the ability to consider the long-term development goals of enterprises and to take the long-term welfare of enterprises as the strategic direction. On the other hand, performers are obsessed with short-term goals [30], and they have short-sighted behaviors due to the status quo or financial pressure. Zeshan M et al. (2021) proved that digitization promotes employee autonomy. The human resource management system plays a positive intermediary role [31]. From the perspective of data elements, regional chains can ensure the communication, authenticity, and transparency of information along the chain, and enhance the willingness of all parties to share information [32], effectively extracting the quality of financing information to alleviate agency problems. The level of company digitalization inhibits the short-sighted behaviors of managers that results from intertemporal decision-making [33]. The negative correlation between managers’ short-sightedness and corporate sustainable development will be weakened. Thus, this paper presents the following hypothesis:
H2a:
Enterprise digitization could drive enterprise ESG by restraining management myopia.
2.3. Enterprise Digital Transformation, Information Transparency and Enterprise ESG
An information interaction system exists between enterprises and stakeholders. The information disclosure system of enterprises is not perfect, and it is easy for information asymmetry to form between the two sides. With the advancement of digitization, the high universality and permeability of digital technology create zero distance between enterprises and stakeholders. The information disclosure system between enterprises and stakeholders will also be comprehensively reshaped in the digital context [34]. This means that enterprise digitalization can greatly reduce the information asymmetry and interaction costs between enterprises and stakeholders, reducing the earnings management tendency driven by opportunism and improving the transparency of accounting information, thus creating a transparent space for deep value reciprocity with stakeholders.
The digital transformation of enterprises, especially the application of big data and blockchain technology, results in the activities of enterprises being recordable and traceable. It improves the transparency of internal information and reduces the information asymmetry between stakeholders and enterprises [35]. This increases the external supervision pressure on enterprises. Meanwhile, the application of digital technology also improves the quality and management ability of enterprise ESG information and reduces the cost of enterprise ESG information management and disclosure. This increases the internal incentive for enterprises to improve their internal governance and fulfill their social responsibilities. Therefore, we propose the following hypothesis:
H2b:
Enterprise digitalization could improve enterprise ESG by increasing investment in information transparency factors.
2.4. Enterprise Digital Transformation, Enterprise Innovation and Enterprise ESG
According to the natural resource-based view (NRBV) theory, the technological capability of enterprises is equal. The organizational elements are the basis of technological innovation and sustainable competitive advantage.
The technology-driving factors from the information stage, the environment level, and the level of participation in the intelligent stage run through each enterprise’s digital transformation stage [36]. The digital penetration of production means the digital reconstruction of production relations and digital business activities represent three dimensions of innovation [37]. The integration and innovation of new technologies and management modes of enterprises are realized to a large extent [38]. El Sawy et al. (2009) believe that enterprise internetization is an innovation in organizational management [39] that helps strengthen the ability to obtain the resources needed for operations, production, innovation, and other activities, along with the ability to save related expenses. For example, the research and development department focuses on the feasibility of green technology, the process department focuses on the green product manufacturing capacity, and the financial department focuses on the cost and return of green innovation [40]. The integration and exchange of key information from different departments through information technology will help reduce the ambiguity and uncertainty of innovation decision-making [41]. Digital transformation has laid the foundation for the green technology innovation ability of enterprises, and the continuous improvement in green technology in enterprises has reduced the cost of green production. Innovation enables enterprises to better practice environmental responsibility and to improve their corporate reputation, thus advancing the ESG performance of enterprises. Therefore, we propose the following hypothesis:
H2c:
Enterprise digitalization improves enterprise ESG by increasing investment in innovation factors.
Based on the above theoretical mechanisms and hypotheses, we designed a theoretical framework, as shown in Figure 1. In the subsequent pages, we present the empirical tests conducted following the theoretical framework.
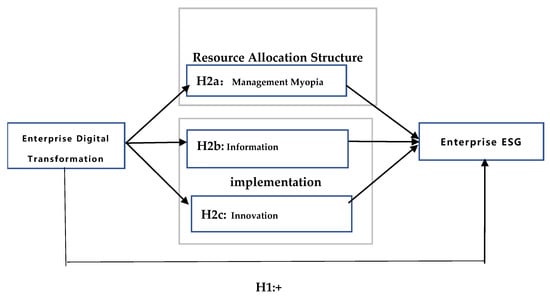
Figure 1.
Theoretical framework.
3. Method
3.1. Sample and Data
The financial data of listed companies used in this paper are derived from CSMAR (China Stock Market & Accounting Research Database), and the number of invention patents comes from the IncoPat database. In 2010, China’s Ministry of Environmental Protection issued the Guidelines for Environmental Information Disclosure of Listed Companies (draft for public comment). According to the World Trade Organization, the digital economy accounted for more than 20 percent of global GDP for the first time in 2010. The time interval of the sample is from 2010 to 2020, with reference to Hu Jie et al. (2020) [42]. In this paper, these data are screened as follows: (1) the delisted companies are excluded; (2) companies with missing data are eliminated; (3) the sample of companies with negative owner’s equity values are excluded; and (4) samples with an abnormal asset-liability ratio based on relevant accounting standards are eliminated.
3.2. Dependent Variables
According to the CSRC’s annual report information disclosure principles, enterprises need to disclose the MD&A content of “Management Discussion and analysis” in the annual report of listed companies. Generally speaking, the more enterprises attach importance to and implement a digital strategy, the more they are inclined to disclose “digitalization” related information. In view of this, with the help of the semantic expression of national policies related to the digital economy, this paper establishes a relatively complete digital dictionary. Using the text analysis method based on machine learning, this paper constructs an index to reflect the digitalization degree of Chinese listed enterprises.
The specific steps are as follows: First, combining government reports and digital-related reports, the “thesaurus method” is used to screen specific texts to construct the “digitalized” thesaurus. Second, the MD&A (Management Discussion and Analysis) content in the annual report of the enterprise is extracted, and the JieBA word segmentation tool in Python is used to segment the MD&A content and eliminate the suspended words. Finally, the frequency of digital keywords in the MD&A of each enterprise is counted, and the proportion of digital keyword frequency in MD&A to the total word frequency of MD&A (DIG) is used as the proxy variable of enterprise digitalization degree [43]. For ease of expression, this index is multiplied by 100. The larger the Digital index value, the higher the digitalization degree of the enterprise. For ease of expression, this index is multiplied by 100. The larger the Digital index value, the higher the digitalization degree of the enterprise.
3.3. Independent Variable
Corporate ESG performance: We adopt the Huazheng ESG rating system, which divides ESG performance into nine grades (AAA–CCC) and assigns points for ESG using the scoring system. The ESG evaluation of Huazheng covers all A-share listed companies and more than 2000 bond subjects. It is updated quarterly and temporarily adjusted when major events occur in listed companies. The evaluation system consists of three first-level indicators (environment, society, and governance), 14 s-level indicators, 26 third-level indicators, and more than 130 underlying data indicators. The higher the score, the better the ESG performance.
3.4. Moderating Variables
3.4.1. Management Myopia
Referring to the research of Kim and Verrecchia (2001), we adopt the KV model to measure the quality of corporate information disclosure and reflect the degree of information asymmetry [35]. The KV model measurement method is used to judge the evaluation of the company’s disclosure quality from the perspective of investors, and it is a measure index of the degree of information asymmetry, which has been widely used in existing studies.
This method can avoid the accounting variables by easily accrued profits and earnings management to produce a series of problems. The use of corporate information by investors is a relatively objective and comprehensive indicator to measure the degree of information asymmetry between principals and agents, including an evaluation of the quality of mandatory information disclosure and voluntary information disclosure [44]. The higher the KV index, the lower the quality of information disclosure.
3.4.2. Information Transparency
Accrual earnings management: Discretionary accruals calculated by the modified Jones model measure information transparency from the perspective of earnings fluctuations [45], with the specific model outlined below.
The relevant indicators are explained as follows: TA is the difference between operating profit and net cash flow generated by operating activities; A represents total assets; ΔREV stands for the increment of operating revenue; ΔREC denotes the increment of accounts receivable; PPE refers to the original value of fixed assets; IA is intangible assets and other long-term assets; and μ represents the residual discretionary accruals of the regression model, denoted as DA. The sum of absolute discretionary accruals of the past three years is taken as a measure of information transparency, denoted as Opaque. The larger the value, the more opaque the information.
Use the OLS (Ordinary Least Squares) method to estimate α1, α2, and α3 by year and industry, respectively, for Model (3), then substitute the estimation coefficient into Model (4) to calculate the non-manipulative accrual earnings and finally substitute the non-manipulative accrual earnings estimated according to Model (4) into Model (5), to obtain the manipulative accrual earnings (DA) [46].
TAt/At − 1 = α1(1 At − 1) + α2(ΔREVt/At − 1) +α3(PPEt/At − 1) + εt
NDAt = α1(1 At − 1) + α2(ΔREVt/At − 1 − ΔRECt/At − 1) + α3(PPEt/At − 1)
DAt =TAt/At − 1 − NDAt
3.4.3. Innovation
Innovation: According to An et al., variable innovation represents the innovation activities of enterprises; specifically, we use the ratio of capitalized R&D input (expenditure) to R&D input as a mediating variable for innovation. On this basis, the logarithm is derived [47].
3.5. Control Variables
3.5.1. Index of Marketization
We adopt the published marketization index to measure the overall marketization degree of the region. The value consists of five parts: the relationship between government and the market; the development of a non-state economy; the development of a product market; the development of a factor market; the development of an intermediary organization; and the development of law. The index was then fitted by the respective scores.
3.5.2. Rate of Return on Total Assets
ROA is the enterprise profit ratio, with the total value of enterprise assets, on average, said to be the capital profit margin. This is an index to reflect the effect of the comprehensive utilization of enterprise assets, as well as an important index to measure the profits obtained by enterprises using the total amount of creditors and owners’ equity.
3.5.3. Cash Holdings
Cash holdings are equal to the ratio between monetary funds and tradable financial assets and total assets, reflecting a company’s ability to hold cash.
3.5.4. TobinQ
TobinQ is one of the factors affecting the effectiveness of monetary policy. It is defined as the ratio of the market value of an asset to its replacement value. It can also be used to measure whether the market value of an asset is overvalued or undervalued.
3.5.5. IA
The number of internet broadband access users in the company’s province is measured in 10,000 households.
3.5.6. Size
This variable indicates the logarithm of the total assets of the firm.
3.5.7. Big4
This variable indicates whether the company is audited by a Big Four accountant.
3.5.8. Age
This variable indicates the logarithm of the number of years an enterprise has been established.
3.6. Data Description
Our data are described in Table 1.

Table 1.
Descriptive statistics for each variable.
3.7. Model Specification
To explore the impact of digital transformation on firm ESG scores, according to the above theoretical analysis, we constructed a panel regression model with two-way fixed effects at the firm level:
where DIG is firm digital transformation; ESG stands for environmental, social, and governance performance; denotes a series of control variables at the firm level; and represent unobserved effects of firm i in year t; represents the error term, and robust standard error is the firm aggregation level.
In order to explore how enterprise digitalization improves enterprise ESG performance through management myopia, information transparency, and enterprise innovation, we used Wen Zhonglin’s three-stage mediation effect test method for reference to build models (5)–(10). The model is constructed as follows:
First, examine the impact of enterprise digital transformation on enterprise ESG performance (relevant results have been listed in benchmark regression), and check whether the α1 coefficient is significant. The second step is to test the influence of enterprise digitization on intermediary variables and check whether α3, α5, and α7 coefficients are significant. The third step is to add mediating variables into the regression model of Step 1, focusing on the coefficients and symbols of mediating variables and enterprise ESGs, so as to determine whether the mediating effect is effective. If at least one of α3, α5, α7, β1, β2, and β3 is not significant, the Sobel test should be performed to further determine the existence of intermediaries.
4. Empirical Results
4.1. Basic Regression Results
The results of the main regression model of this paper are shown in Table 2. The empirical results of this paper show that enterprise digitalization has a significant promoting effect on improvement in enterprise ability. Furthermore, taking the proportion of digital-related intangible assets in the total amount of intangible assets (DIG) as the core explanatory variable and enterprise ESG as the explained variable, Model (4) is used for empirical analysis. Table 2 reports the results of the benchmark regression and the results of baseline regression. When replacing the control of fixed effect and the standard error clustering level, the results remain the same and have a certain robustness. The coefficients of DIG are all significantly positive, indicating that enterprise digitalization can significantly promote improvement at the enterprise ESG level. The results show that, when controlling for different fixed effects and different standard error clustering levels, the coefficients of ESG are significantly positive, indicating that enterprise digitalization can significantly promote improvement in enterprise ESG.
Table 2.
The impact of the degree of digitalization: results of benchmark regression.
4.2. Robustness Tests
We evaluate the robustness of our findings that firm digitalization promotes firm DIG using three different tests. First, we perform the endogeneity test. There are two factors that affect both the degree of digitalization and the sustainability of enterprises: local policy support and exogenous shocks from the industry. Factors of the degree of firm digitalization and the level of firm DIG, such as relevant local policy support and the exogenous impact of the industry, may simultaneously impact a number of enterprises. Therefore, this paper adopts two methods to alleviate the endogeneity problem. First, by referring to the research of Zhao Kui et al. (2021), the impacts of local-related policies and exogenous shocks at the industry level are controlled, respectively, by controlling the fixed effects of the region–year and industry–year. This verifies the robustness of our results to some extent [48].
Second, based on Lewbel’s (2021) research ideas, instrumental variables are constructed for the level of firm digitalization. The method of constructing instrumental variables proposed by Lewbel (2021) [49] assembles effective internal instrumental variables without the help of external factors. The above method is helpful in eliminating the endogeneity bias to a certain extent. To be specific, we adapt the sustainable search frequency of Baidu Internet in this region as an instrumental variable.
Columns (1) and (2) of Table 3 report the regression results of the IV estimates. The Kleibergen-PaaprkLM statistic is significant at the 1% level, which rejects the null hypothesis of insufficient identification of instrumental variables. The Cragg-Donald-Wald F statistic is larger than the Stock-Yogo, and the critical value of the F test of weak instrumental variable identification at a 10% significance level rejects the null hypothesis of weak instrumental variables. The above tests show that the instrumental variables selected in this paper are reasonable and reliable. In the IV estimation results, the estimated coefficient of DIG is significantly positive, indicating that the main conclusions of this paper are still valid. We replace the enterprise digital measurement method to further carry out the robustness test. Based on Python, the data pool formed by extracting the text of the annual report of listed enterprises is searched, matched, and counted according to the feature words in Figure 1, then the word frequencies of key technical directions are classified and collected to form the final total word frequency, to construct the index system of enterprise digital transformation. As shown in column (3) of the table, the coefficient of DIG is still positive and passes the significance of 1%. The above indicates the robustness of the conclusion.
Table 3.
Robustness tests.
4.3. Moderation in the Relationship between Firm Digitalization and ESG Scores
Table 4 reports the incentive effects of enterprise digitalization on ESG performance. To further examine the relationship between enterprise digitalization and ESG score, we investigate the mediating roles of corporate governance in this relationship. Model 1 tests the impact of the degree of digitization on firm ESG. These results support H1. We examine the intermediary path of the influence of enterprise digital transformation on enterprise ESG performance from three perspectives: management myopia, information transparency, and enterprise innovation.
Table 4.
Mechanism test results.
Column (1) provides evidence that KV is negatively correlated with digitization; in other words, digitization promotes the quality of information disclosure and inhibits the short-sightedness of managers. The estimation results of the third step are shown in column (2). The coefficient of myopia is not significantly positive; additionally, the absolute value of the DIGs coefficient decreases. This shows that management myopia plays a complete intermediary role. Columns (1) and (2) provide evidence that firm digitization significantly increases the ESG level via management myopia reduction. Effective checks and balances among shareholders can prevent major shareholders from enabling short-sighted and aggressive managers. Firm digitization assists management myopia by improving the right to participate in decision-making and, as a consequence, improving corporate social responsibility [50]. Therefore, our results support H2a.
Columns (3) and (4) report the test results of information transparency, respectively. Column (3) shows that the influence coefficient of enterprise digitalization on the transparency of internal control information disclosure is significantly negative. This result indicates that the digital transformation of enterprises enhances the transparency of enterprise information. Further, column (4) reports a significant and positive ESG coefficient. In addition, the impact coefficient is 5.26, which is lower than the coefficient of 6.462 of the model estimation result, suggesting the existence of a mediating effect. Firm digitalization strengthens the value transparency space of firms to strengthen their internal control and facilitate digital transfers.
Column (5) indicates a positive relationship between firm digitalization and innovation. In other words, firm digitalization promotes enterprise innovation. In addition, column (6) reports an insignificant DIG coefficient. This conforms with the test result in columns (2) and (4), where the ESG coefficient is smaller than the coefficient of the column. Therefore, we identify that a mediating effect exists. The application of digital technology at the enterprise level can expand the allocation range of innovation resources. Enterprises are encouraged to carry out joint innovation, which can also improve their ability to make independent technological innovations based on existing technologies [51]. Enterprises provide the impetus to enterprise ESG by optimizing innovative technology resources. Our test results are in support of H2c.
5. Heterogeneity Analysis
5.1. Heterogeneity Analysis Based on Property Rights
It is common to discuss the dual structure of state-owned enterprises and private enterprises in sustainable development research [52]. There are significant differences between the two in corporate governance policy, implementation of environmental protection strategies, and digital resource allocation efficiency. For further analysis, this paper divides the sample enterprises into state-owned enterprises and non-state-owned enterprises according to different enterprise property rights and explores the impact of digitalization on enterprise sustainability from the perspective of property rights heterogeneity. It can be seen from column (2) of Table 5 that the digital transformation coefficient of enterprises is positive, and state-owned enterprises are higher than non-state-owned enterprises. State-owned enterprises have advantages in resource allocation on digital platforms, but they are limited by the endogeneity of social responsibilities and the compulsion of policies. This is because state-owned enterprises have strong political ties to the government. They are more likely to receive support from the government and financial institutions to carry out digital reforms. Moreover, as an important pillar of the national economy, state-owned enterprises bear the dual responsibilities of considering both economic and social benefits. Therefore, they play a more exemplary role in policy implementation and need to set an example in fulfilling ESG responsibilities. In the era of the digital economy, state-owned enterprises have more responsibilities to conform to the trend of the times, promote their digital transformation, and shoulder more social responsibilities. In contrast, most non-state-owned enterprises do not have very good digital platform resources. They do not have the burden of having a sense of social responsibility either. The concept of ESG is significantly lower for them than that of state-owned enterprises. Enterprise ownership affects the business concept of enterprises, which is naturally one of the factors of digital transformation with regard to enterprise ESG.
Table 5.
Results of heterogeneity analysis on Firm.
5.2. Heterogeneity Analysis Based on the Environmental Sensitivity of Polluting Industries
As the economy faces structural problems, such as environmental constraints and overcapacity, resource misallocation becomes increasingly obvious in terms of regional heterogeneity and industry characteristics. Factors such as macro resource misallocation, secondary capital misallocation caused by credit discrimination, and the horizontal diversion of green innovation technology all impact the difference between enterprise ESG performance in industry sensitivity and productivity. In this paper, whether a firm is in a heavily polluting industry or not is taken as the evaluation standard for sensitivity to the industry. We explore the differences between the digital transformation of enterprises with different industry sensitivities. As shown in columns (3) and (4) of Table 5, the digital transformation coefficients of enterprises are all positive, and the significance of polluting industries is better, which is consistent with the main conclusions above. The digital transformation of polluting industries has a higher impact on corporate sustainability than that of non-polluting industries. Enterprises in polluting industries will have higher transparency and more attention paid to social responsibility due to their digital transformation. The endorsement of ESG sends a positive signal of green transformation to the market. Such enterprises are more willing to improve their sustainable development performance.
5.3. Heterogeneity Analysis Based on the Marketization Degree
Market operation is affected by external influences such as industry environment, competition, and market supply and demand. Enterprises adjust their strategies according to their conditions, so the digital transformation of enterprises is inevitably affected by the degree of marketization. Both the “direct impact”, represented by the resource mismatch caused by market differences, and the indirect impact, represented by market competition, will affect the digital transformation of enterprises. Different regions have different marketization processes, which means that enterprises are located in different regions with regard to resource allocation. Based on the above reasons, this paper uses the marketization index of the same province to measure the overall marketization degree of this region. Data samples higher than the market median of the same province in the same year are taken as the high marketization group, and the opposite is taken as the low marketization group. As can be seen from columns (5) and (6) in Table 5, the digital transformation coefficients of the enterprises are both positive and significant. The digital platform configuration of enterprises with a high degree of marketization is definitely higher than that of the group with a low degree of marketization. The enterprises with a high degree of marketization occupy the areas with high resource allocation. Encouraging open innovation practices through efficient information transfer and knowledge accumulation will help further motivate enterprises to engage in more green innovation activities, thus stimulating the sustainable development of enterprises.
5.4. Heterogeneity Analysis Based on the Enterprise Life Cycle
In different life cycle stages, there are obvious differences in the scale, profitability, investment strategy, research, and development ability of enterprises. With the development of the national digital economy, the penetration degree of individual enterprises implementing digital transformation will be very different. The implementation system of ESG in China is still immature, and enterprises’ investment in ESG is also heterogeneous at different strategic stages. Based on the cash flow model method adopted by Dickinson (2011) [53], this paper divides the life cycle of an enterprise according to the positive and negative net cash flows generated by its operation, investment, and financing activities. This method is more accurate than the traditional division based on univariate methods such as age, size, and profitability. At the same time, it can avoid the error brought by subjective judgment. The specific results are shown in Table 6.
Table 6.
Results of heterogeneity analysis on the enterprise life cycle.
It can be seen from Table 6 that the coefficients of the dig are all positive, which is consistent with conclusion (1) of this paper. However, in the growth stage of the enterprise, the coefficient of DIG did not pass the significance test. In this period, the enterprise was in the early stage, and the investment in the digital platform was still in the investment stage. So, it would take some time to give full play to the advantages of the enterprise’s digital resources. Moreover, if the enterprise invests money in non-profit goals at this time, it means that the company has few resources to pursue profit goals. Such investment cannot bring better development conditions for the enterprise at this stage [54]. Therefore, in the growth period of enterprises, digital transformation has no significant correlation with enterprise ESG. Finally, for enterprises in the recession period, due to the aging of enterprise digital equipment, technology obsolescence, and other reasons. Coupled with the acceleration of technology iteration, it is difficult for enterprises to maintain ESG performance. The advantages of digitization will be much reduced. Therefore, digital transformation, as a new resource, maximizes the marginal effect when an enterprise matures.
6. Conclusions
In recent years, with continuous breakthroughs and development, digital technology has become deeply embedded and integrated with the traditional production mode of enterprises. It is becoming an important strategic choice for enterprises to achieve high-quality development. Enterprise digital transformation is highly systematic and is a process of “quantitative change” leading to “qualitative change”. How to collaborate with digital resources and find the “module building” of sustainable practices to strengthen ESG is an issue we need to address. We also support the organizational ecosystem theory. As an integrated system of “environment, society and corporate governance”, ESG is the further application of this theory in modern business management organizations. In view of this, we try to respond to the issue from the perspective of resource allocation, taking the “logic (resource allocation structure)—foundation (resource flow)—realization (enterprise sustainable development)” system created by digital transformation as the main focus. This perspective enriches the application of organizational ecological theory from the perspective of system dynamics. This perspective enriches the application of organizational ecological theory from the perspective of system dynamics. This paper expounds on how enterprise digital transformation can coordinate the sustainable development of the enterprise and draws the following conclusions.
Through digital resources, enterprises can identify their needs, formulate corresponding digital strategies, filter out unnecessary resources in digital transformation, and change the resource structure of enterprises. The bundling mode of digitalization and enterprise resources can consolidate the existing digital resource base of enterprises, enrich and develop new digital resources and improve the digitalization level. Finally, it can make use of digital resources that can mobilize enterprise innovation and coordinate the allocation of digital resources among various departments. The enterprise enhances its advantages in internal control, strategic management, and innovation capability and increases its ESG performance. Enterprise digitalization can weaken the information barriers between companies. From the perspective of data elements, regional chains can ensure the intercommunication, authenticity, and transparency of information on the chain. Digital platforms greatly reduce information asymmetry and interaction costs between enterprises and stakeholders. The level of company digitalization inhibits the short-sighted behavior caused by the intertemporal decisions of managers. It reduces the tendency of opportunism-driven earnings management and improves the transparency of accounting information. Accordingly, the application of digital technology improves the information quality and management ability of enterprise ESG. This is because the cost of ESG information management and disclosure is reduced, and the internal governance of enterprises is improved, with better internal incentives to fulfill social responsibilities. In terms of resource flow, digital transformation lays the foundation for the green technology innovation capability of enterprises. Continuous improvement in the green technology level of enterprises provides better technical support for the sustainable development of enterprises. Innovation encourages companies to practice environmental responsibility more effectively.
Further research shows that the effect of the above mechanism is more significant in state-owned enterprises, heavily polluting enterprises, and enterprises with a high degree of marketization. These conclusions enrich the strategic level of sustainable development from the perspective of research and provide policy inspiration for promoting the development of ESG in China. Based on the above research conclusions, we believe that enterprises should seize the opportunities brought by the digital economy and actively introduce the new generation of cutting-edge digital information technology.
7. Discussion
As far as possible, digital technology is applied to all stages of enterprise production and management activities. Promote enterprise green technology innovation, and improve enterprise internal management information transparency, enterprise decision-making, and management efficiency, so as to improve enterprise ESG performance.
First, from a government perspective, as a micro subject of economic operation, determining how to grasp digital resources is the key to realizing high-quality economic transformation and upgrading. Therefore, the government should encourage the integration of the digital economy with the real economy. Furthermore, a positive and favorable external market environment should be created for enterprises to carry out digital transformation, and they should be encouraged to deeply integrate the high-speed development of the new generation of digital information technology with traditional production, research and development, management and marketing. The autonomy and effectiveness of market players should be ensured in sustainable strategies, and factor flow barriers caused by credit discrimination and resource mismatch be removed. Moreover, for state-owned enterprises, the government should strengthen and improve infrastructure construction and other sectors that deeply integrate big data, cloud computing, and finance. The digital platform can make the state-owned capital chain more transparent and realize the tracking and supervision system of state-owned enterprise projects. To achieve the purpose of evaluating the ESG performance at any time, the capital and technical support effect can play a better role in the construction of state-owned enterprises’ ESG. While for non-state-owned enterprises, the government should launch special financing projects and channels for non-state-owned enterprises’ environmental governance, social responsibility, and internal governance to “target” the construction of enterprise ESG. Special attention should be paid to guiding resources from inefficient enterprises to efficient enterprises in heavily polluting industries to accurately encourage enterprises to reduce emissions.
Second, from the perspective of enterprises, innovation is an important driving force for enterprises to promote high-quality development through digitalization. Enterprises should attach importance to ESG development of green innovation strategy. According to the practice of green innovation, the production mode will be changed from “light green production” to “dark green production”. Enterprises should also build the internal organizational system of collaborative enterprises through digitization. Achieve a positive cycle of economic and social benefits. The performance of ESG should be included in the assessment requirements of enterprise platform management to reduce the negative impact of incentive dislocation.
Despite the positive results, there are some limitations of this research. First, based on the perspective of resource allocation, we studied the impact of digital transformation on enterprise sustainability through three intermediary variables. We only discuss the angle of digital information sharing, which is relatively general. Future research would be well placed to dig deeper into how algorithms are designed and maintained to further investigate the implications of the shift to AI-driven alternative ESG ratings. Secondly, in the expanded analysis, the paper discusses the impact of enterprise digital transformation on ESG performance from the perspective of enterprise ownership and industry characteristics. If external adjustment variables such as the degree of marketization and preferential tax policies for digital transformation are added, it will have more practical significance in China’s national conditions. Finally, the digital supply chain is a hot topic of current research, which provides a new research direction for us.
Author Contributions
Conceptualization and formal analysis, H.Z.; methodology and software, Y.Z.; writing and editing, T.Y. All authors have read and agreed to the published version of the manuscript.
Funding
This work was supported by the Shanghai Philosophy and Social Science Planning Project fund (grant number: 2021BGL001); Jiangsu University Philosophy and Social Science Research Project fund (grant number: 2021SJA1645); the Fundamental Research Funds for the Central Universities and Graduate Student Innovation Fund of Donghua University (grant number: CUSF_DH_D_2022054).
Institutional Review Board Statement
Not applicable.
Informed Consent Statement
Not applicable.
Data Availability Statement
The data are available upon request from the corresponding author.
Conflicts of Interest
The authors declare no conflict of interest.
References
- Wong, W.C.; Batten, J.A.; Ahmad, A.H.; Mohamed-Arshad, S.B.; Nordin, S.; Adzis, A.A. Does ESG certification add firm value? Financ. Res. Lett. 2021, 39, 101593. [Google Scholar] [CrossRef]
- Bexell, M.; Jönsson, K. Realizing the 2030 Agenda for sustainable development—Engaging national parliaments? Policy Stud. 2022, 43, 621–639. [Google Scholar] [CrossRef]
- ElMassah, S.; Mohieldin, M. Digital transformation and localizing the Sustainable Development Goals (SDGs). Ecol. Econ. 2020, 169, 106490. [Google Scholar] [CrossRef]
- Raghupathi, W.; Wu, S.J.; Raghupathi, V. The role of information and communication technologies in global sustainability: A review. J. Environ. Manag. 2014, 2, 123–145. [Google Scholar] [CrossRef]
- Gouvea, R.; Li, S.; Montoya, M. Does transitioning to a digital economy imply lower levels of corruption? Thunderbird Int. Bus. Rev. 2022, 64, 221–233. [Google Scholar] [CrossRef]
- Backman, M. Human capital in firms and regions: Impact on firm productivity. Pap. Reg. Sci. 2014, 93, 557–575. [Google Scholar] [CrossRef]
- Heppelmann, J.E.; Porter, M.E. How Smart, Connected Products Are Transforming Competition. Harv. Bus. Rev. 2014, 92, 65–82,84,86,88. [Google Scholar]
- Ionaşcu, I.; Ionaşcu, M.; Nechita, E.; Săcărin, M.; Minu, M. Digital Transformation, Financial Performance and Sustainability: Evidence for European Union Listed Companies. Amfiteatru Econ. 2022, 24, 94–109. [Google Scholar] [CrossRef]
- Andal-Ancion, A.; Cartwright, P.A.; Yip, G.S. The Digital Transformation Of Traditional Businesses. MIT Sloan Manag. Rev. 2003, 44, 34–41. [Google Scholar]
- Anderson, P. Perspective: Complexity theory and organization science. Organ. Sci. 1999, 10, 216–232. [Google Scholar] [CrossRef]
- Wareham, J.; Fox, P.B.; Cano Giner, J.L. Technology ecosystem governance. Organ. Sci. 2014, 25, 1195–1215. [Google Scholar] [CrossRef]
- Strange, R.; Chen, L.; Fleury, M.T.L. Digital Transformation and International Strategies. J. Int. Manag. 2022, 28, 100968. [Google Scholar] [CrossRef]
- Wetering, R.v.d. The Role of Enterprise Architecture for Digital Transformations. Sustainability 2021, 13, 2237. [Google Scholar] [CrossRef]
- Nambisan, S.; Wright, M.; Feldman, M. The digital transformation of innovation and entrepreneurship: Progress, challenges and key themes. Res. Policy 2019, 48, 103773. [Google Scholar] [CrossRef]
- Gurbaxani, V.; Dunkle, D. Gearing Up For Successful Digital Transformation. MIS Q. Exec. 2019, 18, 209–220. [Google Scholar] [CrossRef]
- Wimelius, H.; Mathiassen, L.; Holmström, J.; Keil, M. A paradoxical perspective on technology renewal in digital transformation. Inf. Syst. J. 2021, 31, 198–225. [Google Scholar] [CrossRef]
- Lian, X. Driving Effect of Digital Technology on Service Transformation of Shanghai Manufacturing Enterprises—Based on Fixed Effect Model. Adv. Appl. Math. 2022, 11, 6394–6400. [Google Scholar] [CrossRef]
- George, G.; Schillebeeckx, S.J.D. Digital transformation, sustainability, and purpose in the multinational enterprise. J. World Bus. 2022, 57, 101326. [Google Scholar] [CrossRef]
- Cetindamar, D.; Phaal, R. Technology Management in the Age of Digital Technologies. IEEE Trans. Eng. Manag. 2021, 1–9. [Google Scholar] [CrossRef]
- Osarenkhoe, A.; Fjellström, D. The Oxymoron of Digitalization: A Resource-Based Perspective. J. Inf. Technol. Res. 2021, 14, 122–138. [Google Scholar] [CrossRef]
- Gray, J.; Rumpe, B. Models for the digital transformation. Softw. Syst. Model. 2017, 16, 307–308. [Google Scholar] [CrossRef]
- Ahuja, S.; Chan, Y.E.; Krishnamurthy, R. Responsible innovation with digital platforms: Cases in India and Canada. Inf. Syst. J. 2022, 33, 76–129. [Google Scholar] [CrossRef]
- Straub, D.W.; Watson, R.T. Research Commentary: Transformational Issues in Researching IS and Net-Enabled Organizations. Inf. Syst. Res. 2001, 12, 337–345. [Google Scholar] [CrossRef]
- Koo, J.E.; Ki, E.S. Internal Control Personnel’s Experience, Internal Control Weaknesses, and ESG Rating. Sustainability 2020, 12, 8645. [Google Scholar] [CrossRef]
- Barykin, S.E.; Borisoglebskaya, L.N.; Provotorov, V.V.; Kapustina, I.V.; Sergeev, S.M.; Plaza, E.D.L.P.; Saychenko, L. Sustainability of Management Decisions in a Digital Logistics Network. Sustainability 2021, 13, 9289. [Google Scholar] [CrossRef]
- Abbate, T.; Coppolino, R.; Schiavone, F. Linking Entities in Knowledge Transfer: The Innovation Intermediaries. J. Knowl. Econ. 2013, 4, 233–243. [Google Scholar] [CrossRef]
- Fichman, R.G.; Dos Santos, B.L.; Zheng, Z. Digital Innovation as a Fundamental and Powerful Concept in the Information Systems Curriculum. MIS Q. 2014, 38, 329–354. [Google Scholar] [CrossRef]
- Saleem, I.; Khan, M.N.A.; Hasan, R.; Ashfaq, M. Corporate board for innovative managerial control: Implications of corporate governance deviance perspective. Corp. Gov. Int. J. Bus. Soc 2020, 21, 450–462. [Google Scholar] [CrossRef]
- Hambrick, D.C.; Mason, P.A. Upper Echelons: The Organization as a Reflection of Its Top Managers. Acad. Manag. Rev. 1984, 9, 193–206. [Google Scholar] [CrossRef]
- Brochet, F.E.A.; Loumioti, M. Speaking of the short-term: Disclosure horizon and managerial myopia. Rev. Account. Stud. 2015, 20, 1122–1163. [Google Scholar] [CrossRef]
- Zeshan, M.; Qureshi, T.M.; Saleem, I. Impact of digitalization on employee’s autonomy: Evidence from French firms. VINE J. Inf. Knowl. Manag. Syst. 2021. [Google Scholar] [CrossRef]
- Gangi, F.; Varrone, N.; Daniele, L.M.; Coscia, M. Mainstreaming socially responsible investment: Do environmental, social and governance ratings of investment funds converge? J. Clean. Prod. 2022, 353, 131684. [Google Scholar] [CrossRef]
- McBrayer, G.A. Does persistence explain ESG disclosure decisions? Corp. Soc. Responsib. Environ. Manag. 2018, 25, 1074–1086. [Google Scholar] [CrossRef]
- Aerts, W.; Cormier, D.; Magnan, M. The Association Between Web-Based Corporate Performance Disclosure and Financial Analyst Behaviour Under Different Governance Regimes. Corp. Gov. Int. Rev. 2007, 15, 1301–1329. [Google Scholar] [CrossRef]
- Klingebiel, R.W.B.S. Resource allocation strategy for innovation portfolio management. Strateg. Manag. J. 2014, 35, 246–268. [Google Scholar] [CrossRef]
- Li, Y. Enterprise Digital Transformation and Enterprise Value. Adv. Appl. Math. 2022, 11, 5986–5993. [Google Scholar] [CrossRef]
- Zander, U.; Kogut, B. Knowledge and the Speed of the Transfer and Imitation of Organizational Capabilities: An Empirical Test. Organ. Sci. 1995, 6, 76–92. [Google Scholar] [CrossRef]
- Mann, S. Phenomenal Augmented Reality: Advancing technology for the future of humanity. IEEE Consum. Electron. Mag. 2015, 4, 92–97. [Google Scholar] [CrossRef]
- El Sawy, O.A.; Malhotra, A.; Gosain, S.; Young, K.M. IT-intensive value innovation in the electronic economy: Insights from Marshall Industries. MIS Q. 1999, 23, 305–335. [Google Scholar] [CrossRef]
- Li, J.; Li, S. Environmental protection tax, corporate ESG performance, and green technological innovation. Front. Environ. Sci. 2022, 10, 1512. [Google Scholar] [CrossRef]
- Tariq, A.; Badir, Y.; Tariq, W.; Bhutta, U. Drivers and consequences of green product and process innovation: A systematic review, conceptual framework, and future outlook. Technol. Soc. 2017, 51, 8–23. [Google Scholar] [CrossRef]
- Hu, J.; Han, Y.N. How does Enterprise Digital Transformation affect Enterprise ESG Performance: Evidence from Chinese Listed Companies. Ind. Econ. Rev. 2022, 68, 1–20. [Google Scholar]
- Yuan, C.; Xiao, T.-S.; Geng, C.-X.; Sheng, Y. Digital transformation and division of labor: Specialization or Vertical integration. China Ind. Econ. 2021, 9, 137–155. [Google Scholar]
- Day, G.S.U.P.; Nedungadi, P. Managerial representations of competitive advantage. J. Mark. 1994, 58, 31. [Google Scholar] [CrossRef]
- Dechow, P.M. Detecting Earnings ManagementDetecting Earnings Management. Account. Rev. 1995, 70, 193–225. [Google Scholar]
- Kothari, S.P.; Leone, A.J.; Wasley, C.E. Performance matched discretionary accrual measures. J. Account. Econ. 2005, 39, 163–197. [Google Scholar] [CrossRef]
- Song, D.; Zhu, W.; Ding, H. Can Enterprise Digitization Promote green technology Innovation?—Based on the investigation of listed companies in heavily polluting industries. Huazhong Univ. Sci. Technol. 2022, 48, 34–48. [Google Scholar]
- Courtemanche, C.; Pinkston, J.C.; Stewart, J. Time spent exercising and obesity: An application of Lewbel’s instrumental variables method. Econ. Hum. Biol. 2021, 41, 100940. [Google Scholar] [CrossRef]
- Zhao, K.; Hou, Q.; Li, W. Spillover effect of Capital City economic development: Based on the analysis of industrial enterprise data. School of Management. Huazhong Univ. Sci. Technol. 2021, 56, 150–166. [Google Scholar]
- Forman, C.; Ghose, A.; Wiesenfeld, B. Examining The Relationship Between Reviewsand Sales: The Role Of Reviewer Identity disclosure In Electronic Markets. Inf. Syst. Res. 2008, 19, 291–313. [Google Scholar] [CrossRef]
- Zhang, Z.; Jin, J.; Li, S.; Zhang, Y. Digital transformation of incumbent firms from the perspective of portfolios of innovation. Technol. Soc. 2022, 72, 102149. [Google Scholar] [CrossRef]
- Khalid, F. Environmental, Social and Governance Performance of Chinese Multinationals: A Comparison of State- and Non-State-Owned Enterprises. Sustainability 2021, 13, 4020. [Google Scholar] [CrossRef]
- Kretschmer, T.; Khashabi, P. Digital transformation and organization design: An integrated approach. Calif. Manag. Rev. 2020, 62, 86–104. [Google Scholar] [CrossRef]
- Dickinson, V. Cash flow patterns as a proxy for firm life cycle. Account. Rev. 2011, 86, 1969–1994. [Google Scholar] [CrossRef]

Disclaimer/Publisher’s Note: The statements, opinions and data contained in all publications are solely those of the individual author(s) and contributor(s) and not of MDPI and/or the editor(s). MDPI and/or the editor(s) disclaim responsibility for any injury to people or property resulting from any ideas, methods, instructions or products referred to in the content. |
© 2023 by the authors. Licensee MDPI, Basel, Switzerland. This article is an open access article distributed under the terms and conditions of the Creative Commons Attribution (CC BY) license (https://creativecommons.org/licenses/by/4.0/).