
Meta-Analysis as Early Evidence on the Particulate Emissions Impact of EURO VI on Battery Electric Bus Fleet Transitions


 ,
,  ,
,  ,
,  and
and 
Abstract
:1. Introduction
2. Studied Buses and Methods
2.1. Studied Buses
2.2. Methods
- Select and (the particulate mass fraction ≤2.5 m) emission factors for different vehicle and route types from national inventories. So, for UK buses, as reported in the UK NAEI [20], which are in turn based on European Monitoring and Evaluation Programme/European Environment Agency (EMEP/EEA) emission inventory guidebook recommendations [23].
- Use weight-based emission factor calculation methods for brake, tyre and road dust from Beddows and Harrison [14] and compare with public evidence on these.
- Estimate particle resuspension using the USEPA AP42 method [24].
- Compare work completed during regulatory test cycles and test cycle urban, rural and motorway phases and during more typical journeys to estimate real-world emissions for these vehicles.
- Sum were then calculated for each vehicle and road type to provide a comparison of estimated NEEs for BEV and diesel ICE buses.
3. Results
3.1. Exhaust Particulate Emission Factors, EFexhaust
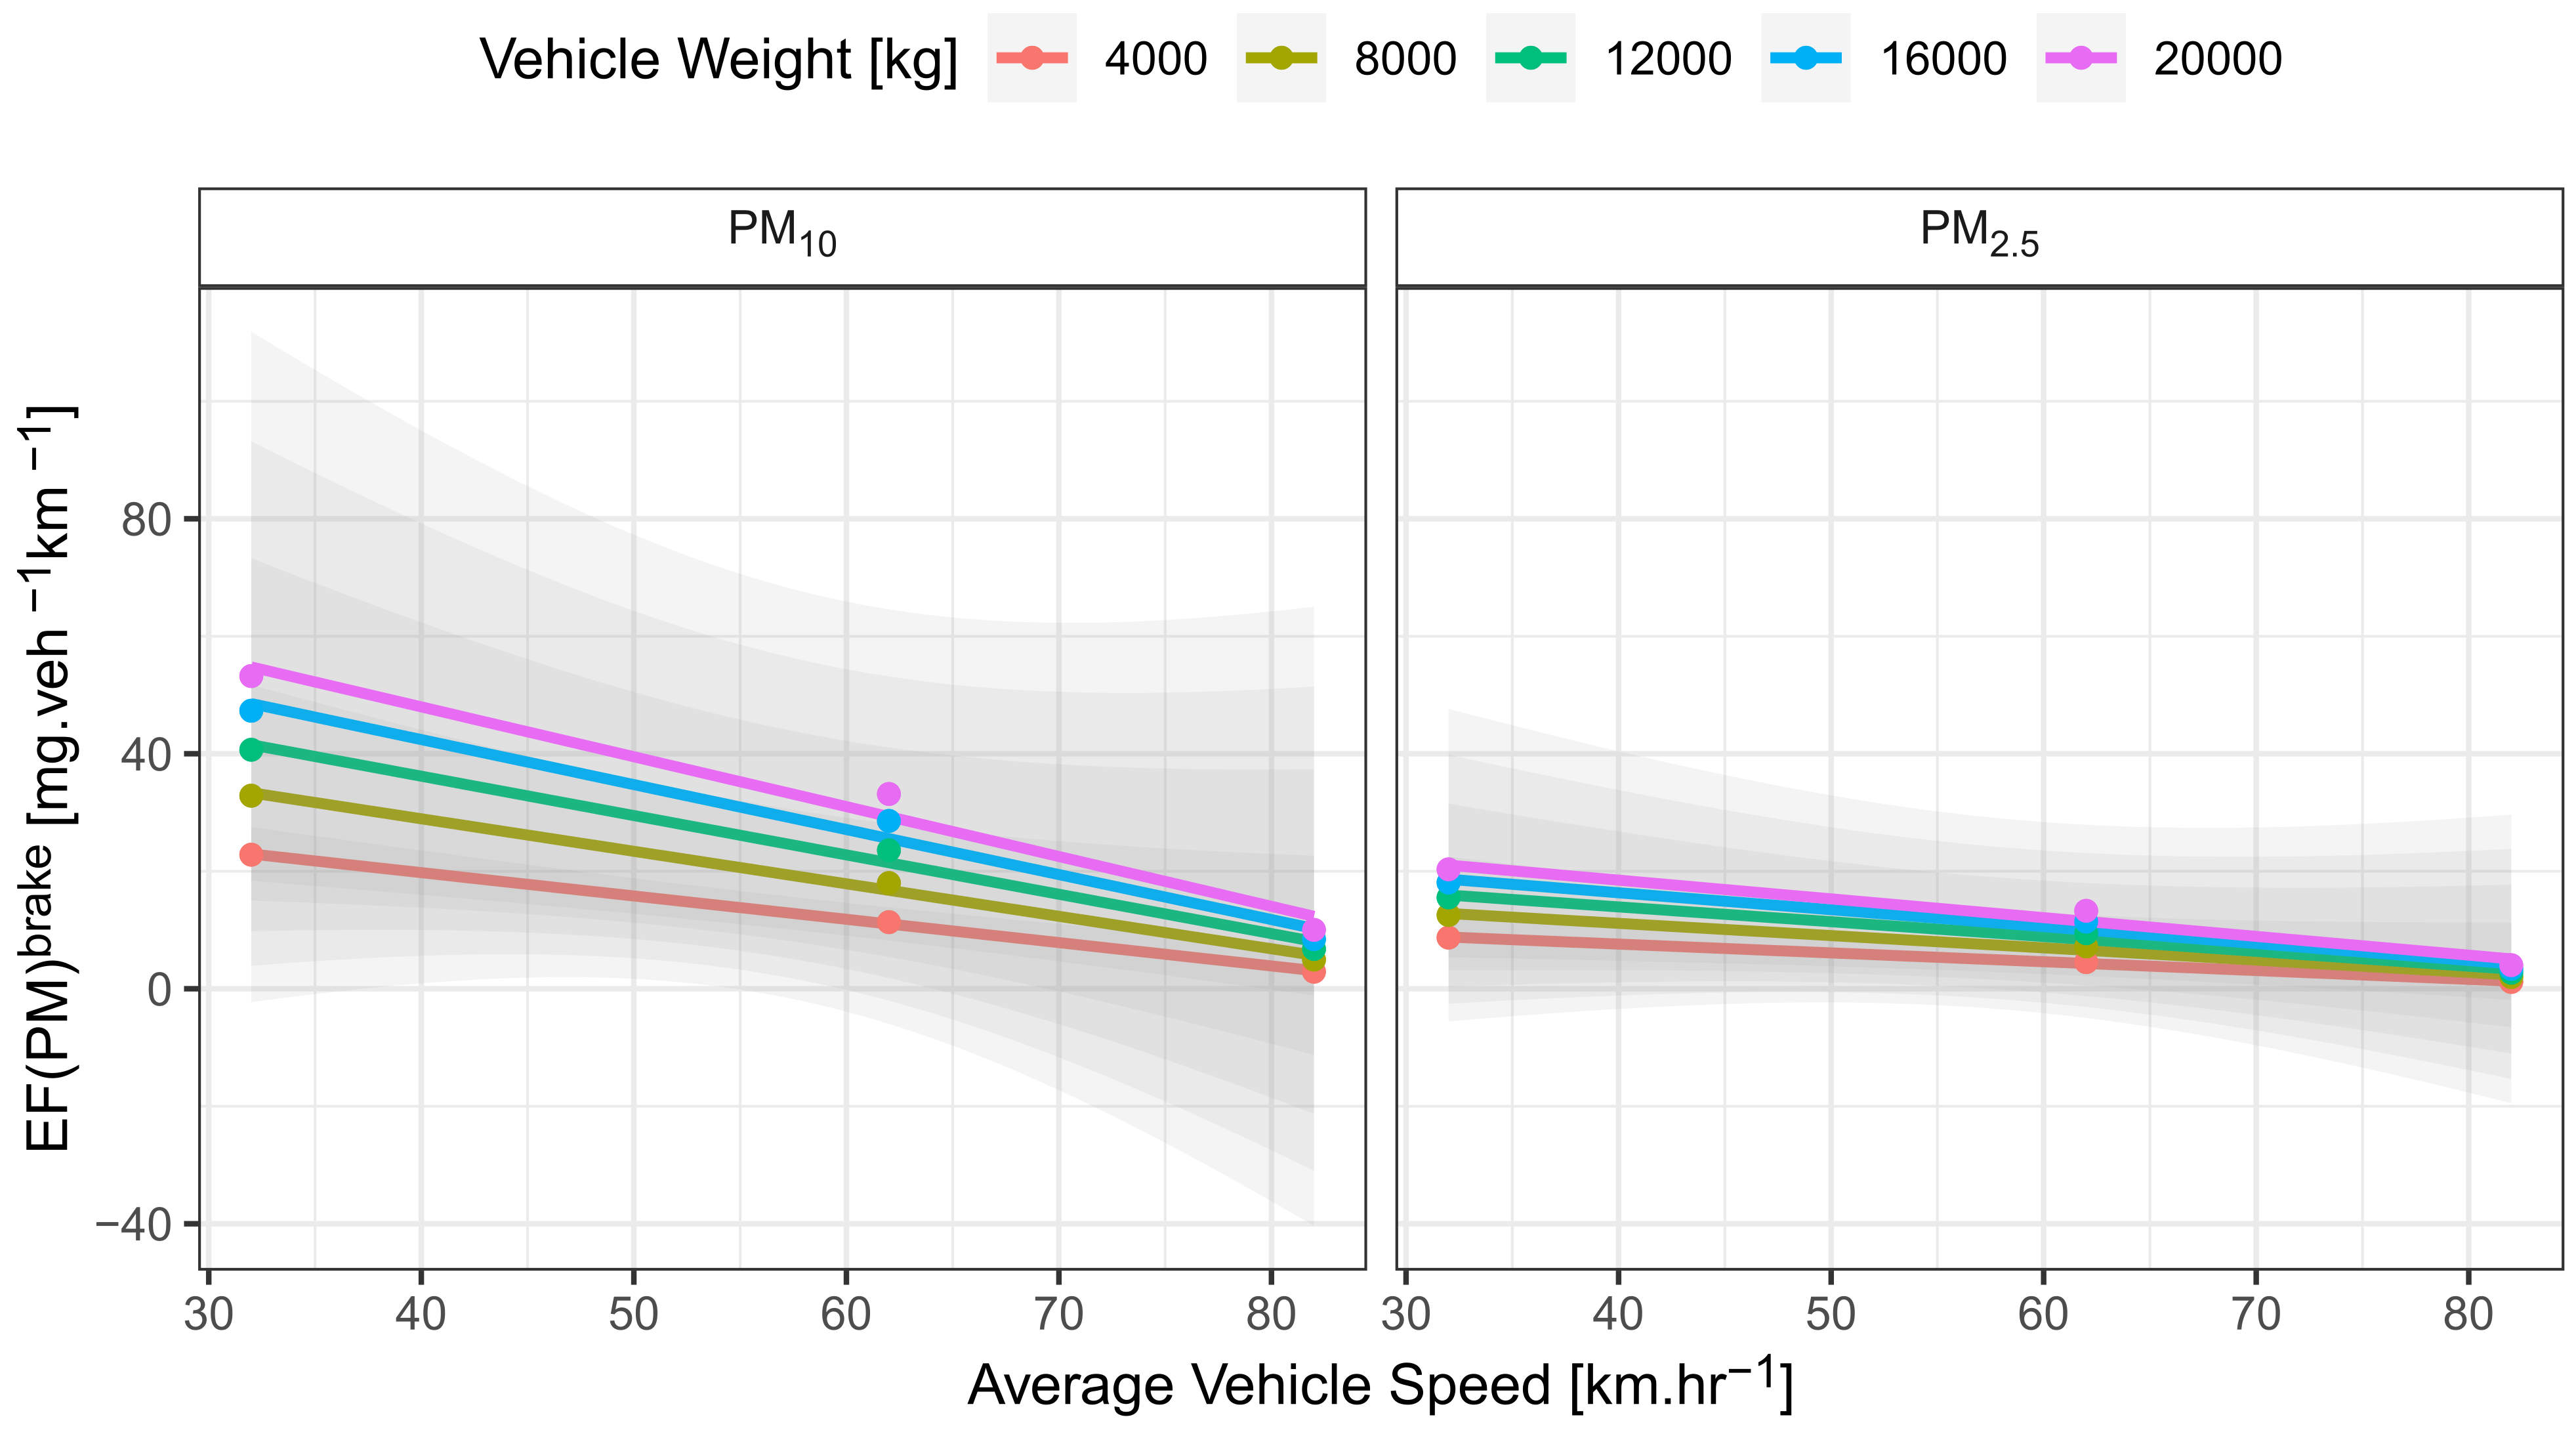
3.2. Brake Particulate Emission Factors, EFbrake
3.3. Tyre Particulate Emission Factors, EFtyre
3.4. Road Particulate Emission Factors, EFroad
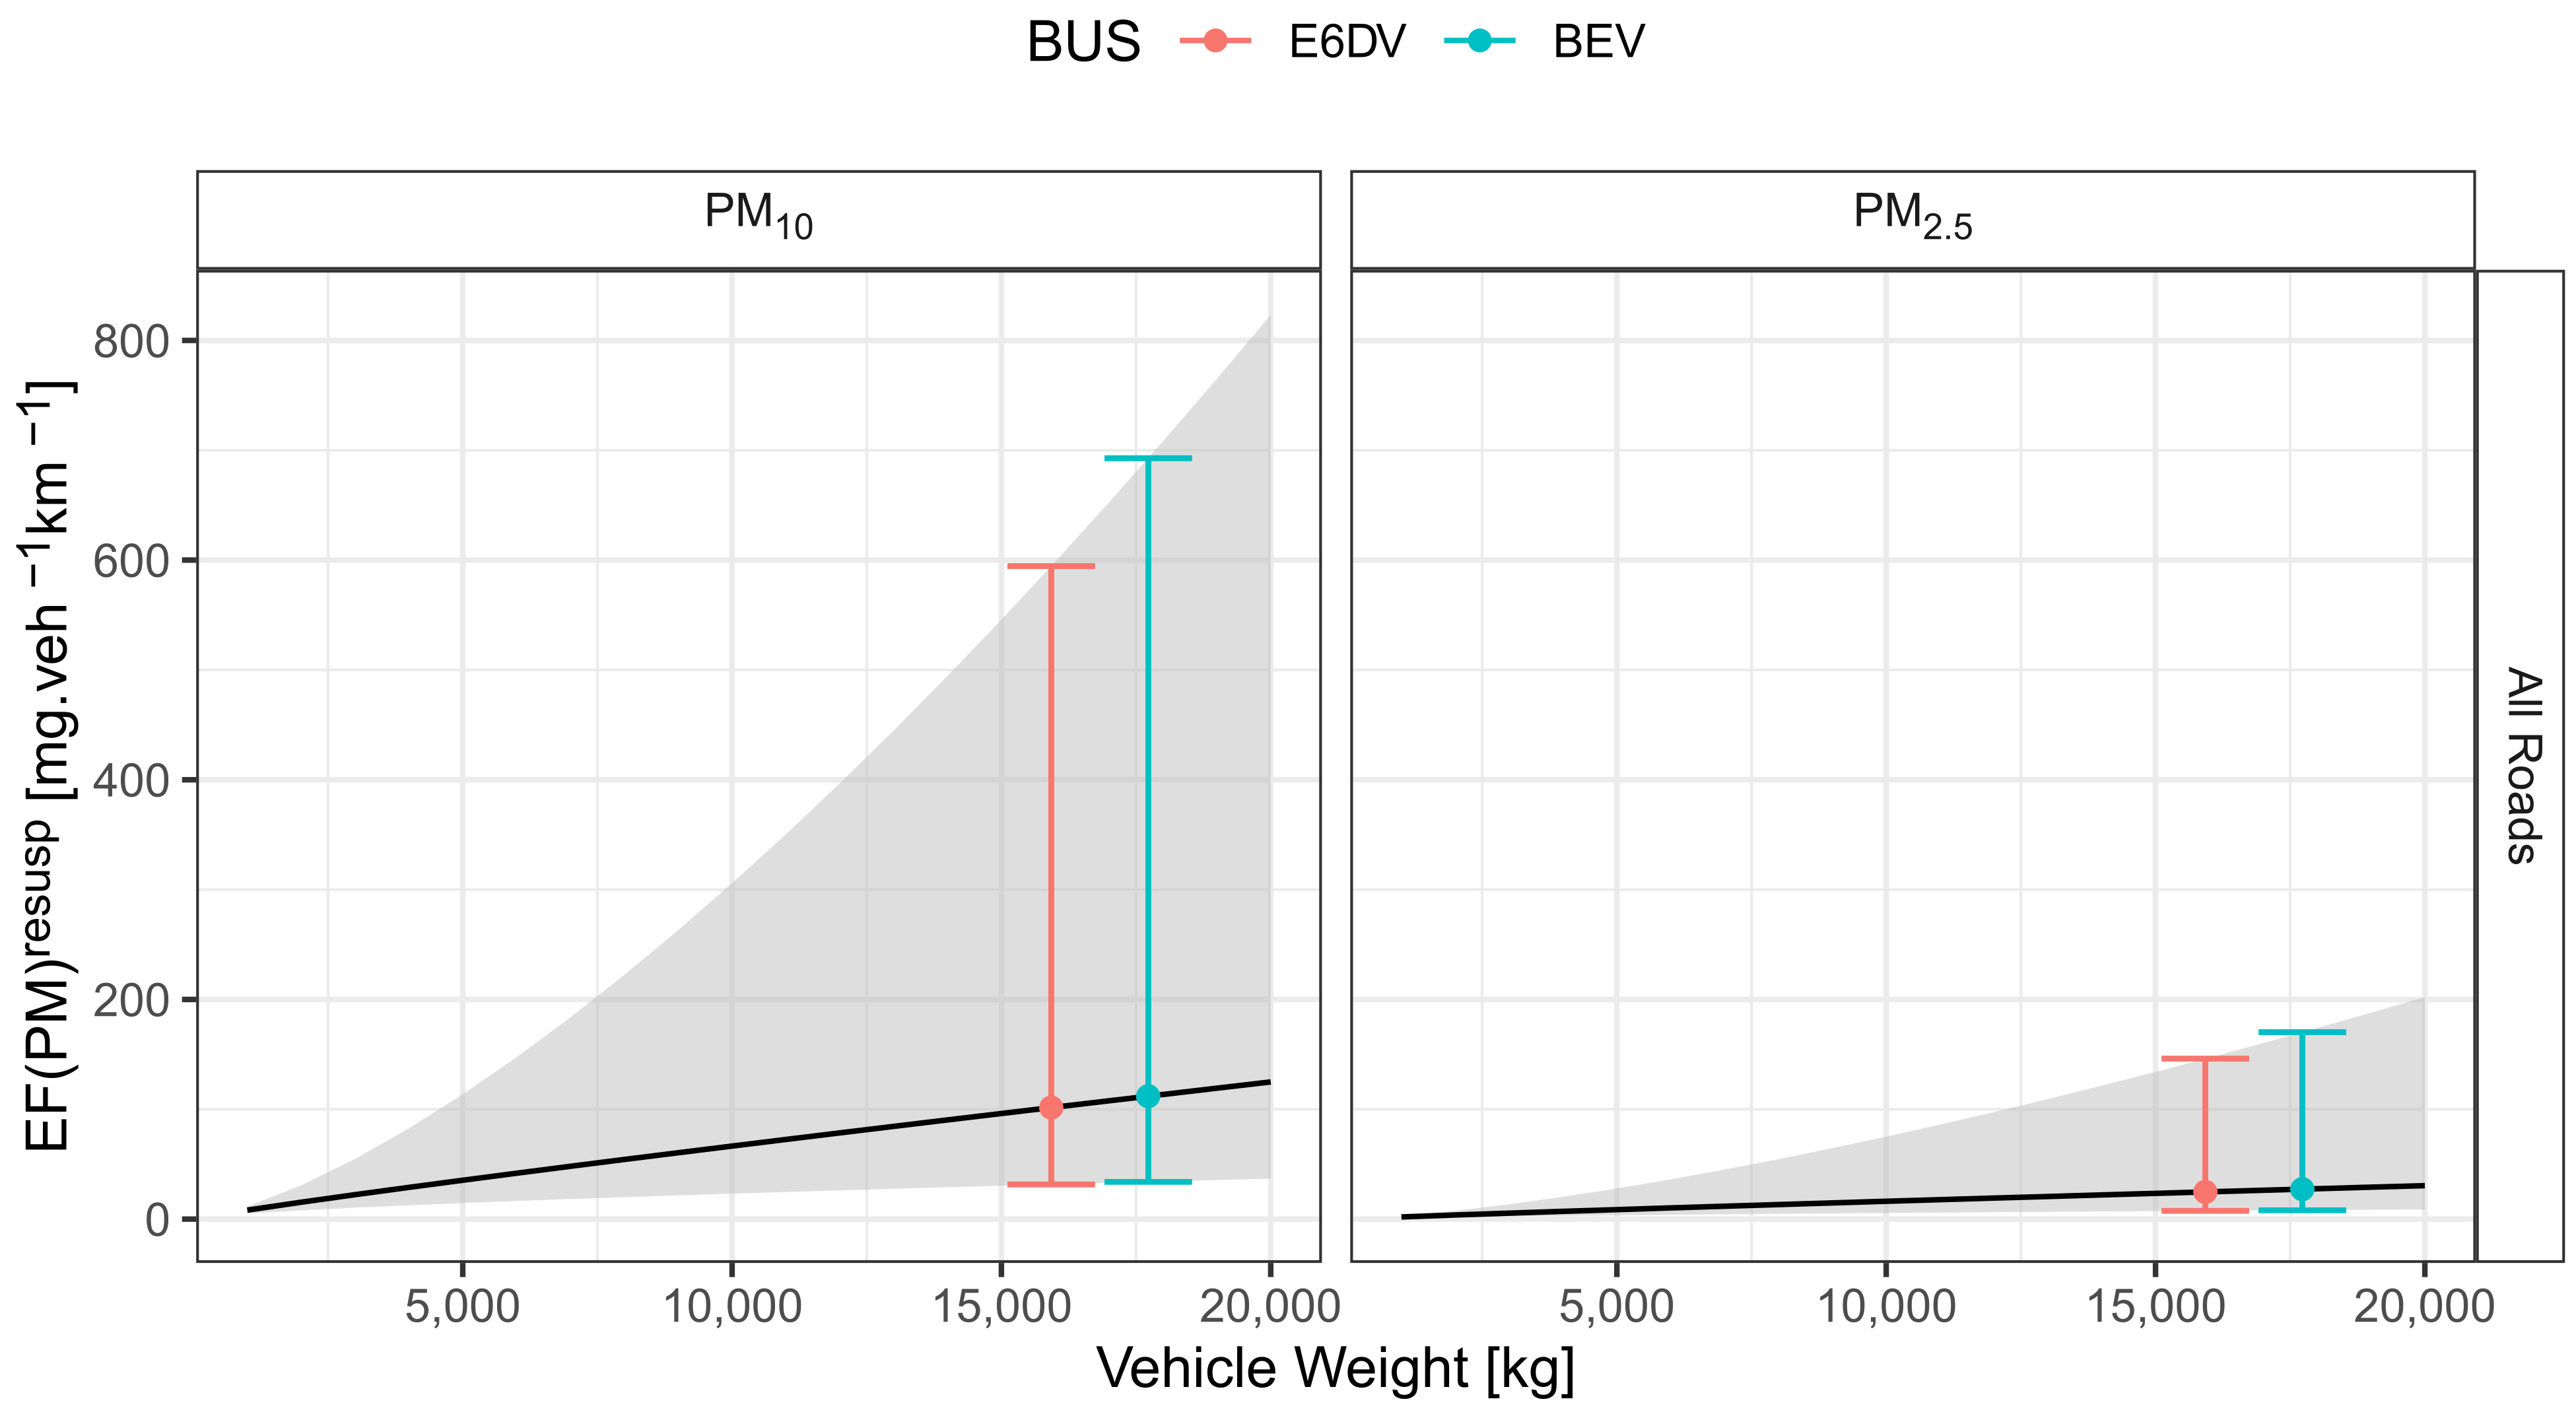
3.5. Road Particulate Resuspension Emission Factors, EFresusp
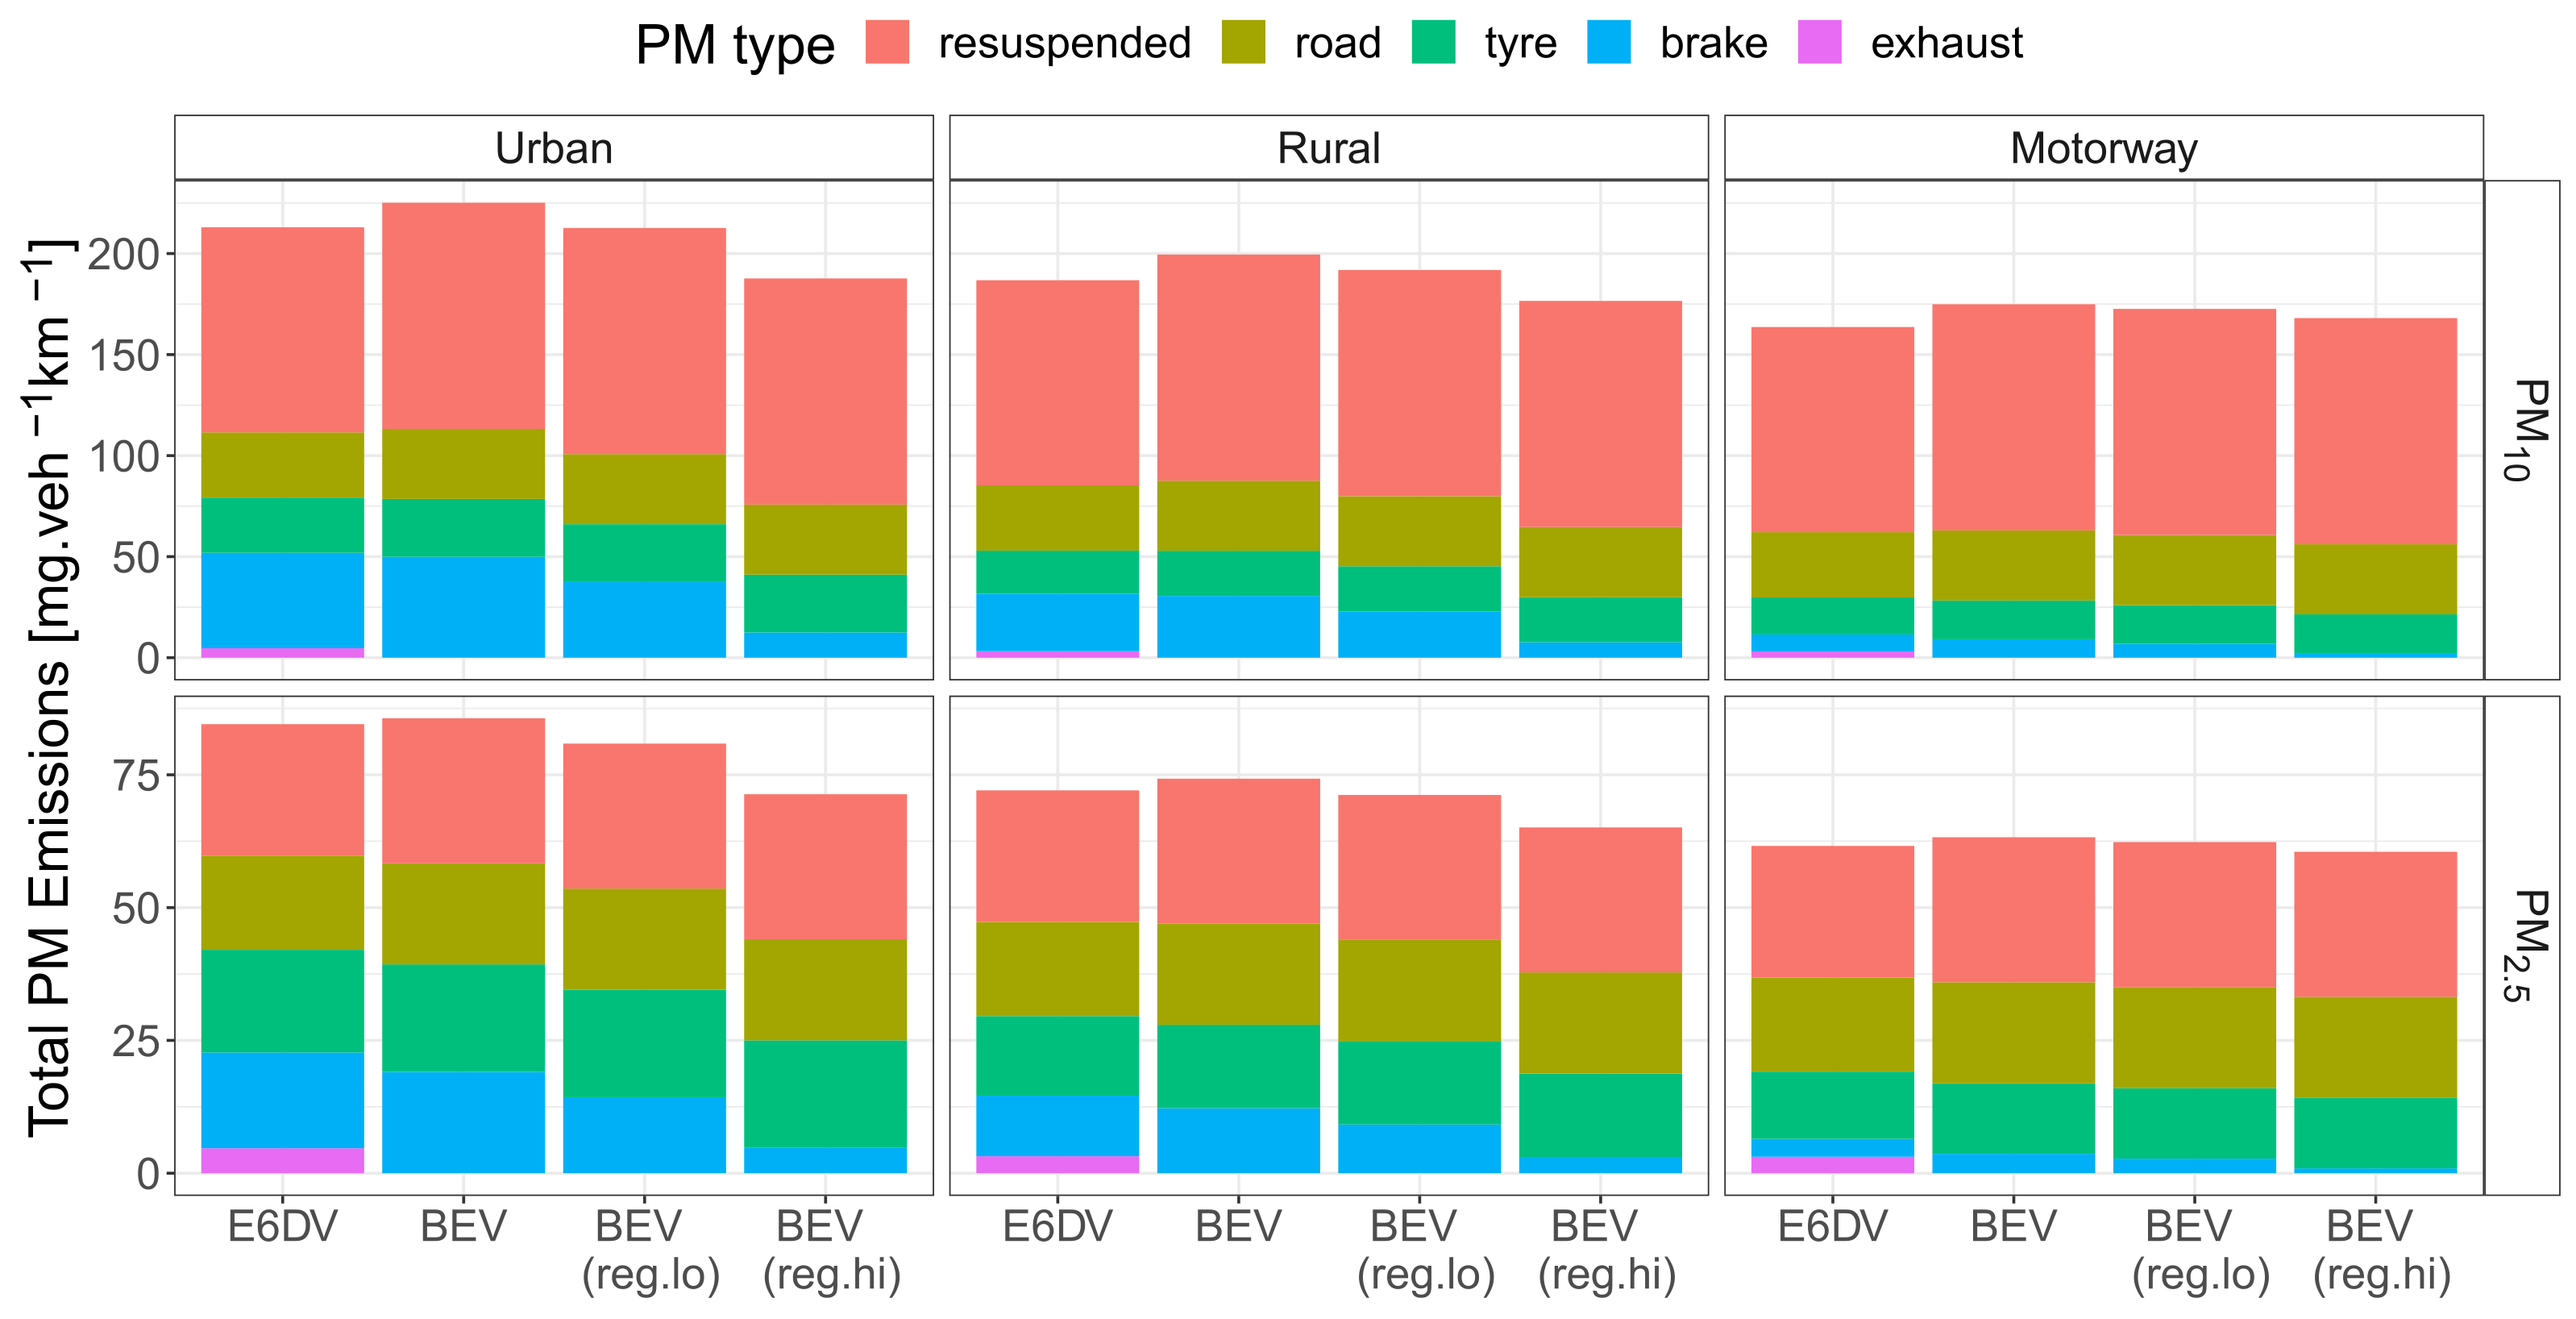
3.6. Total Particulate Emissions Factors, EF100%
4. Discussion and Model Refinements
- Using average speed to estimate emissions on other similar routes. The use of urban, rural and motorway provides a useful general description of emissions. It does not, however, provide a fleet manager with a measure of impacts on the routes they operate on or about the potential to reduce impacts through route planning or other traffic management strategies. EMEP/EEA guidance identifies associations between emissions and average vehicle speed for both and [23]. Applying this to the Beddows and Harrison [14] and models and assuming average speeds on the urban, rural and motorway routes for in Section 3.1, we derive speed modifiers (Appendix A, Figure A5 and Figure A6) by linear regression (Equation (6)):where is either the brake or tyre dust emission factor, and and are conventional linear regression intercept and gradient terms applied to average vehicle speed, , (km.h).We then apply these to the three phases of the UK Bus Test Cycle (UKBC; Figure 2; Outer London, Inner London and rural, average speeds 16.9, 10.0 and 31.3 km.h) to estimate associated and values (Table 7) and total emissions for the three test phases as described in Table A2 in Appendix A and summarised in Figure 3 and Table 8. Comparing Figure 1 and Figure 3 (or Table A1 and Table A2 in Appendix A), again we see higher on the slower routes. Again, the models suggest that trends are likely to more pronounced at the lower speeds associated with Inner London driving, and outcomes are even more dependent on the trade-offs between vehicle weight and regenerative brake performance. This associates with the shape of the and average speed functions (Figure A5 and Figure A6 in Appendix A) which are linear and only increase associated ca. 10% between 30 and 15 km.h. By comparison, the speed curve from COPERT, which has a pronounced upward curve, doubles exhaust contributions over the same range and significantly affects trends for in Inner London.
- Extrapolating to routes with different characteristics. Equation (6) assumes a strong association between and speed at an aggregated level, i.e., speeds averaged across several minutes or kilometers. Elsewhere, researchers have identified other statistical measures of driving as better proxies for , e.g., the US EPA used acceleration ≤ miles.h.s or vehicle specific power (VSP) ≤ kW.tonne in their motor vehicle emission simulator (MOVES) model [44], and Wei et al [32] identified brake energy intensity (BEI) in their more recent machine learning study. Alternative parameters are less commonly cited although elevated emissions are associated with a range of driving activities, including both acceleration and braking [45]. We therefore propose the following functions:where B and T are proxies for the amount of brake and tyre work performed per km travelled, and are the negative and positive components of acceleration, and and are the proportions of journey time the bus is braking and accelerating, respectively.While these are simplifications, all these parameters can be readily calculated from a drive cycle test or GPS speed profiles using, e.g., ART.KINEMA methods [46]. The parameters are estimated for the urban, rural and motorway cases (Table 9), associated calculated using Equation (3) and Table 2 and Table 3 parameters, and these fit the brake and tyre work proxies using linear regression (B and T in Equations (7) and (8)) to generate provisional response terms (Figure A7 and Figure A8 in Appendix A summarised in Table 9). Calculating through (Table 10), we produce associated brake and tyre proxy-based estimates (Figure 4, Table 11, and expanded in Table A3 in Appendix A). This indicates an even more pronounced effect under Inner London conditions, mainly associated with higher levels of braking and therefore brake emissions.
5. Conclusions and Future Work
- All analyses confirm that NEEs are likely to be the major source of E6DV bus-related (approximately 97% and 93% for and , of studied E6DV bus emissions, respectively) and that, while the transition is a clear benefit in terms of urban pollution, it is unlikely to have a major effect on local pollution levels.
- All analyses indicate that an E6DV-to-BEV bus fleet transition, such as that currently being undertaken by First Bus, is likely to have a small effect on bus-related but that outcomes (benefits or penalties) are likely to be highly dependent on the trade-offs between E6DV/BEV weight difference and regenerative braking efficiency, e.g., 1–3% and 2–6% increases for and , respectively, for a BEV without regenerative braking, to a 2–5% and 4–12% decreases for and , respectively, for a BEV with regenerative braking that is 75% effective in offsetting brake emissions.
- However, both average-speed and brake and tyre work proxy-based corrections suggest that emissions could be significantly higher on routes with driving characteristics, such as the Inner London phase of the UKBC, where all vehicle types produced 13–50% more depending on model (average-speed or brake and tyre work modifier, E6DV/BEV weight difference and regenerative brake performance), in comparison to the urban set point defined in NAEI guidance.
Author Contributions
Funding
Data Availability Statement
Acknowledgments
Conflicts of Interest
Abbreviations
| Proportion of Time Vehicle Accelerating | |
| ; ; | Average Acceleration, Deceleration and Speed |
| b; c | Scaling constants from [14]; See e.g., Equation (3) |
| B | Brake Work Proxy (proposed here) |
| BEV(s) | Battery Electric Vehicle(s) |
| BEI | Brake Energy Intensity |
| Airborne Brake (Wear) Particulate | |
| Proportion of Time Vehicle Braking | |
| COMEAP | (UK) Committee on the Medical Effects of Air Pollutants |
| d; e; k | Scaling constants from [24]; see e.g., Equation (5) |
| E6DV(s) | Euro VI Diesel Vehicle(s) |
| EATS | Exhaust After-Treatment System |
| EMEP | (EC) European Monitoring and Evaluation Programme |
| EEA | (EC) European Environment Agency |
| ; | Emission Factor where i and j are application and type descriptors |
| e.g., is emission factor for brake particulate on urban routes | |
| ICE(s) | Internal Combustion Engine(s) |
| Inner London Driving/Route (UKBC definition) | |
| ; | Average Speed scaling constants (proposed here); see Equation (6) |
| ; | Brake Work Proxy scaling constants (proposed here); see Equation (7) |
| Urban Driving/Route (NAEI definition) | |
| MOVES | Motor vehicle emission simulator |
| ; | Tyre Work Proxy scaling constants (proposed here); see Equation (8) |
| NAEI | (UK) National Atmospheric Emissions Inventory |
| ; ; | Oxides of nitrogen; nitric oxide; nitrogen dioxide |
| Outer London Driving/Route (UKBC definition) | |
| Proportion of Wet Days; from [24], see Equation (5) | |
| ; ; | Particulate Matter; 10 m; 2.5 m |
| Resuspended Airborne Particulate | |
| Regenerative Braking | |
| Airborne Road (Wear) Particulate | |
| Urban Driving/Route (NAEI and UKBC definitions) | |
| Road Dust ≤10 m | |
| SCRT | Selective Catalytic Reduction with Continuous Regeneration Trap |
| Road Surface Particulate Loading | |
| T | Tyre Work Proxy (proposed here) |
| Airborne Tyre (Wear) Particulate | |
| Urban Driving/Route (NAEI definition) | |
| UKBC | UK Bus Test Cycle |
| US EPA | United States Environmental Protection Agency |
| VSP | Vehicle Specific Power |
| W | Vehicle Weight |
| ZEV(s) | Zero Emissions Vehicle(s) |
Appendix A
Appendix A.1. EURO VI Diesel Vehicle (E6DV) and Battery Electric Vehicle (BEV) Total PM Emissions (BASE CASE)

| Emissions | Contribution | E6DV mg.veh.km | BEV mg.veh.km | BEV (regen.low) mg.veh.km | BEV (regen.high) mg.veh.km |
|---|---|---|---|---|---|
| Urban | exhaust | 4.7 (4.7–4.7) | 0 | 0 | 0 |
| Urban | brake | 18 (11.6–27) | 19.1 (12.2–28.8) | 14.3 (9.14–21.6) | 4.77 (9.14–21.6) |
| Urban | tyre | 19.3 (14.8–27) | 20.2 (15.4–28.6) | 20.2 (15.4–28.6) | 20.2 (15.4–28.6) |
| Urban | road | 17.7 (13–23.8) | 19 (13.9–25.7) | 19 (13.9–25.7) | 19 (13.9–25.7) |
| Urban | resuspended | 24.8 (7.6–146) | 27.3 (8.16–170) | 27.3 (8.16–170) | 27.3 (8.16–170) |
| Urban | Total | 84.5 (51.6–229) | 85.6 (49.6–253) | 80.9 (46.5–246) | 71.3 (46.5–246) |
| Difference (%) | 1.11 (1.31%) | −3.66 (−4.33%) | −13.2 (−15.6%) | ||
| Rural | exhaust | 3.2 (3.2–3.2) | 0 | 0 | 0 |
| Rural | brake | 11.4 (4.19–27.1) | 12.2 (4.45–29.6) | 9.18 (3.33–22.2) | 3.06 (3.33–22.2) |
| Rural | tyre | 15 (11.7–20.6) | 15.7 (12.2–21.8) | 15.7 (12.2–21.8) | 15.7 (12.2–21.8) |
| Rural | road | 17.7 (13–23.8) | 19 (13.9–25.7) | 19 (13.9–25.7) | 19 (13.9–25.7) |
| Rural | resuspended | 24.8 (7.6–146) | 27.3 (8.16–170) | 27.3 (8.16–170) | 27.3 (8.16–170) |
| Rural | Total | 72.1 (39.7–221) | 74.3 (38.7–247) | 71.2 (37.5–240) | 65.1 (37.5–240) |
| Difference (%) | 2.2 (3.05%) | −0.858 (−1.19%) | −6.98 (−9.68%) | ||
| Motorway | exhaust | 3.1 (3.1–3.1) | 0 | 0 | 0 |
| Motorway | brake | 3.36 (0–17.3) | 3.65 (0–19.5) | 2.74 (0–14.6) | 0.913 (0–14.6) |
| Motorway | tyre | 12.7 (9.76–17.6) | 13.3 (10.2–18.6) | 13.3 (10.2–18.6) | 13.3 (10.2–18.6) |
| Motorway | road | 17.7 (13–23.8) | 19 (13.9–25.7) | 19 (13.9–25.7) | 19 (13.9–25.7) |
| Motorway | resuspended | 24.8 (7.6–146) | 27.3 (8.16–170) | 27.3 (8.16–170) | 27.3 (8.16–170) |
| Motorway | Total | 61.6 (33.4–208) | 63.2 (32.2–234) | 62.3 (32.2–229) | 60.5 (32.2–229) |
| Difference (%) | 1.64 (2.65%) | 0.723 (1.17%) | −1.1 (−1.79%) | ||
| Urban | exhaust | 4.7 (4.7–4.7) | 0 | 0 | 0 |
| Urban | brake | 47.2 (31–69.8) | 50 (32.6–74.3) | 37.5 (24.5–55.7) | 12.5 (24.5–55.7) |
| Urban | tyre | 27.3 (21.2–37.8) | 28.6 (22–40) | 28.6 (22–40) | 28.6 (22–40) |
| Urban | road | 32.3 (23.7–43.3) | 34.7 (25.3–46.8) | 34.7 (25.3–46.8) | 34.7 (25.3–46.8) |
| Urban | resuspended | 102 (31.6–595) | 112 (34–693) | 112 (34–693) | 112 (34–693) |
| Urban | Total | 213 (112–750) | 225 (114–854) | 213 (106–835) | 188 (106–835) |
| Difference (%) | 12.1 (5.68%) | −0.378 (−0.177%) | −25.4 (−11.9%) | ||
| Rural | exhaust | 3.2 (3.2–3.2) | 0 | 0 | 0 |
| Rural | brake | 28.5 (9.77–69.3) | 30.6 (10.4–75.7) | 22.9 (7.78–56.8) | 7.65 (7.78–56.8) |
| Rural | tyre | 21.3 (16.4–29.6) | 22.3 (17.1–31.3) | 22.3 (17.1–31.3) | 22.3 (17.1–31.3) |
| Rural | road | 32.3 (23.7–43.3) | 34.7 (25.3–46.8) | 34.7 (25.3–46.8) | 34.7 (25.3–46.8) |
| Rural | resuspended | 102 (31.6–595) | 112 (34–693) | 112 (34–693) | 112 (34–693) |
| Rural | Total | 187 (84.8–740) | 200 (86.8–847) | 192 (84.2–828) | 177 (84.2–828) |
| Difference (%) | 12.7 (6.79%) | 5.05 (2.7%) | −10.2 (−5.49%) | ||
| Motorway | exhaust | 3.1 (3.1–3.1) | 0 | 0 | 0 |
| Motorway | brake | 8.41 (0–43.3) | 9.13 (0–48.8) | 6.85 (0–36.6) | 2.28 (0–36.6) |
| Motorway | tyre | 18.3 (14.2–25.3) | 19.2 (14.8–26.8) | 19.2 (14.8–26.8) | 19.2 (14.8–26.8) |
| Motorway | road | 32.3 (23.7–43.3) | 34.7 (25.3–46.8) | 34.7 (25.3–46.8) | 34.7 (25.3–46.8) |
| Motorway | resuspended | 102 (31.6–595) | 112 (34–693) | 112 (34–693) | 112 (34–693) |
| Motorway | Total | 164 (72.7–710) | 175 (74.1–815) | 173 (74.1–803) | 168 (74.1–803) |
| Difference (%) | 11.3 (6.88%) | 8.98 (5.49%) | 4.42 (2.7%) |
Appendix A.2. Weight-Dependent Emissions EF Functions


Appendix A.3. By-Weight, Average Speed-Dependent Emissions EF Functions

Appendix A.4. EURO VI Diesel Vehicle (E6DV) and Battery Electric Vehicle (BEV) Total PM Emissions estimated using by-weight average speed-dependent functions (MODEL 01)
| Emissions | Contribution | E6DV mg.veh.km | BEV mg.veh.km | BEV (regen.low) mg.veh.km | BEV (regen.high) mg.veh.km |
|---|---|---|---|---|---|
| Outer London | exhaust | 7.38 (7.38–7.38) | 0 | 0 | 0 |
| Outer London | brake | 22.9 (15–31.2) | 24.3 (15.8–33) | 18.2 (11.8–24.7) | 6.07 (11.8–24.7) |
| Outer London | tyre | 21.3 (16.3–29.7) | 22.3 (16.9–31.4) | 22.3 (16.9–31.4) | 22.3 (16.9–31.4) |
| Outer London | road | 17.7 (13–23.8) | 19 (13.9–25.7) | 19 (13.9–25.7) | 19 (13.9–25.7) |
| Outer London | resuspended | 24.8 (7.6–146) | 27.3 (8.16–170) | 27.3 (8.16–170) | 27.3 (8.16–170) |
| Outer London | Total | 94.1 (59.2–238) | 92.9 (54.7–260) | 86.8 (50.8–252) | 74.7 (50.8–252) |
| Difference (%) | −1.2 (−1.27%) | −7.26 (−7.72%) | −19.4 (−20.6%) | ||
| Inner London | exhaust | 10.9 (10.9–10.9) | 0 | 0 | 0 |
| Inner London | brake | 24.9 (16.6–32.5) | 26.4 (17.5–34.1) | 19.8 (13.1–25.6) | 6.59 (13.1–25.6) |
| Inner London | tyre | 22.2 (17–31) | 23.2 (17.7–32.8) | 23.2 (17.7–32.8) | 23.2 (17.7–32.8) |
| Inner London | road | 17.7 (13–23.8) | 19 (13.9–25.7) | 19 (13.9–25.7) | 19 (13.9–25.7) |
| Inner London | resuspended | 24.8 (7.6–146) | 27.3 (8.16–170) | 27.3 (8.16–170) | 27.3 (8.16–170) |
| Inner London | Total | 100 (65–244) | 95.9 (57.1–263) | 89.3 (52.8–254) | 76.2 (52.8–254) |
| Difference (%) | −4.57 (−4.55%) | −11.2 (−11.1%) | −24.3 (−24.2%) | ||
| Rural | exhaust | 4.77 (4.77–4.77) | 0 | 0 | 0 |
| Rural | brake | 18.8 (11.6–28.7) | 19.9 (12.2–30.6) | 14.9 (9.18–22.9) | 4.98 (9.18–22.9) |
| Rural | tyre | 19.3 (14.8–27) | 20.3 (15.4–28.5) | 20.3 (15.4–28.5) | 20.3 (15.4–28.5) |
| Rural | road | 17.7 (13–23.8) | 19 (13.9–25.7) | 19 (13.9–25.7) | 19 (13.9–25.7) |
| Rural | resuspended | 24.8 (7.6–146) | 27.3 (8.16–170) | 27.3 (8.16–170) | 27.3 (8.16–170) |
| Rural | Total | 85.4 (51.8–230) | 86.5 (49.7–255) | 81.5 (46.6–247) | 71.6 (46.6–247) |
| Difference (%) | 1.11 (1.31%) | −3.86 (−4.53%) | −13.8 (−16.2%) | ||
| Outer London | exhaust | 7.38 (7.38–7.38) | 0 | 0 | 0 |
| Outer London | brake | 60 (39.8–81.2) | 63.4 (41.9–85.8) | 47.6 (31.4–64.3) | 15.9 (31.4–64.3) |
| Outer London | tyre | 29.9 (23.2–41.4) | 31.3 (24.1–43.8) | 31.3 (24.1–43.8) | 31.3 (24.1–43.8) |
| Outer London | road | 32.3 (23.7–43.3) | 34.7 (25.3–46.8) | 34.7 (25.3–46.8) | 34.7 (25.3–46.8) |
| Outer London | resuspended | 102 (31.6–595) | 112 (34–693) | 112 (34–693) | 112 (34–693) |
| Outer London | Total | 231 (126–768) | 241 (125–869) | 225 (115–848) | 194 (115–848) |
| Difference (%) | 10.3 (4.45%) | −5.57 (−2.41%) | −37.3 (−16.1%) | ||
| Inner London | exhaust | 10.9 (10.9–10.9) | 0 | 0 | 0 |
| Inner London | brake | 65.2 (44.1–84.6) | 69 (46.4–89) | 51.7 (34.8–66.8) | 17.2 (34.8–66.8) |
| Inner London | tyre | 31.2 (24.1–43.1) | 32.6 (25.1–45.6) | 32.6 (25.1–45.6) | 32.6 (25.1–45.6) |
| Inner London | road | 32.3 (23.7–43.3) | 34.7 (25.3–46.8) | 34.7 (25.3–46.8) | 34.7 (25.3–46.8) |
| Inner London | resuspended | 102 (31.6–595) | 112 (34–693) | 112 (34–693) | 112 (34–693) |
| Inner London | Total | 241 (134–776) | 248 (131–874) | 231 (119–852) | 196 (119–852) |
| Difference (%) | 7.1 (2.94%) | −10.1 (−4.21%) | −44.6 (−18.5%) | ||
| Rural | exhaust | 4.77 (4.77–4.77) | 0 | 0 | 0 |
| Rural | brake | 48.9 (30.8–74.2) | 51.9 (32.4–79.1) | 38.9 (24.3–59.3) | 13 (24.3–59.3) |
| Rural | tyre | 27.3 (21.1–37.8) | 28.6 (22–40) | 28.6 (22–40) | 28.6 (22–40) |
| Rural | road | 32.3 (23.7–43.3) | 34.7 (25.3–46.8) | 34.7 (25.3–46.8) | 34.7 (25.3–46.8) |
| Rural | resuspended | 102 (31.6–595) | 112 (34–693) | 112 (34–693) | 112 (34–693) |
| Rural | Total | 215 (112–755) | 227 (114–859) | 214 (106–839) | 188 (106–839) |
| Difference (%) | 12.2 (5.69%) | −0.75 (−0.35%) | −26.7 (−12.4%) |
Appendix A.5. By-Weight, Brake and Tyre Proxy-Dependent Emissions EF Functions


Appendix A.6. EURO VI Diesel Vehicle (E6DV) and Battery Electric Vehicle (BEV) Total PM Emissions Estimated Using by-Weight Brake and Tyre Work Proxy Functions (MODEL 02)
| Emissions | Contribution | E6DV mg.veh.km | BEV mg.veh.km | BEV (regen.low) mg.veh.km | BEV (regen.high) mg.veh.km |
|---|---|---|---|---|---|
| Outer London | exhaust | 7.38 (7.38–7.38) | 0 | 0 | 0 |
| Outer London | brake | 34.8 (25.3–36.9) | 36.6 (26.7–38) | 27.5 (20–28.5) | 9.16 (20–28.5) |
| Outer London | tyre | 29.6 (22.4–41.7) | 31 (23.3–44.1) | 31 (23.3–44.1) | 31 (23.3–44.1) |
| Outer London | road | 17.7 (13–23.8) | 19 (13.9–25.7) | 19 (13.9–25.7) | 19 (13.9–25.7) |
| Outer London | resuspended | 24.8 (7.6–146) | 27.3 (8.16–170) | 27.3 (8.16–170) | 27.3 (8.16–170) |
| Outer London | Total | 114 (75.7–256) | 114 (72–278) | 105 (65.4–269) | 86.5 (65.4–269) |
| Difference (%) | −0.26 (−0.22%) | −9.41 (−8.24%) | −27.7 (−24.3%) | ||
| Inner London | exhaust | 10.9 (10.9–10.9) | 0 | 0 | 0 |
| Inner London | brake | 56.5 (43.7–48.9) | 59.5 (45.9–49) | 44.6 (34.5–36.8) | 14.9 (34.5–36.8) |
| Inner London | tyre | 39 (29.4–55.2) | 40.9 (30.6–58.4) | 40.9 (30.6–58.4) | 40.9 (30.6–58.4) |
| Inner London | road | 17.7 (13–23.8) | 19 (13.9–25.7) | 19 (13.9–25.7) | 19 (13.9–25.7) |
| Inner London | resuspended | 24.8 (7.6–146) | 27.3 (8.16–170) | 27.3 (8.16–170) | 27.3 (8.16–170) |
| Inner London | Total | 149 (105–285) | 147 (98.6–303) | 132 (87.1–291) | 102 (87.1–291) |
| Difference (%) | −2.27 (−1.53%) | −17.1 (−11.5%) | −46.9 (−31.5%) | ||
| Rural | exhaust | 4.77 (4.77–4.77) | 0 | 0 | 0 |
| Rural | brake | 15.6 (9.2–26.4) | 16.6 (9.69–28.3) | 12.4 (7.27–21.3) | 4.14 (7.27–21.3) |
| Rural | tyre | 17.5 (13.4–24.4) | 18.3 (14–25.8) | 18.3 (14–25.8) | 18.3 (14–25.8) |
| Rural | road | 17.7 (13–23.8) | 19 (13.9–25.7) | 19 (13.9–25.7) | 19 (13.9–25.7) |
| Rural | resuspended | 24.8 (7.6–146) | 27.3 (8.16–170) | 27.3 (8.16–170) | 27.3 (8.16–170) |
| Rural | Total | 80.4 (48–225) | 81.2 (45.7–250) | 77.1 (43.3–243) | 68.8 (43.3–243) |
| Difference (%) | 0.86 (1.07%) | −3.28 (−4.09%) | −11.6 (−14.4%) | ||
| Outer London | exhaust | 7.38 (7.38–7.38) | 0 | 0 | 0 |
| Outer London | brake | 91.8 (68.2–97.1) | 96.7 (71.8–100) | 72.6 (53.8–75.2) | 24.2 (53.8–75.2) |
| Outer London | tyre | 41.2 (32–57) | 43.2 (33.3–60.3) | 43.2 (33.3–60.3) | 43.2 (33.3–60.3) |
| Outer London | road | 32.3 (23.7–43.3) | 34.7 (25.3–46.8) | 34.7 (25.3–46.8) | 34.7 (25.3–46.8) |
| Outer London | resuspended | 102 (31.6–595) | 112 (34–693) | 112 (34–693) | 112 (34–693) |
| Outer London | Total | 274 (163–799) | 287 (164–900) | 262 (146–875) | 214 (146–875) |
| Difference (%) | 12.3 (4.49%) | −11.9 (−4.33%) | −60.2 (−22%) | ||
| Inner London | exhaust | 10.9 (10.9–10.9) | 0 | 0 | 0 |
| Inner London | brake | 150 (118–130) | 158 (124–131) | 118 (93.2–98.4) | 39.5 (93.2–98.4) |
| Inner London | tyre | 54 (42–74.6) | 56.6 (43.7–78.9) | 56.6 (43.7–78.9) | 56.6 (43.7–78.9) |
| Inner London | road | 32.3 (23.7–43.3) | 34.7 (25.3–46.8) | 34.7 (25.3–46.8) | 34.7 (25.3–46.8) |
| Inner London | resuspended | 102 (31.6–595) | 112 (34–693) | 112 (34–693) | 112 (34–693) |
| Inner London | Total | 349 (226–854) | 361 (227–950) | 322 (196–917) | 243 (196–917) |
| Difference (%) | 12.3 (3.51%) | −27.2 (−7.8%) | −106 (−30.4%) | ||
| Rural | exhaust | 4.77 (4.77–4.77) | 0 | 0 | 0 |
| Rural | brake | 40.6 (24.3–67.9) | 43 (25.6–73) | 32.3 (19.2–54.7) | 10.8 (19.2–54.7) |
| Rural | tyre | 24.8 (19.2–34.3) | 26 (20–36.3) | 26 (20–36.3) | 26 (20–36.3) |
| Rural | road | 32.3 (23.7–43.3) | 34.7 (25.3–46.8) | 34.7 (25.3–46.8) | 34.7 (25.3–46.8) |
| Rural | resuspended | 102 (31.6–595) | 112 (34–693) | 112 (34–693) | 112 (34–693) |
| Rural | Total | 204 (104–745) | 216 (105–849) | 205 (98.5–831) | 183 (98.5–831) |
| Difference (%) | 11.6 (5.71%) | 0.89 (0.44%) | −20.6 (−10.1%) |
Appendix A.7. Rerun of EURO VI Diesel Vehicle (E6DV) and Battery Electric Vehicle (BEV) Total PM Emissions Estimated Using by-Weight Brake and Tyre Work Proxy Functions and Different Weight BEVs (MODELS 03 and 04)

| Emissions | Contribution | E6DV mg.veh.km | BEV mg.veh.km | BEV (regen.low) mg.veh.km | BEV (regen.high) mg.veh.km |
|---|---|---|---|---|---|
| Outer London | exhaust | 7.38 (7.38–7.38) | 0 | 0 | 0 |
| Outer London | brake | 34.8 (25.3–36.9) | 34.8 (25.3–36.9) | 26.1 (19–27.7) | 8.69 (19–27.7) |
| Outer London | tyre | 29.6 (22.4–41.7) | 29.6 (22.4–41.7) | 29.6 (22.4–41.7) | 29.6 (22.4–41.7) |
| Outer London | road | 17.7 (13–23.8) | 17.7 (13–23.8) | 17.7 (13–23.8) | 17.7 (13–23.8) |
| Outer London | resuspended | 24.8 (7.6–146) | 24.8 (7.6–146) | 24.8 (7.6–146) | 24.8 (7.6–146) |
| Outer London | Total | 114 (75.7–256) | 107 (68.3–248) | 98.2 (62–239) | 80.8 (62–239) |
| Difference (%) | −7.38 (−6.46%) | −16.1 (−14.1%) | −33.5 (−29.3%) | ||
| Inner London | exhaust | 10.9 (10.9–10.9) | 0 | 0 | 0 |
| Inner London | brake | 56.5 (43.7–48.9) | 56.5 (43.7–48.9) | 42.4 (32.8–36.7) | 14.1 (32.8–36.7) |
| Inner London | tyre | 39 (29.4–55.2) | 39 (29.4–55.2) | 39 (29.4–55.2) | 39 (29.4–55.2) |
| Inner London | road | 17.7 (13–23.8) | 17.7 (13–23.8) | 17.7 (13–23.8) | 17.7 (13–23.8) |
| Inner London | resuspended | 24.8 (7.6–146) | 24.8 (7.6–146) | 24.8 (7.6–146) | 24.8 (7.6–146) |
| Inner London | Total | 149 (105–285) | 138 (93.7–274) | 124 (82.8–262) | 95.6 (82.8–262) |
| Difference (%) | −10.9 (−7.32%) | −25 (−16.8%) | −53.3 (−35.8%) | ||
| Rural | exhaust | 4.77 (4.77–4.77) | 0 | 0 | 0 |
| Rural | brake | 15.6 (9.2–26.4) | 15.6 (9.2–26.4) | 11.7 (6.9–19.8) | 3.9 (6.9–19.8) |
| Rural | tyre | 17.5 (13.4–24.4) | 17.5 (13.4–24.4) | 17.5 (13.4–24.4) | 17.5 (13.4–24.4) |
| Rural | road | 17.7 (13–23.8) | 17.7 (13–23.8) | 17.7 (13–23.8) | 17.7 (13–23.8) |
| Rural | resuspended | 24.8 (7.6–146) | 24.8 (7.6–146) | 24.8 (7.6–146) | 24.8 (7.6–146) |
| Rural | Total | 80.4 (48–225) | 75.6 (43.2–221) | 71.7 (40.9–214) | 63.9 (40.9–214) |
| Difference (%) | −4.77 (−5.94%) | −8.67 (−10.8%) | −16.5 (−20.5%) | ||
| Outer London | exhaust | 7.38 (7.38–7.38) | 0 | 0 | 0 |
| Outer London | brake | 91.8 (68.2–97.1) | 91.8 (68.2–97.1) | 68.8 (51.2–72.8) | 22.9 (51.2–72.8) |
| Outer London | tyre | 41.2 (32–57) | 41.2 (32–57) | 41.2 (32–57) | 41.2 (32–57) |
| Outer London | road | 32.3 (23.7–43.3) | 32.3 (23.7–43.3) | 32.3 (23.7–43.3) | 32.3 (23.7–43.3) |
| Outer London | resuspended | 102 (31.6–595) | 102 (31.6–595) | 102 (31.6–595) | 102 (31.6–595) |
| Outer London | Total | 274 (163–799) | 267 (156–792) | 244 (139–768) | 198 (139–768) |
| Difference (%) | −7.38 (−2.69%) | −30.3 (−11.1%) | −76.2 (−27.8%) | ||
| Inner London | exhaust | 10.9 (10.9–10.9) | 0 | 0 | 0 |
| Inner London | brake | 150 (118–130) | 150 (118–130) | 113 (88.6–97.7) | 37.5 (88.6–97.7) |
| Inner London | tyre | 54 (42–74.6) | 54 (42–74.6) | 54 (42–74.6) | 54 (42–74.6) |
| Inner London | road | 32.3 (23.7–43.3) | 32.3 (23.7–43.3) | 32.3 (23.7–43.3) | 32.3 (23.7–43.3) |
| Inner London | resuspended | 102 (31.6–595) | 102 (31.6–595) | 102 (31.6–595) | 102 (31.6–595) |
| Inner London | Total | 349 (226–854) | 338 (215–843) | 300 (186–810) | 225 (186–810) |
| Difference (%) | −10.9 (−3.12%) | −48.4 (−13.9%) | −123 (−35.4%) | ||
| Rural | exhaust | 4.77 (4.77–4.77) | 0 | 0 | 0 |
| Rural | brake | 40.6 (24.3–67.9) | 40.6 (24.3–67.9) | 30.4 (18.2–51) | 10.1 (18.2–51) |
| Rural | tyre | 24.8 (19.2–34.3) | 24.8 (19.2–34.3) | 24.8 (19.2–34.3) | 24.8 (19.2–34.3) |
| Rural | road | 32.3 (23.7–43.3) | 32.3 (23.7–43.3) | 32.3 (23.7–43.3) | 32.3 (23.7–43.3) |
| Rural | resuspended | 102 (31.6–595) | 102 (31.6–595) | 102 (31.6–595) | 102 (31.6–595) |
| Rural | Total | 204 (104–745) | 199 (98.9–740) | 189 (92.8–723) | 169 (92.8–723) |
| Difference (%) | −4.77 (−2.34%) | −14.9 (−7.31%) | −35.2 (−17.3%) |
| Emissions | Contribution | E6DV mg.veh.km | BEV mg.veh.km | BEV (regen.low) mg.veh.km | BEV (regen.high) mg.veh.km |
|---|---|---|---|---|---|
| Outer London | exhaust | 7.38 (7.38–7.38) | 0 | 0 | 0 |
| Outer London | brake | 34.8 (25.3–36.9) | 38.4 (27.9–39) | 28.8 (20.9–29.2) | 9.6 (20.9–29.2) |
| Outer London | tyre | 29.6 (22.4–41.7) | 32.3 (24.2–46.4) | 32.3 (24.2–46.4) | 32.3 (24.2–46.4) |
| Outer London | road | 17.7 (13–23.8) | 20.3 (14.7–27.6) | 20.3 (14.7–27.6) | 20.3 (14.7–27.6) |
| Outer London | resuspended | 24.8 (7.6–146) | 29.8 (8.7–195) | 29.8 (8.7–195) | 29.8 (8.7–195) |
| Outer London | Total | 114 (75.7–256) | 121 (75.5–308) | 111 (68.6–299) | 92 (68.6–299) |
| Difference (%) | 6.63 (5.8%) | −2.97 (−2.6%) | −22.2 (−19.4%) | ||
| Inner London | exhaust | 10.9 (10.9–10.9) | 0 | 0 | 0 |
| Inner London | brake | 56.5 (43.7–48.9) | 62.2 (48.1–48.9) | 46.7 (36.1–36.7) | 15.6 (36.1–36.7) |
| Inner London | tyre | 39 (29.4–55.2) | 42.6 (31.7–61.5) | 42.6 (31.7–61.5) | 42.6 (31.7–61.5) |
| Inner London | road | 17.7 (13–23.8) | 20.3 (14.7–27.6) | 20.3 (14.7–27.6) | 20.3 (14.7–27.6) |
| Inner London | resuspended | 24.8 (7.6–146) | 29.8 (8.7–195) | 29.8 (8.7–195) | 29.8 (8.7–195) |
| Inner London | Total | 149 (105–285) | 155 (103–333) | 139 (91.2–321) | 108 (91.2–321) |
| Difference (%) | 6.02 (4.04%) | −9.54 (−6.4%) | −40.6 (−27.3%) | ||
| Rural | exhaust | 4.77 (4.77–4.77) | 0 | 0 | 0 |
| Rural | brake | 15.6 (9.2–26.4) | 17.5 (10.2–30.2) | 13.1 (7.62–22.7) | 4.37 (7.62–22.7) |
| Rural | tyre | 17.5 (13.4–24.4) | 19.1 (14.5–27.1) | 19.1 (14.5–27.1) | 19.1 (14.5–27.1) |
| Rural | road | 17.7 (13–23.8) | 20.3 (14.7–27.6) | 20.3 (14.7–27.6) | 20.3 (14.7–27.6) |
| Rural | resuspended | 24.8 (7.6–146) | 29.8 (8.7–195) | 29.8 (8.7–195) | 29.8 (8.7–195) |
| Rural | Total | 80.4 (48–225) | 86.7 (48.1–280) | 82.3 (45.5–273) | 73.6 (45.5–273) |
| Difference (%) | 6.33 (7.88%) | 1.96 (2.44%) | −6.78 (−8.43%) | ||
| Outer London | exhaust | 7.38 (7.38–7.38) | 0 | 0 | 0 |
| Outer London | brake | 91.8 (68.2–97.1) | 101 (75.1–103) | 76.1 (56.3–77.1) | 25.4 (56.3–77.1) |
| Outer London | tyre | 41.2 (32–57) | 45.1 (34.5–63.4) | 45.1 (34.5–63.4) | 45.1 (34.5–63.4) |
| Outer London | road | 32.3 (23.7–43.3) | 37 (26.9–50.1) | 37 (26.9–50.1) | 37 (26.9–50.1) |
| Outer London | resuspended | 102 (31.6–595) | 122 (36.3–795) | 122 (36.3–795) | 122 (36.3–795) |
| Outer London | Total | 274 (163–799) | 306 (173–1010) | 280 (154–986) | 230 (154–986) |
| Difference (%) | 31.5 (11.5%) | 6.11 (2.23%) | −44.6 (−16.3%) | ||
| Inner London | exhaust | 10.9 (10.9–10.9) | 0 | 0 | 0 |
| Inner London | brake | 150 (118–130) | 165 (130–131) | 124 (97.5–98.5) | 41.3 (97.5–98.5) |
| Inner London | tyre | 54 (42–74.6) | 59.1 (45.3–83.1) | 59.1 (45.3–83.1) | 59.1 (45.3–83.1) |
| Inner London | road | 32.3 (23.7–43.3) | 37 (26.9–50.1) | 37 (26.9–50.1) | 37 (26.9–50.1) |
| Inner London | resuspended | 102 (31.6–595) | 122 (36.3–795) | 122 (36.3–795) | 122 (36.3–795) |
| Inner London | Total | 349 (226–854) | 383 (238–1060) | 342 (206–1030) | 260 (206–1030) |
| Difference (%) | 34.7 (9.94%) | −6.65 (−1.91%) | −89.3 (−25.6%) | ||
| Rural | exhaust | 4.77 (4.77–4.77) | 0 | 0 | 0 |
| Rural | brake | 40.6 (24.3–67.9) | 45.4 (26.8–77.8) | 34 (20.1–58.4) | 11.3 (20.1–58.4) |
| Rural | tyre | 24.8 (19.2–34.3) | 27.1 (20.7–38.2) | 27.1 (20.7–38.2) | 27.1 (20.7–38.2) |
| Rural | road | 32.3 (23.7–43.3) | 37 (26.9–50.1) | 37 (26.9–50.1) | 37 (26.9–50.1) |
| Rural | resuspended | 102 (31.6–595) | 122 (36.3–795) | 122 (36.3–795) | 122 (36.3–795) |
| Rural | Total | 204 (104–745) | 232 (111–962) | 220 (104–942) | 198 (104–942) |
| Difference (%) | 27.7 (13.6%) | 16.4 (8.03%) | −6.33 (−3.1%) |
References
- Glasgow Declaration. COP26 Declaration on Accelerating the Transition to 100% Zero Emission Cars and Vans. Policy Paper Published 10 November 2021. Available online: https://www.gov.uk/government/publications/cop26-declaration-zero-emission-cars-and-vans/cop26-declaration-on-accelerating-the-transition-to-100-zero-emission-cars-and-vans (accessed on 3 January 2022).
- Crippa, M.; Janssens-Maenhout, G.; Dentener, F.; Guizzardi, D.; Sindelarova, K.; Muntean, M.; Van Dingenen, R.; Granier, C. Forty years of improvements in European air quality: Regional policy-industry interactions with global impacts. Atmos. Chem. Phys. 2016, 16, 3825–3841. [Google Scholar] [CrossRef] [Green Version]
- Miller, J.; Du, L.; Kodjak, D. Impacts of World-Class Vehicle Efficiency and Emissions Regulations in Select G20 Countries; ICCT: Washington, DC, USA, 2017; Volume 24, Available online: https://theicct.org/wp-content/uploads/2021/06/ICCT_G20-briefing-paper_Jan2017_vF.pdf (accessed on 3 January 2022).
- Wu, Y.; Zhang, S.; Hao, J.; Liu, H.; Wu, X.; Hu, J.; Walsh, M.P.; Wallington, T.J.; Zhang, K.M.; Stevanovic, S. On-road vehicle emissions and their control in China: A review and outlook. Sci. Total. Environ. 2017, 574, 332–349. [Google Scholar] [CrossRef] [PubMed] [Green Version]
- Mehlig, D.; Woodward, H.; Oxley, T.; Holl, M.; ApSimon, H. Electrification of Road Transport and the Impacts on Air Quality and Health in the UK. Atmosphere 2021, 12, 1491. [Google Scholar] [CrossRef]
- Pickett, L.; Winnet, J.; Carver, D.; Bolton, P. Electric Vehicles and Infrastructure; House of Commons Library: London, UK, 2021; Available online: https://www.southampton.ac.uk/~assets/doc/comms%20and%20marketing/electric-vehicles-and-infrastructure.pdf (accessed on 20 June 2022).
- Font, A.; Guiseppin, L.; Blangiardo, M.; Ghersi, V.; Fuller, G.W. A tale of two cities: Is air pollution improving in Paris and London? Environ. Pollut. 2019, 249, 1–12. [Google Scholar] [CrossRef] [PubMed]
- Ropkins, K.; Tate, J.E. Early observations on the impact of the COVID-19 lockdown on air quality trends across the UK. Sci. Total Environ. 2021, 754, 142374. [Google Scholar] [CrossRef] [PubMed]
- Harrison, R.M.; Allan, J.; Carruthers, D.; Heal, M.R.; Lewis, A.C.; Marner, B.; Murrells, T.; Williams, A. Non-exhaust vehicle emissions of particulate matter and VOC from road traffic: A review. Atmos. Environ. 2021, 262, 118592. [Google Scholar] [CrossRef]
- Piscitello, A.; Bianco, C.; Casasso, A.; Sethi, R. Non-exhaust traffic emissions: Sources, characterization, and mitigation measures. Sci. Total Environ. 2021, 766, 144440. [Google Scholar] [CrossRef] [PubMed]
- Grange, S.K.; Fischer, A.; Zellweger, C.; Alastuey, A.; Querol, X.; Jaffrezo, J.L.; Weber, S.; Uzu, G.; Hueglin, C. Switzerland’s PM10 and PM2.5 environmental increments show the importance of non-exhaust emissions. Atmos. Environ. X 2021, 12, 100145. [Google Scholar] [CrossRef]
- Fussell, J.C.; Franklin, M.; Green, D.C.; Gustafsson, M.; Harrison, R.M.; Hicks, W.; Kelly, F.J.; Kishta, F.; Miller, M.R.; Mudway, I.S.; et al. A Review of Road Traffic-Derived Non-Exhaust Particles: Emissions, Physicochemical Characteristics, Health Risks, and Mitigation Measures. Environ. Sci. Technol. 2022, 56, 6813–6835. [Google Scholar] [CrossRef]
- Matthaios, V.N.; Lawrence, J.; Martins, M.A.; Ferguson, S.T.; Wolfson, J.M.; Harrison, R.M.; Koutrakis, P. Quantifying factors affecting contributions of roadway exhaust and non-exhaust emissions to ambient PM10–2.5 and PM2.5–0.2 particles. Sci. Total Environ. 2022, 835, 155368. [Google Scholar] [CrossRef]
- Beddows, D.C.; Harrison, R.M. PM10 and PM2.5 emission factors for non-exhaust particles from road vehicles: Dependence upon vehicle mass and implications for battery electric vehicles. Atmos. Environ. 2021, 244, 117886. [Google Scholar] [CrossRef]
- WHO & ECE (World Health Organization and European Centre for Environment). WHO Global Air Quality Guidelines: Particulate Matter (PM2.5 and PM10), Ozone, Nitrogen Dioxide, Sulfur Dioxide and Carbon Monoxide; World Health Organization: Geneva, Switzerland, 2021; Available online: https://apps.who.int/iris/handle/10665/345329 (accessed on 20 November 2022).
- Orellano, P.; Reynoso, J.; Quaranta, N.; Bardach, A.; Ciapponi, A. Short-term exposure to particulate matter (PM10 and PM2.5), nitrogen dioxide (NO2), and ozone (O3) and all-cause and cause-specific mortality: Systematic review and meta-analysis. Environ. Int. 2020, 142, 105876. [Google Scholar] [CrossRef]
- COMEAP (Committee on the Medical Effects of Air Pollutants). Statement on Quantifying Mortality Associated with Long-Term Exposure to PM2.5. 2022. Available online: https://assets.publishing.service.gov.uk/government/uploads/system/uploads/attachment_data/file/1061492/COMEAP_Statement_on_PM2.5_mortality_quantification.pdf (accessed on 20 September 2022).
- TRANSITION Clean Air Network Response to COP26 Declaration on Accelerating the Transition to 100% Zero Emission Cars and Vans. Policy Response. Published on 26 November 2021. Available online: https://transition-air.org.uk/news/letter-re-cop26-declaration-cars/ (accessed on 3 January 2022).
- The TRANSITION Clean Air Network and TRANSITION-Funded Research. Available online: https://transition-air.org.uk/research/ (accessed on 3 January 2022).
- UK NAEI (UK National Atmospheric Emissions Inventory). 2020. Available online: https://naei.beis.gov.uk/ (accessed on 3 January 2022).
- Schoemaker, J.T. Research on the Weight of Buses and Touring Coaches; Final Report; International Road Transportation Union; NEA: Rijswijk, The Netherlands, 2007; Available online: https://www.iru.org/resources/iru-library/research-weight-buses-and-touring-coaches-final-report (accessed on 3 January 2022).
- Timmers, V.R.; Achten, P.A. Non-exhaust PM emissions from electric vehicles. Atmos. Environ. 2016, 134, 10–17. [Google Scholar] [CrossRef]
- EMEP/EEA (European Monitoring and Evaluation Programme/European Environment Agency). Air Pollutant Emission Inventory Guidebook; European Environment Agency: Copenhagen, Denmark, 2019; Available online: https://www.eea.europa.eu/publications/emep-eea-guidebook-2019 (accessed on 3 January 2022).
- USEPA (US Environmental Protection Agency). Emission Factor Documentation for AP-42, Section 13.2.1: Paved Roads; Measurement Policy Group, Office of Air Quality Planning and Standards; U.S. Environmental Protection Agency: Washington, DC, USA, 2011. Available online: https://www.epa.gov/chief (accessed on 20 June 2022).
- Ibarra-Espinosa, S.; Ynoue, R.; O’Sullivan, S.; Pebesma, E.; Andrade, M.D.F.; Osses, M. VEIN v0.2.2: An R package for bottom-up vehicular emissions inventories. Geosci. Model Dev. 2018, 11, 2209–2229. [Google Scholar] [CrossRef] [Green Version]
- Brown, P.; Wakeling, D.; Pang, Y.; Murrells, T. Methodology for the UK’s Road Transport Emissions Inventory: Version for the 2016 National Atmospheric Emissions Inventory. Report for the Department for Business, Energy & Industrial Strategy. Ricardo Energy & Environment Report; 2018. Available online: https://uk-air.defra.gov.uk/assets/documents/reports/cat07/1804121004_Road_transport_emissions_methodology_report_2018_v1.1.pdf (accessed on 3 January 2022).
- Weilenmann, M.; Favez, J.Y.; Alvarez, R. Cold-start emissions of modern passenger cars at different low ambient temperatures and their evolution over vehicle legislation categories. Atmos. Environ. 2009, 43, 2419–2429. [Google Scholar] [CrossRef]
- Barone, T.L.; Storey, J.M.; Domingo, N. An analysis of field-aged diesel particulate filter performance: Particle emissions before, during, and after regeneration. J. Air Waste Manag. Assoc. 2010, 60, 968–976. [Google Scholar] [CrossRef] [PubMed] [Green Version]
- Giechaskiel, B.; Forloni, F.; Carriero, M.; Baldini, G.; Castellano, P.; Vermeulen, R.; Kontses, D.; Fragkiadoulakis, P.; Samaras, Z.; Fontaras, G. Effect of Tampering on On-Road and Off-Road Diesel Vehicle Emissions. Sustainability 2022, 14, 6065. [Google Scholar] [CrossRef]
- Dallmann, T.; Bernard, Y.; Tietge, U.; Muncrief, R. Remote Sensing of Motor Vehicle Emissions in London. ICCT Report. 2018. Available online: https://theicct.org/wp-content/uploads/2021/06/TRUE-London-RS-Report-FV-20181218.pdf (accessed on 20 June 2022).
- Ghaffarpas, O.; Beddows, D.C.; Ropkins, K.; Pope, F.D. Real-world assessment of vehicle air pollutant emissions subset by vehicle type, fuel and EURO class: New findings from the recent UK EDAR field campaigns, and implications for emissions restricted zones. Sci. Total Environ. 2020, 734, 139416. [Google Scholar] [CrossRef]
- Wei, N.; Men, Z.; Ren, C.; Jia, Z.; Zhang, Y.; Jin, J.; Chang, J.; Lv, Z.; Guo, D.; Yang, Z.; et al. Applying machine learning to construct braking emission model for real-world road driving. Environ. Int. 2022, 166, 107386. [Google Scholar] [CrossRef] [PubMed]
- Grigoratos, T.; Martini, G. Brake wear particle emissions: A review. Environ. Sci. Pollut. Res. 2015, 22, 2491–2504. [Google Scholar] [CrossRef] [PubMed]
- AQEG (Air Quality Expert Group). Non-Exhaust Emissions from Road Traffic; Air Quality Expert Group, Department for Environment Food and Rural Affairs: London, UK, 2019. Available online: https://uk-air.defra.gov.uk/assets/documents/reports/cat09/1907101151_20190709_Non_Exhaust_Emissions_typeset_Final.pdf (accessed on 3 January 2022).
- Hamada, A.T.; Orhan, M.F. An overview of regenerative braking systems. J. Energy Storage 2022, 52, 105033. [Google Scholar] [CrossRef]
- Kole, P.J.; Löhr, A.J.; Van Belleghem, F.G.; Ragas, A.M. Wear and tear of tyres: A stealthy source of microplastics in the environment. Int. J. Environ. Res. Public Health 2017, 14, 1265. [Google Scholar] [CrossRef] [PubMed]
- Tian, Z.; Zhao, H.; Peter, K.T.; Gonzalez, M.; Wetzel, J.; Wu, C.; Hu, X.; Prat, J.; Mudrock, E.; Hettinger, R.; et al. A ubiquitous tire rubber–derived chemical induces acute mortality in coho salmon. Science 2021, 371, 185–189. [Google Scholar] [CrossRef]
- Rienda, I.C.; Alves, C.A. Road dust resuspension: A review. Atmos. Res. 2021, 261, 105740. [Google Scholar] [CrossRef]
- Gulia, S.; Goyal, P.; Goyal, S.K.; Kumar, R. Re-suspension of road dust: Contribution, assessment and control through dust suppressants—A review. Int. J. Environ. Sci. Technol. 2019, 16, 1717–1728. [Google Scholar] [CrossRef]
- Thorpe, A.; Harrison, R.M. Sources and properties of non-exhaust particulate matter from road traffic: A review. Sci. Total. Environ. 2008, 400, 270–282. [Google Scholar] [CrossRef] [PubMed]
- Dahari, N.; Latif, M.T.; Muda, K.; Norelyza, N. Influence of meteorological variables on suburban atmospheric PM2.5 in the southern region of peninsular Malaysia. Aerosol Air Qual. Res. 2020, 20, 14–25. [Google Scholar] [CrossRef]
- Keuken, M.; van der Gon, H.D.; van der Valk, K. Non-exhaust emissions of PM and the efficiency of emission reduction by road sweeping and washing in the Netherlands. Sci. Total Environ. 2010, 408, 4591–4599. [Google Scholar] [CrossRef]
- Amato, F.; Nava, S.; Lucarelli, F.; Querol, X.; Alastuey, A.; Baldasano, J.M.; Polfi, M. A comprehensive assessment of PM emissions from paved roads: Real-world emission factors and intense street cleaning trials. Sci. Total Environ. 2010, 408, 4309–4318. [Google Scholar] [CrossRef]
- US Environmental Protection Agency. Motor Vehicle Emission Simulator (MOVES) User Guide. 2010. Available online: https://www.epa.gov/moves/previous-moves-versions-and-documentation (accessed on 20 June 2022).
- Kim, G.; Lee, S. Characteristics of tire wear particles generated by a tire simulator under various driving conditions. Environ. Sci. Technol. 2018, 52, 12153–12161. [Google Scholar] [CrossRef]
- Barlow, T.J.; Latham, S.; McCrae, I.S.; Boulter, P.G. A Reference Book of Driving Cycles for Use in the Measurement of Road Vehicle Emissions. TRL Published Project Report; 2009. Available online: https://assets.publishing.service.gov.uk/government/uploads/system/uploads/attachment_data/file/4247/ppr-354.pdf (accessed on 20 June 2022).


| Make | Model | Estimated Weight 1 | Fuel or Battery | Engine | Power Output | Emission Class | Emission Control 2 | Exhaust Filter 3 | Regenerative Braking |
|---|---|---|---|---|---|---|---|---|---|
| Volvo | B9TL | 15,925 kg | ULS Diesel | ICE Diesel | 260PS (194 kW) | EURO VI 4 | Adblue SCRT | EATS | no |
| Volvo | B9TL | 15,925 kg | ULS Diesel | ICE Diesel | 260PS (194 kW) | EURO VI 4 | Adblue SCRT | EATS | no |
| Volvo | B9TL | 15,925 kg | ULS Diesel | ICE Diesel | 260PS (194 kW) | EURO VI 4 | Adblue SCRT | EATS | no |
| Volvo | B9TL | 15,925 kg | ULS Diesel | ICE Diesel | 260PS (194 kW) | EURO VI 4 | Adblue SCRT | EATS | no |
| Volvo | B9TL | 15,925 kg | ULS Diesel | ICE Diesel | 260PS (194 kW) | EURO VI 4 | Adblue SCRT | EATS | no |
| Optare | Metrodecker M1110EV | 17,425 kg | Lithium Ion Battery | Electric Motor | 300 kW | ZEV | - | - | yes |
| Optare | Metrodecker M1110EV | 17,725 kg | Lithium Ion Battery | Electric Motor | 300 kW | ZEV | - | - | yes |
| Optare | Metrodecker M1110EV | 17,725 kg | Lithium Ion Battery | Electric Motor | 300 kW | ZEV | - | - | yes |
| Optare | Metrodecker M1110EV | 17,725 kg | Lithium Ion Battery | Electric Motor | 300 kW | ZEV | - | - | yes |
| Optare | Metrodecker M1110EV | 17,725 kg | Lithium Ion Battery | Electric Motor | 300 kW | ZEV | - | - | yes |
| Contribution | b | c | mg.veh.km |
|---|---|---|---|
| E6DV | |||
| Urban | 4.2 ± 1.1 | 1.9 ± 0.2 | 18 (12–27) |
| Rural | 1.8 ± 0.9 | 1.5 ± 0.3 | 11 (4.2–27) |
| Motorway | 0.4 ± 0.4 | 1.3 ± 0.4 | 3.4 (0–17) |
| Urban | 11 ± 2.7 | 1.9 ± 0.2 | 47 (31–70) |
| Rural | 4.5 ± 2.4 | 1.5 ± 0.3 | 28 (9.8–69) |
| Motorway | 1.0 ± 1.0 | 1.3 ± 0.4 | 8.4 (0–43) |
| BEV | |||
| Urban | 4.2 ± 1.1 | 1.9 ± 0.2 | 19 (12–29) |
| Rural | 1.8 ± 0.9 | 1.5 ± 0.3 | 12 (4.4–30) |
| Motorway | 0.4 ± 0.4 | 1.3 ± 0.4 | 3.7 (0–20) |
| Urban | 11 ± 2.7 | 1.9 ± 0.2 | 50 (33–74) |
| Rural | 4.5 ± 2.4 | 1.5 ± 0.3 | 31 (10–76) |
| Motorway | 1.0 ± 1.0 | 1.3 ± 0.4 | 9.1 (0–49) |
| Contribution | b | c | mg.veh.km |
|---|---|---|---|
| E6DV | |||
| Urban | 5.8 ± 0.5 | 2.3 ± 0.4 | 19 (15–27) |
| Rural | 4.5 ± 0.3 | 2.3 ± 0.4 | 15 (12–21) |
| Motorway | 3.8 ± 0.3 | 2.3 ± 0.4 | 13 (9.8–18) |
| Urban | 8.2 ± 0.6 | 2.3 ± 0.4 | 27 (21–38) |
| Rural | 6.4 ± 0.5 | 2.3 ± 0.4 | 21 (16–30) |
| Motorway | 5.5 ± 0.4 | 2.3 ± 0.4 | 18 (14–25) |
| BEV | |||
| Urban | 5.8 ± 0.5 | 2.3 ± 0.4 | 20 (15–29) |
| Rural | 4.5 ± 0.3 | 2.3 ± 0.4 | 16 (12–22) |
| Motorway | 3.8 ± 0.3 | 2.3 ± 0.4 | 13 (10–19) |
| Urban | 8.2 ± 0.6 | 2.3 ± 0.4 | 29 (22–40) |
| Rural | 6.4 ± 0.5 | 2.3 ± 0.4 | 22 (17–31) |
| Motorway | 5.5 ± 0.4 | 2.3 ± 0.4 | 19 (15–27) |
| Contribution | b | c | mg.veh.km |
|---|---|---|---|
| E6DV | |||
| (all roads) | 2.8 ± 0.5 | 1.5 ± 0.1 | 18 (13–24) |
| (all roads) | 5.1 ± 0.9 | 1.5 ± 0.1 | 32 (24–43) |
| BEV | |||
| (all roads) | 2.8 ± 0.5 | 1.5 ± 0.1 | 19 (14–26) |
| (all roads) | 5.1 ± 0.9 | 1.5 ± 0.1 | 35 (25–47) |
| Contribution | b | c | mg.veh.km |
|---|---|---|---|
| E6DV | |||
| (all roads) | 2.0 ± 0.8 | 1.1 ± 0.4 | 25 (7.6–150) |
| (all roads) | 8.2 ± 3.2 | 1.1 ± 0.4 | 100 (32–590) |
| BEV | |||
| (all roads) | 2.0 ± 0.8 | 1.1 ± 0.4 | 27 (8.2–170) |
| (all roads) | 8.2 ± 3.2 | 1.1 ± 0.4 | 110 (34–690) |
| Total Emissions | E6DV mg.veh.km | BEV mg.veh.km | BEV (reg.lo) mg.veh.km | BEV (reg.hi) mg.veh.km |
|---|---|---|---|---|
| Urban | 84.5 (51.6–229) | 85.6 (49.6–253) | 80.9 (46.5–246) | 71.3 (46.5–246) |
| Rural | 72.1 (39.7–221) | 74.3 (38.7–247) | 71.2 (37.5–240) | 65.1 (37.5–240) |
| Motorway | 61.6 (33.4–208) | 63.2 (32.2–234) | 62.3 (32.2–229) | 60.5 (32.2–229) |
| Urban | 213 (112–750) | 225 (114–854) | 213 (106–835) | 188 (106–835) |
| Rural | 187 (84.8–740) | 200 (86.8–847) | 192 (84.2–828) | 177 (84.2–828) |
| Motorway | 164 (72.7–710) | 175 (74.1–815) | 173 (74.1–803) | 168 (74.1–803) |
| Contribution | mg.veh.km | ||
|---|---|---|---|
| E6DV | |||
| Outer London | 10.9 ± 9.28 | −10.2 ± 0.977 | 23 (15–31) |
| Inner London | 10.9 ± 9.28 | −10.2 ± 0.977 | 25 (17–32) |
| Rural | 10.9 ± 9.28 | −10.2 ± 0.977 | 19 (12–29) |
| Outer London | 28 ± 23.6 | −27.2 ± 2.46 | 60 (40–81) |
| Inner London | 28 ± 23.6 | −27.2 ± 2.46 | 65 (44–85) |
| Rural | 28 ± 23.6 | −27.2 ± 2.46 | 49 (31–74) |
| BEV | |||
| Outer London | 11.7 ± 10.2 | −10.7 ± 1.37 | 24 (16–33) |
| Inner London | 11.7 ± 10.2 | −10.7 ± 1.37 | 26 (17–34) |
| Rural | 11.7 ± 10.2 | −10.7 ± 1.37 | 20 (12–31) |
| Outer London | 29.9 ± 26 | −28.6 ± 3.43 | 63 (42–86) |
| Inner London | 29.9 ± 26 | −28.6 ± 3.43 | 69 (46–89) |
| Rural | 29.9 ± 26 | −28.6 ± 3.43 | 52 (32–79) |
| Contribution | mg.veh.km | ||
| E6DV | |||
| Outer London | 15.7 ± 4.83 | −4.77 ± 1.61 | 21 (16–30) |
| Inner London | 15.7 ± 4.83 | −4.77 ± 1.61 | 22 (17–31) |
| Rural | 15.7 ± 4.83 | −4.77 ± 1.61 | 19 (15–27) |
| Outer London | 22.3 ± 6.81 | −6.46 ± 1.96 | 30 (23–41) |
| Inner London | 22.3 ± 6.81 | −6.46 ± 1.96 | 31 (24–43) |
| Rural | 22.3 ± 6.81 | −6.46 ± 1.96 | 27 (21–38) |
| BEV | |||
| Outer London | 16.4 ± 5.22 | −5.00 ± 1.73 | 22 (17–31) |
| Inner London | 16.4 ± 5.22 | −5.00 ± 1.73 | 23 (18–33) |
| Rural | 16.4 ± 5.22 | −5.00 ± 1.73 | 20 (15–29) |
| Outer London | 23.4 ± 7.36 | −6.77 ± 2.11 | 31 (24–44) |
| Inner London | 23.4 ± 7.36 | −6.77 ± 2.11 | 33 (25–46) |
| Rural | 23.4 ± 7.36 | −6.77 ± 2.11 | 29 (22–40) |
| Total Emissions | E6DV mg.veh.km | BEV mg.veh.km | BEV (reg.lo) mg.veh.km | BEV (reg.hi) mg.veh.km |
|---|---|---|---|---|
| Outer London | 94.1 (59.2–238) | 92.9 (54.7–260) | 86.8 (50.8–252) | 74.7 (50.8–252) |
| Inner London | 100 (65–244) | 95.9 (57.1–263) | 89.3 (52.8–254) | 76.2 (52.8–254) |
| Rural | 85.4 (51.8–230) | 86.5 (49.7–255) | 81.5 (46.6–247) | 71.6 (46.6–247) |
| Outer London | 231 (126–768) | 241 (125–869) | 225 (115–848) | 194 (115–848) |
| Inner London | 241 (134–776) | 248 (131–874) | 231 (119–852) | 196 (119–852) |
| Rural | 215 (112–755) | 227 (114–859) | 214 (106–839) | 188 (106–839) |
| Classification | km.h | 1 km.h.s | 1 km.h.s | 2B km.h.s | 2T km.h.s | ||
|---|---|---|---|---|---|---|---|
| NAEI Route | |||||||
| Urban | 32 | 0.530 | 0.295 | −0.469 | 0.334 | 0.00489 | 0.0104 |
| Rural | 62 | 0.508 | 0.299 | −0.514 | 0.299 | 0.00248 | 0.00493 |
| Motorway | 82 | 0.388 | 0.384 | −0.466 | 0.307 | 0.00174 | 0.00319 |
| UKBC Phase | |||||||
| Outer London | 17 | 0.442 | 0.4188 | −0.619 | 0.2384 | 0.0087 | 0.0197 |
| Inner London | 10 | 0.4181 | 0.3574 | −0.647 | 0.2154 | 0.0139 | 0.0289 |
| Rural | 31 | 0.2877 | 0.4038 | −0.5912 | 0.2201 | 0.0042 | 0.0079 |
| Contribution | mg.veh.km | ||
|---|---|---|---|
| E6DV | |||
| Outer London | 10.9 ± 9.28 | 9.75 ± 1.43 | 35 (25–37) |
| Inner London | 10.9 ± 9.28 | 9.75 ± 1.43 | 57 (44–49) |
| Rural | 10.9 ± 9.28 | 9.75 ± 1.43 | 16 (9.2–26) |
| Outer London | 28.0 ± 23.6 | 26.1 ± 3.74 | 92 (68–97) |
| Inner London | 28.0 ± 23.6 | 26.1 ± 3.74 | 150 (120–130) |
| Rural | 28.0 ± 23.6 | 26.1 ± 3.74 | 41 (24–68) |
| BEV | |||
| Outer London | 11.7 ± 10.2 | 10.2 ± 1.85 | 37 (27–38) |
| Inner London | 11.7 ± 10.2 | 10.2 ± 1.85 | 59 (46–49) |
| Rural | 11.7 ± 10.2 | 10.2 ± 1.85 | 17 (9.7–28) |
| Outer London | 29.9 ± 26.0 | 27.3 ± 4.81 | 97 (72–100) |
| Inner London | 29.9 ± 26.0 | 27.3 ± 4.81 | 160 (120–130) |
| Rural | 29.9 ± 26.0 | 27.3 ± 4.81 | 43 (26–73) |
| Contribution | mg.veh.km | ||
| E6DV | |||
| Outer London | 15.7 ± 4.83 | 4.73 ± 1.63 | 30 (22–42) |
| Inner London | 15.7 ± 4.83 | 4.73 ± 1.63 | 39 (29–55) |
| Rural | 15.7 ± 4.83 | 4.73 ± 1.63 | 17 (13–24) |
| Outer London | 22.3 ± 6.81 | 6.43 ± 1.93 | 41 (32–57) |
| Inner London | 22.3 ± 6.81 | 6.43 ± 1.93 | 54 (42–75) |
| Rural | 22.3 ± 6.81 | 6.43 ± 1.93 | 25 (19–34) |
| BEV | |||
| Outer London | 16.4 ± 5.22 | 4.96 ± 1.76 | 31 (23–44) |
| Inner London | 16.4 ± 5.22 | 4.96 ± 1.76 | 41 (31–58) |
| Rural | 16.4 ± 5.22 | 4.96 ± 1.76 | 18 (14–26) |
| Outer London | 23.4 ± 7.36 | 6.74 ± 2.08 | 43 (33–60) |
| Inner London | 23.4 ± 7.36 | 6.74 ± 2.08 | 57 (44–79) |
| Rural | 23.4 ± 7.36 | 6.74 ± 2.08 | 26 (20–36) |
| Total Emissions | E6DV mg.veh.km | BEV mg.veh.km | BEV (reg.lo) mg.veh.km | BEV (reg.hi) mg.veh.km |
|---|---|---|---|---|
| Outer London | 114 (75.7–256) | 114 (72–278) | 105 (65.4–269) | 86.5 (65.4–269) |
| Inner London | 149 (105–285) | 147 (98.6–303) | 132 (87.1–291) | 102 (87.1–291) |
| Rural | 80.4 (48–225) | 81.2 (45.7–250) | 77.1 (43.3–243) | 68.8 (43.3–243) |
| Outer London | 274 (163–799) | 287 (164–900) | 262 (146–875) | 214 (146–875) |
| Inner London | 349 (226–854) | 361 (227–950) | 322 (196–917) | 243 (196–917) |
| Rural | 204 (104–745) | 216 (105–849) | 205 (98.5–831) | 183 (98.5–831) |
Disclaimer/Publisher’s Note: The statements, opinions and data contained in all publications are solely those of the individual author(s) and contributor(s) and not of MDPI and/or the editor(s). MDPI and/or the editor(s) disclaim responsibility for any injury to people or property resulting from any ideas, methods, instructions or products referred to in the content. |
© 2023 by the authors. Licensee MDPI, Basel, Switzerland. This article is an open access article distributed under the terms and conditions of the Creative Commons Attribution (CC BY) license (https://creativecommons.org/licenses/by/4.0/).
Share and Cite
Tivey, J.; Davies, H.C.; Levine, J.G.; Zietsman, J.; Bartington, S.; Ibarra-Espinosa, S.; Ropkins, K. Meta-Analysis as Early Evidence on the Particulate Emissions Impact of EURO VI on Battery Electric Bus Fleet Transitions. Sustainability 2023, 15, 1522. https://doi.org/10.3390/su15021522
Tivey J, Davies HC, Levine JG, Zietsman J, Bartington S, Ibarra-Espinosa S, Ropkins K. Meta-Analysis as Early Evidence on the Particulate Emissions Impact of EURO VI on Battery Electric Bus Fleet Transitions. Sustainability. 2023; 15(2):1522. https://doi.org/10.3390/su15021522
Chicago/Turabian StyleTivey, Jon, Huw C. Davies, James G. Levine, Josias Zietsman, Suzanne Bartington, Sergio Ibarra-Espinosa, and Karl Ropkins. 2023. "Meta-Analysis as Early Evidence on the Particulate Emissions Impact of EURO VI on Battery Electric Bus Fleet Transitions" Sustainability 15, no. 2: 1522. https://doi.org/10.3390/su15021522