Article

Impact of Green Development Mechanism Innovation on Total-Factor Environmental Efficiency: A Quasi-Natural Experiment Based on National Pilot Cities

1
Qingdao Institute of Humanities and Social Sciences, Shandong University, Qingdao 266237, China
2
Center for Yellow River Ecosystem Products Value Realization, Shandong University, Qingdao266237, China
3
School of Environmental Science and Engineering, Shandong University, Qingdao 266237, China
4
College of Economics and Management, Nanjing University of Aeronautics and Astronautics, Nanjing 211106, China
5
Institutes of Science and Development, Chinese Academy of Sciences, Beijing 100190, China
6
School of Public Policy and Management, University of Chinese Academy of Sciences, Beijing 100049, China
*
Author to whom correspondence should be addressed.
Sustainability 2023, 15(2), 1543; https://doi.org/10.3390/su15021543
Submission received: 3 December 2022 / Revised: 7 January 2023 / Accepted: 9 January 2023 / Published: 13 January 2023

Abstract

:
The implementation of green development has become an important choice for countries seeking the harmonious development of the economy and the environment. The National Ecological Civilization Pilot Zone is an innovative institutional mechanism for exploring green development in China. This study utilizes the National Ecological Civilization Pilot Zone policy as a quasi-natural experiment. Adopting data from 290 prefecture-level and above cities in China during 2014–2019 as the research object, this study matches the propensity score and improved differences-in-differences to assess the impact of green development mechanism innovation on regional total-factor environmental efficiency. The results show that this innovation had a significant impact on the improvement of total-factor environmental efficiency. Compared with non-pilot cities, the implementation of pilot zone areas contributed 16.78% to the growth of total-factor environmental efficiency in the experimental group cities. In addition, further analysis shows that mechanism innovation is more effective in areas with high pollution and high resource consumption. This study enriches the research on evaluation of the impact of innovation in green development mechanisms and provides a reference for further promoting pilot national ecological civilization zones.

1. Introduction

With the continuing progress and development of human society, the negative impact of production activities on the environment has become one of the global issues that must be urgently addressed [1]. Deterioration of the environment has in turn started to negatively affect human beings, resulting in representative features of decreasing economic growth, increasing unemployment, and unbalanced distribution of wealth [2]. In this context, how the emissions of various pollutants can be reduced while retaining production activities to achieve green development has become one of the hot research topics across various countries. Many countries and organizations have made considerable efforts to promote green development. In 2010, the World Bank and the International Monetary Fund actively promoted the Green Fund program. In 2012, the United Nations Conference on Sustainable Development proposed the development of a green economy to promote green development. In the process of green development, a number of countries (such as the United States, Germany, and Japan) have introduced relevant policies [3]. In order to encourage the transformation and upgrading of domestic enterprises, the United States introduced the Energy Policy Program and the National Comprehensive Energy Strategy. Similarly, to accelerate the transformation of domestic enterprises while reducing emissions, Germany promulgated the extremely strict Combustion Pollution Control Act and the Air Emissions Control Act. Because of its resource shortage, Japan focused on recycling of resources by its citizens and enacted laws on the recycling of household appliances, recycling of containers and packaging and an automobile recycling program.
China is also actively pursuing actions to promote green development. The China Human Development Report 2002 clarified for the first time that green development is an inevitable path for China. The Outline of the 12th Five-Year Plan for National Economic and Social Development of the People’s Republic of China (promulgated in 2011) shows that for the first time China has incorporated green development at a national document level. In 2015, the effective increase in the prevention and control of water pollution and the guarantee of national water security was promulgated. In 2016, the General Office of the Communist Party of China (CPC) Central Committee and the General Office of the State Council issued the formulation of the Green Development Index System as the basis for the evaluation and assessment of the construction of China’s ecological civilization. Subsequently, the 
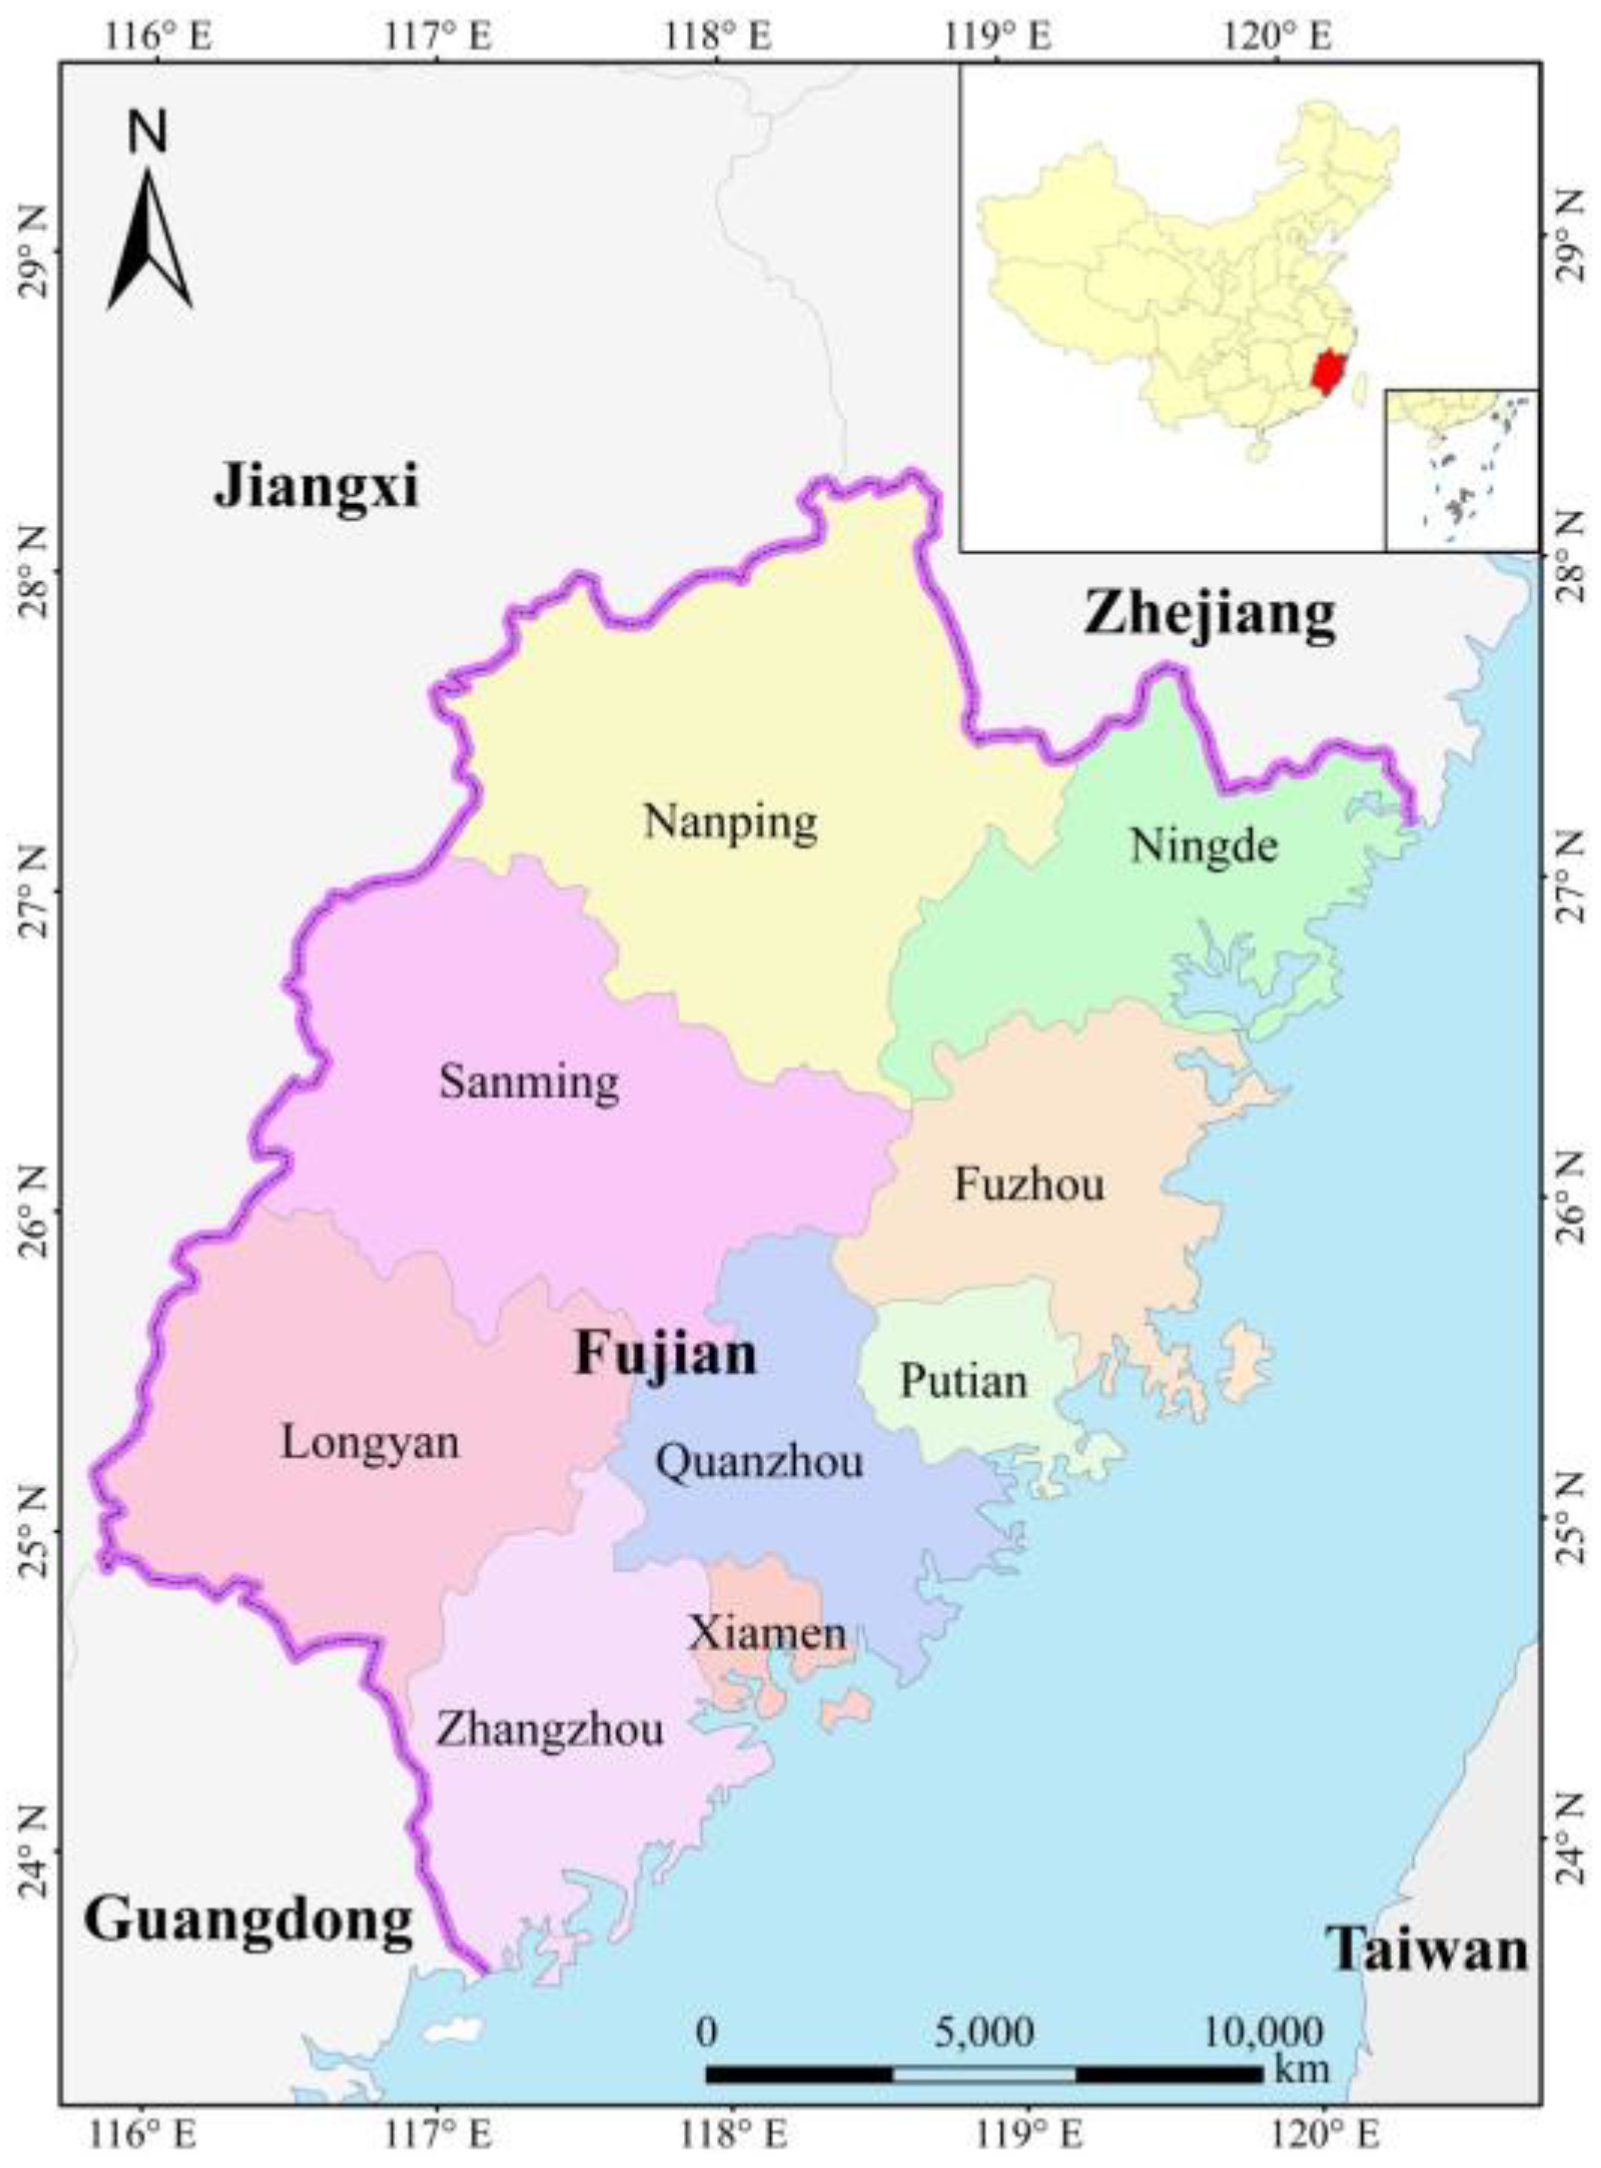
National Ecological Civilization Pilot Zone (Fujian) Implementation Plan was promulgated, and Fujian province became the first national ecological civilization pilot zone. Fujian has made positive progress and has shown obvious results in the construction and reform of ecological civilization. This shows that the National Ecological Civilization Pilot Zone acted as an innovative mechanism to promote green development in China and has had a significant impact on reducing environmental pollution and improving ecological benefits [4]. Therefore, the innovative green development mechanism in China’s pilot ecological civilization zones may have some practical significance for green development in other countries.
Environmental efficiency is often used to quantify the quality of the balance between economic growth and environmental protection during a region’s green development. It is often applied in studies at national, provincial, and city scales. Studies focusing on environmental efficiency at the national scale focus on the whole country [5] and have been conducted for OCED countries [6,7], the B&R countries [8], and EU member states [9]. Studies at the provincial scale started from the green development efficiency of each province and moved to its implementation at the national level [10,11,12]. To measure green development efficiency at the city scale, Li et al. (2021) [13], Liu et al. (2020) [14], Wang et al. (2018, 2019) [15,16], and Jia et al. (2018) [17] measured the green development efficiency of key Chinese regions, such as Beijing-Tianjin-Hebei, the Yangtze River Economic Belt, the Yangtze River Delta, the Pearl River Delta, and the Yellow River Basin, respectively.
In addition to measuring environmental efficiency, the factors influencing environmental efficiency are also a hot research topic and can be divided into direct and indirect influencing factors. Most studies on direct influencing factors analyze the influence of two major categories on environmental efficiency, namely the input and the output. The amount of fixed asset investment, labor input, and resource and energy inputs are the primary factors most often employed in studies focusing on the impact of input factors on environmental efficiency [18,19,20]. However, indirect influences on total-factor environmental efficiency (TFEE) are mainly considered external influences and include the level of economic development [21], industrial structure [22,23,24], and regional openness [25].
Indirect factors of governmental behavior, such as governmental inputs [26] and policy implementation [27,28] affect TFEE by influencing direct factors. In recent years, how to reflect and quantify the effect of policy reforms or pilots on TFEE has become one of the key foci of academic research. At present, there are two different theoretical perspectives on the study of the impact of policies on environmental efficiency. One view is that the impact of the implementation of environmental policies on TFEE is negative and that the implementation of environmental policies increases the production costs of treating pollutants by firms or reduces production inputs to reduce the emissions of pollutants, thereby reducing TFEE [29,30]. Another view is that the implementation of environmental policies can improve TFEE. For example, Ouyang et al. (2020) [31] revealed that carbon emission policies can effectively reduce CO2 emissions and increase total-factor productivity. Liu et al. (2021b) [32] explored the impact of air-pollution control policies in key Chinese cities and found that environmental regulations provided substantial improvements in environmental quality and were able to partially offset the negative effects of cost impacts.
While the issues of green development mechanism innovation and enhancement of environmental efficiency have been discussed sufficiently, there is still room for expansion. Specifically, research should focus on the following three aspects: First, the mechanism and policy effects on environmental efficiency enhancement employed a focus on the theoretical level, and quantitative studies on the relationship between the two factors are scarce. In particular, the impact mechanism of national ecological civilization pilot zone policy on the enhancement of environmental efficiency is less explored. Second, studies on the identification of the effects of policy mechanisms rarely exclude the interference of other possible factors. Third, studies on the effects of policy mechanism innovation on the enhancement of environmental efficiency focus only on the average level, while they leave the heterogeneous effects on different types of cities unexplored.
To fill these research gaps, this study presents an in-depth exploration of the impact of green development mechanism innovation on TFEE. A total of 290 Chinese cities at the prefecture level and above were taken as research objects. Nine cities in Fujian province that were listed as the first pilot ecological civilization construction zones were taken as the experimental group, and the remaining 281 cities were taken as the control group. The TFEE and its cumulative improvement for the period of 2014–2019 in these cities was measured, and the effect of mechanism innovation was assessed (i.e., the effective promotion of ecological civilization construction pilot city work and its effect on local environmental efficiency). The performance of mechanism innovation on the improvement of environmental efficiency was assessed for different types of cities.
This study presents three main research contributions. First, the policy effect of mechanism innovation on environmental efficiency is considered. From the policy perspective, the mechanism of the effective implementation of the pilot ecological civilization construction zone policy on the enhancement of environmental efficiency is clarified. Second, although some studies have explored the effects of environmental policies on environmental efficiency, they have not excluded the effects of other possible factors [33,34]. This study identifies the net effect of green development mechanisms on the enhancement of environmental efficiency. Herein, the factors that may affect the enhancement of environmental efficiency, such as city size and strength, are controlled, and the role of green development mechanism innovation in enhancing the environmental efficiency is examined. Third, the average and heterogeneity impact of pilot policies on environmental efficiency are explored. In addition to the general impact of green development mechanisms on environmental efficiency, the heterogeneity impact of green development mechanisms on urban environmental efficiency is also studied. The remainder of this study is organized as follows: Section 2 analyzes the institutional background and theoretical hypothesis of pilot ecological civilization zones. Section 3 presents the methods, cases, and models used in this study. Section 4 analyzes the overall impact of mechanism innovation on changes in environmental efficiency. Section 5 provides an in-depth analysis of the heterogeneous impact of mechanism innovation on different cities, and Section 6 presents a summary of key results, suggests policy recommendations, and provides a research outlook.

2. Policy Background and Theoretical Hypothesis

Green development innovation can be understood simply as an innovative mechanism to reduce adverse impact on the environment or improve environmental performance. Similar concepts include eco-innovation, environmental innovation, and innovation for sustainable development [35]. Compared with traditional green development mechanisms, green development mechanism innovation considers environmental issues while achieving economic benefits. The current green development mechanism innovation is mainly in macro-level national or regional green innovation policy design. China is an active practitioner of green development [36]. Based on the concept of sustainable development, the Chinese government proposed the path of developing an ecological civilization and elevated the status of the construction of an ecological civilization to a national strategy in 2007 [37]. In the construction of an ecological culture, the National Ecological Civilization Pilot Zone Policy is able to combine national strategies with specific local practices, allowing the ecological civilization development paradigm to align with China’s current national conditions. Compared to other green development mechanism innovations, the National Ecological Civilization Pilot Zone policy creates a vehicle and coordination mechanism for other specific policies and is the latest achievement in China’s environmental governance. It is crucial to study the impact of national ecological civilization pilot zone policies on green development innovation [38].

2.1. The Pilot Ecological Civilization Zone

Since 2012, China has made a series of decisions and arrangements to accelerate the construction of ecological civilization. A number of programs were introduced for accelerating the construction of an ecological civilization and reforming the ecological civilization system. This is particularly the case regarding the institutional system, which is not yet complete. The institutional mechanism bottleneck must be overcome. To achieve this, the combination of top-level design and local practice must be strengthened, reform and innovation experiments must be carried out, and an ecological civilization institutional model suitable to China’s national conditions and the development stage of each place must be identified [4]. Against this backdrop, the 13th Five-Year Plan for China’s national economic and social development clearly proposes the establishment of a unified and standardized national ecological civilization pilot zone. This step should strengthen the guidance for the construction of local ecological civilization in provinces and municipalities, accelerate the construction of China’s ecological civilization, and realize the harmonious coexistence of man and nature [39].
Because of Fujian’s good ecological foundation, the government attaches great importance to its sustainable development and ecological civilization. In August 2016, the General Office of the CPC Central Committee and the General Office of the State Council issued the Implementation Plan for the National Ecological Civilization Pilot Zone (Fujian). This plan aims to continue Fujian’s long experience in building an ecological civilization and promoting the reform of the ecological civilization system toward higher standards and greater resolution. As a testing ground, Fujian will turn ecological advantages into development advantages and achieve green development, green enrichment, and green benefits for the people. As a result, Fujian became the first national ecological culture pilot area of China [40].

2.2. Overview of the Pilot Cities

Fujian (23°33′–28°20′ N to 115°50′–120°40′ E) is located in southeastern China, and it is one of the four coastal provinces of eastern China (these are Shandong, Zhejiang, Jiangsu, and Fujian, excluding Taiwan and Shanghai). It faces the Taiwan Strait to the east and Taiwan province to the northeast, borders Zhejiang province to the northeast, crosses the Wuyi mountains to the northwest and Jiangxi province to the border, and is connected to Guangdong province to the southwest, thus connecting the Yangtze River Delta and the Pearl River Delta. Fujian has nine prefecture-level cities (Fuzhou, Xiamen, Quanzhou, Zhangzhou, Putian, Longyan, Sanming, Nanping, and Ningde), with 12 county-level cities, 44 counties, and 29 municipal districts, as shown in Figure 1.
In 2019, Fujian achieved an annual regional GDP of 42,395.00 billion yuan, which represents a 7.6% increase over the previous year. In the same year, Fujian ranked 8th in the country in terms of GDP. The annual per capita regional GDP was 15,534.8 USD, which represents a 6.7% increase over the previous year, reaching the level of high-income countries. The total population was 39.73 million, which is close to the average of the country. Moreover, the regional urbanization rate reached 66.5%, which is higher than the national average. The proportion of secondary industry was 48.5%, which is more than 10 percentage points higher than the national average [41]. The proportion of tertiary industry ranked last in China, and therefore the industrial structure must be optimized.
The ecological environment of Fujian leads the country. The water quality ratio of 12 major watersheds in the province is 96.5%, which is 21.6 percentage points higher than the national average (2019). The water quality compliance rate of centralized drinking water sources is 100% at the county level and above. The average ratio of urban air quality compliance days in nine cities and one district is 98.3%, which is 16.3 percentage points higher than the national average. The forest coverage rate is 66.8%, which holds first place in the country. Fujian is also the breeding ground of Xi Jinping’s concept of ecological civilization and boasts remarkable achievements in its construction [42]. This province has been the pioneer and benchmark area for the construction of ecological culture in China and is the only province that has a sufficiently good foundation in the National Ecological Civilization Pilot Area Implementation Plan.

2.3. Theoretical Hypothesis

The Implementation Plan for the National Ecological Civilization Pilot Zone (Fujian) calls for building a new model of ecological civilization, exploring innovation in ecological civilization institutions and mechanisms, and accelerating green development. As a kind of policy mechanism innovation, the role of pilot ecological civilization zones in improving environmental efficiency is mainly reflected in the role played by increasing the output of economic benefits and reducing the resource input level of social services. From the perspective of increasing the output of economic benefits, green development mechanism innovation in the pilot ecological civilization zone can significantly promote the research and development and utilization of innovative technological means of environmental protection by enterprises and promote economic growth by improving the production efficiency of enterprises [43,44]. Second, ecological civilization pilot areas can improve environmental efficiency by reducing the input of resources for social services. Ecological civilization pilot zones have become the core of China’s environmental regulation [43], both by formulating targeted policies or regulations to effectively reduce environmental pollution in production processes and households and environmental regulations that reduce environmental costs and capital investment by penalizing highly polluting enterprises with sloppy production and subsidizing those with effective pollution control [45]. Drawing on the above discussion, the hypotheses for the current work are proposed as follows:
Hypothesis 1. 
There is a positive impact of institutional innovation in the ecological civilization pilot zone in the improvement of TFEE.
High environmental pollution areas are usually more sensitive to the implementation of mechanism innovation. According to research by Greenstone and Hanna (2014) [46], if the concentration of pollutants does not reach a severe level, public demand for pollution control is insufficient, and policies that aim to reduce pollution may become less effective. Meanwhile, highly polluting areas adopt various environmental policies to mitigate pollution to avoid environmental penalties due to ecological assessments [47].
Hypothesis 2. 
Institutional innovation in the ecological civilization pilot zones has a more significant impact on the TFEE of high-energy-consumption and high-pollution areas.
Regions with different resource consumption have different sensitivities to policy implementation. Institutional innovation in the pilot ecological civilization zone is a systemic project that requires investment in services, manpower, and capital. Resource input is vital for advancing green development. Countries with higher levels of resource inputs are more capable of creating, adopting, and using advanced, eco-friendly technologies, which can improve economic growth and reduce environmental pollution [48]. Therefore, regions with different levels of resource consumption may be sensitive to policy implementation to different degrees. Drawing on the above discussion, the hypothesis is proposed as follows:
Hypothesis 3. 
Institutional innovation in the ecological civilization pilot zone has a more significant impact on the TFEE of high-resource-consumption areas.
The theoretical framework of this paper is shown in Figure 2.

3. Methods and Datasets

To analyze the impact of the implementation of the National Ecological Civilization Pilot Zone (Fujian) on TFEE and assess the effectiveness of policy implementation, data envelopment analysis was used to measure the TFEE of cities in Fujian and the whole country. Then, the differences-in-differences (DID) method was used to estimate the impact of the implementation of this program on TFEE. The advantage of the DID method is that it can eliminate selection bias by comparing the differences that exist between the nine cities in the pilot area and those that are not in the pilot area itself. However, implementing real-world scenarios does not easily meet the requirements of randomized experiments. Typically, propensity score matching (PSM) is used to identify or construct a control group that can be compared to an experimental group. These three models and methods were combined to ensure that the most-accurate representation of the impact of the policy on the total-factor environment was obtained.

3.1. Total-Factor Environmental Efficiency

The literature to date contains two main methods for TFEE. One is the parametric stochastic frontier approach (SFA) method and the other is data envelopment analysis (DEA). SFA is a method that uses maximum likelihood estimation to measure a “frontier” value and thereby provide a measure to evaluate TFEE through the frontier value. However, the traditional SFA method suffers from its inability to solve the multi-input–output problem and has endogenous defects [49]. As a nonparametric method, DEA, originally proposed by Charnes et al. (1978) [50], can assess the effectiveness of decision units with multiple input and output indices, decompose the sources of total-factor environmental efficiency, and overcome the problem of considering only a single input and not considering undesirable outputs [51]. As a result, DEA is increasingly applied to the study of efficiency concerning environmental factors and is now the main method for measuring total-factor environmental efficiency. Therefore, the DEA method was chosen to measure the TFEE of the pilot cities. Considering that the traditional radial efficiency measurement model, under which input and output factors increase or decrease proportionally, the model ignores the slack in inputs and outputs. Therefore, using this model may result in an overestimation of technical efficiency in case of non-zero slack in the optimal solution [52,53,54]. This study uses a slack-based measure (SBM), which considers non-desired output variables. To further identify the efficiency gap among cities, especially the performance differences among cities with an SBM efficiency value of 1, this study combines the super-efficiency DEA model and constructs the super-SBM model to measure the TFEE of pilot cities.

3.1.1. Super Slacks-Based Measurement Model

The socioeconomic development process of n decision-making units (DMUs) consumes a total of m classes of input factors and produces p classes of desired outputs and q classes of non-desired outputs. The input–output vectors x j = ( x 1 j , , x m j ) T , y j = ( y 1 j , , y p j ) T , and u j = ( u 1 j , , u q j ) T corresponding to the input–output matrices   X = ( x i j ) m × n ,   Y = ( y r j ) p × n , and   U = ( u l j ) q × n are composed of P P S = { ( X , Y , Z ) } | X   c a n   p r o d u c e   ( Y , U ) } .
The slack variables of x , y , and u are introduced as representations of the fraction of input variables that are overconsumed, undesired output, and undesired output, respectively. Furthermore, the TFEE α of DMUs under the SBM can be expressed as:
min α = ( 1 + 1 m i = 1 m s i x x i 0 ) / ( 1 1 p + q ( r = 1 p s r y y r 0 + r = 1 q s r u z r 0 ) ) s . t . h l · j = 1 , 0 n λ j u j 1 1 p + q ( r = 1 p s i y y r 0 + r = 1 q s i u z r 0 ) > 0 j = 1 , 0 n λ j = 1 , λ 0
where l = x , y , z and u = x , y , z , that is, h x · = x 0 , h y · = y 0 , and h z = z 0 . s x , s y , s z 0 . This equation is a fractional program. The Charnes–Cooper transformation [55] is employed to transform model (1) into a linear programming (LP) model, as given by Equation (2).
min β = θ + 1 m i = 1 m S i x x i 0 s . t . θ 1 p + q ( r = 1 p S r y y r 0 + r = 1 q S r z z r 0 ) = 1 θ h l · j = 1 , 0 n ψ j u j j = 1 , 0 n ψ j = θ , ψ 0
where S = θ s . The optimal solution of the LP model is ( β * , ψ * , s x * , s y * , s z * ) , and the optimal solution of FP α * = β * , λ * = ψ * θ * , s x * = x ˜ * θ * , s y * = y ˜ * θ * , s z * = z ˜ * θ * can be calculated. The higher the efficiency value, the higher the TFEE of the DMU. Only the TFEE of a DMU with α * 1 is effective, and the economic and social development process achieves green development.

3.1.2. Data Sources and Pre-Processing

Based on the evaluation index system employed by related studies [56], the input–output logic model for TFEE was constructed (Figure 3).
The specific meaning and data sources of the indicators are as follows:
Electricity consumption: This indicator reflects the electricity consumption of production inputs during the test year. In this study, electricity consumption was measured as the electricity consumption of all social sectors and the electricity consumption of urban and rural residents. The data were obtained from the China Urban Statistical Yearbook and the statistical yearbooks of various provinces and cities.
Water consumption: This indicator reflects the amount of water used for production inputs in the test year. In this study, water consumption was measured by the amount of water used by all sectors of society as well as the amount of water used by urban and rural residents. The data were obtained from the water resources bulletin of each province.
Human input: This reflects the number of people engaged in production processes during the test year. This indicator was measured by the number of people employed. The data were obtained from the Population and Employment Statistical Yearbook and provincial and municipal statistical yearbooks.
Fixed capital input: This indicator reflects the amount of capital invested in production during the test year and is measured by the amount of work involved in the construction and acquisition of fixed assets in a given period and the costs associated with their construction and acquisition. The data were obtained from the China Urban Statistical Yearbook and provincial and municipal statistical yearbooks.
GDP: This indicator reflects the amount of output produced during the test year. In this study, GDP was measured by the final results of production activities of all resident units in a region during a certain period of time. The data were obtained from the China Urban Statistical Yearbook and statistical yearbooks of provinces and cities.
Air pollution: This indicator reflects the amount of air pollution that accompanies the production output in the test year and is measured by the Air Quality Index (AQI). The data were obtained from the China Environmental Statistical Yearbook and Ministry of Natural Resources data.
Water pollution: This indicator reflects the amount of water pollution that accompanies production output during the test year and is measured by the city water quality index (CWQI). The data were obtained from the China Environmental Statistics Yearbook and Ministry of Natural Resources data.

3.2. Differences-in-Differences Method

DID is a popular method used to test the effectiveness of policies by combining analysis before and after implementation of a policy [57,58,59]. It also reflects whether the policy was implemented and includes other covariates in the model that may affect the outcome of the policy, thus controlling other factors that may affect both the control and the experimental groups and compensating for the “natural experiment” effect (thus overcoming the shortcomings of “natural experiments” in which sample selection is not completely randomized). This model determines the impact of the policy by constructing an experimental group that is affected by the policy and a control group that is not affected by the policy. The impacts on both the experimental group and the control group are compared before and after the implementation of the policy. The basic model is given by Equation (3).
Y i t = β 0 + β 1 D i × T t + u i + δ t + γ Z i t
where the constructed area dummy variable is D i . The time dummy variable is defined as unity if D i is a city within the experimental group and 0 otherwise. T t is defined as unity in the period after the policy is implemented and 0 in the period before the implementation of the policy. Furthermore, Y i t is the explanatory variable, u i is the individual fixed effect, δ t is the time-fixed benefit, and Z i t represents other control variables. Additionally, β 1 is the net effect the response policy has on the explanatory variable, i.e., the estimate of the DID coefficient.
In reference to relevant studies [31,32], in the model of this experiment, the chosen Z it was the GDP and GDP per capita share of the tertiary sector. According to the basic concept of DID, the coefficient β 1 of the cross term D i × T t is the main coefficient to be estimated and the net effect of mechanism innovation on TFEE.
The basic correlations are given by Equations (4)–(8).
TFEE for the control group before 2016:
P D i = 0 , T t = 0 = β 0 + γ Z i t
TFEE of the control group after 2016:
P D i = 0 , T t = 1 = β 0 + δ t + γ Z i t
Full-factor environmental efficiency of the experimental group before 2016:
P D i = 1 , T t = 0 = β 0 + u i + δ t + γ Z i t
Full-factor environmental efficiency of the experimental group after 2016:
P D i = 1 , T t = 1 = β 0 + β 1 + u i + δ t + γ Z i t
From the above equation the net impact coefficient β 1 can be derived:
β 1 = ( P D i = 1 , T t = 1 P D i = 1 , T t = 0 ) ( P D i = 0 , T t = 1 P D i = 0 , T t = 0 )

3.3. Propensity Score Matching Method

As mentioned above, the DID method is often chosen to test the effects of policy shocks. However, the traditional DID method cannot easily ensure the same trend between the experimental and control groups, which can affect the accuracy of the results. The PSM-DID method, which first uses PSM for sample matching and then DID for identifying the shock effects, can effectively avoid this problem.
The PSM method, which was first proposed by Rosenbaum and Rubin (1983) [60], is based on the core ideas of “scoring” and “matching” by using a logistic regression model for estimating a propensity score based on characteristics that can be extracted from a study population. The propensity score, which ranges from 0 to 1, represents the probability that an individual will be randomly assigned to the experimental or control group [61,62,63]. This measure represents the chance that subjects have of the same probability of receiving the policy impact. Although it is possible that the characteristic variables may differ significantly between the two subjects [64], the PSM method allows the experiment to be close to a “quasi-natural experiment”.
The propensity score is a scalar summary of the pretreatment characteristics in logistic regression. The propensity score is defined as the conditional probability that the study subject i = ( i = 1 , , N ) is randomly assigned to the experimental group Z i = 1 rather than the control group Z i = 0 . This is conditional to the combined characteristic variables ( X i ) and can be expressed as e ( x i ) = P ( Z i = 1 | X i = x i ) . Assuming that the grouping variables are independent given a set of characteristic variables X i , Equation (9) is obtained.
P ( Z 1 = z 1 , ,   Z n = z n | X i = x 1 , ,   X n = x n ) = i = 1 N e ( x i ) Z i { 1 e ( x i ) } 1 Z i
In this case, the city chosen for the implementation of the program was not random. Therefore, logistic regression was first used via a PSM (with a variable of 1 for the implementation of the program and 0 otherwise), where the variables included the pretreatment characteristics that might affect the “propensity” to implement the program. Then, using nearest neighbor matching and caliper matching, this was matched to cities with scores closest to the experimental group, thus forming the control group.
The PSM-DID approach combines both PSM and DID methods. The differences between the experimental and control groups using DID alone may be influenced by factors such as city size, which leads to biased results. Specifically, the PSM-DID model matched cities in the experimental group with cities in the control group through the propensity score. Then, the experimental group and the control group were studied using the DID method. Consequently, the PSM-DID method can effectively reduce the variability between the control group and the experimental group caused by other factors, thus achieving a “quasi-natural experiment” through random selection as much as possible and obtaining more-accurate results.

4. Analysis of the Empirical Results

4.1. Analysis of the Results of TFEE

The calculated results of TFEE are shown in Figure 4. During 2015–2019, the average TFEEs of the pilot areas were close to unity, and the quality of green development was good. Using an environmental efficiency of 0.8 as the benchmark, the cumulative TFEE of each pilot city during 2015–2019 was calculated. As shown in Figure 3, most of the cities in the pilot area had relatively clear growth rate inflection points in 2015–2016 as well as in 2016–2017. As a result, the following preliminary hypothesis is proposed: All pilot cities responded to the implementation of this policy after the innovation of the green development mechanism, that is to say, the designation of the pilot zone. However, the response time for improvement in the quality of green development may evolve differently because of different development base conditions in each region.
Specifically, the cumulative environmental efficiency of each pilot city increased year by year. Among them, Xiamen’s cumulative TFEE took the lead in the pilot area, with an increase of 1.2420 from 2014 to 2019. This was followed by Quanzhou and Sanming, with efficiencies of 1.201 and 1.181, respectively. Putian’s green development level was significantly lower than the levels of other cities, with the cumulative TFEE in the pilot area ranking last in five years, with a value of only 0.5764.

4.2. Impact of Green Development Mechanism Innovation on TFEE

4.2.1. Impact of Mechanism Innovation on TFEE

Based on the research concept and methodological model constructed in Section 3.3, various regional economic and social development indicators including urban economic development and population size were selected for PSM. The four specific indicators of population size, GDP, urban population size, and added value of tertiary industry were selected as the matched indicators, and TFEE was taken as the policy effectiveness indicator.
After matching the treatment and control cities based on the pretreatment characteristics, nine pilot cities (experimental group cities) were obtained and matched with nine non-pilot cities (control group cities). Comparison of the deviations between the experimental and control group cities before and after PSM showed that after the implementation of PSM, most of the indicators in both groups were significantly reduced (Figure 5). Combined with the specific numerical results, the standard errors of control group cities were reduced significantly after matching, and after matching, all the absolute values of standard errors were below 10%. After the implementation of PSM, the t-values were also significantly reduced, and after matching, the p-values of the t-tests exceeded 10%. There was no significant difference between the experimental and control groups before and after PSM, which showed that it was feasible to use the PSM method in this experiment (Table 1).
After PSM pairing of the nine municipalities in the experimental area, nine corresponding municipalities were obtained. After controlling for GDP per capita and the share of three industries, the cross-influencing factors of these two control variables were controlled to make the experiment more accurate. The analysis of the effectiveness of the policy was conducted on these 18 municipalities using the DID model, and the results are presented in Figure 6 and Table 2. After controlling for the two other control factors and their cross-influencing factors, the cross-influencing factor D i × T t of policy implementation time and policy implementation area on the improvement of TFEE was found to pass the 1% significance level test. It had a positive effect, indicating that the policy significantly impacted TFEE. The cumulative TFEE of the experimental group improved by 0.9820 from 2014 to 2019; however, for the control group the value increased by only 0.6997. The efficiency of the experimental group was 0.2823 higher than that of the control group, and the portion of the increase in TFEE growth rate caused by the implementation of innovation reached 16.78%. The cumulative TFEE of the experimental group for the two years before and after the shock year of mechanism innovation implementation (i.e., 2016) was 0.3721. This was 0.0961 points higher than the cumulative total-factor growth rate of the control group, whereas the growth rate was 4.76% higher than that of the control group.
Furthermore, the impact of mechanism innovation on the desired and non-desired output subsets of the study was investigated. Based on results presented in Figure 7 and Table 3, it can be inferred that although the impact of the advancement of mechanism innovation on desired output was not strong enough, the impact on the two non-desired outputs was stronger, although it did not reach the 1% significance level. The implementation of mechanism innovation was likely the key to green development, whereas green development was one-sided regardless of whether it focused on the environment or the economy alone. Green development should be an all-round cooperative development of resources, economy, and environment. It can be concluded that total-factor productivity was the quantitative indicator for measuring green development in the experiment.

4.2.2. Policy Effectiveness Tests

In order to estimate the effectiveness of the policy, a series of tests was conducted to test whether the increase in TFEE in the pilot region was caused by the impact of institutional innovation or not. This section will present two tests of policy effectiveness in terms of parallel trends and robustness.

Parallel Trend Test

The parallel trend test was used to assess whether the DID model can be applied to this study by testing whether the variation trends of the experimental group and the control group were the same and comparable before and after the experiment.
Hypothesis H 0 states that under the premise that both the control group and the treatment group have a linear time trend, it should be further tested whether the linear trend of the two is the same or not. Then, an F-test was conducted, which obtained the following values: F = 4.93 and Prob > F = 0.0403. Therefore, the original hypothesis can be accepted, and the control combination treatment group has the same linear trend. This linear trend is shown in Figure 8. It can be seen that the difference between the control group and the experimental group before the implementation of the green development mechanism innovation is not significant. However, after implementation the difference between both groups gradually increased. This shows that implementing the mechanism exerted a significant positive impact on TFEE.
A parallel trend test was conducted using the event study method, which is more accurate and scientific than drawing a parallel trend graph. The value for 2016 was used as the baseline value to obtain Figure 9, which shows that there was no significant difference between the control group and the control group of the year before the implementation of the green development mechanism innovation. This indicates that the parallel trend hypothesis is valid, and the experimental and control groups were comparable before the implementation. This corroborates that the DID method is applicable to test the impact of mechanism innovation on TFEE.

Robustness Tests

Robustness tests were conducted to identify the effect of the introduction of mechanism innovation on explanatory variables by replacing these variables. The goal was to test whether green development mechanism innovation affects TFEE or not. In this study, the number of industrial enterprises and amount of industrial sulfur dioxide emissions were selected as the explanatory variables to measure the effectiveness of the pilot policy. The effect of the implementation of mechanism innovation on the number of industrial enterprises above the scale was not significant in any model. The results indicated that the improvement of TFEE was an effect of the policy rather than the other confounding factors. Moreover, the policy did not affect other unrelated factors. The impact of the implementation on industrial sulfur dioxide emissions was further analyzed, and the results showed that it was also insignificant. Since this variable is related to the environment, it was much more significant compared to the number of industrial enterprises above the scale, which was not related.
The results presented in Figure 10 and Table 4 show that there was no significant change in the number of industrial enterprises above the scale before and after implementation of the mechanism innovation. Implementing the mechanism did not impact the number of industrial enterprises above the scale. The results presented in Figure 11 and Table 5 show that, although the changes in industrial sulfur dioxide emissions before and after the implementation did not greatly change, the number of industrial enterprises above the scale exerted a certain influence because there was a clear correlation. In short, the impact of mechanism innovation on TFEE was significant, and after excluding many factors, this impact could be obtained.

4.2.3. Comparison of Results

Performing double differencing leads to the emergence of different impact cases because of the existence of different model settings. In this section, the impact cases obtained from different model analyses are analyzed and compared to further illustrate the impact of mechanism innovation on TFEE.
Figure 12 shows six models, including the original model, in the following order: original model, Model 1, Model 2, Model 3, Model 4, and Model 5.
Model 1 analyzed the impact of mechanism innovation implementation on TFEE only after PSM pairing and without controlling other variables. Compared to the original model, the impact was slightly lower than that caused by the original model if covariates and covariate cross-influences were not controlled, which are caused by covariates and covariate crosses. The same was done for Model 2.
Model 2 analyzed the impact of controlling covariates and not the crossover effects between the covariates. According to the results, the crossover effect was not controlled. The calculated significant portion was induced by the crossover factor; however, the control of crossover effects was still significant. This means that the mechanism innovation impacted TFEE.
Models 3, 4, and 5 correspond to the first three models without PSM pairing and were set up to directly analyze the impact of the implementation of mechanism innovation on TFEE. The model without PSM still yielded a significant effect of the implementation on TFEE; the increase in significance was due to the reduction in the number of samples after matching.
Comparison of the above six models shows that regardless of how the models changed, the conclusion that can always be obtained is that the mechanism innovation had a significant positive effect on the green total-factor impact rate. Comparison of the original model with Models 1 and 2 shows that the results obtained by the original model were more accurate after controlling the covariates and cross-action effects of the covariates. The results are shown in Table 6. The slight difference between the original model and Models 1 and 2 originated from whether the covariates were controlled or not. A comparison of the first three models with the last three models showed that the gap between the model groups was significantly larger than the gap within the model groups, which proves that larger deviations can be controlled after the PSM operation, thus allowing us to move closer to the real impact of institutional innovation on the green total-factor impact rate.

4.3. Further Exploration of the Influencing Mechanism

There are significant differences among different types of cities in terms of natural resource endowment and economic development. Further research is needed on whether these differences affect policy effects or not. To this end, the sensitivity of different types of cities to the implementation of mechanism innovation is further explored by classifying them according to their different performances in the seven indicators of total-factor environmental efficiency and identifying which types of cities can respond quickly to mechanism innovation, with a view to promoting differentiated mechanism innovation implementation.

4.3.1. Resource Consumption Incentive Mechanism

As shown in Figure 2, the resources consumed in the green development process consist of service resources and social resources. Therefore, the resource consumption incentive mechanism is also divided into these two categories.
Service resource inputs are mainly characterized by electricity and water consumptions. According to the national average of available data, electricity and water consumption are classified into areas of high and low consumption. Then, using the original model and Models 1 and 2, the sensitivity of these types of areas to the implementation of institutional innovation was analyzed. The results are presented in Table 7. For regions with high water and energy consumption, the institutional innovation of national ecological civilization pilot zones had a significant impact on TFEE at 5% and 1% significance levels, while for low-water- and low-energy-consumption areas, this improvement was not observed. This suggests that institutional innovation had a greater role in green development in high-energy-consuming regions, and that such regions were more sensitive to policy due to the greater need for environmental efficiency improvements.
Social resource inputs are mainly characterized by human and fixed capital inputs. According to the criterion of using the national average of available data, regions were divided into high and low human input regions and high and low capital input regions. Regions that were highly sensitive to the implementation of mechanism innovation were identified by exploring the cross-influence of these region types with the variables of region and mechanism innovation implementation.
As shown by the results presented in Table 8, although the original model of high human input was only statistically significant at the 10% level, both Models 1 and 2 were statistically significant at the 5% level. The effect of the cross coefficient of low human input regions with D i × T t was not significant, which showed that high human input regions were more sensitive to the policy. In contrast, high capital input was significant above a statistical level of 5% regardless of the model, and there was no significant effect for low capital input. In short, the institutional innovation exerted the greatest effect on green development in areas of high social input. These areas were more sensitive to policy, whereas the policy implementation in such areas was more effective.

4.3.2. Economic Output Incentive Mechanism

Similarly, the GDP of cities was divided into high and low economic output based on the national average. The sensitivity of areas with different economic outputs to policy implementation was explored. The results are presented in Table 9. For high economic output areas, the effect of mechanism innovation on TFEE was significant at the 10% confidence level, while the effect of mechanism innovation on TFEE for low economic output areas was not significant. Therefore, it can be concluded that institutional innovation for green development did not contribute significantly to economic development. The reason for this result is that green development and economic output are not directly related, and that green development is more of a balanced development of resources, environment, and economy.

4.3.3. Environmental Pollution Incentive Mechanism

Similarly, the non-desired outputs of air and air pollution are classified into high and low water pollution and high and low air pollution according to the national average using AQI and CWQI. As shown by the results presented in Table 10, although the response of both high and low water pollution to policy was statistically significant at the 1% level, high water pollution was more affected and more pronounced. This shows that high-water-pollution areas were more sensitive to policy implementation and well-suited to the development objectives.
A further analysis of the sensitivity of high and low air-pollution cities to policy implementation was not possible as the air quality level in Fujian region was higher, and the low air pollution city variable overlapped with the Fujian region’s variable. Therefore, further analysis could not be conducted. However, it can be inferred that high air-pollution areas are more sensitive to policy.

5. Discussion

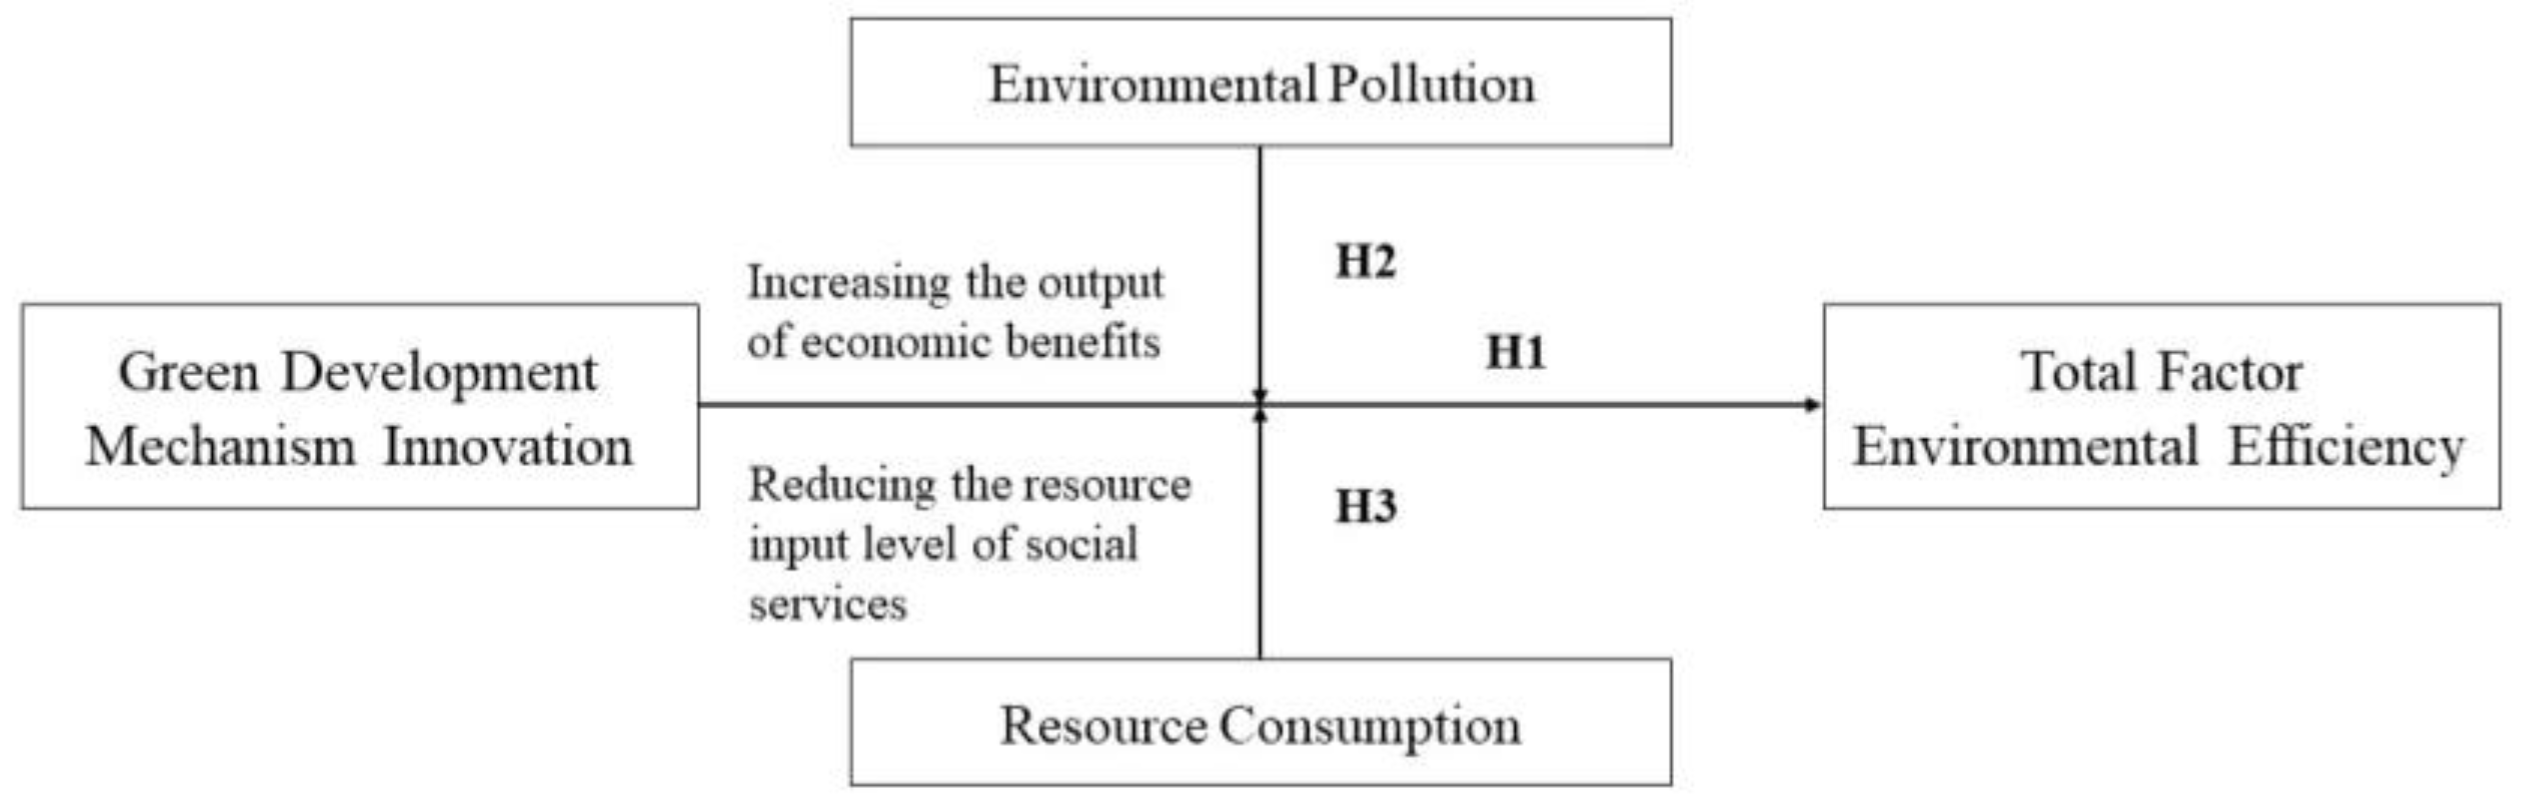
This study has made a significant contribution to exploring the impact of green development mechanism innovations on total-factor environmental efficiency (TFEE). Taking the national ecological civilization experimental zones implemented in China as an example, we found that the innovation of green development mechanisms contributed to the improvement of TFEE. The findings confirm H1. This is similar to the conclusions obtained by Wu et al. (2020) [29] and Hou et al. (2022) [38]. It is certain that policy implementation plays a positive role in promoting green development. In terms of environmental regulation, the Chinese government has issued a series of policies such as national fiscal energy conservation and emission-reduction policies [65] and low-carbon city construction [66]. The reason for this is that as environmental pressures increase, regions are showing more demand for green development. Existing studies show that external policies are often needed to effectively stimulate green development, and that strict and appropriate environmental policies can lead to regional innovation in green technology and thus improve total-factor environmental efficiency, basically achieving the win-win situation of environmental effectiveness and efficiency advocated by Porter’s hypothesis [66]. As a kind of green development mechanism innovation, the strategic goal of the national ecological civilization pilot zone is to adjust the existing industrial structure, implement green production methods, and optimize the regional environmental governance system. By integrating the green development concept into economic development, the improvement of all environmental efficiency factors in the city, and ultimately the development of a green economy, is promoted [43]. In addition, this paper further sets up a different model to compare the results with the original model and verifies that there is a significant positive relationship between the implementation of the national ecological civilization test area policy and TFEE, regardless of whether control variables are included. After the PSM operation and control variables, it becomes closer to the real impact.
In addition, heterogeneity analysis shows that cities with different levels of resource consumption and pollution have different sensitivities to the policy. The results of the second hypothesis presented in the study show that the institutional innovation of the ecological civilization pilot zone had a greater impact on TFEE in high-polluting areas. The findings have validated H2. On the one hand, high pollution and energy-consuming regions usually face more severe environmental pressure [67] and are more willing to reduce emissions and pollution by changing existing technologies, thus improving the TFEE. On the other hand, high energy-consumption and high-pollution areas need to adopt various environmental policies to mitigate pollution in order to avoid penalties for ecological problems, which leads to more incentives to improve environmental efficiency [68]. Secondly, our findings also confirm H3, that institutional innovation in national ecological civilization pilot zones has a significant impact on the enhancement of TFEE in cities with high resource consumption levels. Resource consumption mainly includes service resource and social resource inputs. The service resource input is mainly the input of water and energy consumption, while the social resource input is mainly human capital and fixed capital. Therefore, it is generally believed that high-energy-consuming areas have the dual nature of both “large scale capital” and “heavy environmental pollution”, which means that high-resource-consuming areas can promote economic growth while also harming environmental quality [69]. In addition, high-consumption areas have greater investment in technology and human resources, and therefore upgrading to green production technologies and pollution control technologies, etc., needs to play a role [32]. Therefore, the impact of institutional innovation in the National Ecological Civilization Pilot Area on the green development of high-consumption areas was more significant.

6. Conclusions and Policy Recommendations

6.1. Conclusions

Green development has become an important choice for countries wanting to pursue the harmonious development of the economy and the environment. Governments must innovate governance methods to promote green development. The National Ecological Civilization Pilot Zone is an innovative mechanism for exploring green development in China. It is crucial to explore whether green development mechanism innovation can enhance green development in China by constructing a quasi-natural experiment of the National Ecological Civilization Pilot Zone. Based on panel data from 290 prefecture-level and above cities during 2014–2019, a PSM-DID method was employed to evaluate the impact of pilot policy on TFEE. The empirical results show that the innovative mechanism had a significant impact on the improvement of TFEE, and the degree of impact of innovation on TFEE of the pilot cities was significantly higher than that of a single indicator. After robustness testing, the results are convincing. In addition, for different types of regions, the impact of mechanism innovation implementation was different. Implementation of the innovative mechanism exerted a relatively greater effect on promoting green development in regions with high resource consumption, high energy consumption, and high pollution.

6.2. Policy Recommendations

The findings of this study also provide important policy implications for the improvement of regional green development levels.
Firstly, the empirical results show that the mechanism innovation significantly improves TFEE. This shows that the national ecological civilization pilot zone policy can further promote regional green development. Therefore, it is necessary to continue to consolidate the policy’s effect of the construction of the national ecological civilization pilot zones, using Fujian Province as a typical model for exploring green development. At the same time, it is necessary to strengthen the summary and publicity of its successful cases, development models, and institutional innovation, and actively create more replicable and scalable green development experiences, stimulating the demonstration effect from point to point, driving the pilot provinces and regions and even the country’s rapid improvement of the level of ecological civilization construction.
Secondly, the validation shows that the degree of impact of mechanism innovation on TFEE is significantly higher than that of a single indicator. Green development is a comprehensive concept, and the traditional thinking of examining its level only from different indicators can no longer meet the needs of reality. Therefore, judging the concept of combining quantity and quality should be adopted, and this should be done while not only considering the changes in indicators of regional green development in a certain area, but also paying more attention to the dynamic evolution of comprehensive quality in the process of green development.
Finally, further analysis reveals significant regional differences in policy effects. This study found that the mechanism innovation has a significant impact on TFEE in high-pollution and high-consumption areas. These areas have the dual nature of “large-scale capital” and “serious environmental pollution”. Therefore, in order to solve the contradiction between economic development and environmental protection, high-pollution and high-resource-consumption areas should put green development to the fore. The region should make full use of the policy dividends and comparative advantages of the pilot city and take the environment into account while achieving economic development through resource development, and strictly implement policies related to environmental regulation. For low-pollution, low-resource-consumption areas that are not as sensitive to policy, pilot innovations that stimulate technological progress should be the main focus.
By encouraging and supporting green innovation, we will further improve the level of green development and accelerate the continuation of new economic development in low-pollution, low-consumption areas. This study introduces the pilot ecological civilization zone policy as a green development mechanism innovation that can promote improvement in TFEE, which is also the latest achievement of current sustainable development in China. However, there are still some limitations to this study. First, this study only uses the first nine pilot cities in Fujian province, which implemented the ecological civilization pilot zone policy as an experimental group, and ignores the effects of subsequent pilot cities. Further studies can assess the impact of green development mechanism innovation on TFEE based on all pilot cities. Second, this study is more about the influence of external factors on TFEE. For internal factors, in addition to the level of economic development and industrial structure, there are other factors, such as R&D and technology transfer, that still need to be considered. Finally, this paper conducted a heterogeneity analysis, though the impact of green development mechanism innovation on the development of different types of cities should be further explored from the perspective of city classification. For example, the impact on cities with different administrative levels, economic aggregates, population sizes, and industrial structures should be studied in future. This can further clarify the role of mechanism innovation in promoting urban green development and improve the effectiveness and feasibility of policy implementation.

Author Contributions

Conceptualization, software, and original draft, L.Z.; original draft and methodology, W.X.; methodology, D.S.; data curation and resources, T.L.; formal analysis, X.X.; investigation, S.W.; supervision, W.Z.; conceptualization, reviewing, and editing, D.Y. All authors have read and agreed to the published version of the manuscript.

Funding

This study was funded by the Social Science Planning Research Project of Shandong Province (22DJJJ13) and the Social Science Planning Research Project of Qingdao (QDSKL2201002).

Data Availability Statement

Publicly available datasets were analyzed in this study. This data can be found here: China Statistical Yearbook (2015–2020), China Urban Statistical Yearbook (2015–2020).

Conflicts of Interest

The authors declare no conflict of interest.

References

  1. Shah, S.A.R.; Naqvi, S.A.A.; Riaz, S.; Anwar, S.; Abbas, N. Nexus of biomass energy, key determinants of economic development and environment: A fresh evidence from Asia. Renew. Sustain. Energy Rev. 2020, 133, 110244. [Google Scholar] [CrossRef]
  2. Bina, O. The Green Economy and Sustainable Development: An Uneasy Balance? Environ. Plan. C Gov. Policy 2013, 31, 1023–1047. [Google Scholar] [CrossRef] [Green Version]
  3. Weber, G.; Cabras, I. The transition of Germany’s energy production, green economy, low-carbon economy, socio-environmental conflicts, and equitable society. J. Clean. Prod. 2017, 167, 1222–1231. [Google Scholar] [CrossRef]
  4. Meng, F.; Guo, J.; Guo, Z.; Lee, J.C.K.; Liu, G.; Wang, N. Urban ecological transition: The practice of ecological civilization construction in China. Sci. Total Environ. 2021, 755, 142633. [Google Scholar] [CrossRef]
  5. Zhao, N.; Liu, X.J.; Pan, C.F.; Wang, C.Y. The performance of green innovation: From an efficiency perspective. Socio-Econ. Plan. Sci. 2021, 78, 101062. [Google Scholar] [CrossRef]
  6. Halkos, G.E.; Tzeremes, N.G. Exploring the existence of Kuznets curve in countries’ environmental efficiency using DEA window analysis. Ecol. Econ. 2009, 68, 2168–2176. [Google Scholar] [CrossRef]
  7. Wang, Y.; Sun, X.; Wang, B.; Liu, X. Energy saving, GHG abatement and industrial growth in OECD countries: A green productivity approach. Energy 2020, 194, 116833. [Google Scholar] [CrossRef]
  8. Cheng, C.; Ge, C. Green development assessment for countries along the belt and road. J. Environ. Manag. 2020, 263, 110344. [Google Scholar]
  9. Moutinho, V.; Madaleno, M.; Macedo, P. The effect of urban air pollutants in Germany: Eco-efficiency analysis through fractional regression models applied after DEA and SFA efficiency predictions. Sustain. Cities Soc. 2020, 59, 102204. [Google Scholar] [CrossRef]
  10. Meng, M.; Qu, D.L. Understanding the green energy efficiencies of provinces in China: A Super-SBM and GML analysis. Energy 2022, 239, 121912. [Google Scholar] [CrossRef]
  11. Wu, M.R. Measurement and spatial statistical analysis of green science and technology innovation efficiency among Chinese Provinces. Environ. Ecol. Stat. 2021, 28, 423–444. [Google Scholar]
  12. Yu, C.; Liu, W.; Khan, S.; Yu, C.; Jun, Z.; Yue, D.; Zhao, M. Regional differential decomposition and convergence of rural green development efficiency: Evidence from China. Environ. Sci. Pollut. Res. 2020, 27, 22364–22379. [Google Scholar] [CrossRef] [PubMed]
  13. Li, B.; He, X.; Niu, Z.; Pan, J. The Impact of Environmental Regulations on Green Economic Efficiency—Evidence from Beijing-Tianjin-Hebei Urban Agglomeration. Pol. J. Environ. Stud. 2021, 30, 4039–4057. [Google Scholar] [CrossRef]
  14. Liu, Y.; Zhu, J.; Li, E.; Meng, Z.; Song, Y. Environmental regulation, green technological innovation, and eco-efficiency: The case of Yangtze river economic belt in China. Technol. Forecast. Soc. Chang. 2020, 155, 119993. [Google Scholar] [CrossRef]
  15. Wang, K.; Miao, Z.; Zhao, M.; Miao, C.; Wang, Q. China’s provincial total-factor air pollution emission efficiency evaluation, dynamic evolution and influencing factors. Ecol. Indic. 2019, 107, 105578. [Google Scholar] [CrossRef]
  16. Wang, M.; Zhao, H.; Cui, J.; Fan, D.; Lv, B.; Wang, G.; Zhou, G. Evaluating green development level of nine cities within the Pearl River Delta, China. J. Clean. Prod. 2018, 174, 315–323. [Google Scholar] [CrossRef]
  17. Jia, P.; Li, K.; Shao, S. Choice of technological change for China’s low-carbon development: Evidence from three urban agglomerations. J. Environ. Manag. 2018, 206, 1308–1319. [Google Scholar] [CrossRef]
  18. Lin, E.; Chen, P.; Chen, C. Measuring the environmental efficiency of countries: A directional distance function metafrontier approach. J. Environ. Manag. 2013, 119, 134–142. [Google Scholar]
  19. Murty, M.N.; Kumar, S.; Paul, M. Environmental regulation, productive efficiency and cost of pollution abatement: A case study of the sugar industry in India. J. Environ. Manag. 2006, 79, 1–9. [Google Scholar] [CrossRef]
  20. Yagi, M.; Fujii, H.; Hoang, V.; Managi, S. Environmental efficiency of energy, materials, and emissions. J. Environ. Manag. 2015, 161, 206–218. [Google Scholar] [CrossRef] [Green Version]
  21. Shen, Y.; Yue, S.; Sun, S.; Guo, M. Sustainable total factor productivity growth: The case of China. J. Clean. Prod. 2020, 256, 120727. [Google Scholar] [CrossRef]
  22. Wang, Z.; Wang, X.; Liang, L. Green economic efficiency in the Yangtze River Delta: Spatiotemporal evolution and influencing factors. Ecosyst. Health Sustain. 2019, 5, 20–35. [Google Scholar] [CrossRef] [Green Version]
  23. Wang, X.; Song, J.; Duan, H.; Wang, X. Coupling between energy efficiency and industrial structure: An urban agglomeration case. Energy 2021, 234, 121304. [Google Scholar] [CrossRef]
  24. Yu, B. Industrial structure, technological innovation, and total-factor energy efficiency in China. Environ. Sci. Pollut. Res. 2020, 27, 8371–8385. [Google Scholar] [CrossRef]
  25. Jin, W.; Zhang, H.Q.; Liu, S.S.; Zhang, H.B. Technological innovation, environmental regulation, and green total factor efficiency of industrial water resources. J. Clean. Prod. 2019, 211, 61–69. [Google Scholar] [CrossRef]
  26. Li, L.; Hu, J. Ecological total-factor energy efficiency of regions in China. Energy Policy 2012, 46, 216–224. [Google Scholar] [CrossRef]
  27. Zhang, N.; Zhao, K.; Yu, Y. The effect of environmental regulation on air pollution, productivity, and factor structure: A quasi-natural experiment evidence from China. Environ. Sci. Pollut. Res. 2020, 27, 20392–20409. [Google Scholar] [CrossRef]
  28. Zhou, L.; Tang, L. Environmental regulation and the growth of the total-factor carbon productivity of China’s industries: Evidence from the implementation of action plan of air pollution prevention and control. J. Environ. Manag. 2021, 296, 113078. [Google Scholar] [CrossRef]
  29. Wu, H.; Hao, Y.; Ren, S. How do environmental regulation and environmental decentralization affect green total factor energy efficiency: Evidence from China. Energy Econ. 2020, 91, 104880. [Google Scholar] [CrossRef]
  30. Hancevic, P.I. Environmental regulation and productivity: The case of electricity generation under the CAAA-1990. Energy Econ. 2016, 60, 131–143. [Google Scholar] [CrossRef]
  31. Ouyang, X.; Fang, X.; Cao, Y.; Sun, C. Factors behind CO2 emission reduction in Chinese heavy industries: Do environmental regulations matter? Energy Policy 2020, 145, 111765. [Google Scholar] [CrossRef]
  32. Liu, M.; Tan, R.; Zhang, B. The costs of “blue sky”: Environmental regulation, technology upgrading, and labor demand in China. J. Dev. Econ. 2021, 150, 102610. [Google Scholar] [CrossRef]
  33. Chai, Z.; Guo, F.; Cao, J.; Yang, X. The road to eco-efficiency: Can ecological civilization pilot zone be useful? New evidence from China. J. Environ. Plan. Manag. 2022, 65, 1–27. [Google Scholar] [CrossRef]
  34. Zeng, B.; Zheng, J.F.; Qiu, Z.P. A Study on the Effect of Environmental Policy Instruments on Environmental Quality—Based on the Provincial Panel Data from 2001 to 2012. Shanghai J. Econ. 2016, 5, 39–46. [Google Scholar]
  35. Xavier, A.F.; Naveiro, R.M.; Aoussat, A.; Reyes, T. Systematic literature review of eco-innovation models: Opportunities and recommendations for future research. J. Clean. Prod. 2017, 149, 1278–1302. [Google Scholar] [CrossRef]
  36. Li, X.W.; Dai, J.C.; He, J.R.; Li, J.R.; Huang, Y.C.; Liu, X.; Shen, Q. Mechanism of Enterprise Green Innovation Behavior Considering Coevolution Theory. Int. J. Environ. Res. Public Health 2022, 19, 10453. [Google Scholar] [CrossRef] [PubMed]
  37. Wu, M.; Liu, Y.; Xu, Z.; Yan, G.; Ma, M.; Zhou, S.; Qian, Y. Spatio-temporal dynamics of China’s ecological civilization progress after implementing national conservation strategy. J. Clean. Prod. 2021, 285, 124886. [Google Scholar] [CrossRef]
  38. Hou, J.; Zhou, R.; Ding, F.; Guo, H. Does the construction of ecological civilization institution system promote the green innovation of enterprises? A quasi-natural experiment based on China’s national ecological civilization pilot zones. Environ. Sci. Pollut. Res. 2022, 29, 67362–67379. [Google Scholar] [CrossRef]
  39. Huan, Q. National Ecological Civilization Pilot Zone: From Theory to Practice. In Beautiful China: 70 Years since 1949 and 70 People’s Views on Eco-Civilization Construction; Pan, J., Gao, S., Li, Q., Wang, J., Wu, D., Huang, C., Eds.; Springer: Berlin/Heidelberg, Germany, 2021; pp. 657–668. [Google Scholar]
  40. Yang, Y.; Meng, G. A bibliometric analysis of comparative research on the evolution of international and Chinese ecological footprint research hotspots and frontiers since 2000. Ecol. Indic. 2019, 102, 650–665. [Google Scholar] [CrossRef]
  41. Xi, J.P. Fujian Province National Economic and Social Development Statistical Bulletin in 2019. Available online: http://xxzx.fujian.gov.cn/jjxx/tjxx/202003/t20200302_5206444.htm (accessed on 7 January 2023). (In Chinese)
  42. Wang, H.; Geng, Y.; Zhang, J.; Xia, X.; Feng, Y. Ecological civilization demonstration zone, air pollution reduction, and political promotion tournament in China: Empirical evidence from a quasi-natural experiment. Int. J. Environ. Res. Public Health 2021, 18, 11880. [Google Scholar] [CrossRef]
  43. Feng, Y.; Wang, X.; Du, W.; Wu, H.; Wang, J. Effects of environmental regulation and FDI on urban innovation in China: A spatial Durbin econometric analysis. J. Clean. Prod. 2019, 235, 210–224. [Google Scholar] [CrossRef]
  44. Mazzanti, M.; Zoboli, R. Environmental efficiency and labour productivity: Trade-off or joint dynamics? A theoretical investigation and empirical evidence from Italy using NAMEA. Ecol. Econ. 2009, 68, 1182–1194. [Google Scholar] [CrossRef]
  45. Huang, Z.; Liao, G.; Li, Z. Loaning scale and government subsidy for promoting green innovation. Technol. Forecast. Soc. Chang. 2019, 144, 148–156. [Google Scholar] [CrossRef]
  46. Greenstone, M.; Hanna, R. Environmental regulations, air and water pollution, and infant mortality in India. Am. Econ. Rev. 2014, 104, 3038–3072. [Google Scholar] [CrossRef]
  47. Pan, D.; Tang, J. The effects of heterogeneous environmental regulations on water pollution control: Quasi-natural experimental evidence from China. Sci. Total Environ. 2021, 751, 141550. [Google Scholar] [CrossRef] [PubMed]
  48. Manderson, E.; Kneller, R. Environmental regulations, outward FDI and heterogeneous firms: Are countries used as pollution havens? Environ. Resour. Econ. 2012, 51, 317–352. [Google Scholar] [CrossRef] [Green Version]
  49. Wang, X.; Wang, Y.; Lan, Y. Measuring the bias of technical change of industrial energy and environmental productivity in China: A global DEA-Malmquist productivity approach. Environ. Sci. Pollut. Res. 2021, 28, 4189–41911. [Google Scholar]
  50. Charnes, A.; Cooper, W.W.; Rhodes, E. Measuring the efficiency of decision making units. Eur. J. Oper. Res. 1978, 2, 429–444. [Google Scholar] [CrossRef]
  51. Huang, H.; Mo, R.; Chen, X. New patterns in China’s regional green development: An interval Malmquist-Luenberger productivity analysis. Struct. Chang. Econ. Dyn. 2021, 58, 161–173. [Google Scholar] [CrossRef]
  52. Cook, W.D. Data envelopment analysis: A comprehensive text with models, applications, references and DEA-solver software. Interfaces 2001, 31, 116–118. [Google Scholar]
  53. Färe, R.; Knox Lovell, C.A. Measuring the technical efficiency of production. J. Econ. Theory 1978, 19, 150–162. [Google Scholar] [CrossRef]
  54. Tone, K. A slacks-based measure of efficiency in data envelopment analysis. Eur. J. Oper. Res. 2001, 130, 498–509. [Google Scholar] [CrossRef] [Green Version]
  55. Charnes, A.; Cooper, W.W. Programming with linear fractional functionals. Nav. Res. Logist. Q. 1962, 9, 181–186. [Google Scholar] [CrossRef]
  56. Liu, K.; Yang, D.; Yang, G.; Zhou, Z. Assessing the regional sustainability performance in China using the global Malmquist-Luenberger productivity index. Int. J. Energy Sect. Manag. 2021, 15, 820–854. [Google Scholar] [CrossRef]
  57. Song, M.; Zhao, X.; Shang, Y. The impact of low-carbon city construction on ecological efficiency: Empirical evidence from quasi-natural experiments. Resour. Conserv. Recycl. 2020, 157, 104777. [Google Scholar] [CrossRef]
  58. Weng, Z.; Han, E.; Wu, Y.; Shi, L.; Ma, Z.; Liu, T. Environmental and economic impacts of transitioning to cleaner heating in Northern China. Resour. Conserv. Recycl. 2021, 172, 105673. [Google Scholar] [CrossRef]
  59. Yang, M.; Yang, L.; Sun, M.; Wang, Y. Economic impact of more stringent environmental standard in China: Evidence from a regional policy experimentation in pulp and paper industry. Resour. Conserv. Recycl. 2020, 158, 104831. [Google Scholar] [CrossRef]
  60. Rosenbaum, P.R.; Rubin, D.B. The central role of the propensity score in observational studies for causal effects. Biometrika 1983, 70, 41–55. [Google Scholar] [CrossRef]
  61. Abadie, A.; Imbens, G.W. Matching on the Estimated Propensity Score. Econometrica 2016, 84, 781–807. [Google Scholar] [CrossRef]
  62. Austin, P.C.; Jembere, N.; Chiu, M. Propensity score matching and complex surveys. Stat. Methods Med. Res. 2018, 27, 1240–1257. [Google Scholar] [CrossRef] [Green Version]
  63. Ripollone, J.E.; Huybrechts, K.F.; Rothman, K.J.; Ferguson, R.E.; Franklin, J.M. Implications of the Propensity Score Matching Paradox in Pharmacoepidemiology. Am. J. Epidemiol. 2018, 187, 1951–1961. [Google Scholar] [CrossRef] [PubMed]
  64. Sturmer, T.; Joshi, M.; Glynn, R.J.; Avorn, J.; Rothman, K.J.; Schneeweiss, S. A review of the application of propensity score methods yielded increasing use, advantages in specific settings, but not substantially different estimates compared with conventional multivariable methods. J. Clin. Epidemiol. 2006, 59, 437–447. [Google Scholar] [CrossRef] [PubMed] [Green Version]
  65. Lin, B.; Zhu, J. Impact of Energy Saving and Emission Reduction Policy on Urban Sustainable Development: Empirical Evidence from China. Appl. Energy 2019, 239, 12–22. [Google Scholar] [CrossRef]
  66. Wang, H.; Chen, Z.; Wu, X.; Nie, X. Can a Carbon Trading System Promote the Transformation of a Low-Carbon Economy under the Framework of the Porter Hypothesis? —Empirical Analysis Based on the PSM-DID Method. Energy Policy 2019, 129, 930–938. [Google Scholar] [CrossRef]
  67. Wang, X.L.; Dong, F.; Pan, Y.L.; Liu, Y.J. Transport Infrastructure, High-Quality Development and Industrial Pollution: Fresh Evidence from China. Int. J. Environ. Res. Public Health 2022, 19, 9494. [Google Scholar] [CrossRef] [PubMed]
  68. Pang, R.; Zheng, D.; Shi, M.; Zhang, X. Pollute first, control later? Exploring the economic threshold of effective environmental regulation in China’s context. J. Environ. Manag. 2019, 248, 109275. [Google Scholar] [CrossRef] [PubMed]
  69. Wang, S.; Zhou, H. High Energy-Consuming Industrial Transfers and Environmental Pollution in China: A Perspective Based on Environmental Regulation. Int. J. Environ. Res. Public Health 2021, 18, 11866. [Google Scholar] [CrossRef]
Figure 1. Regional overview map of the ecological civilization construction pilot cities in Fujian, China.
Sustainability 15 01543 g001
Figure 2. Theoretical framework proposed for the current work.
Sustainability 15 01543 g002
Figure 3. Logic model for TFEE measurement.
Sustainability 15 01543 g003
Figure 4. Six-year cumulative TFEE changes in cities in the test area.
Sustainability 15 01543 g004
Figure 5. City standard errors before and after matching cities within the test area with cities outside of the test area.
Sustainability 15 01543 g005
Figure 6. Impact of mechanism innovation on TFEE.
Sustainability 15 01543 g006
Figure 7. Impact of mechanism innovation on desired versus non-desired outputs.
Sustainability 15 01543 g007
Figure 8. DID linear trend diagram.
Sustainability 15 01543 g008
Figure 9. Parallel trend diagram.
Sustainability 15 01543 g009
Figure 10. Implementation of the mechanism on the number of above-regulated industrial enterprises impact map.
Sustainability 15 01543 g010
Figure 11. Mechanism innovation impact on industrial sulfur dioxide emissions.
Sustainability 15 01543 g011
Figure 12. Impacts of the implementation of mechanism innovation on total-factor environmental efficiency under different model settings from 2014 to 2019 in Fujian, China.
Sustainability 15 01543 g012
Table 1. Propensity score matching.
VariablesMatchingAverage%bias%reduct |bias|t-Test
TreatmentControltp >|t|
ln (GDP)Before matching7.89797.381166.289.61.640.102
After matching7.89797.9515−6.9−0.150.883
ln (value added of three industries)Before matching6.97886.51714.681.21.350.179
After matching6.97887.06752.7−0.210.838
ln (urban population)Before matching5.46895.261752.480.80.850.398
After matching5.46895.5043−10.1−0.100.918
ln (total population)Before matching5.96185.876634.882.90.350.725
After matching5.96185.9458−60.050.964
Table 2. Impact of mechanism innovation on TFEE.
TFEECoefficientRobustness Factort-Testp
Share of three industries−0.00450.0060−0.75000.4620
GDP per capita−2.64 × 10−63.14 × 10−6−0.84000.4130
Share of three industries × GDP per capita5.65 × 10−87.17 × 10−80.79000.4420
D i × T t 0.1678 ***0.60202.79000.0130
Note: *** indicate significance levels of 1%.
Table 3. Impact of mechanism innovation on desired versus non-desired outputs.
GDPAQICWQI
Share of three industries−92.33009 ** (−2.52)0.20507 (0.30)0.0513755 (0.63)
GDP per capita−0.013936 (−0.63)−0.0000173 (−0.07)0.0000162 (0.79)
Share of three industries × GDP per capita0.009612 (1.50)−1.75 × 10⁻⁶ (−0.26)−5.61 × 10⁻⁷ (−1.01)
D i × T t 44.96134 (0.10)13.30081 * (1.94)0.70436 (1.14)
Note: * and ** indicate significance levels of 10%, 5%, respectively.
Table 4. Impact of the implementation of the mechanism on the number of above-regulated industrial enterprises.
ln (Number of Industrial Enterprises)CoefficientRobust std.errtp > |t|
Share of three industries−0.00880.0091−0.970.345
GDP per capita−1.65 × 10−62.00 × 10−6−0.820.422
Share of three industries × GDP per capita9.59 × 10−8 *5.39 × 10−81.780.093
D i × T t −0.00030.066500.997
Note: * indicate significance levels of 10%.
Table 5. Impact of mechanism innovation on industrial SO2 emissions.
ln (Number of Industrial Enterprises)CoefficientRobust std.errtp > |t|
Share of three industries−0.01162460.0327838−0.350.727
GDP per capita−5.16 × 10−60.0000121−0.430.675
Share of three industries × GDP per capita1.22 × 10−73.25 × 10−70.380.712
D i × T t 0.312345 *0.22161381.410.177
Note: * indicate significance levels of 10%.
Table 6. Impacts of the implementation of mechanism innovation on total-factor environmental efficiency under different model settings from 2014 to 2019 in Fujian, China.
ModelOriginal ModelModel 1Model 2Model 3Model 4Model 5
D i × T t 0.1678 *** (2.7900)0.1619 ** (2.5200)0.1639 *** (2.8000)0.1644 *** (3.76)0.1765 *** (4.09)0.1635 *** (3.78)
GDP per capita××
Share of three industries××
GDP per capita × share of three industries××××
PSM×××
Note: **, and *** indicate significance levels of 5%, and 1%, respectively.
Table 7. Impact of different service resource input city types on TFEE.
Original ModelModel 1Model 2
D i × T t × High water consumption0.1542 ** (2.48)0.1498 ** (2.45)0.1482 ** (2.41)
D i × T t × Low water consumption0.0438 (0.42)0.0454 (0.42)0.0518 (0.48)
D i × T t × High electricity consumption0.1403 *** (2.72)0.1414 *** (2.80)0.1418 *** (2.84)
D i × T t × Low electricity consumption0.0257 (0.52)0.0205 (0.41)0.0211 (0.41)
GDP per capita×
Share of three industries×
GDP per capita × share of three industries××
Note: **, and *** indicate significance levels of 5%, and 1%, respectively.
Table 8. Effects of different social resource input city types on TFEE.
Original ModelModel 1Model 2
D i × T t × High manpower input0.1584 * (1.84)0.1646 ** (2.00)0.1621 ** (2.00)
D i × T t × Low manpower input0.0914 (1.28)0.0793 (1.12)0.0741 (1.03)
D i × T t × High capital investment0.1360 *** (2.57)0.1350 ** (2.48)0.1349 *** (2.62)
D i × T t × Low capital investment−0.0062 (−0.40)−0.0092 (−0.76)−0.0085 (−0.65)
GDP per capita×
Share of three industries×
GDP per capita × share of three industries××
Note: *, **, and *** indicate significance levels of 10%, 5%, and 1%, respectively.
Table 9. Effects of different economic output city types on TFEE.
Original ModelModel 1Model 2
D i × T t × High economic output0.1343 * (1.79)0.1387 * (1.92)0.1403 * (1.92)
D i × T t × Low economic output0.0924 (1.21)0.0762 (1.00)0.0809 (1.07)
GDP per capita×
Share of three industries×
GDP per capita × share of three industries××
Note: * indicate significance levels of 10%.
Table 10. Impact of different water pollution output city types on TFEE.
Original ModelModel 1Model 2
D i × T t × High water pollution−0.06839 *** (−4.42)−0.0655 *** (−7.36)−0.0706 *** (−4.69)
D i × T t × Low water pollution0.1652 *** (2.97)0.1599 *** (2.71)0.1624 *** (3.02)
GDP per capita×
Share of three industries×
GDP per capita × share of three industries××
Note: *** indicate significance levels of 1%.
Disclaimer/Publisher’s Note: The statements, opinions and data contained in all publications are solely those of the individual author(s) and contributor(s) and not of MDPI and/or the editor(s). MDPI and/or the editor(s) disclaim responsibility for any injury to people or property resulting from any ideas, methods, instructions or products referred to in the content.

