Article

GIS-Based Visitor Count Prediction and Environmental Susceptibility Zoning in Protected Areas: A Case Study in Plitvice Lakes National Park, Croatia

1
Faculty of Agrobiotechnical Sciences Osijek, Josip Juraj Strossmayer University of Osijek, Vladimira Preloga 1, 31000 Osijek, Croatia
2
Plitvice Lakes National Park Public Institution, Dr. Ivo Pevalek Scientific Research Centre, Josipa Jovića 19, 53231 Plitvička Jezera, Croatia
*
Author to whom correspondence should be addressed.
Sustainability 2023, 15(2), 1625; https://doi.org/10.3390/su15021625
Submission received: 19 December 2022 / Revised: 9 January 2023 / Accepted: 11 January 2023 / Published: 13 January 2023

Abstract

:
The most valuable protected natural areas, including national parks, are subjected to the increased visitors count and density, threatening the environmental sustainability and biodiversity conservation. To establish a basis for land management to mitigate these influences, the novel geographic information (GIS)-based environmental susceptibility zoning method was proposed. The study area covered the Plitvice Lakes National Park, as the oldest and largest national park in Croatia, using the historical 20-year visitor data with 19 tourist and hiking routes. Two geospatial analysis methods were evaluated as follows: (1) short-term prediction of visitors count data based on a 10-year historical intervals, and (2) the environmental susceptibility zones delineation method integrated two fundamental factors in the assessment of environmental impacts from route density and historical visitors count on a monthly basis. Four accuracy assessment metrics indicated a moderate accuracy of short-term visitors count prediction, with the coefficient of determination ranging from 0.700 to 0.951. The routes which continue from both entrances indicated the largest visitors load is in the central part of the park, mostly located in the moderately restricted zone. These observations indicated moderate present environmental susceptibility with stable outlook, providing an insight for the nature park management adjustment.

1. Introduction

The increase in living standard and purchasing power of people, the development of technology, and especially globalization, are the causes of the sudden increase in tourism and the sharing of service activities in many state economies. According to [1], before the pandemic, travel and tourism accounted for 25% of all new jobs created worldwide, 10.3% of all jobs and 10.3% of the global domestic product (GDP). In 2019, consumption by international visitors amounted to 6.8% of total world exports. Until the onset of the pandemic crisis, tourism grew at a rate of 3.5% per year. The contribution of tourism to the GDP is also very significant in the Republic of Croatia. According to [2], in 2019 it amounted to HRK 80,247 million, which is 25% of GDP and employs 25.1% of the total workforce. In addition, the impact of tourism for the Republic of Croatia is also reflected in the arrivals and overnight stays of tourists. In 2019, 19,566,146 tourists visited the Republic of Croatia, while over 90 million overnight stays were recorded [3].
Significant shares in the tourist numbers in the Republic of Croatia are occupied by protected areas, regardless of their level of protection. The primary task of preserving as natural a habitat as possible in order to improve, among other things, the quality of life of people is recognized as a tourist potential. Croatia has 410 protected areas, which cover 8.54% of the total surface of this country, of which the most visited and most attractive are certainly the national parks and nature parks [4]. The national parks are vast, naturally occurring or nearly natural areas preserved to protect the area’s full complement of species and ecosystems as well as large-scale ecological processes. National parks also serve as a foundation for opportunities for spirituality, education, recreation and tourism that are both environmentally and culturally compatible [4]. Among many other objectives, they include the management of use by visitors and most importantly the management of the area in order to maintain the area in as natural a state as possible.
The International Union for Conservation of Nature (IUCN) and the Ministry of Economy and Sustainable Development of the Republic of Croatia defined a protected area as a clearly defined geographic region that has been acknowledged, committed to, and managed for the long-term protection of nature and the accompanying ecological services and cultural values by legal or other effective measures [5,6]. Tourism and organized visits to protected areas bring great economic profit in all activities and industries directly or indirectly related to tourism. However, local communities associated with protected areas abandon traditional activities and the traditional way of life, which is often part of the cultural heritage of the protected area [7,8]. As a rule, the sudden increase in the number of visitors and tourist arrivals in the Republic of Croatia is not accompanied by the development of infrastructure or this development is very slow [9]. Disorganization and unplanned management of visiting in some national parks has become almost as recognizable as their natural attractiveness. Protected areas lose their primary task and become destinations for mass tourism, which should be gradually distributed as soon as possible [10]. Facilitating visits and the economic profit that results from it is a welcome activity, but the above must be in accordance with controlled and sustainable management. Uncontrolled visitor flow can cause irreparable damage on the resource values. Thus, environmental protection plays an importance role in sustainable development, local and country economy [2,11]. Establishing a balance between the economic benefits of tourism in protected areas and their sustainability of natural features is a very sensitive task [12]. Keeping the values that have earned an territory the status of a protected area ensures long-term economic benefits. Aggressive and mass tourism brings quick and large material profit, but in a short time it permanently destroys a certain area, which leads to the loss of jobs and profits and the degradation of the territory where tourism took place [13]. The same principle can be applied to all tourist destinations regardless of the level of protection.
Systematic monitoring of visitors in protected areas has a long tradition and covers various aspects of recreational use [14,15,16], including monitoring the number of visits, types of activities, patterns movements and socio-demographic characteristics of visitors [14,17,18,19,20]. Until now, various methods have been used to determine the number of visitors to protected areas and to assess the spatial distribution of visitors within protected areas, including the following: direct and indirect observation, automatic counting devices, visitor tracking, access permit and ticket counting, interviews, self-registration, user-generated internet content, usage traces [17]. Each technique has specific advantages and limitations; therefore, a simultaneous combination of data collection methods is often applied to capture comprehensive characteristics of visitor use of protected areas [17,21,22]. Research published so far has often examined visitor numbers and patterns at a large spatial scale, such as large parks or even at national and international levels [20,23,24]. Fewer studies have examined visitor use patterns at smaller scales [25] or examined seasonal visitor-environment interactions [26] based on infrastructure and environmental factors, critical to understanding such interactions and mitigating impacts. Geotagged photos were used to determine the temporal and spatial distributions and patterns of visiting and using informal trails in remote mountain protected areas in Aconcagua and dispersed winter use in Kosciuszko [27]. The mentioned research examined the metadata characteristics of geotagged photos, compared the locations of geotagged photos with visitor data, analyzed the temporal and spatial distribution of visitors based on geotagged photos, and assessed which factors are related to the spatial distribution of photos. Furthermore, the GNSS-based Voluntary Geographic Information (VGI) evaluation [28] was used to assess the spatial distribution of visitors within the protected areas of the Bavarian Forest National Park (Germany). The spatial distribution of visitors was investigated based on data obtained from three different GNSS-based VGI platforms. Results grouped by data source and linked to visitor numbers collected by automatic visitor counters correlate significantly.
Along with the many tools that make this possible, geographical information systems (GIS) technology is naturally imposed spatial visualization of a certain area, which includes monitoring the movement and number of visitors, zoning of a certain area, and subsequent analysis and prediction of certain situations and risks [29]. Without this tool, management would perhaps not be impossible, but it greatly facilitates it, and it is possible to obtain data in real time and to make quality decisions based on their analysis [30]. By analyzing a large amount of data on the number of visitors collected in the past, clear guidelines for future management are obtained and are the basis of all plans [31]. GIS is an integral part of managing both visitors and the entire area of the Plitvice Lakes National Park as well as its infrastructure [32]. It is included in all scientific research and projects, plans and projects for the construction of new facilities or walkways and can be considered one of the indispensable tools in the management of the National Park.
To provide a basis for national park management due to the increased anthropogenic impact on the environment, the aim of this study was to analyze historical 20-year visitor count data and to propose new method of GIS-based environmental susceptibility zoning for the purpose of reducing the negative impact from visitors on the environment. The hypothesis is that the proposed method will be able to provide susceptibility zones with a sufficient level of reliability.

2. Materials and Methods
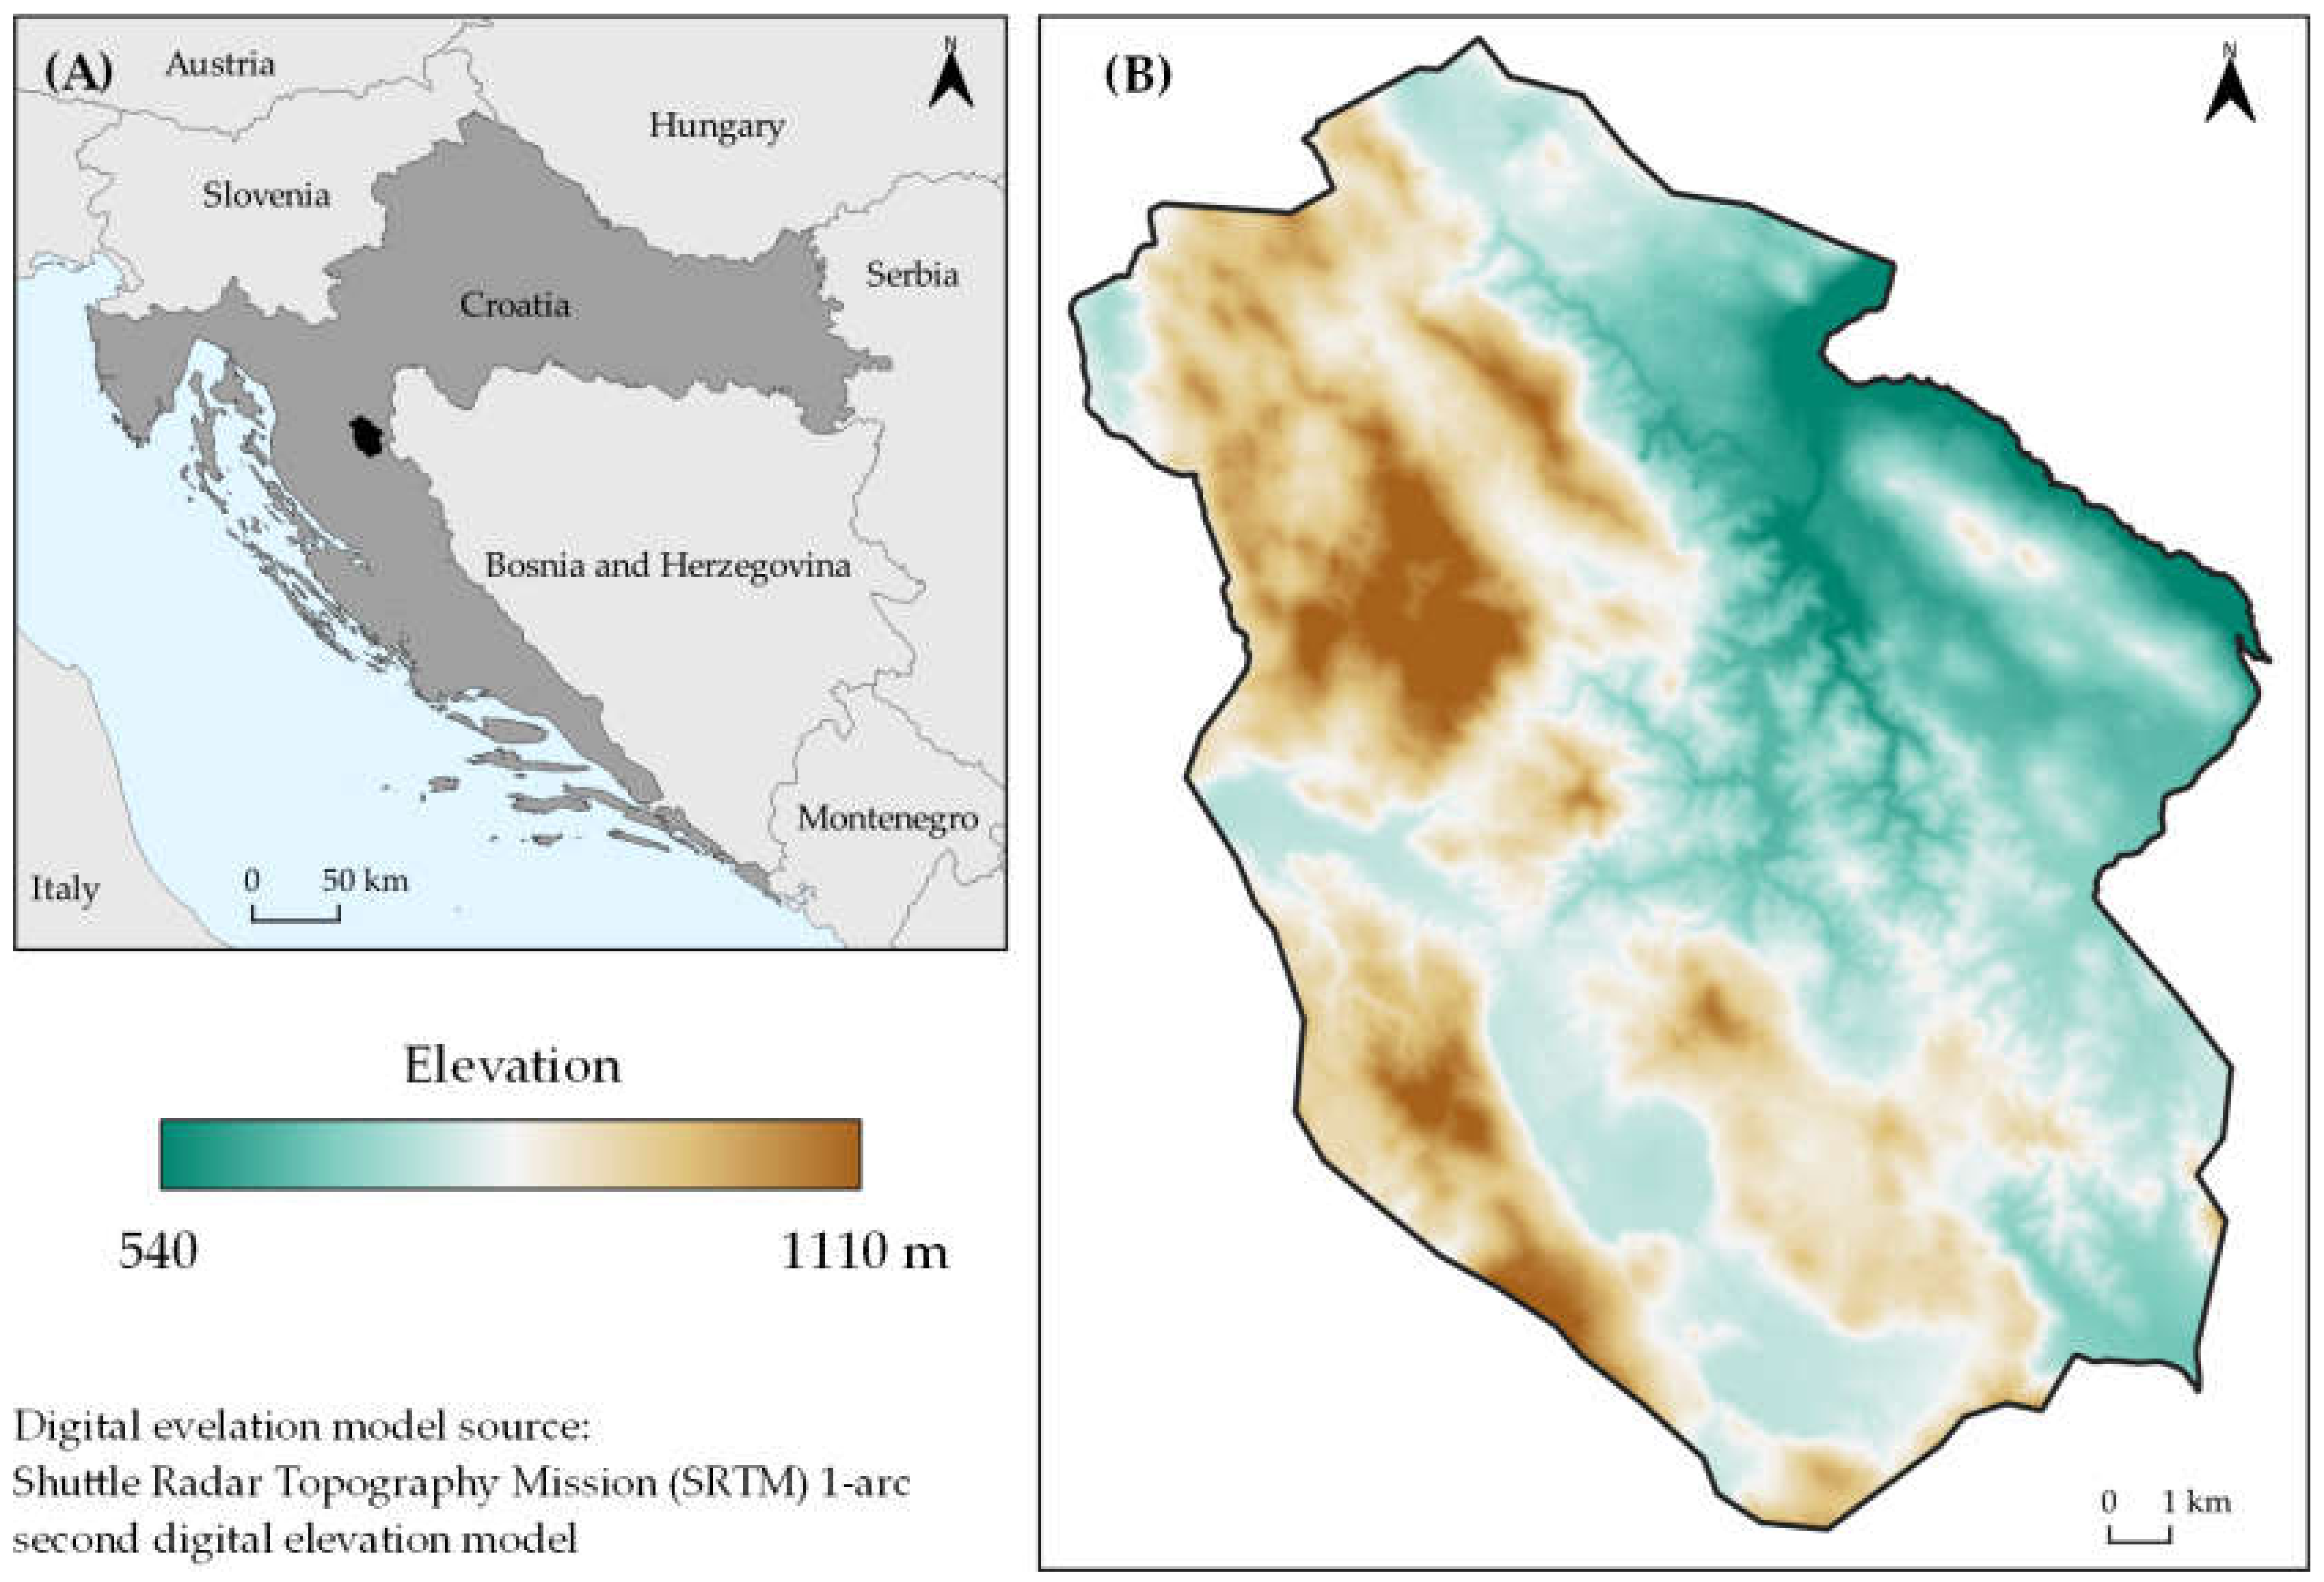
2.1. Study Area

The Plitvice Lakes is the oldest and largest national park of the Republic of Croatia. This region, with its extraordinary natural beauty, has long drawn outdoor enthusiasts, thus on 8 April 1949, it was designated as Croatia’s first national park. Due to the addition of the catchment area in 1997, the area of the National Park was increased to its current size of 29,630.8 ha (296 km2) [33]. The international significance of the Park for the preservation of biodiversity was once again confirmed in 2013. Then, by the Decree on the Ecological Network, which transposes two directives of the European Union into the Croatian legislation, the Park was declared a conservation area important for birds and a conservation area important for species and habitat types, as Natura 2000 an area significant at the level of the European Union [33]. The study area shown in Figure 1.
Most of the area is administratively located in Lika-Senj County (90.6%), while the rest of 9.4% belongs to Karlovac County. Water surfaces of the Park occupy about 1% of the total area. The rest of the park is dominated by forest areas (81%), grasslands (about 15%) and about 3% of areas significantly altered by anthropogenic activity. The geologically very young complex, which with its present appearance is no older than 6000–7000 years, forming one of the most impressive parts of the Dinaric karst area [33]. The base is made of sedimentary rocks of impermeable dolomites and impermeable limestone, on which the biochemical process of tufa formation determined the appearance of the entire area. The specific hydrogeological properties of the rocks enabled the creation of 12 lakes on Triassic-aged dolomite rocks called Upper lakes, four lakes created by canyon carving in limestone deposits of Cretaceous age on Lower lakes and the Korana river canyon [33]. Management zoning was performed according to the Guidelines for planning the management of protected areas and/or ecological network areas of the Republic of Croatia [34]. It divides the Park into three main zones, with an additional division into sub-zones (Table 1).
Taking into account national and international standards for the category of national parks, the largest share of the Park’s area of 80.7% is occupied by the zone of strict protection (Zone I), the moderately restricted zone (Zone II) covers 17.1% of the area, while the smallest share is about 2.2% is in the zone of use (Zone III) (Figure 2).

2.2. Acquiring and Analysis of Visitors Data

According to [33] the first visiting system in the Plitvice Lakes National Park was established in the 1970s with the aim of determining the permitted and possible visiting capacity. With the help of many years of observations and recording of the dynamics of visitor movement, a methodology was worked out, which obtained the equation for calculating the daily limit:
N day = h 1 + h 2 v s ,
v s = 2.3 × L 1 c 1 × n ,
where N day —daily limit of visitors; h 1 —number of hours in a day with full visiting capacity, which is the result of observing the daily frequency of visits; h 2 —number of hours in a day with an average 50% visit; v s —the duration of the average visitor’s walk along the length of L 1 ; L 1 —the minimum required length distance between two visitors on the track (arbitrary size of 3 m, which according to observations was assessed as minimal); c 1 —average speed of movement of visitors over a length of 100 m (speed was measured on sections of the “bottleneck”); n —number of visitors who can move along the path (given the width of the path is 1.6 m). It was observed that the “throughput” of the tracks is the “bottleneck” of the complete system and the most important factor in the calculation. The original formula was then adjusted to depend only on the speed of movement of visitors and the permitted density of visitors on the track (Figure 3). The number of visitors who can cross the track per hour is determined by the following:
  N hour = 3600 l × v ,
where N hour number of visitors who can cross the track per hour; l —minimum acceptable distance between two adjacent visitors in meters and v —visitor speed in ms−1.
Formal and established tracks used by visitors ranked as the main factors explaining the movement, number and density of visitors in various models, thus reflecting how well visitors use them. Such concentrated use of trails designed and provided by park agencies encourages managers, as tracks are the main way they try to minimize the damage that tourism can do to protected natural areas [35]. These tracks can enhance the visitor experience by providing comfortable and safe access to desirable sites while minimizing impacts, including trampling on sensitive and easily damaged environments off the tracks [35,36]. This is particularly important in areas where vegetation recovery from damage, including just trampling, is extremely slow and limited [37,38].
Through multi-year monitoring of the dynamics of visitor movement, it was determined that the average speed of visitor movement is 2.5 km h−1. The density of visitors (or minimum acceptable distance between two adjacent visitors that is, the mutual longitudinal distance), as a very important feature on which the quality of the visitor’s experience of nature depends, is set at 3 m. The methodology for determining such a distance is taken from the original formula for determining capacity. Many years of experience and the reactions of the visitors themselves have shown that this is the minimum distance that is necessary so that the experience of nature does not fall into the background. By setting the maximum allowed density of visitors, and with the given speed of movement of visitors, the maximum width of the track is also determined. The established speed of 2.5 km h−1 means that it takes 4.2 s for a visitor to cover a distance of 3 m, which is necessary for the next visitor to walk on the same path behind.

2.3. Short-Term Prediction of Future Visitors Data

The annual visitors count data during 1996–2018 were collected from the official Plitvice Lakes internal database. These were evaluated for the short-term prediction of future visitors count, aiding in the management planning for mitigating the environmental susceptibility caused by increasing visitors count, including trampling and damaging flora in the close proximity of routes and trails. The used approach included the prediction using the 10-year visitors count with the linear regression for forecasting the following four years. Previous research successfully applied the 10-year study period with the linear regression for predicting visitors count in protected natural areas [39], as well as the duration of the tourist length of stay [40]. This approach was evaluated in the four independent iterations by fully covering the 1996–2018 time frame which included the following: (1) training data during 1996–2005 for the prediction for 2006–2009 period; (2) training data during 1999–2008 for the prediction for 2009–2012 period; (3) training data during 2002–2011 for the prediction for 2012–2015 period; and (4) training data during 2005–2014 for the prediction for 2015–2018 period. The accuracy assessment was performed in four iterations accordingly, evaluating visitors count in the prediction periods according to measured historical visitor counts. Four accuracy assessment metrics were applied for evaluating the effectiveness of the short-term prediction, including the coefficient of determination (R2), root mean square error (RMSE), normalized RMSE (NRMSE) and mean absolute error (MAE), according to the Equations (4)–(7):
R 2 = 1 1 n x i x i ^ 2 1 n x i x i ¯   2 ,
RMSE   = 1 n ( x i x i ^ ) 2 n ,
NRMSE = RMSE x i ¯   ,
MAE = 1 n x i x i ^ 2 n ,
where x i are historically measured visitor counts, x i ^ are predicted visitor counts, x i ¯   is the mean value of measured visitor counts and n is the number of predicted visitor counts.

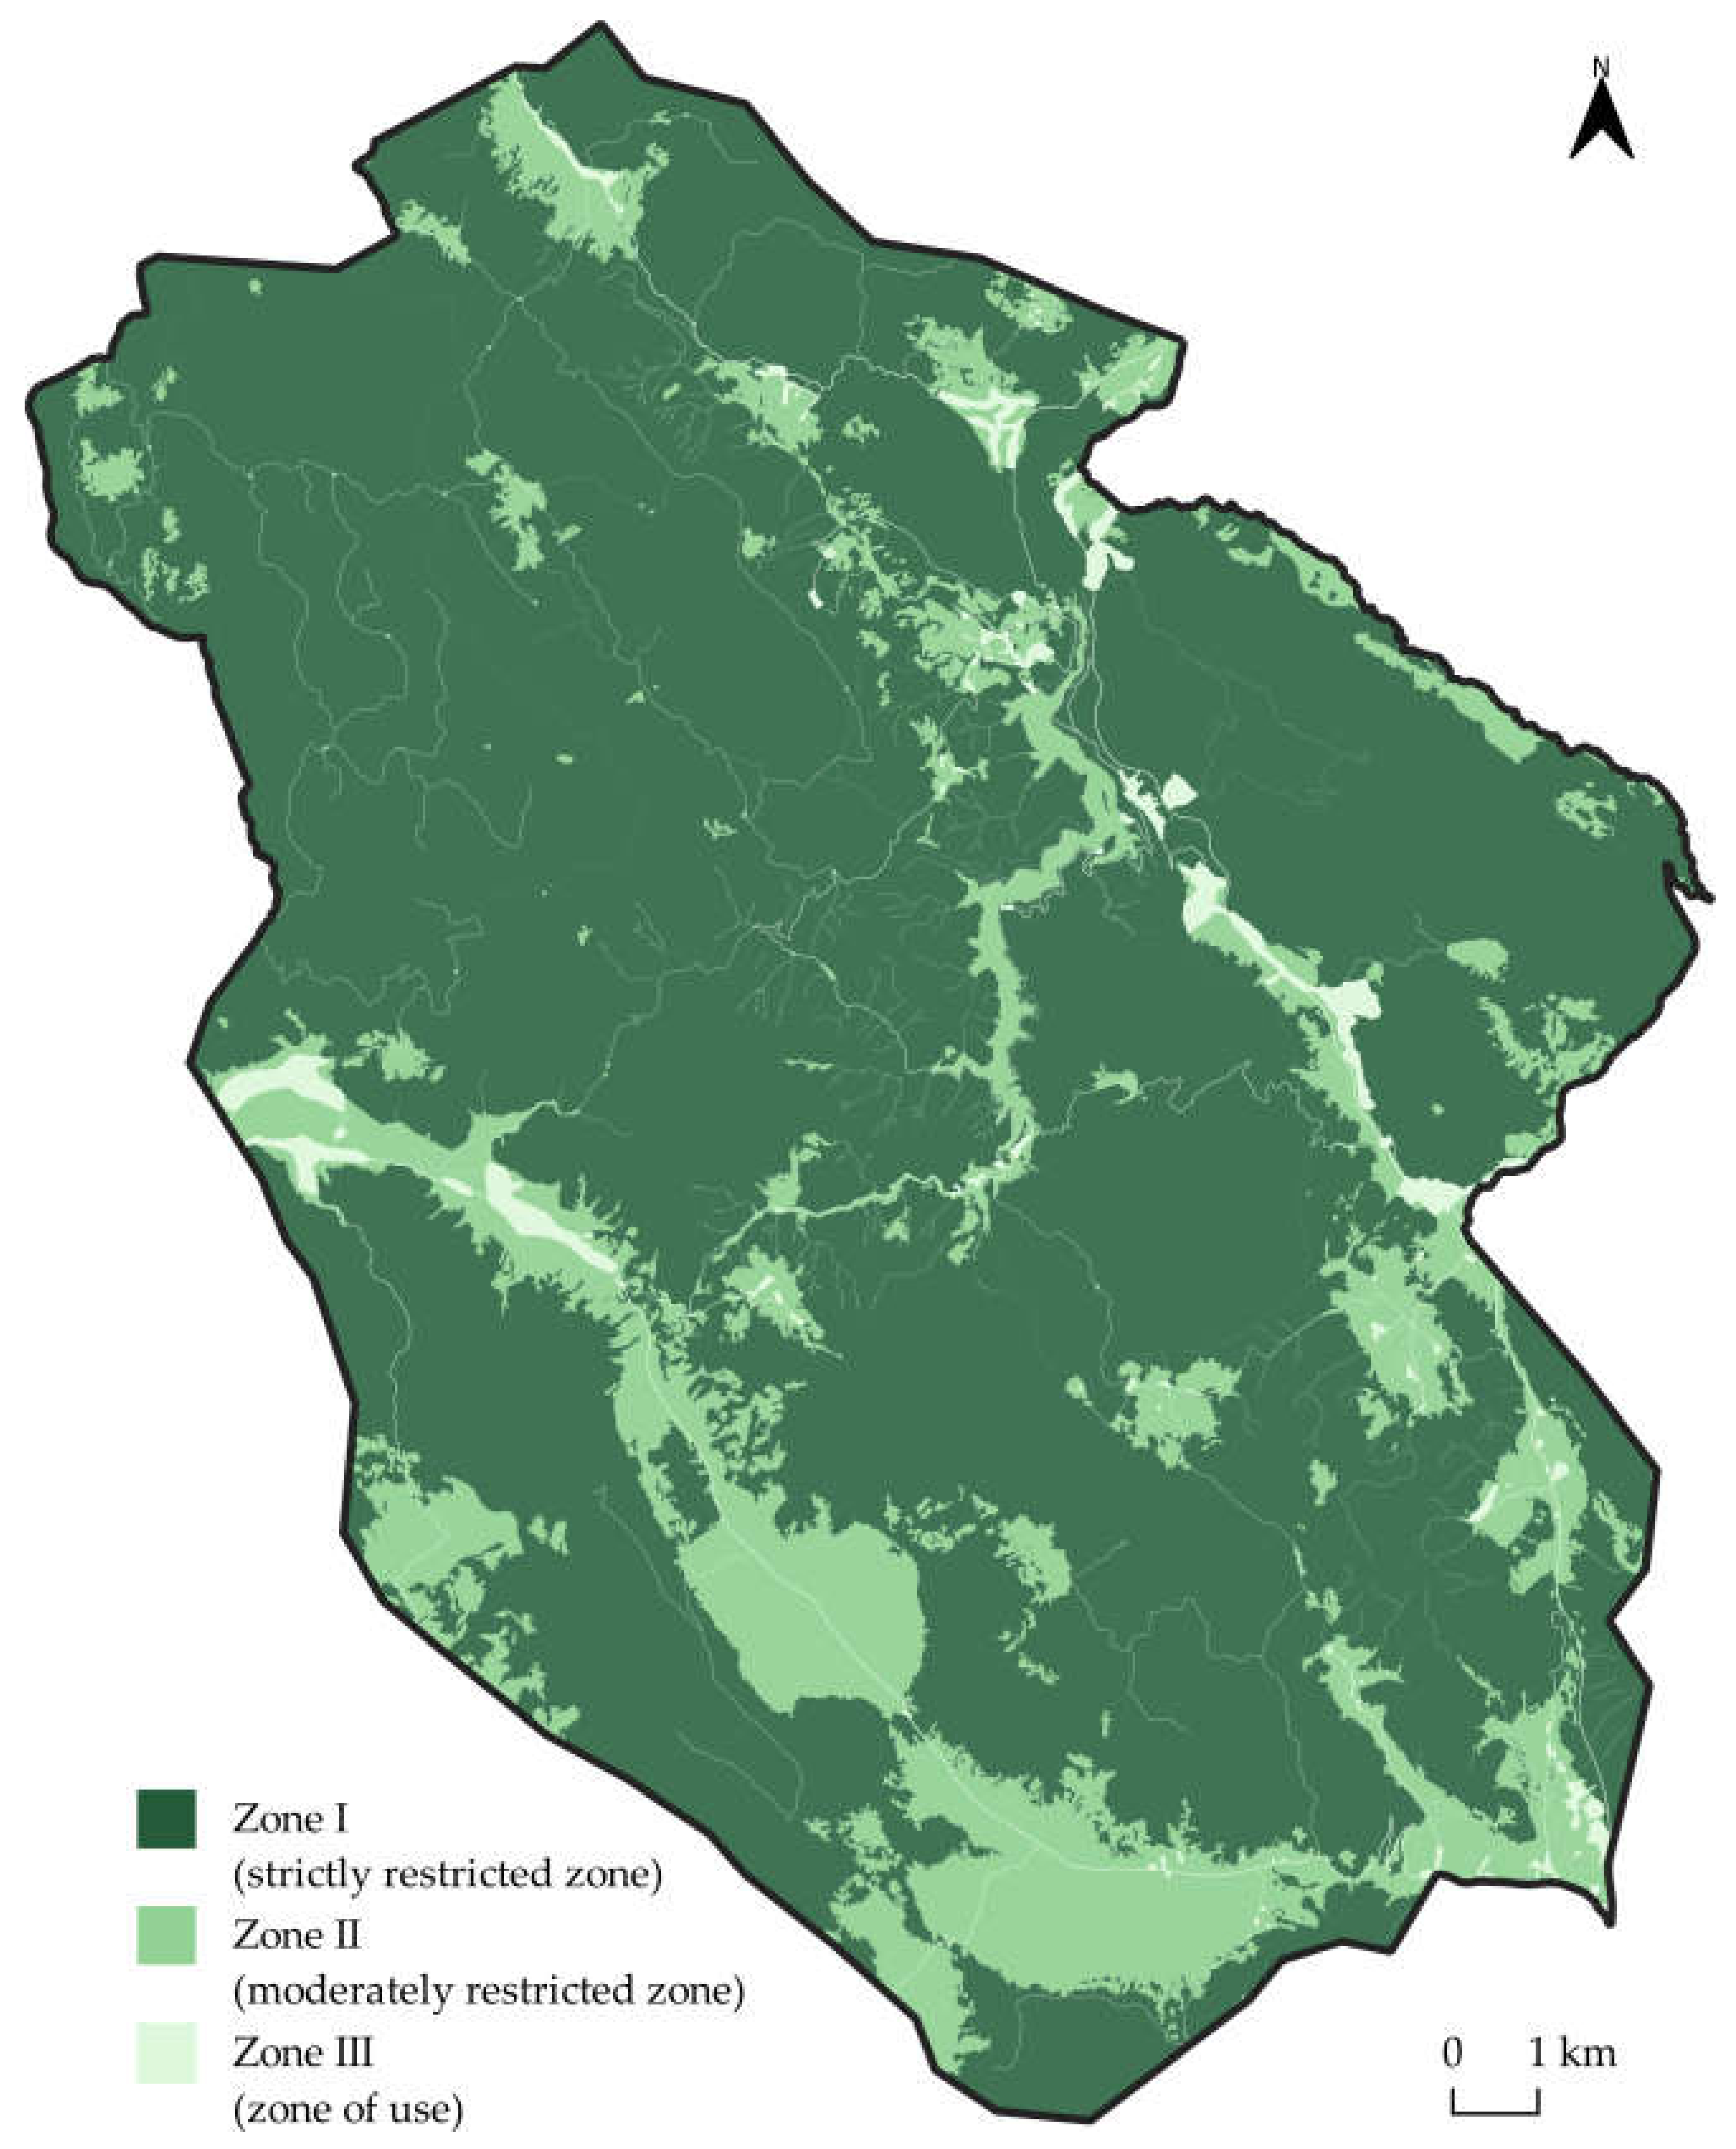
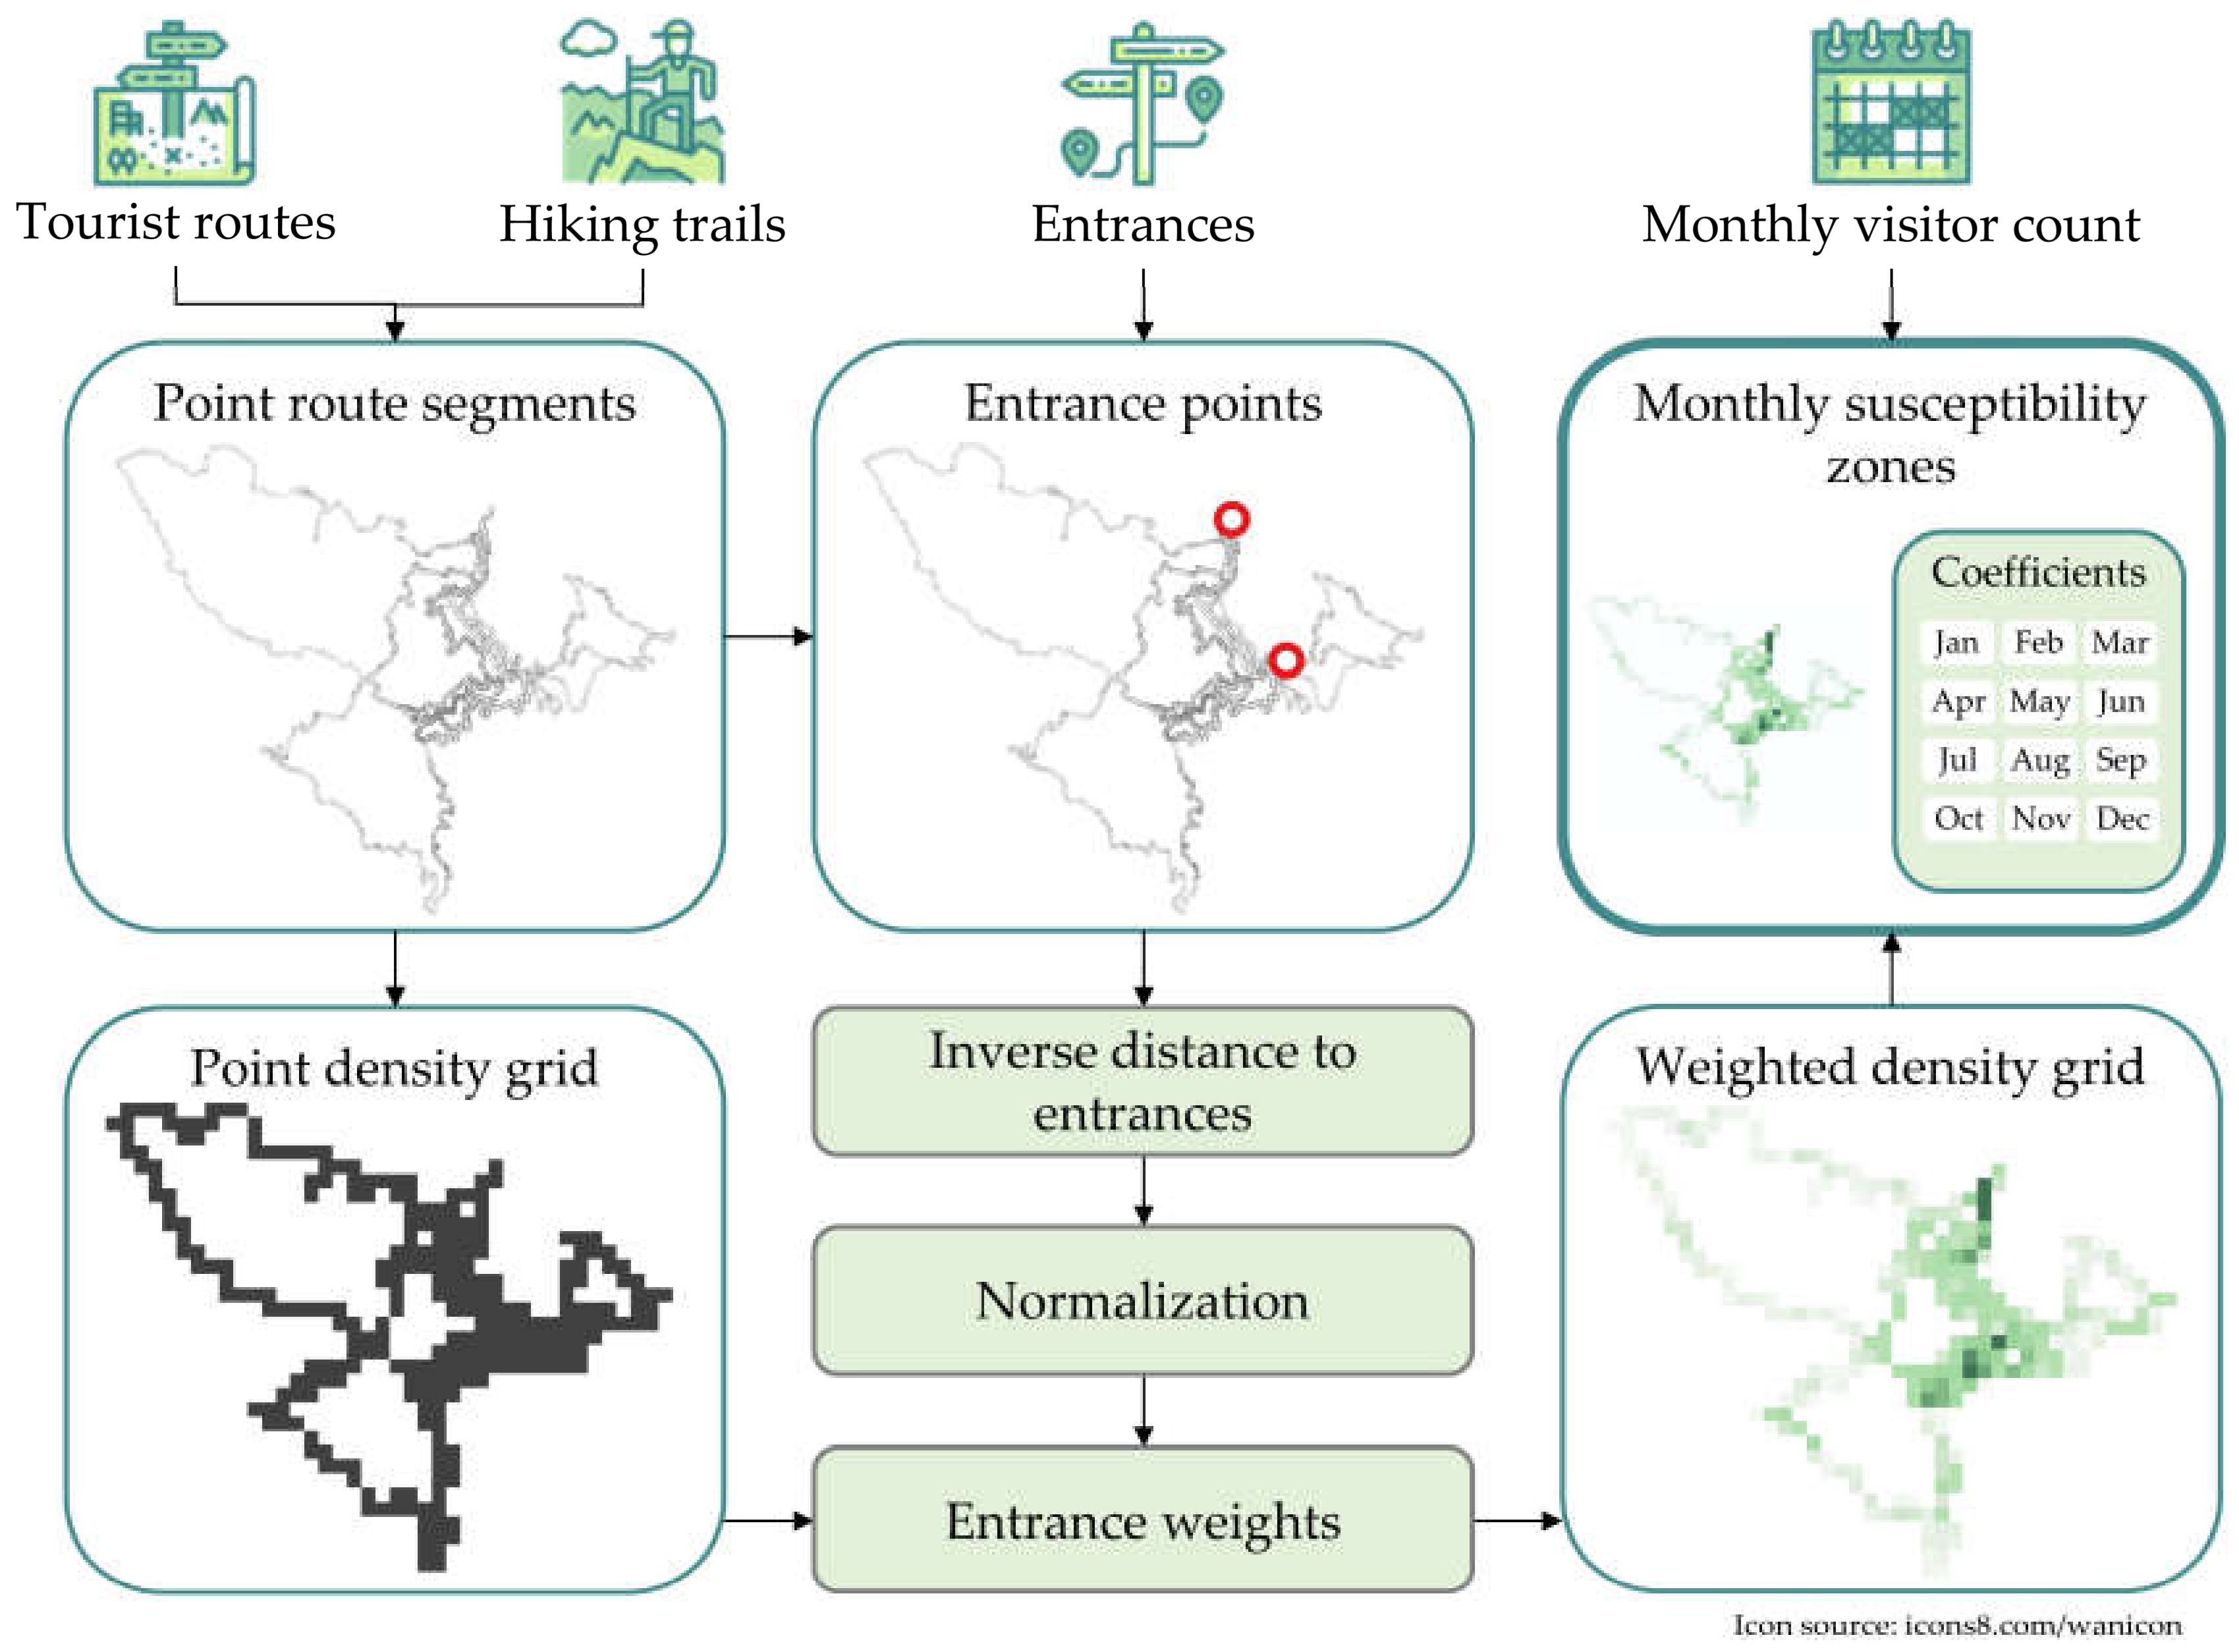
2.4. Zoning of Environmental Susceptibility Affected by Visitors Count

The proposed environmental susceptibility zones delineation method focused on the route density and the historical visitors count on a monthly basis, as two fundamental factors in the assessment of environmental impacts [41]. The environmental susceptibility map enables the basis for mitigating the adverse anthropogenic effects in the critical areas, providing a GIS-based approach for a nature park management [42]. A total of 19 combined tourist routes from the Plitvice Lakes National Park and hiking trails were merged and regularly split to point route segment layer. These point vector data were zoned to 250 m spatial resolution polygons and weighted according to the normalized inversed distance to two national park entrance points, representing the hotspots for visitor density [43]. The two entrances of the Plitvice Lakes were determined as the hotspots of visitor activity, as the only two approach points to all analyzed trails and routes to which all visitors are guaranteed to enter and exit. The distances to each respective entrance point were calculated separately and summed to represent a weighted density grid, determined as the combination of point route segments density per pixel, weighted by the weighted distance to entrance points. This weighted density grid served as the basis for delineation of monthly susceptibility zones, which were calculated by multiplying the base weighted density grid values with the monthly visitor count factors. These factors represented the ratio of average monthly visitors count with the average visitors count from all twelve months in the 1996–2018 study period. The proposed environmental susceptibility zone delineation method is summarized in Figure 4.

3. Results

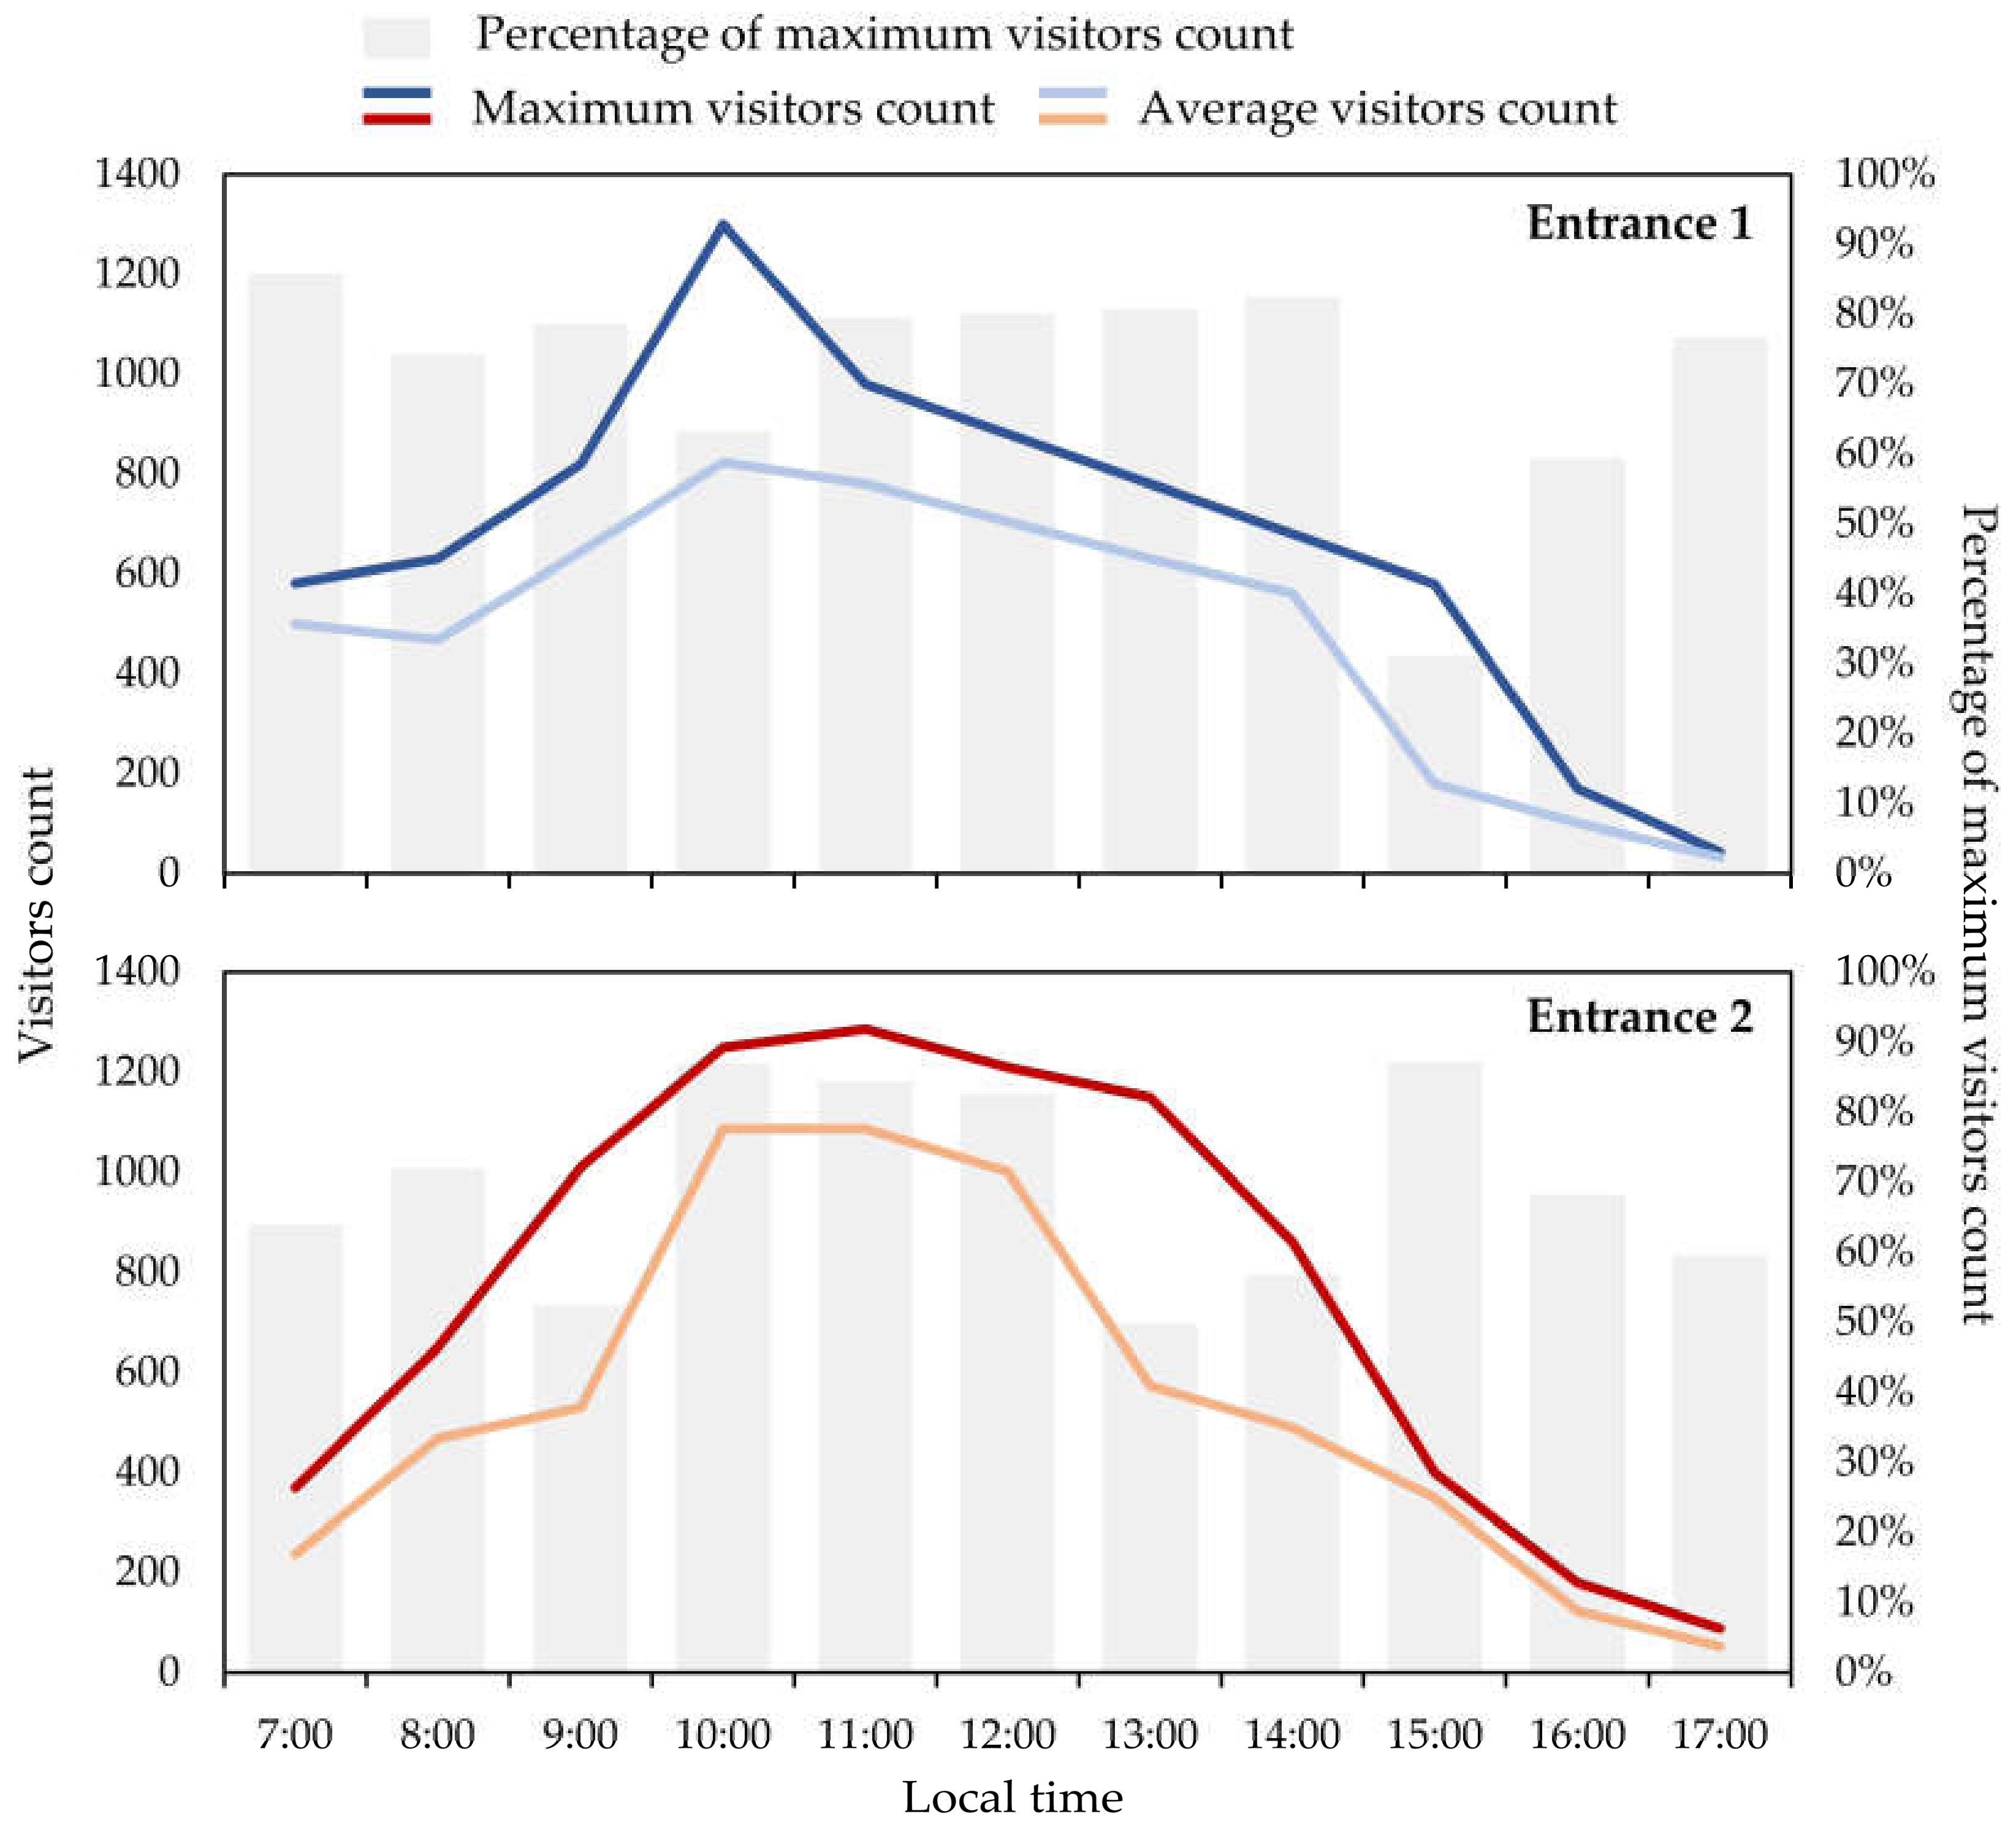
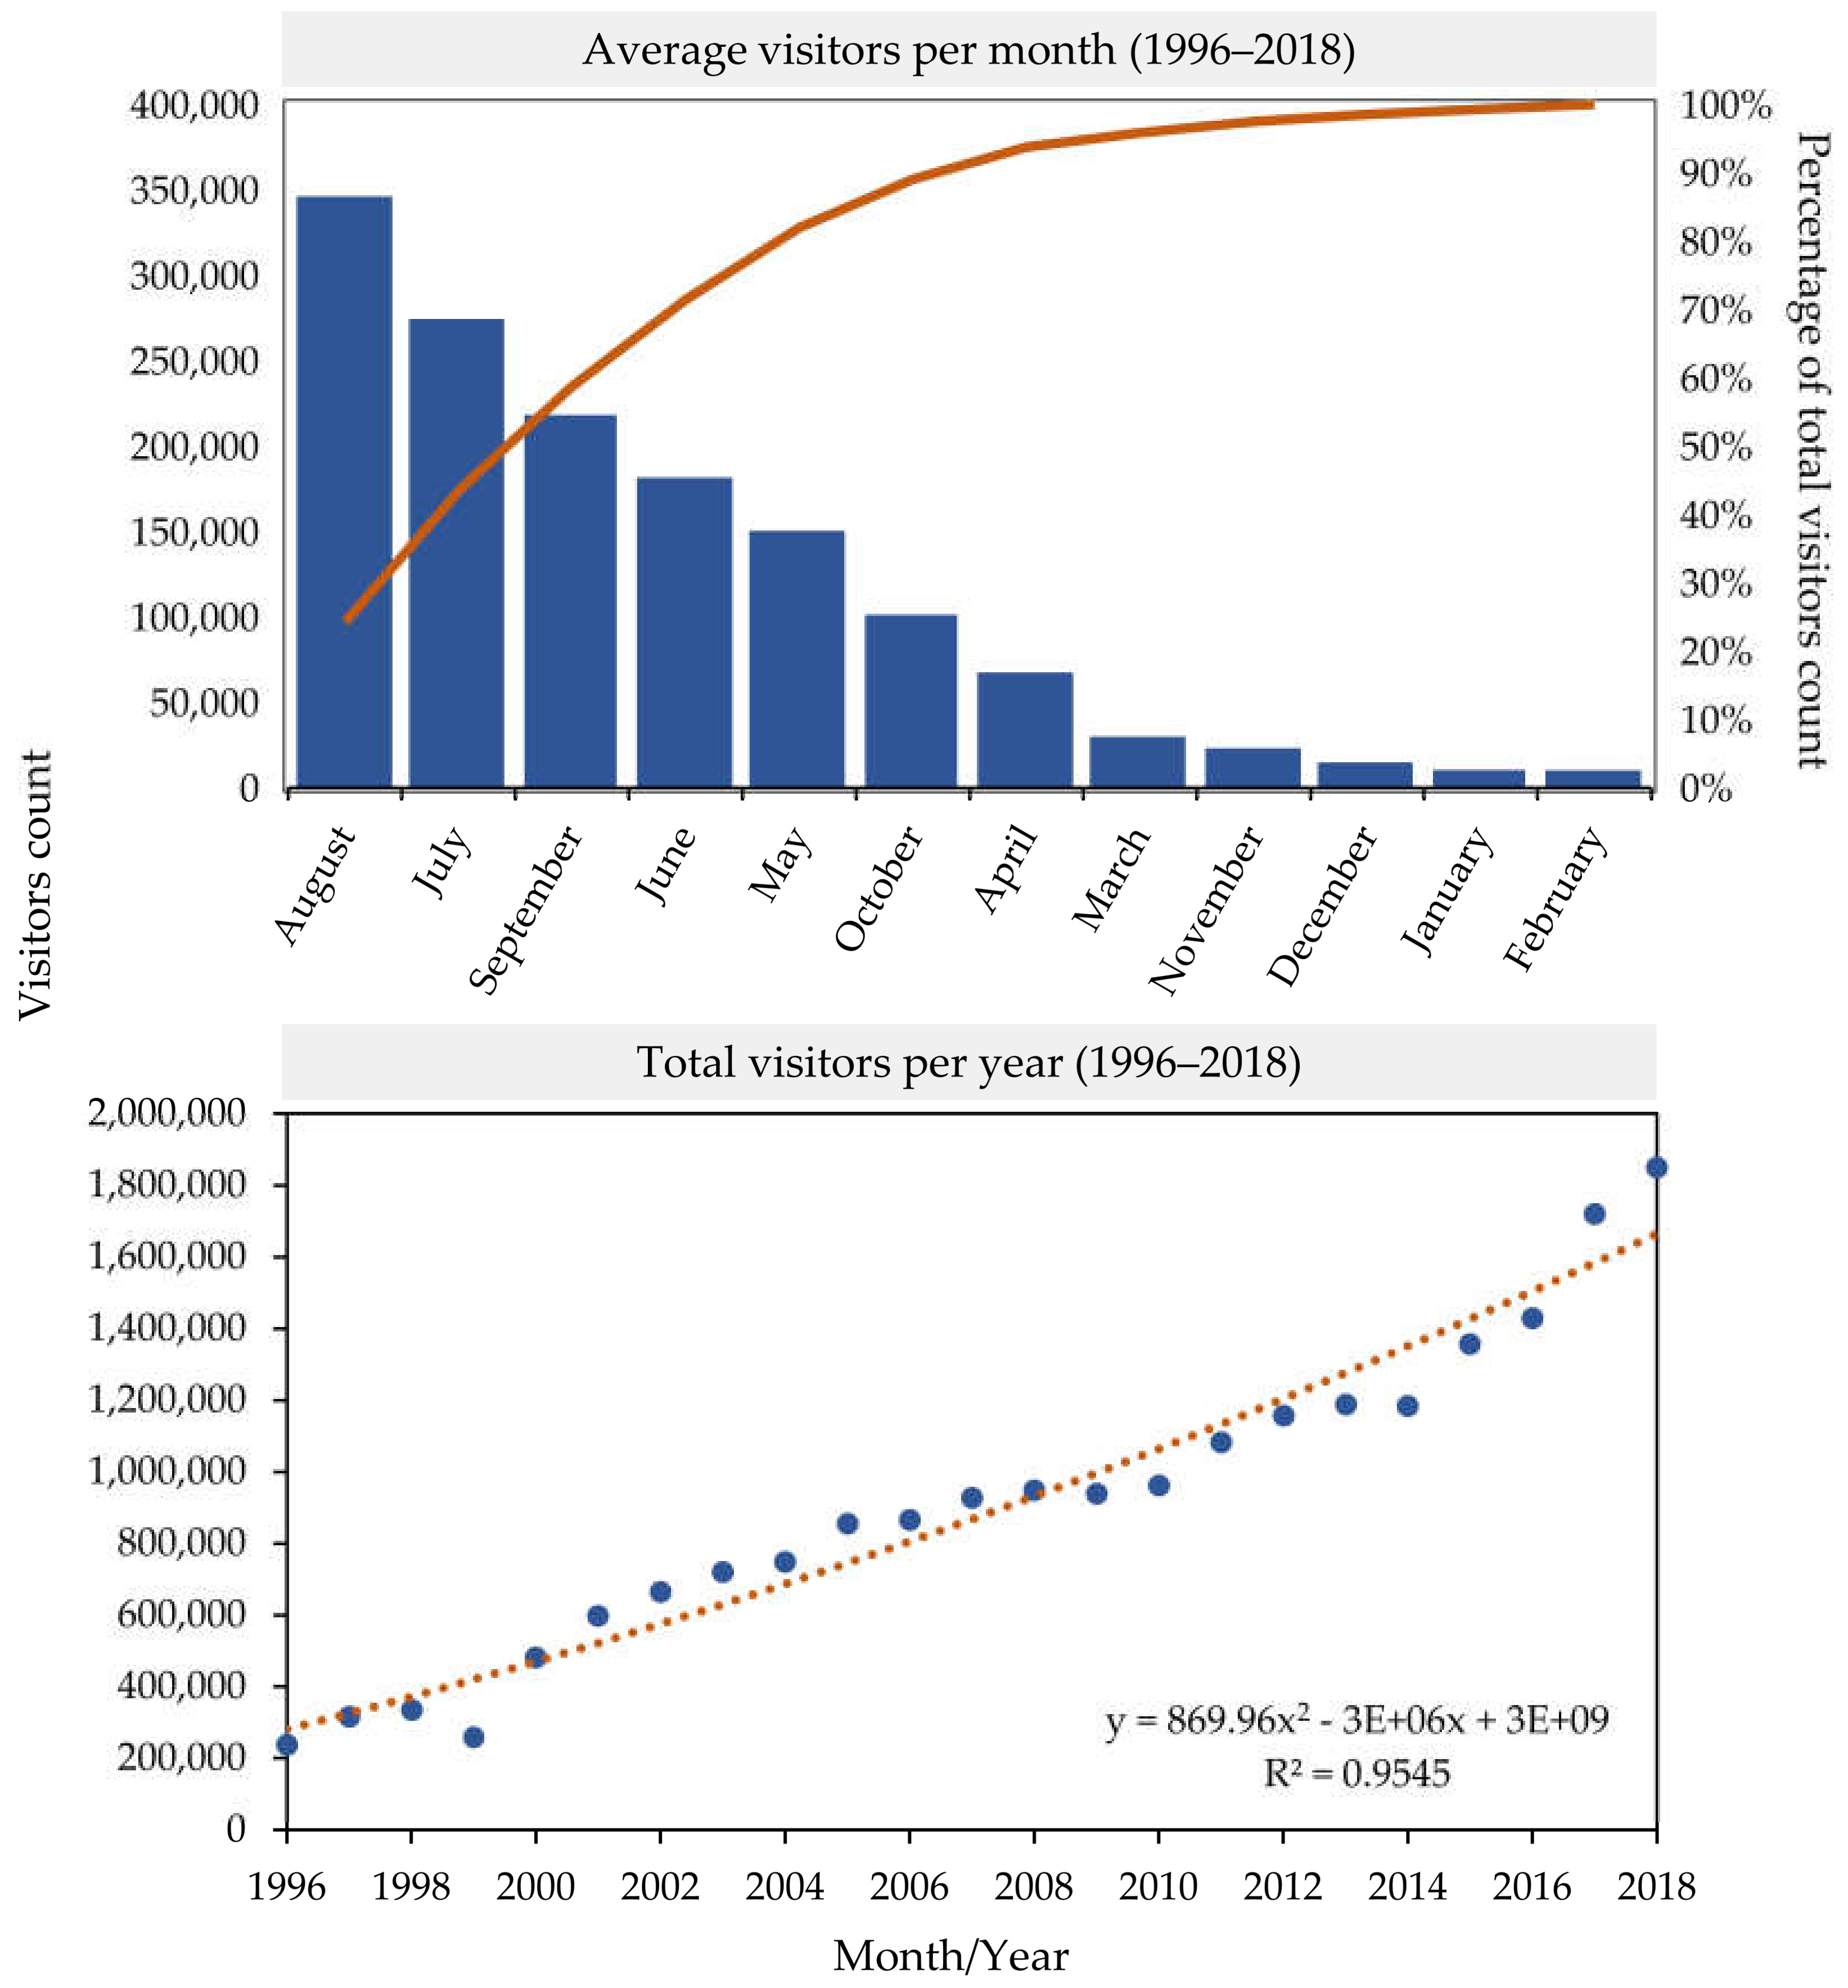
3.1. The Analysis of Visitors Count by Time Frames

Figure 5 shows visitor loads per individual entrance by hours of the day for 2017, for which the latest official data on the visitors count is available. The highest number of visitors (load) at Entrance 1 was in the time range from 10:00 to 11:00. At Entrance 2, the largest number of visitors is reached in the period from 09:00 to 14:00. The biggest difference between the average and maximum number of visitors at Entrance 1 is at 10:00, and at Entrance 2 at 13:00.
As shown in Figure 6, the summer period of the year brings with it the largest share in the total number of visitors during the year. In that quarter alone, the park is visited by slightly less than 60% of annual visitors. Accordingly, the impacts on the natural ecosystems of the Plitvice Lakes National Park is greatest during the summer months (July, August, September). A slightly lower number of visitors can be expected during all the spring months (April, June, May) and a smaller part of the autumn part of the year (October). During the remaining autumn and the entire winter period, the load on the natural ecosystems of the National Park, related to the number of visitors, is negligible.

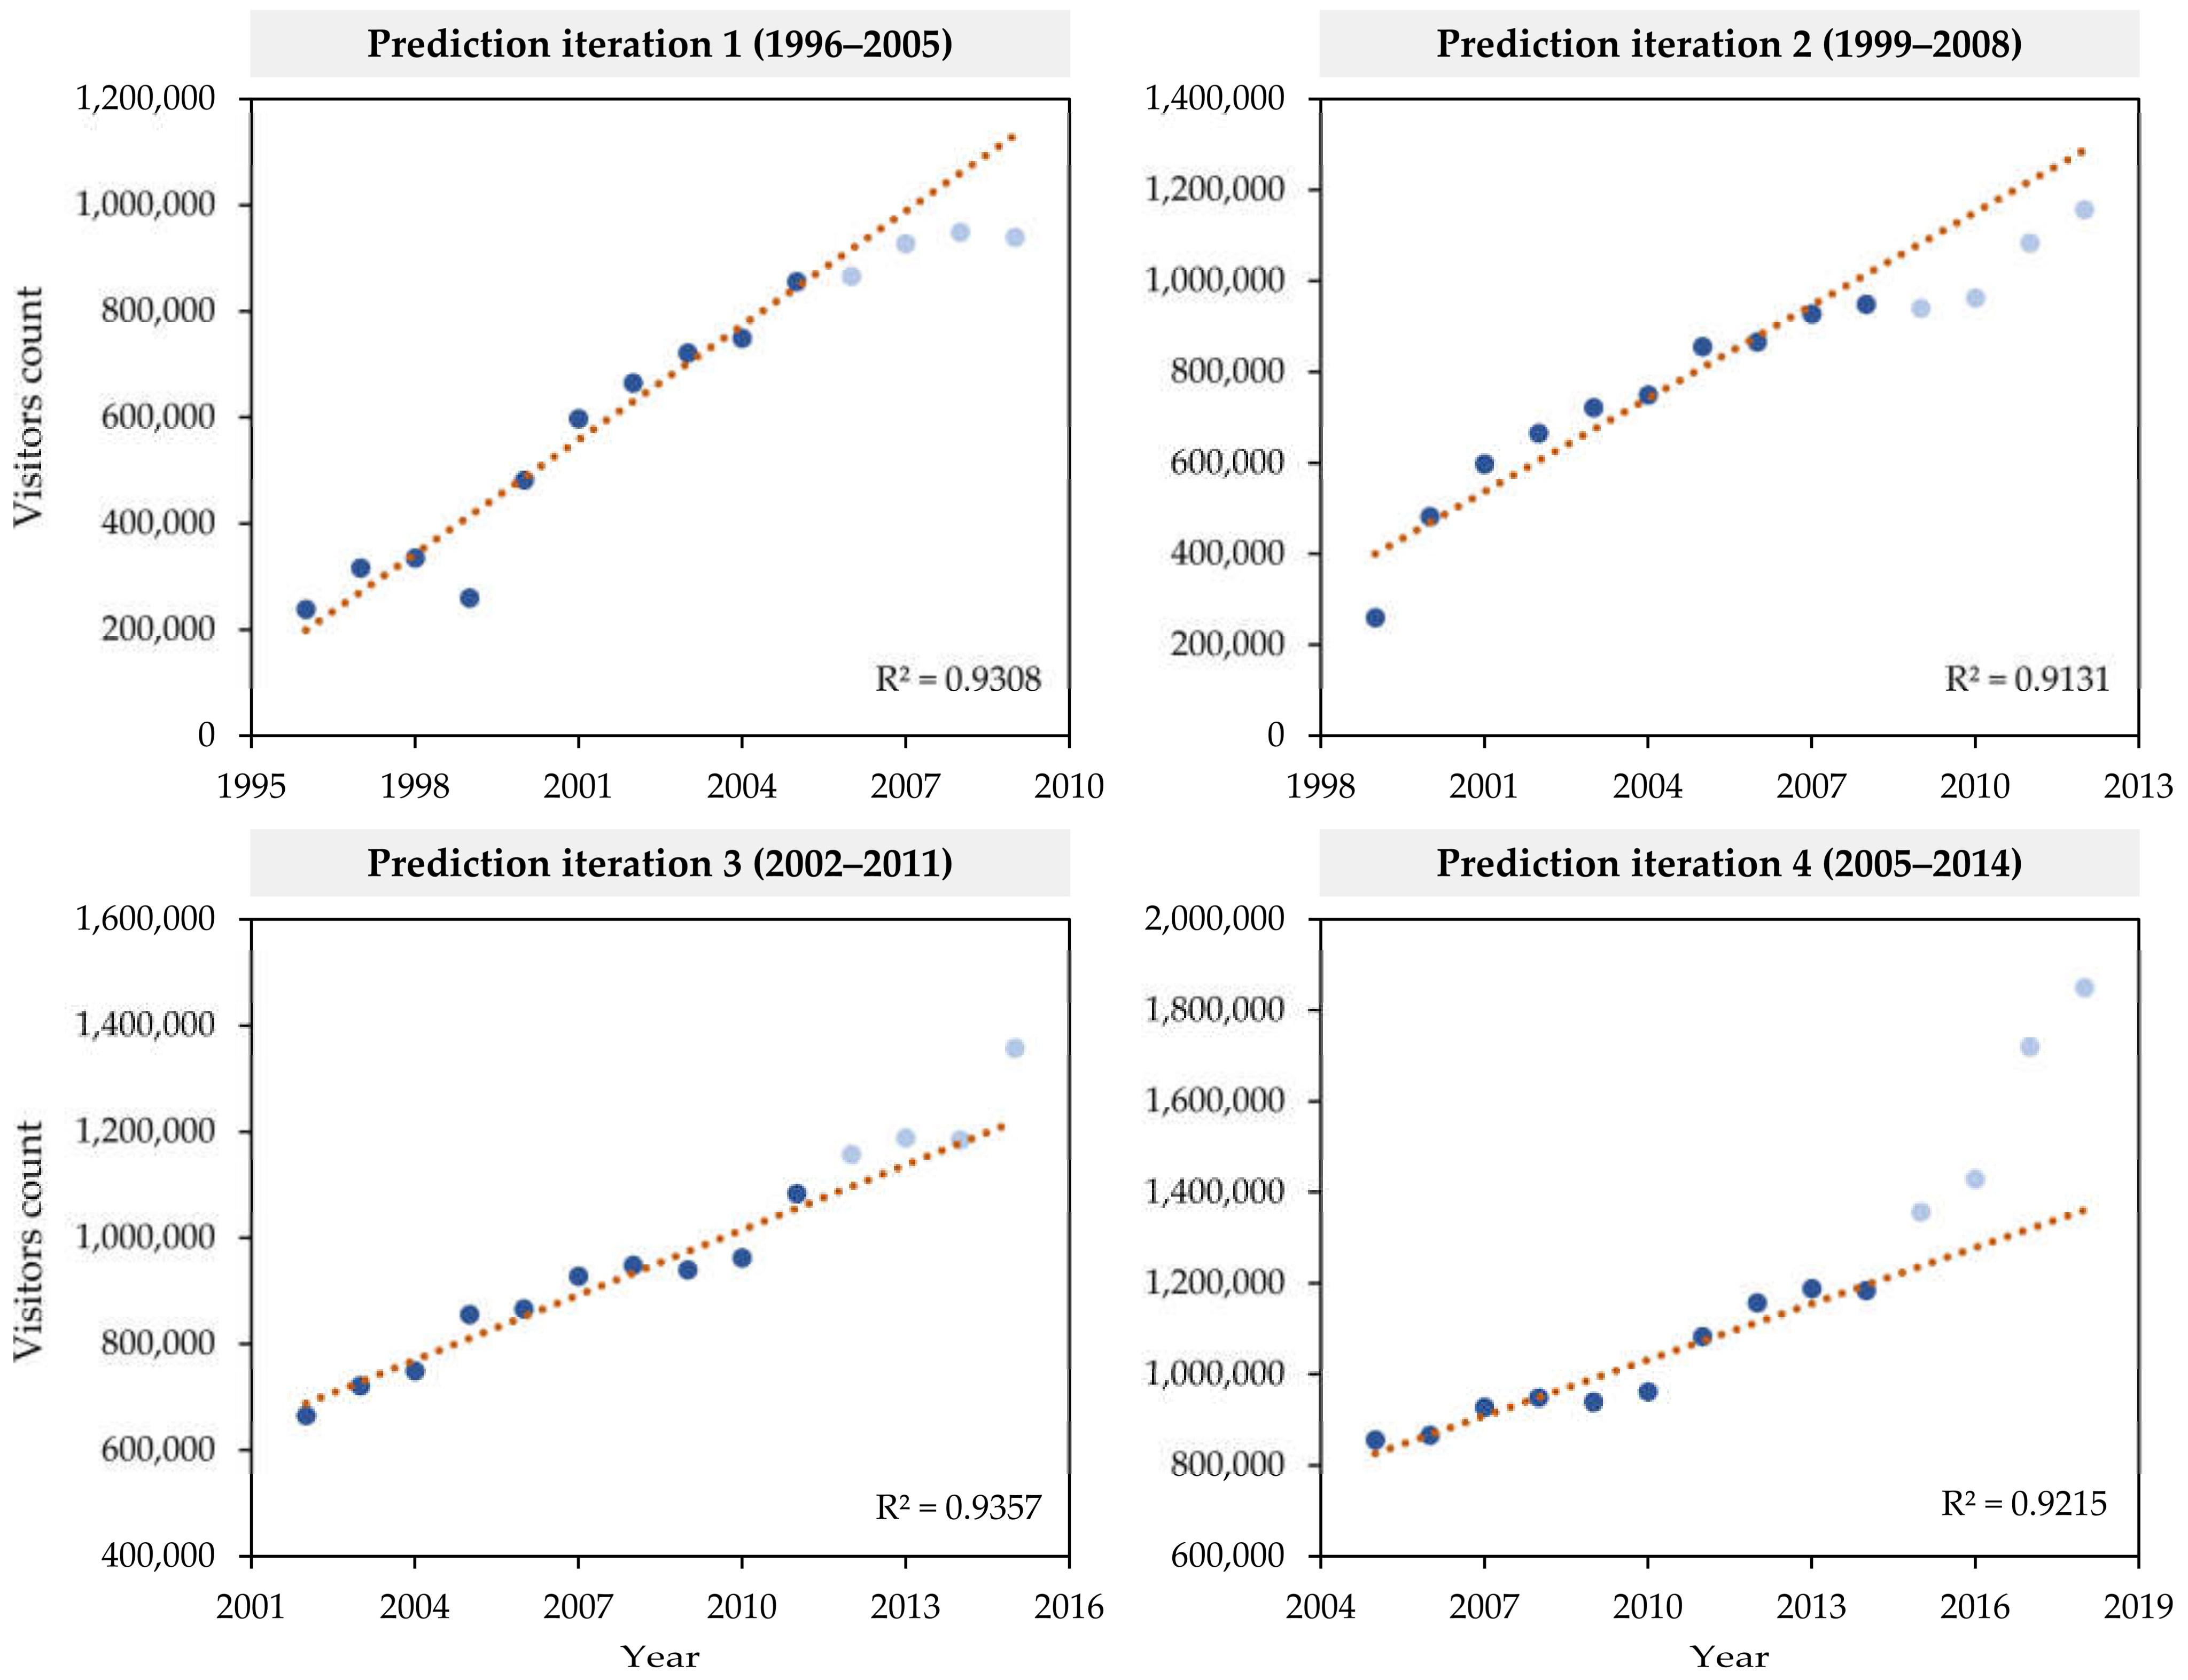
3.2. Prediction and Evaluation of Short-Term Prediction of Future Visitors Data

The accuracy of all models evaluating visitors count in the prediction periods according to measured historical visitor counts according to the R2, RMSE, NRMSE and MAE criteria is shown in Figure 7 and Table 2. The coefficients of determination in all iterations indicate a strong connection between the selected training data sets and the values predicted by the model. However, the relative accuracy shown by R2 and absolute accuracy showed by RMSE, NRMSE and MAE do not coincide between intervals. The lowest R2 was observed in iteration 1, and the highest in iteration 4. Despite this, the highest RMSE value of the was obtained in iteration 4, while the lowest was achieved in iteration 3. The same was observed with the NRMSE and MAE values between iteration 1 and 4.
These results point to a very strong forecasting ability of the iteration 3 compared to other datasets. The results obtained using the iteration 1 are close to those obtained using the iteration 3. The lowest accuracy rate was achieved using the iteration 4. With this method, it is possible to achieve moderately accurate prediction activities with the fact that the indicators in a certain segment diverge and it is not possible to reliably make a short-term prediction for 4 years, but it is possible to obtain a tentative number of visitors.

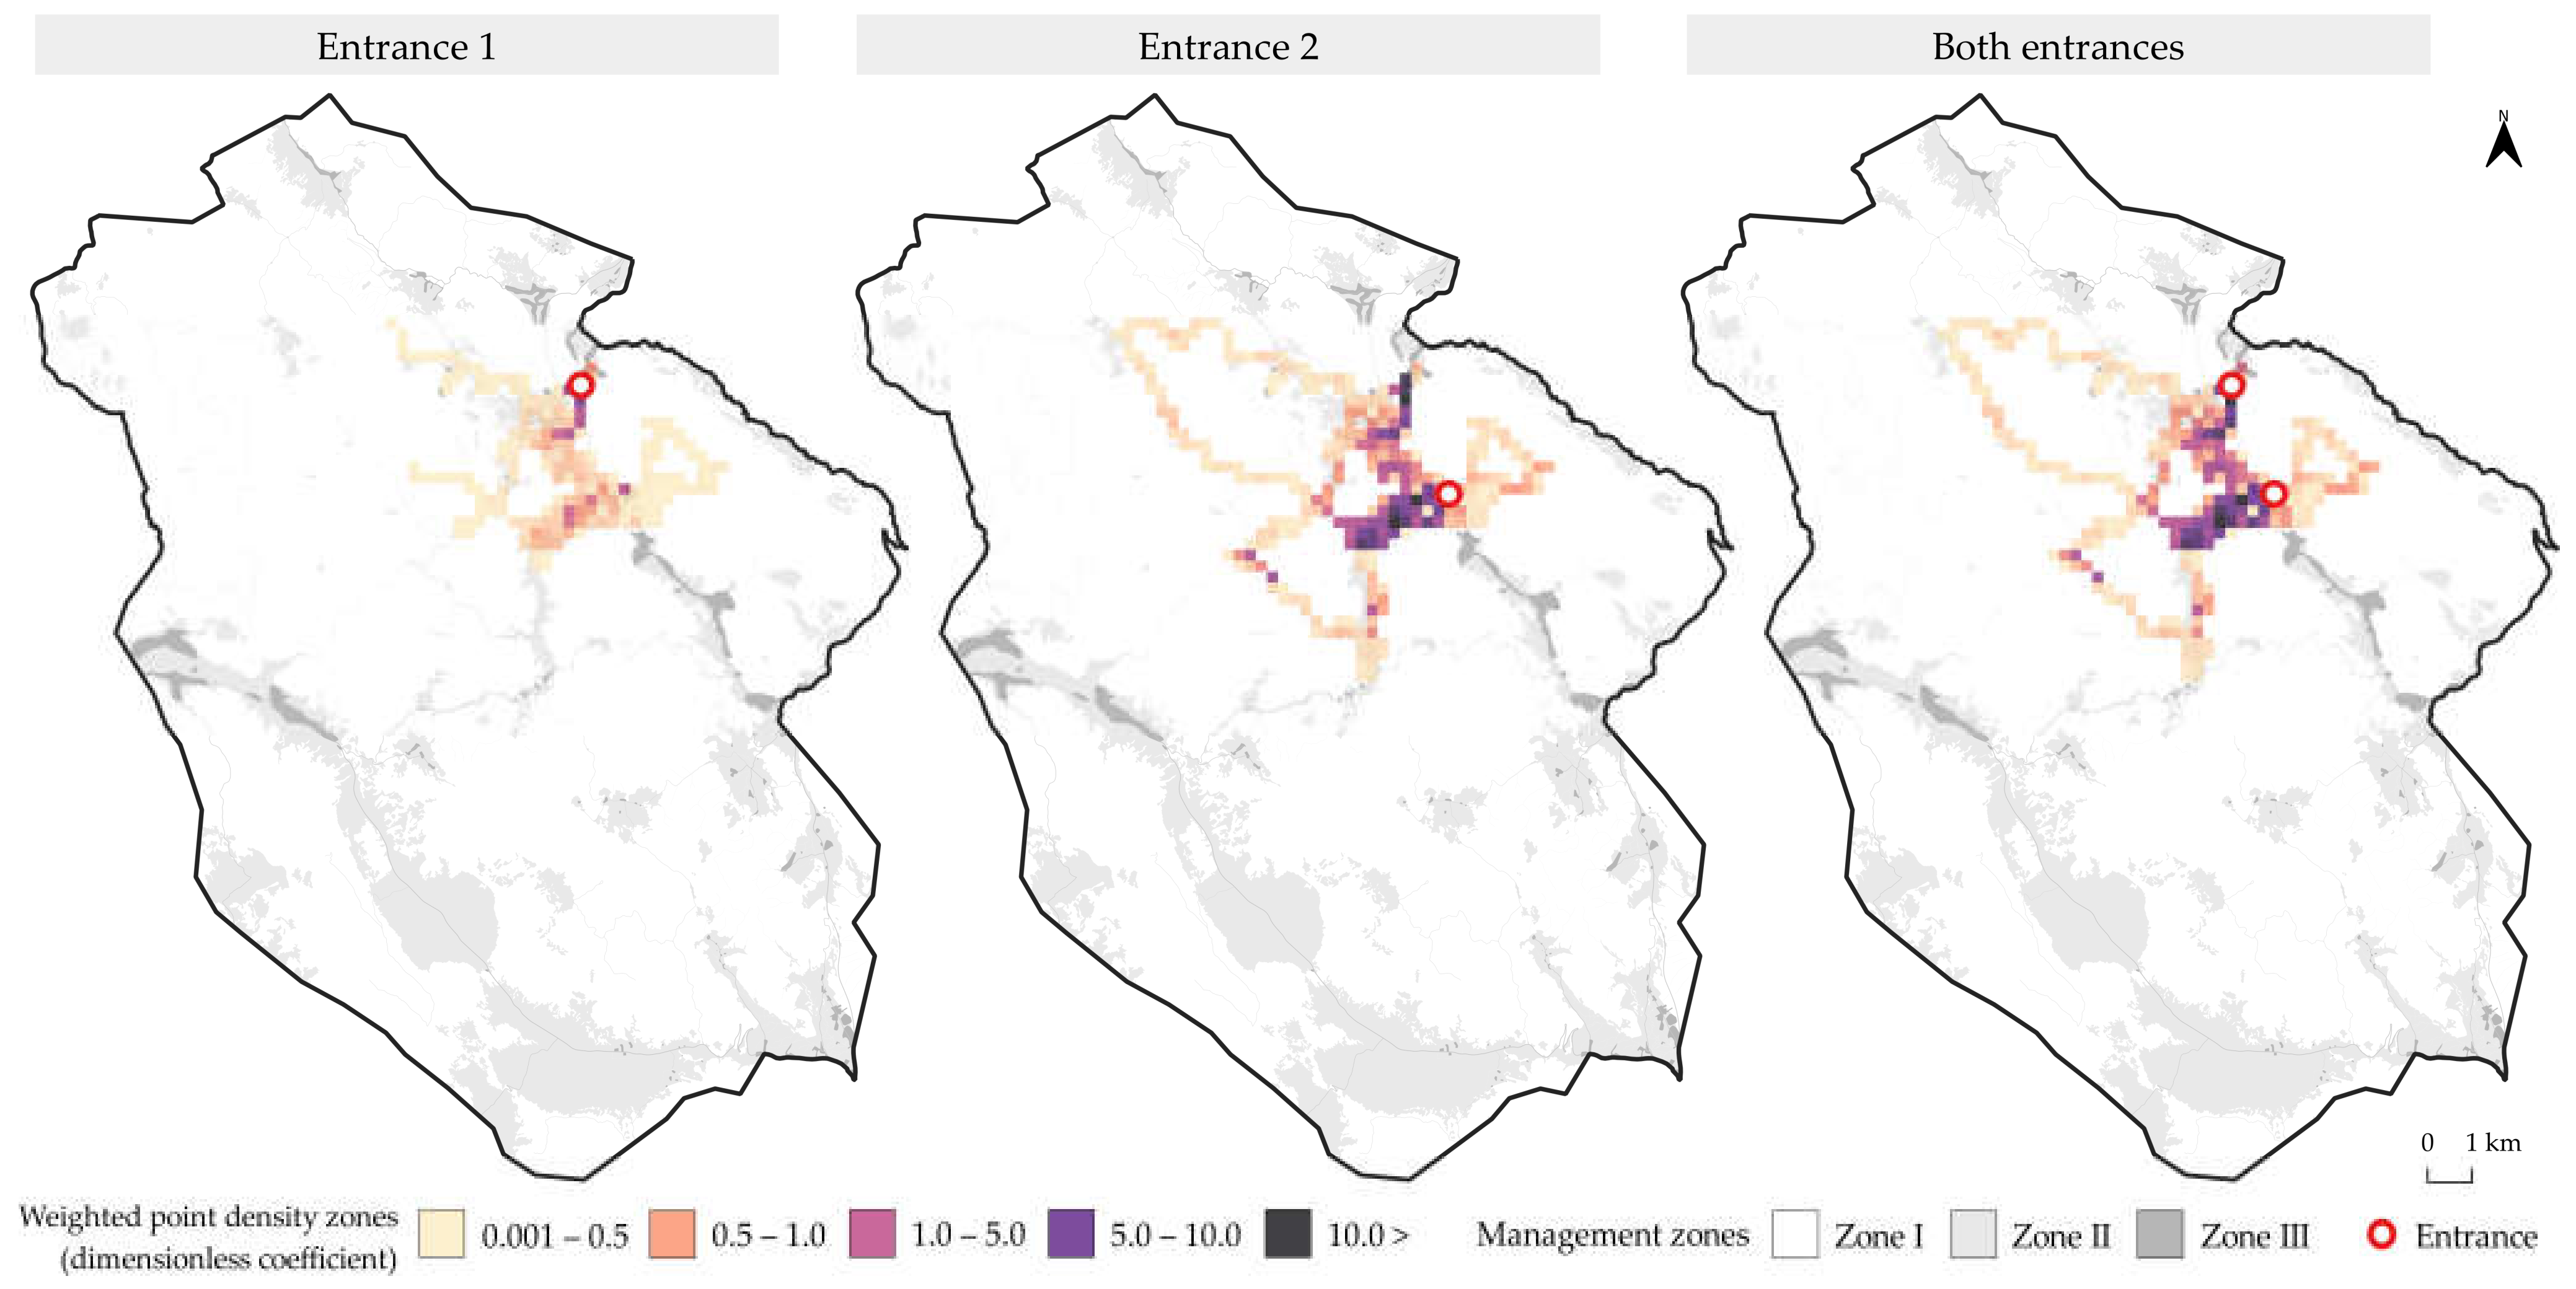
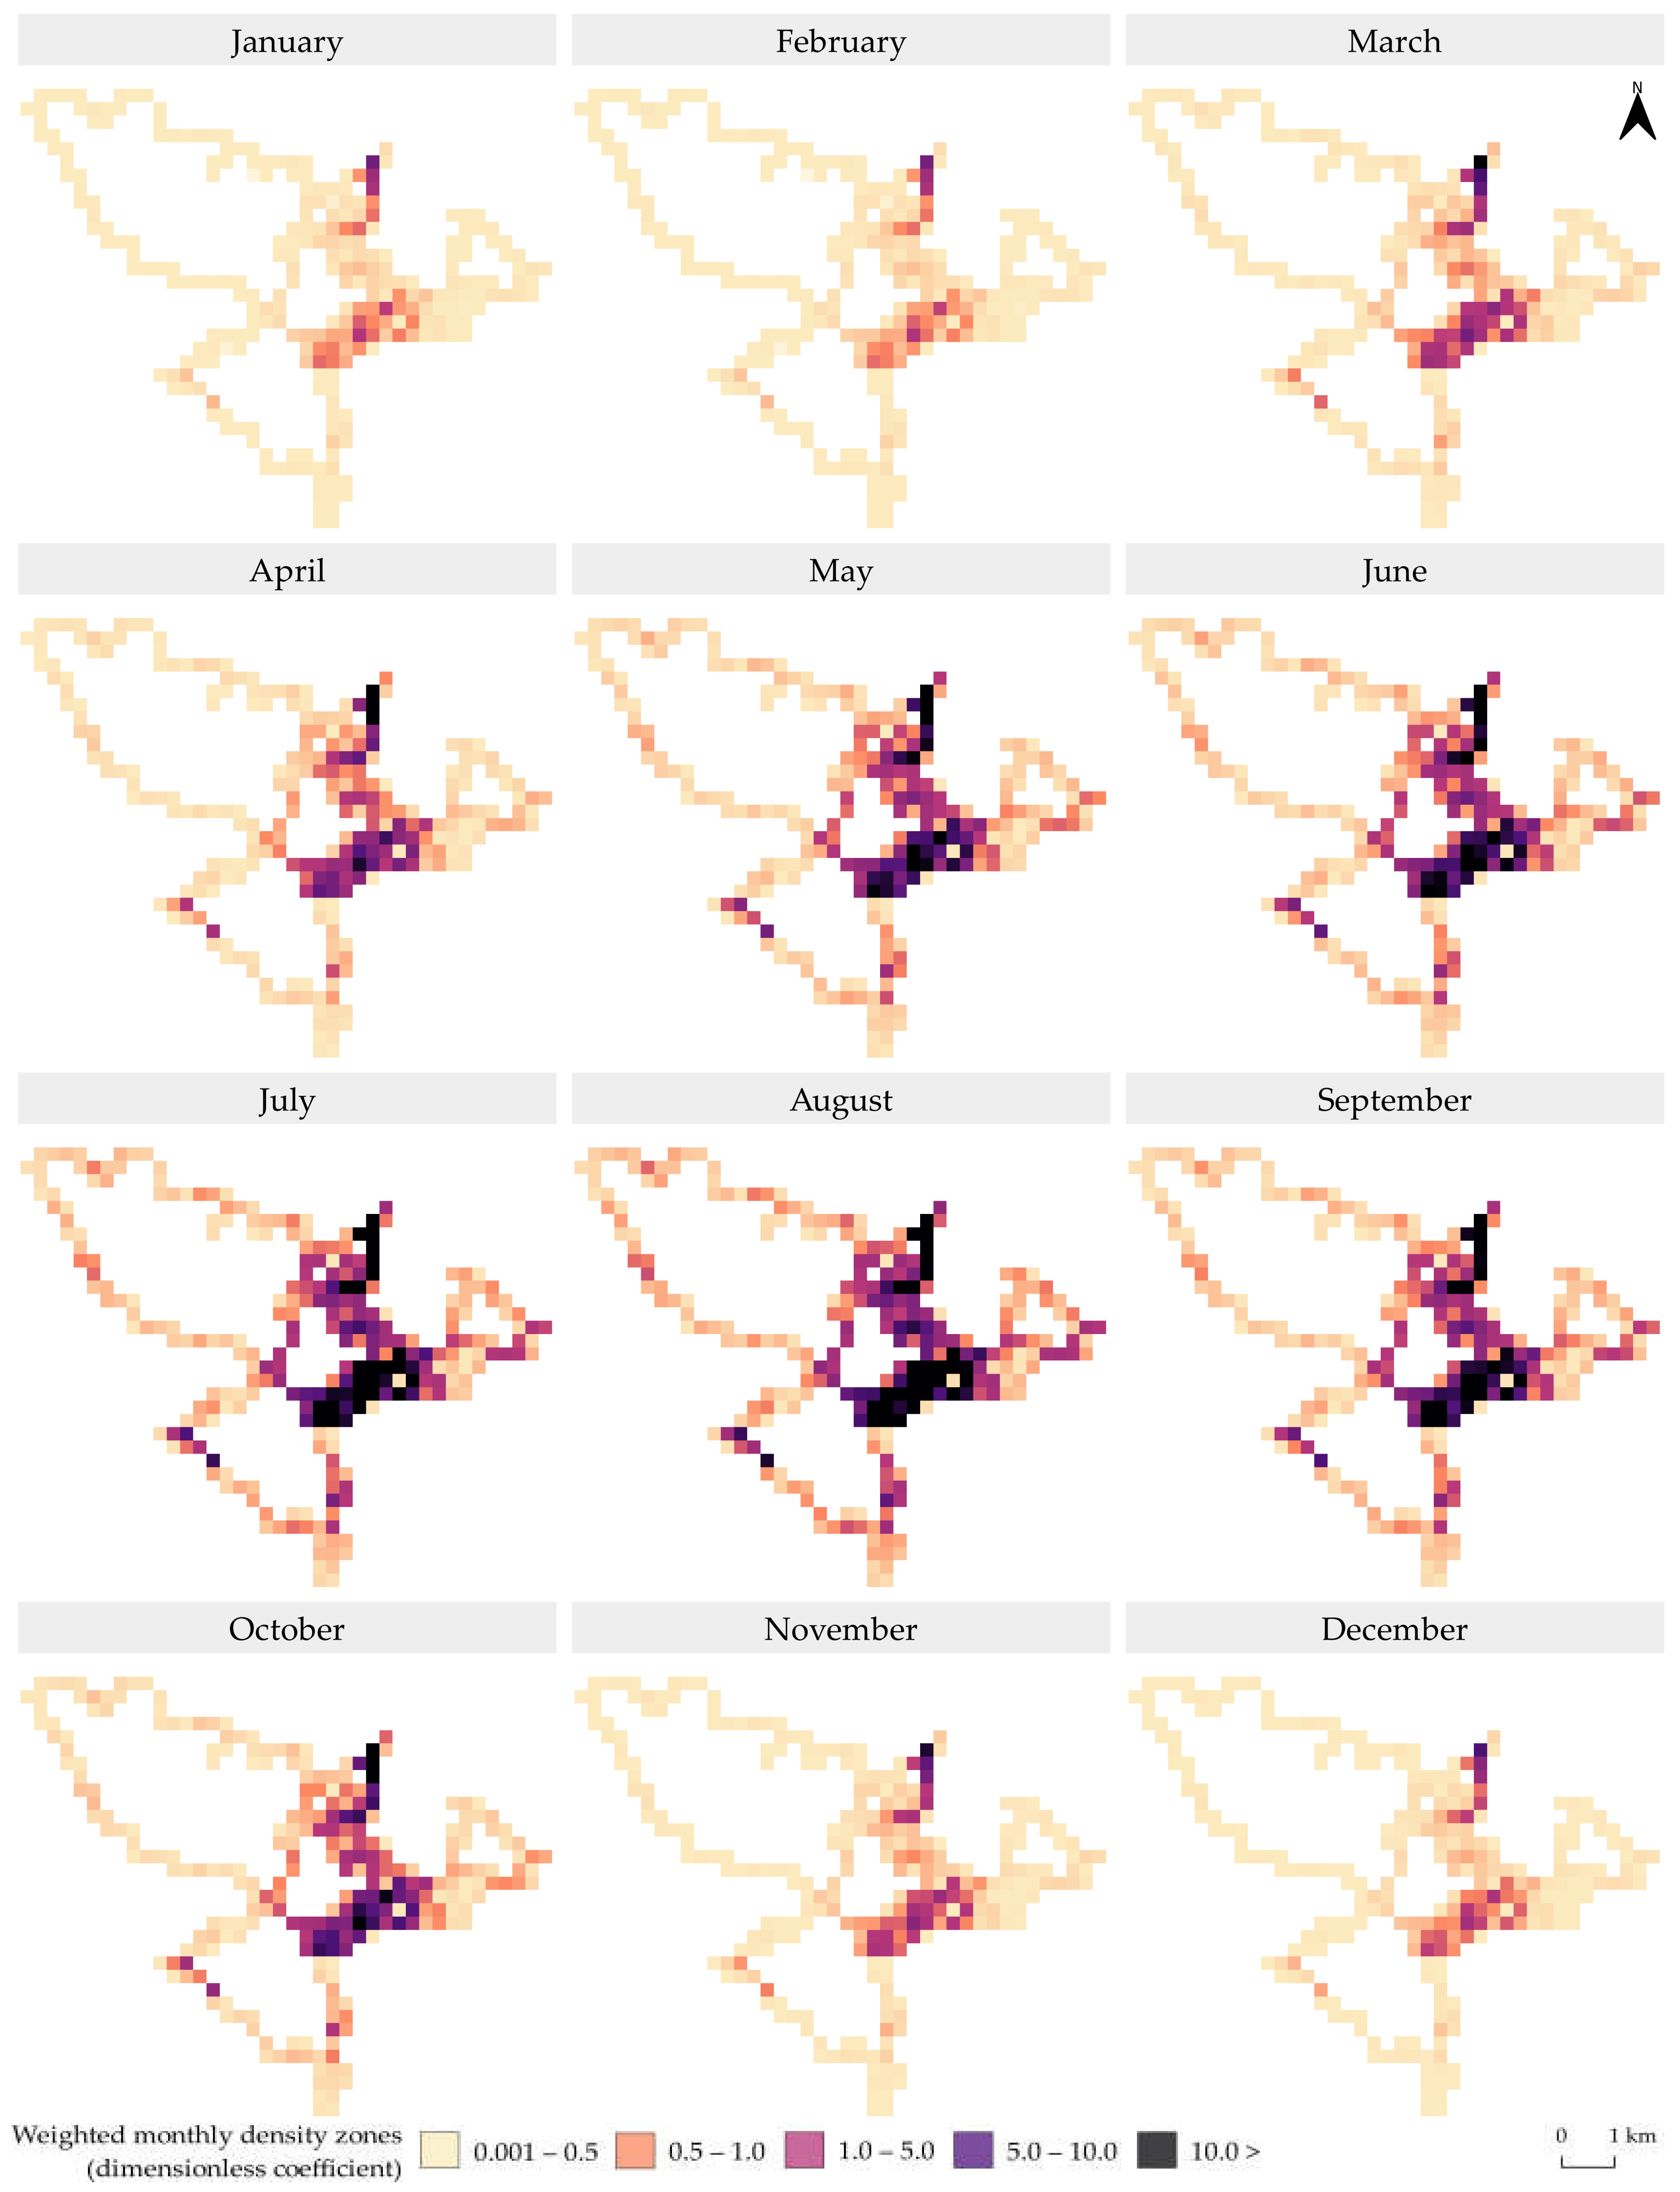
3.3. Environmental Susceptibility Zones Weighted by Monthly Visitors Count

As shown in Figure 8, there is a significantly higher visitors load at Entrance 2, which was previously determined by the results shown in Figure 5. Furthermore, the mentioned entrance is more heavily loaded with visitors and for the reason that a greater number of routes can be accessed through it compared to Entrance 1. Overall, per routes which continue from both entrances, the greatest visitors load is in the central part of the available routes, mostly located in management zone II.
According to Figure 9, the visitor load is the highest in summer (during the 3rd quarter of the year), indicating the time frame of the highest environmental susceptibility for park management. There is a very large range in the number of visitors between the winter-autumn and summer-spring months. However, the load hotspots, which make the sustainable management and management of the park extremely difficult, are constant throughout the year in the north, at Entrance 1, and in the central part, under Entrance 2, where there is also the highest density of routes available to visitors.

4. Discussion

Tourism in protected areas is one of the main parts of the global tourism industry. In addition to the economic benefits it provides, it also encourages the trend of nature conservation and its interpretation. Quality visitor infrastructure and visitor management are key factors in the preservation of protected areas and the sustainability of tourism in them [44]. Given that the Plitvice Lakes National Park receives an average of over 1.7 million visitors per year with a tendency of constant growth, it is extremely important to manage their arrivals and paths along the trails, all with the aim of reducing the negative impact and pressure on nature (according to RAPPM: Rapid Assessment and Prioritisation of Protected Area Management Tool [45]). In order to properly manage the park, public institutions of the Republic of Croatia require comprehensive geospatial data. Many organizations use visitor monitoring for this purpose, which is essentially an organized, prearranged collection and analysis of collected data about nature in the environment and about visitors to the observed area at a certain time (day, month, season, year…). Most often, such monitoring involves counting visitor visits, categorizing visitors according to individual characteristics, characteristics of visits and outcomes of visits [46]. By analyzing a large amount of data collected in a certain period of time, clear guidelines for future management are obtained [47,48,49]. With the method used in this research, it is possible to achieve relatively accurate prediction of the number of visitors, but it is not possible to reliably make a sufficiently accurate short-term prediction. To aid the proposed environmental susceptibility zoning approach, such short-term visitor count prediction could enrich it by providing a basis for future susceptibility prediction in nature park management plans. While a major disadvantage of the used historical visitor data was inability of relevant future prediction, as the most recent official data end in 2018, the updated annual visitors data provided by Plitvice Lakes authorities are planned for the improvement of the proposed zoning method in a future study. A GIS approach to data collection was used in the study of visitor behavior in the Central Park in Helsinki in order to help citizens jointly decide on spatial planning [50]. The study combined smartphone global navigation satellite system (GNSS) tracking, route mapping and a questionnaire to examine differences between user groups in off-trail use, off-trail movement and the motivations that influence it. In the researched sample, different types of activities are associated with recognizable spatial patterns and potential scope of impact. This includes reducing the dispersion and the extent of the influence of the use of space outside the designated paths and putting into use already trodden paths far from sensitive vegetation and protected habitats [50].
The implications from previous similar studies could improve the proposed methods, as well as the natural park management basis, by their integration in future studies. Brown et al. [51] in their research covered five national parks under the management of the Central Park Agency of the state of Victoria in Australia, with the goal of harmonizing visitors’ expectations, their experience of the park and their impact on the environment, needs for visitor infrastructure and other management measures. The GIS application used by the visitors was used to collect the necessary data for later analysis. In addition to GIS components, which were used to map the activity and locations of visitors, the application also had a questionnaire that visitors filled out during use. Later analysis of the obtained data yielded quality guidelines for space management as well as visitor management, i.e., establishing the sustainability of the use of protected spaces without diminishing their experience. Heikinheimo et al. [21] analyzed the data collection of Finland’s most-visited Pallas-Yllästunturi National Park, involving the data collection by visitors using social networks, utilizing the possibility of georeferencing photos and posts during their stay in the park. The collected data and their analysis show the most visited parts of the park, the activities of visitors in each part, as well as the seasonality of visits and individual activities of visitors. As stated in the previously mentioned research, related to the management of visitors and accompanying tourist infrastructure, in addition to spatial data, different types of questionnaires for visitors are used, which provide extremely useful additional data after processing. Certainly, in future research related to the management of visitors to the Plitvice Lakes national park, this type of data should be included and the public participation GIS should be used. Schägner et al. [52] in their study collected annual visits to 147 protected areas in the European Union, including Croatia. They mapped all available descriptive data: biological habitats, geographical and climatic characteristics, infrastructure equipment. Using GIS programs and other statistical tools, they created a model of the influence and relationship of all the characteristics of a national park and its visitors. The result of the model, among others, is the prediction of the number of visitors (annual) in all national parks of 26 European countries. Additionally, using machine learning, the number of tourists was predicted for the purposes of monitoring, decision-making and formulating management plans. Abang Abdurahman et al. [53] used data on the arrival of domestic and foreign visitors to 18 protected areas in Sarawak, Malaysia in the period 2015–2019, with the goal of predicting the number of visitors using machine learning techniques. It is concluded that machine learning has a respectable potential for predicting visitor data. Therefore, the main improvement of the proposed methods in future studies will be the inclusion of machine learning algorithms for environment susceptibility zoning, allowing greater prediction accuracy and computational efficiency.

5. Conclusions

Understanding the mechanism behind the occurrence of National Park visitor numbers at a certain time of the year can be crucial in creating effective sustainable strategies for nature-based tourism environments. Knowing the number of visitors is necessary for the proper management of the park and for the knowledge of the load on individual routes and zoning of environmental susceptibility affected by visitors count which focused on the route density and the historical visitors count on a monthly basis. Therefore, the main scientific contribution of this study was the prediction and evaluation of short-term prediction of future visitors data. Iteration 3 proved to be the most optimal, but the final conclusion is that with this method it is possible to obtain an approximate number of visitors, but it is not possible to reliably predict the number of visitors in the short term.
In order to make a short-term prediction of future visitors, visitor data were collected in the period from 1996–2018, and the 10-year visitors count method with the linear regression for forecasting the following four years was applied to the historical data set. Since official historical visitors count data were not updated from 2018, partially caused by COVID-19 pandemic, these were not presently utilized with the environmental susceptibility zones for future nature park management plans. The highest visitor count during the day in the period from 09:00 until 14:00 at both entrances were determined as crucial for nature park management, which is logical considering that this is the most active time for visitors. Seasonally, the Park is most visited in the warmer part of the year (spring and summer). The future study will improve the proposed environmental susceptibility zoning upon distribution of the updated visitor count data by Plitvice Lakes authorities.
The research proposed the modernization of the visitor system in terms of acquiring and analyzing visitor data by setting the maximum allowed density of visitors, and with the given speed of movement of visitors and the maximum width of the tracks. In combination with the aforementioned, GIS methods were used and maps of environmental susceptibility zones weighted by monthly visitors count were created, which indicate the busiest parts of visitor routes during certain months of the year. Future research will aim to improve these components by incorporating machine learning algorithms into the environmental susceptibility zoning model.

Author Contributions

Conceptualization, D.R.; methodology, I.P. and D.R.; software, D.R.; validation, M.J.; formal analysis, I.P. and D.R.; investigation, Ž.R.; resources, Ž.R.; data curation, D.R.; writing—original draft preparation, I.P. and D.R.; writing—review and editing, I.P. and D.R.; visualization, D.R.; supervision, M.J.; project administration, M.J.; funding acquisition, M.J. and D.R. All authors have read and agreed to the published version of the manuscript.

Funding

This research received no external funding.

Institutional Review Board Statement

Not applicable.

Informed Consent Statement

Not applicable.

Data Availability Statement

Not applicable.

Acknowledgments

This work was supported by the Faculty of Agrobiotechnical Sciences Osijek as a part of the scientific project “AgroGIT—technical and technological crop production systems, GIS and environment protection”.

Conflicts of Interest

The authors declare no conflict of interest.

References

  1. Travel & Tourism Economic Impact|World Travel & Tourism Council (WTTC). Available online: https://wttc.org/research/economic-impact (accessed on 13 December 2022).
  2. Nature Positive Travel and Tourism. Available online: https://research.wttc.org/nature-positive-travel-and-tourism (accessed on 13 December 2022).
  3. Croatian Bureau of Statistics Tourism in 2021. Available online: https://podaci.dzs.hr/media/gwcghawn/si-1700_turizam-u-2021.pdf (accessed on 13 December 2022).
  4. Protected Areas. Available online: https://mingor.gov.hr/o-ministarstvu-1065/djelokrug/uprava-za-zastitu-prirode-1180/zasticena-podrucja/1188 (accessed on 13 December 2022).
  5. Dudley, N. Guidelines for Applying Protected Area Management Categories; IUCN: Gland, Switzerland, 2008; ISBN 978-2-8317-1086-0. [Google Scholar]
  6. Law on the Protection of Nature. Available online: https://narodne-novine.nn.hr/clanci/sluzbeni/2013_06_80_1658.html (accessed on 13 December 2022).
  7. Esfehani, M.H.; Albrecht, J.N. Roles of Intangible Cultural Heritage in Tourism in Natural Protected Areas. J. Herit. Tour. 2018, 13, 15–29. [Google Scholar] [CrossRef]
  8. Rastegar, R. Tourism Development and Conservation, Do Local Resident Attitudes Matter? Int. J. Tour. Sci. 2019, 19, 181–191. [Google Scholar] [CrossRef]
  9. Marin-Pantelescu, A. Comparative Analysis between Romania, Bulgaria and Hungary’s Tourism Activity. Acad. J. Econ. Stud. 2018, 4, 176–182. [Google Scholar]
  10. Birendra, K.C. Complexity in Balancing Conservation and Tourism in Protected Areas: Contemporary Issues and Beyond. Tour. Hosp. Res. 2022, 22, 241–246. [Google Scholar] [CrossRef]
  11. Tajpour, M.; Hosseini, E.; Mohammadi, M.; Bahman-Zangi, B. The Effect of Knowledge Management on the Sustainability of Technology-Driven Businesses in Emerging Markets: The Mediating Role of Social Media. Sustainability 2022, 14, 8602. [Google Scholar] [CrossRef]
  12. Grigorescu, A.; Frinculeasa, M.-N.; Chitescu, R.-I. The Socio-Economic Value of Protected Areas. The Bucegi Natural Park. Manag. Dyn. Knowl. Econ. 2020, 8, 61–79. [Google Scholar]
  13. Daily, G.C.; Ellison, K. The New Economy of Nature: The Quest to Make Conservation Profitable; Island Press: Washington, DC, USA, 2002; ISBN 1-55963-945-8. [Google Scholar]
  14. Cessford, G.; Muhar, A. Monitoring Options for Visitor Numbers in National Parks and Natural Areas. J. Nat. Conserv. 2003, 11, 240–250. [Google Scholar] [CrossRef]
  15. Hadwen, W.L.; Hill, W.; Pickering, C.M. Icons under Threat: Why Monitoring Visitors and Their Ecological Impacts in Protected Areas Matters. Ecol. Manag. Restor. 2007, 8, 177–181. [Google Scholar] [CrossRef]
  16. Pickering, C.; Rossi, S.D.; Hernando, A.; Barros, A. Current Knowledge and Future Research Directions for the Monitoring and Management of Visitors in Recreational and Protected Areas. J. Outdoor Recreat. Tour. 2018, 21, 10–18. [Google Scholar] [CrossRef]
  17. Bielański, M.; Taczanowska, K.; Muhar, A.; Adamski, P.; González, L.-M.; Witkowski, Z. Application of GPS Tracking for Monitoring Spatially Unconstrained Outdoor Recreational Activities in Protected Areas—A Case Study of Ski Touring in the Tatra National Park, Poland. Appl. Geogr. 2018, 96, 51–65. [Google Scholar] [CrossRef]
  18. Buckley, R. Ecological Indicators of Tourist Impacts in Parks. J. Ecotourism 2003, 2, 54–66. [Google Scholar] [CrossRef] [Green Version]
  19. Hennig, S.; Künzl, M. Einblicke in Das Monitoring Zur Erholungsnutzung Im Nationalpark Berchtesgaden. Besuch. Okon. Eff. Natl. Nat. 2007, 1, 50–59. [Google Scholar]
  20. Levin, N.; Lechner, A.M.; Brown, G. An Evaluation of Crowdsourced Information for Assessing the Visitation and Perceived Importance of Protected Areas. Appl. Geogr. 2017, 79, 115–126. [Google Scholar] [CrossRef]
  21. Heikinheimo, V.; Minin, E.D.; Tenkanen, H.; Hausmann, A.; Erkkonen, J.; Toivonen, T. User-Generated Geographic Information for Visitor Monitoring in a National Park: A Comparison of Social Media Data and Visitor Survey. ISPRS Int. J. Geo-Inf. 2017, 6, 85. [Google Scholar] [CrossRef] [Green Version]
  22. Korpilo, S.; Virtanen, T.; Lehvävirta, S. Smartphone GPS Tracking—Inexpensive and Efficient Data Collection on Recreational Movement. Landsc. Urban Plan. 2017, 157, 608–617. [Google Scholar] [CrossRef] [Green Version]
  23. Wood, S.A.; Guerry, A.D.; Silver, J.M.; Lacayo, M. Using Social Media to Quantify Nature-Based Tourism and Recreation. Sci. Rep. 2013, 3, 2976. [Google Scholar] [CrossRef] [Green Version]
  24. Levin, N.; Kark, S.; Crandall, D. Where Have All the People Gone? Enhancing Global Conservation Using Night Lights and Social Media. Ecol. Appl. 2015, 25, 2153–2167. [Google Scholar] [CrossRef] [Green Version]
  25. Richards, D.R.; Friess, D.A. A Rapid Indicator of Cultural Ecosystem Service Usage at a Fine Spatial Scale: Content Analysis of Social Media Photographs. Ecol. Indic. 2015, 53, 187–195. [Google Scholar] [CrossRef]
  26. Sessions, C.; Wood, S.A.; Rabotyagov, S.; Fisher, D.M. Measuring Recreational Visitation at U.S. National Parks with Crowd-Sourced Photographs. J. Environ. Manage. 2016, 183, 703–711. [Google Scholar] [CrossRef]
  27. Walden-Schreiner, C.; Rossi, S.D.; Barros, A.; Pickering, C.; Leung, Y.-F. Using Crowd-Sourced Photos to Assess Seasonal Patterns of Visitor Use in Mountain-Protected Areas. Ambio 2018, 47, 781–793. [Google Scholar] [CrossRef]
  28. Horst, L.; Taczanowska, K.; Porst, F.; Arnberger, A. Evaluation of GNSS-Based Volunteered Geographic Information for Assessing Visitor Spatial Distribution within Protected Areas: A Case Study of the Bavarian Forest National Park, Germany. Appl. Geogr. 2023, 150, 102825. [Google Scholar] [CrossRef]
  29. Nematollahi, S.; Afghari, S.; Kienast, F.; Fakheran, S. Spatial Prioritization for Ecotourism through Applying the Landscape Resilience Model. Land 2022, 11, 1682. [Google Scholar] [CrossRef]
  30. Li, Y.; Yang, L.; Shen, H.; Wu, Z. Modeling Intra-Destination Travel Behavior of Tourists through Spatio-Temporal Analysis. J. Destin. Mark. Manag. 2019, 11, 260–269. [Google Scholar] [CrossRef]
  31. Guan, C.; Song, J.; Keith, M.; Zhang, B.; Akiyama, Y.; Da, L.; Shibasaki, R.; Sato, T. Seasonal Variations of Park Visitor Volume and Park Service Area in Tokyo: A Mixed-Method Approach Combining Big Data and Field Observations. Urban For. Urban Green. 2021, 58, 126973. [Google Scholar] [CrossRef]
  32. Sergiacomi, C.; Vuletić, D.; Paletto, A.; Fagarazzi, C. Exploring Tourist Preferences on the Visitor Management System: The Case Study of Plitvice Lakes National Park. South-East Eur. For. 2022, 13, 67–77. [Google Scholar] [CrossRef]
  33. Kovačević, T. (Ed.) Plitvice Lakes National Park Management Plan 2019–2028; Plitvice Lakes National Park Public Institution: Plitvička Jezera, Croatia, 2019. [Google Scholar]
  34. Ministry of Economy and Sustainable Development of the Republic of Croatia. Guidelines for Planning the Management of Protected Areas and/or Ecological Network Areas. Available online: https://www.haop.hr/hr/tematska-podrucja/zasticena-podrucja/upravljanje-zasticenim-podrucjima/smjernice (accessed on 14 December 2022).
  35. Ballantyne, M.; Pickering, C.M. The Impacts of Trail Infrastructure on Vegetation and Soils: Current Literature and Future Directions. J. Environ. Manage. 2015, 164, 53–64. [Google Scholar] [CrossRef] [Green Version]
  36. Barros, A.; Marina Pickering, C. How Networks of Informal Trails Cause Landscape Level Damage to Vegetation. Environ. Manage. 2017, 60, 57–68. [Google Scholar] [CrossRef]
  37. Pickering, C.M.; Growcock, A.J. Impacts of Experimental Trampling on Tall Alpine Herbfields and Subalpine Grasslands in the Australian Alps. J. Environ. Manage. 2009, 91, 532–540. [Google Scholar] [CrossRef]
  38. Barros, A.; Gonnet, J.; Pickering, C. Impacts of Informal Trails on Vegetation and Soils in the Highest Protected Area in the Southern Hemisphere. J. Environ. Manage. 2013, 127, 50–60. [Google Scholar] [CrossRef]
  39. Kim, Y.; Kim, C.; Lee, D.K.; Lee, H.; Andrada, R.I.T. Quantifying Nature-Based Tourism in Protected Areas in Developing Countries by Using Social Big Data. Tour. Manag. 2019, 72, 249–256. [Google Scholar] [CrossRef]
  40. Alegre, J.; Mateo, S.; Pou, L. A Latent Class Approach to Tourists’ Length of Stay. Tour. Manag. 2011, 32, 555–563. [Google Scholar] [CrossRef]
  41. Peter Wathern Environmental Impact Assessment: Theory and Practice. Available online: https://www.routledge.com/Environmental-Impact-Assessment-Theory-and-Practice/Wathern/p/book/9780415078849 (accessed on 14 December 2022).
  42. Kim, J.; Thapa, B.; Jang, S.; Yang, E. Seasonal Spatial Activity Patterns of Visitors with a Mobile Exercise Application at Seoraksan National Park, South Korea. Sustainability 2018, 10, 2263. [Google Scholar] [CrossRef] [Green Version]
  43. Reif, U. Constantly Adapting—Approaches for Effective Visitor Monitoring and Adaptive Visitor Guiding in the Black Forest National Park; Routledge: London, UK, 2019; pp. 93–103. ISBN 978-0-429-19798-7. [Google Scholar]
  44. Leung, Y.-F.; Spenceley, A.; Hvenegaard, G.; Buckley, R. (Eds.) Tourism and Visitor Management in Protected Areas: Guidelines for Sustainability, 1st ed.; IUCN, International Union for Conservation of Nature: Gland, Switzerland, 2018; ISBN 978-2-8317-1898-9. [Google Scholar]
  45. RAPPAM: Rapid Assessment and Prioritisation of Protected Area Management Tool. Available online: https://www.conservationgateway.org/ExternalLinks/Pages/rappam-rapid-assessment-a.aspx (accessed on 12 December 2022).
  46. Pietilä, M.; Fagerholm, N. A Management Perspective to Using Public Participation GIS in Planning for Visitor Use in National Parks. J. Environ. Plan. Manag. 2019, 62, 1133–1148. [Google Scholar] [CrossRef]
  47. Geneletti, D.; van Duren, I. Protected Area Zoning for Conservation and Use: A Combination of Spatial Multicriteria and Multiobjective Evaluation. Landsc. Urban Plan. 2008, 85, 97–110. [Google Scholar] [CrossRef]
  48. Phua, M.-H.; Minowa, M. A GIS-Based Multi-Criteria Decision Making Approach to Forest Conservation Planning at a Landscape Scale: A Case Study in the Kinabalu Area, Sabah, Malaysia. Landsc. Urban Plan. 2005, 71, 207–222. [Google Scholar] [CrossRef]
  49. Zhang, Z.; Sherman, R.; Yang, Z.; Wu, R.; Wang, W.; Yin, M.; Yang, G.; Ou, X. Integrating a Participatory Process with a GIS-Based Multi-Criteria Decision Analysis for Protected Area Zoning in China. J. Nat. Conserv. 2013, 21, 225–240. [Google Scholar] [CrossRef]
  50. Korpilo, S.; Virtanen, T.; Saukkonen, T.; Lehvävirta, S. More than A to B: Understanding and Managing Visitor Spatial Behaviour in Urban Forests Using Public Participation GIS. J. Environ. Manage. 2018, 207, 124–133. [Google Scholar] [CrossRef] [Green Version]
  51. Brown, G.; Weber, D. Public Participation GIS: A New Method for National Park Planning. Landsc. Urban Plan. 2011, 102, 1–15. [Google Scholar] [CrossRef]
  52. Schägner, J.P.; Brander, L.; Maes, J.; Paracchini, M.L.; Hartje, V. Mapping Recreational Visits and Values of European National Parks by Combining Statistical Modelling and Unit Value Transfer. J. Nat. Conserv. 2016, 31, 71–84. [Google Scholar] [CrossRef]
  53. Abang Abdurahman, A.Z.; Wan Yaacob, W.F.; Md Nasir, S.A.; Jaya, S.; Mokhtar, S. Using Machine Learning to Predict Visitors to Totally Protected Areas in Sarawak, Malaysia. Sustainability 2022, 14, 2735. [Google Scholar] [CrossRef]
Figure 1. Location of the study area within Croatia (A) with an enlarged view of Plitvice Lakes national park (B).
Sustainability 15 01625 g001
Figure 2. Management zones of the Plitvice Lakes National Park.
Sustainability 15 01625 g002
Figure 3. Schematic representation of the track and the key parameters that determine its “throughput”, i.e., receiving capacity.
Sustainability 15 01625 g003
Figure 4. Workflow of the proposed method for environmental susceptibility zoning.
Sustainability 15 01625 g004
Figure 5. Visitors count by time frames for year 2017 per day.
Sustainability 15 01625 g005
Figure 6. Visitors count by time frames per month and year.
Sustainability 15 01625 g006
Figure 7. Linear regression fitting accuracy in 10-year period (blue) and short-term prediction results (light blue) per iteration.
Sustainability 15 01625 g007
Figure 8. Weighted visitors count zones according to route density and visitors count per entrance.
Sustainability 15 01625 g008
Figure 9. Weighted monthly environmental susceptibility zones at the Plitvice Lakes National Park.
Sustainability 15 01625 g009
Table 1. Management zones and subzones of Plitvice Lakes National Park [33].
Management ZoneManagement SubzoneArea (ha)Total Area
Percentage (%)
AbbreviationDescription
Zone I
(strictly restricted zone)
IANo visits3986.913.4
IBWith limited attendance19,934.867.3
Zone II
(moderately restricted zone)
IIAWater ecosystems278.30.9
IIBLawns and sedges4384.514.8
IICCultural landscape405.01.4
Zone III
(zone of use)
IIIASettlement areas375.61.3
IIIBTraffic roads115.30.4
IIICBuilt-up areas with visitor services79.30.3
IIIDTracks, roads and docks71.10.2
Table 2. Accuracy assessment of the short-term visitors count prediction.
Iteration NumberTraining Data IntervalPrediction IntervalR2RMSENRMSEMAE
Iteration 11996–20052006–20090.700118,2420.128104,092
Iteration 21999–20082009–20120.946151,3580.146149,592
Iteration 32002–20112012–20150.71079,4710.06563,738
Iteration 42005–20142015–20180.951330,2390.208289,803
Disclaimer/Publisher’s Note: The statements, opinions and data contained in all publications are solely those of the individual author(s) and contributor(s) and not of MDPI and/or the editor(s). MDPI and/or the editor(s) disclaim responsibility for any injury to people or property resulting from any ideas, methods, instructions or products referred to in the content.

