Abstract
In the era of tourism 4.0, the subjective preferences and experiences of tourists directly affects the future development of scenic spots. Among them, 5A scenic spots represent China’s world-class boutique tourist scenic ranking, which pays more attention to humanization and detailing, and better reflect tourists’ general psychological demand for tourist attractions. Therefore, it becomes an important scientific issue to explore the spatial and temporal characteristics of 5A tourists’ preferences and their deeper reasons. China’s eastern coastal provinces have played a very important role in promoting regional tourism culture, promoting regional economic development, and building a strong coastal province. Taking Jiangsu as an example, this study introduces the standard deviation ellipse and kernel density estimation to explore the characteristics and trends of tourist preference clustering in 5A scenic spots and their internal and external driving mechanisms from 2012–2021, which is based on a new perspective of geotemporal dynamic analysis. The empirical results show that: (1) the network attention of 5A scenic spots in Jiangsu generally showed a “barb-type” trend in 2012–2021, the highest network attention is concentrated in April and October, accounting for 82%, and tourists pay the most attention to cultural relics scenic spots, peaking on Sunday; (2) the tourist preference for 5A scenic spots in Jiangsu shows a relative clustering distribution pattern in general, with a slightly higher clustering trend in the northwest-southeast direction than in the northeast-southwest direction. Furthermore, the nucleus of the density values range from 0 to 115.43, showing the spatial pattern of “one belt and two cores”; (3) the internal driving factors include the types, the culture nature, the characteristics nature, the spatial proximity, and the infrastructure of scenic spots, and the external driving factors include geographical location, industrial development policy, climate comfort, economic development level, traffic accessibility, and the impact of COVID-19 epidemic. On this basis, this study puts forward feasible suggestions for improving scenic area management and increasing the reception capacity, so as to provide fine scientific guidelines for the high-quality development of 5A scenic spots in Jiangsu and provide reference for further enhancing the attractiveness of 5A scenic spots and their synergistic development in the eastern coastal provinces.
1. Introduction
As the focus of international tourism development shifts eastward, China’s position in the international tourism industry continues to rise [1]. At present, Chinese tourism has entered a new era of 4.0, which is supported by the Internet, big data, intelligence, and other modern science and technology, and based on the concept of consumer-driven, with the large tourism industry as the core, it can achieve cross-border integration, and jointly create a mutually beneficial and win–win ecosystem through the online and offline platform operations of upstream and downstream stakeholders of the tourism supply chain. On the one hand, tourism is an effective means to develop the economy, increase employment, and meet the people’s growing need for a better life and improve their living standards; on the other hand, tourism is a sensitive and fragile industry whose development is highly vulnerable to external environmental factors [2,3]. Since January 2020, the outbreak of the COVID-19 epidemic has had a significant negative impact on the development of global tourism, causing a 40.8% year-over-year decline in global tourism arrivals and a 50.9% year-over-year decline in total global tourism revenue. In this context, the new generation of tourism consumption presents the development trends of quality-oriented, experience-oriented, and theme-oriented, and there are regional differences in tourists’ behavioral preferences [4]. Therefore, only by deeply understanding the spatio-temporal behavior characteristics of tourists can we explore the reasons behind their behavior and help promote a healthier, greener, and higher-quality tourism industry. The behavior of tourists in the era of big data shows the trend of intelligence and personalization, so it is important to explore their spatio-temporal behavior by using network data to learn their preferences and improve the attractiveness of scenic spots.
The behavior of tourists has been a frontier issue in tourism geography research. Firstly, based on the spatial trajectory and spatial behavior patterns of tourists, researchers often use mathematical methods to model or use multiple intelligences to simulate and predict the spatio-temporal behavior of tourists, and ultimately to realize location-based services and recommendations [5]. Some scholars believe that using Maldivian chains to analyze the spatial behavior of tourists at a microscopic scale is very effective and more helpful for scenic spot management. Some scholars have also constructed a simulation model of Chinese inbound tourists using multiple intelligences and simulated future scenarios [6]. Secondly, the traditional spatio-temporal behavior of tourists focuses more on the mobility of tourists [7], and there is insufficient research on the changes of emotional experiences during the mobility of tourists. Some scholars have used big data to explore the impact of a destination’s air quality and climate comfort on visitor sentiment. Finally, tourism information search behavior has a very important role in tourism decision. The research on tourist identification through tourists’ information search behavior mainly focuses on identifying the information resources frequently used by travelers at different stages of the information decision-making process. Based on the location and semantic information of user check-in, we discover the behavior pattern of travelers by data mining, calculate and cognize the similarity between user check-in behaviors, and provide the basis and algorithm for more accurate user recommendation [8]. Therefore, under the trend of humanistic thinking, travelers are increasingly concerned about the travel experience, focusing on the use of social media data to enhance the study of travelers’ spatio-temporal experience.
The eastern coastal provinces in China have extensive tourism resources, which play a very important role in driving regional tourism culture, pulling regional economic development, and building a strong coastal society. Among them, Jiangsu is located in the middle of China’s eastern coastal region, is an important part of the Yangtze River Delta, and is a collection of science, sightseeing, leisure, and ecology in one of the city-type scenic spots. As a long-standing outing destination, tourist attractions can be open to the public and meet the needs of tourists for food, accommodation, transportation, entertainment, shopping, and travel, the grades of which are determined based on the Classification and Evaluation of Quality Grade of Tourist Attractions. Among them, 5A scenic spots are required to receive more than 600,000 tourists from at home and abroad every year, and the satisfaction rate of tourist sampling survey is very high. In addition, it must meet the standard requirements in the aspects of tourism traffic, tourism, safety, health, post and telecommunications services, shopping, management, resources and environmental protection, resource attractiveness, and market attractiveness. The highest grade of Chinese tourist attractions is 5A, which has a high quality and popularity, representing the level of China’s world-class boutique tourist scenic spots, with more emphasis on humanization and detailing, better reflecting the general psychological needs of tourists for tourist attractions, highlighting tourist-centeredness, and emphasizing people-centeredness. On this background, the types of tourist preferences and clustering characteristics of tourists for eastern coastal cities have become scientific issues that need to be urgently studied. Therefore, the goal of this paper is to study the clustering characteristics of tourist preference and the influence mechanisms of 5A scenic spots and better analyze the development trends of tourist demand and the reasons behind them, in the hope of realizing the synergistic development of tourism economy by improving the tourist preference level of different types of 5A scenic spots.
2. Literature Review
The Internet has become the main channel for people to obtain information, and Google is the world’s largest Internet search engine, which is widely used in the social field because Google Trends can analyze the attention and causality between multiple individuals based on information. Some scholars used Google Trends to predict economic situations, for example, to determine the possibility and trend of regional influenza based on words related to colds that the general public enters into Google Searches [9]; some scholars have also used it to analyze consumer behavioral preferences and found that there was a strong correlation between the amount of tourism information and the amount of tourists, and have concluded that the public tended to rely on tourism website information to make travel decisions [10]. A few scholars found that tourism developers and travel agencies can promote tourist purchases through destination information on tourism websites to better serve tourists, while good travel experiences posted on websites can influence or change other tourists’ impression and satisfaction with the destination to some extent [11].
Compared with foreign countries, most domestic scholars use the Baidu Index for the statistical analysis of related data. The research content of tourism network attention mainly includes the study of the temporal-spatial distribution characteristics of network attention and its influencing factors, the study of the correlation between network attention and real passenger flow, and the study of the interrelationship between network attention and other elements. First of all, the spatio-temporal distribution characteristics of network attention and its influencing factors have been research hotspots in academia. Some scholars studied the characteristics of the network attention distribution of scenic spots in different time periods, and found that seasonal changes, leisure time, and tourist destination popularity were the key factors affecting the network attention of urban tourism, and the elements of food, accommodation, and tourism were focused by people, while the elements of purchase and entertainment were often ignored [12]; other scholars have found that the spatial distribution of online attention is mainly influenced by factors such as population base, education level, Internet penetration, and spatial distance, and these research results can guide realistic tourism scenic spots and tourism enterprises to target their management and improve tourism development [13]. Secondly, when tourists make travel decisions, they will search for information related to tourist destinations through the Internet, so the related scholars found that the Internet information flow has a guiding effect on the real flow of people through correlation analysis, comparative analysis, and coupling analysis of the number of website visits and the real flow of people, and also found that the change of tourism demand and the traffic location conditions of scenic spots are important factors affecting the coupling degree [14]. Finally, the research on the interrelationship between online attention and other elements is not yet systematic, and a few scholars have explored regional differences in tourism online attention, its spatio-temporal variation characteristics, and the relationship with gastronomy and climate comfort [15].
In the 1970s and 1980s, the majority of developed western countries experienced stagnant development of traditional economies and rising unemployment. Tourism has rapidly become the leading industry because of its industrial characteristics and its ability to meet the growing needs of consumers. Therefore, urban tourism, especially tourism preference has gradually become the focus of scholars’ research. On the one hand, the foreign research on tourism preference starts early and has rich achievements, which involves not only the relationship between tourism preference and demand, tourism preference and gender, tourists’ preference, tourism destination, reception facilities preference, special group preference, and so on, but also related knowledge in the field of tourism, such as the career selection of tourism students and the job preference of tourism agencies [16,17]. On the other hand, the preferences of tourists or residents for tourism, leisure, and recreation, and hospitality facilities are systematically analyzed through various quantitative models [18,19,20], and research methods include discrete choice models, multidimensional measurement methods, ranked preference techniques that approximate ideal solutions, and decision tree methods. Among them, the discrete choice model can make empirical statistical analysis on the preferences and choice behaviors of individuals and families, and it can also be designed to evaluate consumers’ preferences and purchase intentions for products by simulating their choices when faced with a real market [21,22], which is easy to estimate and the results are relatively accurate and reliable, and more widely used, thus the research based on multi-empirical analysis has a strong practical theoretical guidance and practical value.
The definition of tourism preference in domestic academic circles is mostly explained from the perspective of psychology, the thinking that tourism preference is the tourism choice tendencies of consumers in tourism elements, tourism expectations, and tourism processes at the subconscious level according to their own preferences, and involves certain subjective emotional components and the psychological tendencies of tourists which are accumulated in one or more activities. Tourism preference determines tourism demand, and the emergence of tourism demand makes tourists begin to collect tourism information, which then triggers tourism motivation to complete tourists’ tourism behavior and, after the end of the tourism behavior, to evaluate this activity to provide some preference reference for the next tourism behavior [23,24]. However, most of the literature on tourism preference from the perspective of economics uses histograms or pie charts to analyze and solve problems after a questionnaire survey, and the application value of the research results is relatively limited. With the in-depth development of tourism and the improvement of the competitiveness of regional tourism products, the related studies on different tourism types have been gradually enriched, including urban tourism, rest and leisure, international tourism, rural tourism, eco-tourism, special group tourism, heritage tourism, and coastal tourism [25,26,27]. The research focuses on the choice of tourism destinations by specific groups, the analysis of differences in rural tourism preferences, the exploration of the influencing factors of tourism preference and countermeasures, and suggestions to promote the optimization and upgrading of tourism products.
In summary, from the perspective of a research starting point, the research on tourism preference at home and abroad is based on multi-angle and multi-direction methods, involving psychology, economics, anthropology, and other angles, which greatly enriches the coverage of tourism preference research. From the perspective of research methods, it works from the initial theoretical or qualitative research, gradually transitioning to quantitative empirical research, and then introducing a series of mathematical statistical methods including the structural equation model to enhance the credibility of the research. From the perspective of the research purpose, tourism preference is the wind vane of the development of the tourism market, and accurately grasping tourism preferences is the focus of adjusting tourism demand, tourism products, and even tourism markets. Therefore, the ultimate purpose of research on tourism preferences and other related hot issues is the adaptation of practical issues such as the upgrading of tourism product structures and the focus of tourism marketing, which provides a reference basis for tourism development. However, from the perspective of geographical time and space, there is a lack of research on the characteristics and influence mechanism of tourists’ preference agglomeration about 5A scenic spots in eastern coastal provinces.
Therefore, taking Jiangsu as the research object, this paper introduces the standard deviation ellipse and kernel density estimation from a new perspective of geospatial and temporal dynamics analysis to explore more deeply and accurately the clustering characteristics and trends of tourist preferences for 5A scenic spots, and, on this basis, uses limited attention theory and tourist behavior theory to systematically analyze the internal and external driving factors affecting tourist preferences, so as to provide fine scientific guidelines for the high-quality development of 5A scenic spots in Jiangsu and provide reference for further enhancing the attractiveness of different scenic spots and their synergistic development of the eastern coastal areas.
3. Materials and Methods
3.1. Study Area
Jiangsu is located in the eastern coastal areas of China, bordering with Shanghai, Zhejiang, Anhui, and Shandong. The province is densely populated, relatively economically developed with many lakes and rich tourism resources, and has the largest number of 5A scenic spots in China. This study takes “Jiangsu tourism” as the keyword and uses the “crowd portrait” function of Baidu index platform to obtain the strong and weak demand for Jiangsu tourism information of the scenic spot source market. As can be seen from Figure 1, the source market of 5A scenic spots in Jiangsu is relatively concentrated, and most tourists come from Jiangsu, Shanghai, Zhejiang, Guangdong, and Shandong. However, affected by the epidemic, tourists in the province have the strongest demand for tourism information in Jiangsu, which ranks first.
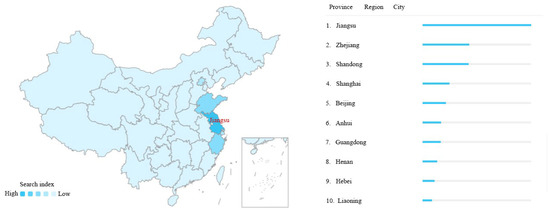
Figure 1.
Map of tourists’ concerns about scenic spots in Jiangsu from all provinces and cities.
3.2. Methods
3.2.1. The Seasonal Intensity Index
The seasonal change of the climate leads to the seasonality of the tourist source market. In this study, the seasonal intensity index is used to systematically analyze the centralized distribution characteristics and time change law of tourist preferences in 5A scenic spots of Jiangsu province. The calculation formula is as follows:
where R represents the seasonal intensity index of tourism, and Xi is the proportion of monthly tourist preference of the scenic spot in the whole year. The larger R is, the greater the distribution difference of tourists’ preference in each month of the year is, and the more obvious the seasonality is.
3.2.2. The Standard Deviation Ellipse
The method of the standard deviation ellipse, first proposed by Welty, could measure the direction and distribution of a set of data. This paper used the standard deviation ellipse to explore the spatial distribution pattern of tourist preference and the evolution characteristics of 5A scenic spots in eastern coastal provinces from 2012 to 2021. Its parameters mainly include the barycentric coordinates, area, and the standard deviation along major axis and short axis, etc. The barycentric coordinates represent the relative position of the spatial distribution of tourists’ preferences, the area is the extensibility of its spatial distribution, the length of the major axis and minor axis represents the degree of dispersion in the primary and secondary trend direction, and the azimuth reflects the main trend direction of its distribution [28].
3.2.3. The Kernel Density Estimation
The kernel density analysis method can reflect the influence intensity of the elements on the surrounding things, form a continuous density surface according to the known sample points, and study the agglomeration of the samples in the region [29]. In this study, the kernel density estimation was used to analyze the spatial agglomeration characteristics of tourists’ preference for 5A scenic spots in eastern coastal areas, and to understand the specific distribution location. The specific expression formula is as follows:
where f(x) is the estimated value of kernel density, h is the search radius (h > 0), n is the total number of 5A scenic spots in Jiangsu, k(x) is the kernel function, and (x − Xi) represents the distance from the estimated point x to Xi. Among them, the larger the value of f(x), the more intensive the network attention of the tourist attractions and the greater the influence on the surrounding neighborhoods.
3.2.4. The Travel Preference Index
Tourism preference refers to the psychological tendency that people tend towards a certain tourism goal. There are many methods to study and analyze tourism preferences index at home and abroad. This study mainly draws lessons from the method of Sun Gennian’s spatio-temporal tourism index preference, which can directly reflect the degree of tourists’ preferences for a scenic spot [30]. The formula is as follows:
where Xi is the network attention of the i scenic spot; n is the number of 5A scenic spots; Pi is the total value of tourism preference of the scenic spots which is between 0 and 1, and the higher the value, the stronger the preference for a scenic spot.
3.2.5. The Limited Attention and Tourist Behavior Theory
The limited attention theory means that tourists will have a huge amount of scenic spot information when they search for tourism information, which may cause the problem of information overload as they cannot get information on all scenic spots at the same time. Therefore, potential tourists will only focus their attention on the interesting scenic spots in a limited time, which will cause the difference of network attention of different scenic spots [31]. The research contents of tourist behavior theory mainly include tourism motivation, tourism decision-making, tourism preferences, and so on. The purpose of this research is to discern how to mobilize tourists’ positive behavior, to fully tap into and make full use of tourism resources, and to make tourists’ behavior achieve the best effect [32].
3.3. Data Source and Processing
According to the statistics of A-grade scenic spots released by the website of Jiangsu Provincial Department of Culture and Tourism: http://wlt.jiangsu.gov.cn/col/col73719/index.html, accessed on 25 February 2022, there are 600 A-grade scenic spots of Jiangsu Province, including 25 5A-grade scenic spots, 208 4A-grade scenic spots, 265 3A-grade scenic spots, and 102 2A-grade scenic spots. Among them, 5A is the highest level of China’s tourist attractions, representing the grade of China’s world-class boutique tourist scenic spots, with more emphasis on humanization and detailing, better reflecting the general psychological needs of tourists for scenic spots, highlighting tourist-centeredness, and emphasizing people-orientedness. Therefore, this study chose 5A scenic spots of Jiangsu as the research object, used Python tools to collect the daily average search volume index of 5A tourist attractions from 1 January 2012 to 31 December 2021 (Table 1), obtained their latitude and longitude coordinates using GoogleEarth, and used ArcGIS10.7 to generate the vector data of 5A scenic spots, which was from the National Basic Geographic Information 1:4 million database.

Table 1.
The list of 5A scenic spots and its search keywords in Jiangsu.
4. Empirical Results and Analysis
4.1. The Spatio-Temporal Evolution Characteristics
4.1.1. Analysis of Tourism Preference Based on Time Series
Firstly, from the perspective of the interannual changes in tourists’ preferences, the network attention of 5A scenic spots in Jiangsu generally showed a “barb-type” trend in 2012–2021, which existed at a difference of about 4.4 million times between the maximum and minimum years (Figure 2). With the “Internet + Tourism” plan implemented by the National Tourism Administration, the management of each scenic spot has paid more attention to using the Internet to promote the spot to increase its popularity. In addition, with the continuous improvement of national living standards, people paid more attention to the pursuit of the spiritual level. Therefore, the total value of network attention from 2012 to 2016 was increasing year by year and reached the maximum peak value in 2016. With the emergence of various online travel APP, Douyin and other short video software, coupled with the fact that domestic tourists mostly concentrated on traveling during long holidays, the carrying capacity of scenic spots during the peak season was insufficient, with a poorer experience for tourists and a lower willingness of residents to travel. As a result, internet attention showed a continuous decline from 2016 to 2019. Due to the impact of COVID-19’s epidemic situation, network attention dropped precipitously to 32.18% in 2020, and, as the epidemic situation of COVID-19 was gradually brought under control, the network attention of scenic spots rebounded slightly by 3.08% in 2021.
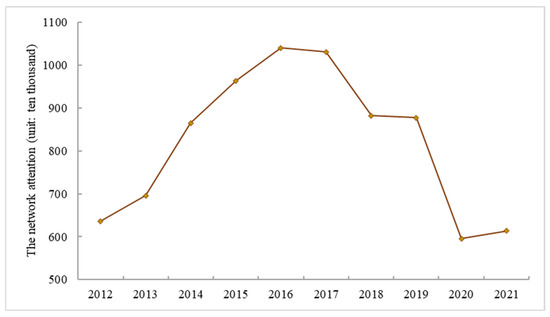
Figure 2.
The annual change of network attention to 5A scenic spots from 2012 to 2021.
Secondly, from the perspective of the seasonal changes in tourists’ preference, the scenic spots are divided into three grades based on the seasonal intensity index (Table 2), among which the strongest seasonal types include Yuantouzhu, Dinosaur Garden, Qinhu National Wetland Park, Hongze Lake Wetland Park, and Thin West Lake, and the seasonal intensity index of these scenic spots is greater than two. The seasonal intensity index of 16 scenic spots, such as Tianmu Lake and Jinjihu, etc., is between one and two, and seasonal variation is relatively weak, which belongs to the weak seasonal type. The seasonal intensity index of four scenic spots, namely Chinese Elk Park Scenic Spot, Shajiabang, Zhenjiang Sanshan, and Jurong Maoshan, is less than one, which is the weakest seasonal type. However, the peak months of network attention in different scenic spots are different, showing a certain regularity. The highest network attention in most scenic spots is concentrated in April and October, accounting for 82%, while the lowest months are mainly concentrated in January and December, accounting for 45% and 32%, respectively. Among them, Shajiabang, Suzhou Gardens, and Zhou Enlai Memorial Hall have the lowest online attention in February.
Table 2.
The highest and lowest months of seasonal index and network attention to 5A scenic spots in Jiangsu.
Thirdly, from the perspective of the monthly and weekly changes in tourists’ preferences, the monthly average concern of cultural heritage scenic spots such as Fuzimiao, Zhongshanling, Suzhou Garden, and Lingshan is the highest, and the overall fluctuation is the largest. The concern values of leisure resort scenic spots and ancient village and town scenic spots are roughly similar and slightly lower than those of cultural heritage scenic spots, while that of red tourism scenic spots is relatively low and the overall fluctuation is relatively smooth. Overall, the average monthly attention of tourists to the four types of scenic spots shows a trend of “three times up and three times down”, with a large increase from January to April, reaching a peak value in April, then a decline in attention from April to June, a slight rebound from June to August, a trough in September, another peak in October, and a gradual decline from November to December (Figure 3). In addition, the weekly online attention of the four types of scenic spots is proportional to the monthly period, which fluctuates little, on the whole. Tourists pay the most attention to the scenic spots that belonged to the cultural relics type, peaking on Sunday, while paying the least attention to the scenic spots belonged to the red tourism types.
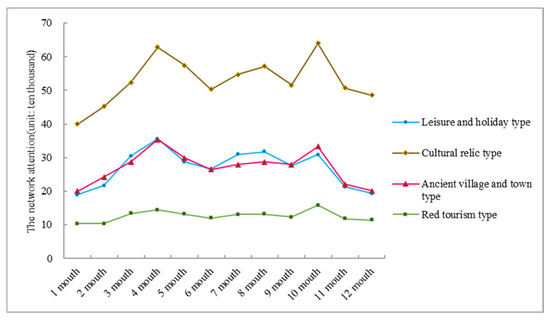
Figure 3.
The monthly changes of different types of 5A scenic spots in Jiangsu.
4.1.2. Analysis of Tourism Preference Based on Geographic Space
In order to clarify the spatial distribution and dynamic changes of tourists’ preferences for 5A scenic spots of coastal provinces, this study collected the average daily search index through the Baidu Index Platform to obtain data on the online attention of 5A scenic spots in Jiangsu from 2012 to 2021. At the same time, with the help of Google Earth to obtain the latitude and longitude coordinates of each scenic spot, ArcGIS10.7 software was used to analyze the standard deviation ellipse of network attention from 2012–2021 and to calculate the average center of gravity. As can be seen from Figure 4, the overall center of gravity of network attention in 2021 is distributed in the south of Jiangsu, and compared with 2012, the center of gravity of network attention shifts significantly to the southeast. By comparing the long and short axes of the standard deviation ellipse from 2012 to 2021, we found that both the short and long axes have changed to a certain extent, and the long axis is generally in the “northwest-southeast” direction, and the influence range expands significantly to the southeast. From this, it can be seen that tourist preferences for 5A scenic spots in Jiangsu show a relative clustering distribution pattern in general, with a slightly higher clustering trend in the northwest-southeast direction than in the northeast-southwest direction.
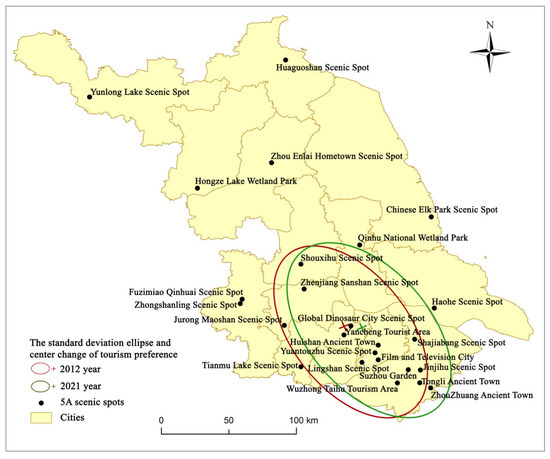
Figure 4.
The standard deviation ellipse and center of gravity evolution of tourism preference distribution in 5A scenic spots.
In order to deeply analyze the spatial agglomeration characteristics of tourist preference in Jiangsu, this study uses the spatial analysis module to analyze the kernel density of tourist preference for 5A scenic spots from 2012 to 2021, clarifying the impact of each scenic spot on the neighboring areas. Figure 5 shows that the nucleus density values range from 0 to 115.43, showing the spatial pattern of “one belt and two cores”. Among them, the high-concern zone is located in the Suzhou–Wuxi–Changzhou area, which mainly expands to the east and south in space, with tourist attractions including Dinosaur Park, Drowning City, Lingshan, Yuantouzhu, Jinjihu, Suzhou Garden, Ancient Towns of Huishan, Tongli, and Zhouzhuang, etc. The two core areas of high attention include Suzhou Garden–Jinjihu–Tongli Ancient Town, and Zhongshanling–Fuzimiao, which have developed transportation, deep cultural heritage, rich scenic spots, and high added value. Therefore, regional attention is relatively high, showing a centralized distribution, and can be linked with the surrounding development to the release matrix effect.
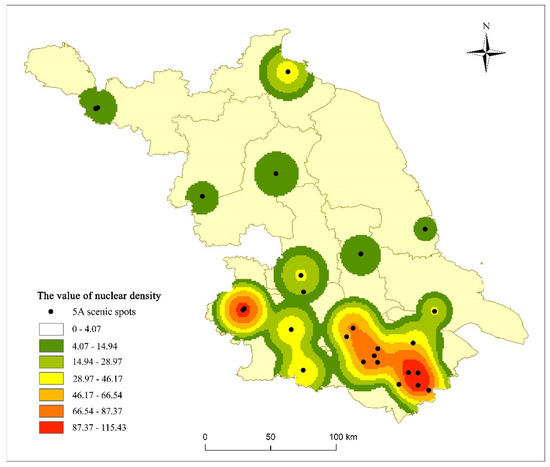
Figure 5.
The analysis of the nuclear density of tourist preference for 5A scenic spots.
To be able to more intuitively reflect the degree of tourists’ preferences for 5A scenic spots in Jiangsu, this study calculates the tourism preference coefficients based on the network attention of each scenic spot and divides them into three levels including strong tourism preference (P ≥ 8%), general tourism preference (2% < P < 8%), and weak tourism preference (P ≤ 2%). As can be seen from Table 3, the strong preference tourist attractions include Dinosaur Park in Changzhou, Suzhou Garden, and Zhongshanling, among which Dinosaur Park and Suzhou Garden are more popular in Jiangsu Province, attracting many domestic and foreign adult tourists and parent–child families. There are seven weak preference tourist attractions, namely, Zhou Enlai Hometown, Yunlonghu, Qinghu National Wetland Park, Film and Television City, Yancheng Tourist Area, Hongze Lake Wetland Park, and Sanshan scenic spot, and the remaining 15 scenic spots belong to general preference tourist attractions. Judging from the proportion of the three levels of tourist preference, strong preference, general preference and weak preference for scenic spots account for 13.6%, 54.5%, and 31.8%, respectively, indicating that cultural experience and holiday leisure tourism in coastal provinces have become a high demand for tourists.
Table 3.
The list of tourism preference index of 5A scenic spots in Jiangsu.
4.2. Analysis of Impact Mechanisms
Through the systematic analysis of tourists’ preference, based on limited attention theory and tourist behavior theory analysis, this study concludes that the choice of tourist preference types and their spatial changes of 5A scenic spots in Jiangsu are the result of a combination of internal and external factors. In Figure 5, the inner circle represents the attractiveness of scenic spots affecting tourists’ preferences, forming an internal driving mechanism, and the outer circle represents the influence of external environment affecting tourists’ preferences, forming an external driving mechanism (Figure 6).
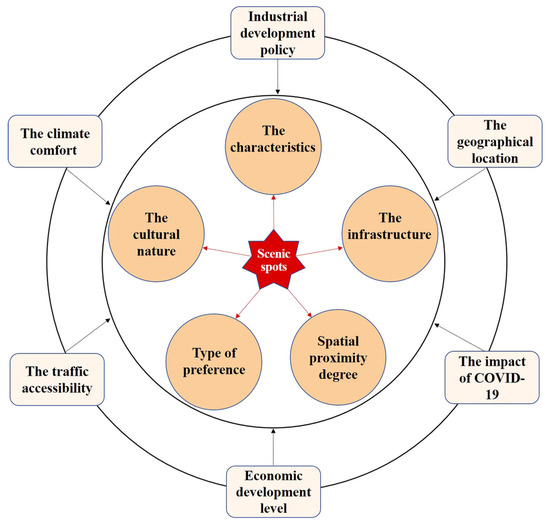
Figure 6.
The internal and external driving mechanism of tourists’ preferences for 5A scenic spots in eastern coastal provinces.
The internal driving factors include the types, the culture nature, the characteristics nature, the spatial proximity, and the infrastructure of scenic spots. Firstly, different types of scenic spots have different attractions for different tourists, and the scenic spots belonging to leisure and holiday types in coastal areas will have stronger attraction for tourists. Secondly, the cultural and characteristic nature of scenic spots determines their popularity, which has a greater influence on the spatial characteristics of tourists’ travel preferences. For example, Global Dinosaur City, Suzhou Garden, Zhongshanling, and other scenic spots in the south of Jiangsu have a large number of visitors, which not only have distinctive local characteristics, but also have strong historical and cultural foundations. Thirdly, the travel of tourists is related to the spatial distance of scenic spots. Influenced by the suburban effect, tourists visiting Jiangsu are mainly concentrated in Suzhou Garden–Jinjihu–Tongli Ancient Town, which are relatively spatially concentrated and attractive, while the spatial distance between 5A scenic spots in northern Jiangsu is large, so the number of visitors in each scenic spot is small.
The external driving factors include geographical location, industrial development policy, climate comfort, economic development level, traffic accessibility, and the impact of COVID-19 epidemic. Jiangsu is located on the eastern coast, with significant geographical location advantages and high climate comfort. It has rich and diverse tourism resources, famous mountains and islands, beach baths, famous gardens and ancient buildings, cultural relics and monuments, prosperous modern cities, and simple local customs. At the same time, this area is highly open to the outside world and has developed transportation, which attracts many tourists from at home and abroad to vacation. Under the impact of COVID-19’s epidemic situation, tourist preferences have changed, and tourists’ demand for consumption grades per unit time has increased significantly, which is mainly reflected in the enhancement of people’s awareness of health, and the content of leisure and entertainment will be more favored. The popularity of eco-tourism, rural tourism, and recreation tourism has also increased, and tourists are more inclined to choose urban tourism with a better coastal ecological environment and a pleasant climate. Finally, based on the policy support for tourism development, Jiangsu promotes the construction of a world-class coastal ecological tourism corridor, and takes the coast as the new growth pole of cultural tourism high-quality development. Specifically, the main focus is to take the excellent ecological background as the backbone, to lead with innovation, enhance the level, optimize the layout, highlight the characteristics as the focus, protect the heritage, promote marine culture, and strive to build the most humanistic charm of the cultural coastal zone and the coastal ecological tourism landscape zone with the world’s influence.
5. Discussion and Concluding Remarks
5.1. Summary of Empirical Findings
This study explores the spatiotemporal evolution of the clustering characteristics of tourist preference for 5A scenic spots by the standard deviation ellipse and kernel density estimation. Furthermore, we systematically analyze the internal and external driving factors affecting tourists’ preferences of Jiangsu, which helps to explore the development trend of tourist demand and the reasons behind it in order to realize the synergistic development of the tourism economy. This study contributes to a better understanding of tourist preference for 5A scenic spots in eastern coastal areas from a new perspective and provides scientific support for promoting the high-quality development of tourism. The main findings are as follows:
In terms of the time series, the network attention of 5A scenic spots in Jiangsu generally showed a “barb-type” trend in 2012–2021, which existed at a difference of about 4.4 million times between the maximum and minimum years. The peak months of network attention in different scenic spots are different. The highest network attention in most scenic spots is concentrated in April and October, accounting for 82%, while the lowest months are mainly concentrated in January and December, accounting for 45% and 32%, respectively; the average monthly attention of tourists to the four types of scenic spots shows a trend of “three times up and three times down”. In terms of the geographical space, tourist preference for 5A scenic spots of Jiangsu shows a relative clustering distribution pattern in general, with a slightly higher clustering trend in the northwest-southeast direction than in the northeast-southwest direction. The nucleus density values of tourist preference for 5A scenic spots range from 0 to 115.43, showing the spatial pattern of “one belt and two cores”. The strong preference tourist attractions include Dinosaur Park in Changzhou, Suzhou Garden, and Zhongshanling, among which Dinosaur Park and Suzhou Garden are more popular in Jiangsu Province, attracting many domestic and foreign adult tourists and parent–child families.
The influencing mechanism of the spatial-temporal patterns of tourist preferences for 5A scenic spots include both internal and external aspects. Among them, the internal driving mechanism include the types, the culture nature, the characteristics nature, the spatial proximity, and the infrastructure of scenic spots and the external driving mechanism include geographical location, industrial development policy, climate comfort, economic development level, traffic accessibility, and the impact of the COVID-19 epidemic. On this basis, this paper proposes countermeasures for the high-quality development of different types of 5A tourism scenic spots in Jiangsu, which include giving full play to the linkage effect of scenic spots, using the seasonal characteristics of scenic spots and thematic activities, implementing product diversification and cross-border integration development strategies, and improving digital service capabilities.
5.2. Implications and Suggestions
From the perspective of theoretical contribution and practical significance, our research can be useful for researchers and managers. On the one hand, at present, most of the scholars have conducted simple spatial and temporal characteristics analyses in terms of tourism objects [12,13,23,24], as well as correlation analyses, comparative analyses, and coupling analyses between the number of website visits and real visitor flow [14,15], and the data obtained are often not available for many aspects of the study due to the time and space limitations of the research. Our research introduces the standard deviation ellipse and kernel density estimation from the dynamic spatio-temporal perspective to explore more deeply and accurately the clustering characteristics and trends of tourist preferences for 5A scenic spots, which can provide a new object, new thinking, and new perspectives for the study of tourism geography. On the other hand, the ultimate goal of the existing research on tourism preference is on practical issues such as the upgrading of tourism product structures and the focus on tourism marketing, but there are few related studies on tourists’ preference for different types of scenic spots and their influence mechanisms [25,26,27]. Our research on the tourist information selection preferences of tourist attractions in coastal areas has very important practical guidance for 5A scenic spots to develop targeted source markets and network marketing and to enhance the linkage effect of scenic spots. The conclusion of this study can also serve as a reference for government departments’ decision-making and help to accelerate the transformation, upgrading, and high-quality development of tourism in coastal areas. Therefore, this study puts forward specific, targeted, and operational countermeasures and suggestions from the following aspects.
Firstly, it is necessary to give full play to the linkage effect of scenic spots to balance the attention of hot and cold scenic spots. The scenic spots of Zhouenlai Hometown and Yunlonghu have less attention, which has seriously caused a waste of resources. The government tourism department should adjust the management strategy appropriately according to the respective characteristics of scenic spots and their functional positioning in tourism, and make use of the stronger linkage effect of hot scenic spots such as Suzhou Garden and Zhongshan Mausoleum, improving the overall balance of Jiangsu’s tourism scenic spots and promoting the overall development of tourism on the basis of maintaining the heat of the original scenic spots. In addition, when tourism marketing is carried out, joint ticket measures should be implemented to let popular scenic spots drive the development of unpopular scenic spots, so as to improve the popularity of unpopular scenic spots and improve the overall popularity of regional tourism.
Secondly, the promotion of theme activities and online marketing in scenic spots should be fully launched about one month before the coming of festivals and holidays, in order to improve the peak value of tourists’ attention to the scenic spots. For example, Dinosaur Park in Changzhou belonged to the leisure and vacation type that can launch daytime and nighttime tour programs during the summer vacation to capture the student and family tourism market in order to increase the attention on scenic spots and the number of visitors. Meanwhile, the seasonal characteristics of scenic spots are used to carry out tourism activities and create small seasonal tourism peaks, for example, the tourism attention of Zhongshanling in the spring, summer and autumn is high. In addition, thematic activities are the most characteristic and distinctive short-term products created by scenic spots, which can effectively increase the peak value of the attention of scenic spots, such as the cherry blossom festival of Yuantouzhu every March and April attracts a large number of tourists to come and enjoy. Therefore, based on the geographical, cultural, and human connections of the scenic spot, the path of environmental survey, refining highlights, theme selection, and project planning is used to determine the development theme in order to achieve a high concentration of various resources of the scenic spot within a limited period of time.
Thirdly, enterprises should further promote the development of in-depth business projects in various scenic spots, create special tourism products with core appeal, implement industrial diversification and cross-border integration development strategies, and activate high value-added conversion space. The tourism resources of 5A level scenic spots generally have high ornamental, artistic, historical, and cultural values. Therefore, attention should be paid to the excavation of the characteristics of the resources and the protection of the originality and cultural nature of tourism resources. In the design of tourism products, traditional history and culture are combined with modern life to give tourism products creativity, fun, and practicality; tourism products are updated on a rolling basis, and some “outdated” products are regularly eliminated and new products are introduced to ensure that they keep up with the dynamics of the tourism market demand. What is more important is to create 5A tourist attractions characteristic “IP”, emphasizing the diversified development, cross-border integration, expansion of the industrial chain, and constructing a strong radiation-driven space demonstration agglomeration to promote tourism quality and efficiency.
Fourthly, enterprises should take advantage of the integration of “online + offline + data” to do a good job in the effective promotion of tourism marketing and to optimize digital service capabilities. By improving the digital service capability, the industry management department can more accurately grasp the market dynamics, guide the matching of supply and demand, integrate tourism resources, drive other scenic spots with the radiation of 5A scenic spots, and effectively promote the development of all-area tourism. Tourism enterprises organize and use positions through digital methods to precipitate brand assets, continuously innovate products, and guarantee service experience. It also accelerates the construction of intelligent scenic spots, optimizes scenic spot management, and creates a new experience of entertainment and leisure. Through cloud visit, cloud theater, cloud exhibition, and other modes, it can not only provide an online platform for home tourism, but can also provide effective promotion for offline tourism. In addition, it must strengthen the construction of intelligent scenic spots, create a new experience of entertainment and leisure, and further improve the anti-risk ability of tourist scenic spots.
5.3. Limitations and Future Work
The research has some limitations that can be mitigated in further research. For example, considering the diversity of tourism information acquisition channels, this study is insufficient in analyzing the overnight reception of tourists in scenic spots and the tourists’ satisfaction with each scenic spot. Future research can focus on the spatio-temporal differentiation of overnight tourist destination selection and urban type identification.
Author Contributions
The contribution of G.W. is Formal analysis, Funding acquisition, and Writing—original draft; the contribution of Y.M. is Methodology, Investigation and Writing—review, and editing. All authors have read and agreed to the published version of the manuscript.
Funding
This research was supported by Major Projects of the National Social Science Foundation (19ZDA189), and the General Project of Philosophy and Social Science Research at the Universities of Jiangsu Province (2021SJA1601).
Institutional Review Board Statement
Not applicable.
Informed Consent Statement
Informed consent was obtained from all subjects involved in the study.
Data Availability Statement
All data used in this evaluation are available and also from the authors. Please contact author Guiling Wang with data requests (kendra5016@163.com).
Conflicts of Interest
The authors declare no conflict of interest.
References
- Ma, X.L.; Li, W.W.; Wei, N.; Wang, R. Study on structural characteristics and interactive pattern of international tourism markets in China and its surrounding countries. Geogr. Inf. Sci. 2021, 37, 120–127. [Google Scholar]
- Zhang, C.M.; Weng, S.X.; Bao, J.G. The geographical pattern of China’s tourism development since the reform and opening-up in 1978. Acta Geogr. Sin. 2019, 74, 1980–2000. [Google Scholar]
- Liu, C.S.; Chen, Y.; Jian, Y.F.; Dong, R.T. Measruement of the driving capacity of tourism industry on indirect employment and its spatio-temporal differences in China. Acta Geogr. Sin. 2022, 77, 918–935. [Google Scholar]
- Li, L.; Liu, H.L.; Tao, Z.M.; Lu, L. The impact of COVID-19 on tourism industry: Research progress and prospects. Hum. Geogr. 2022, 37, 32–41. [Google Scholar]
- Gali, N.; Aulet, S. Tourists’ space-time behavior in heritage places: Comparing guided and nonguided visitors. Int. J. Tour. Res. 2019, 21, 388–399. [Google Scholar] [CrossRef]
- Qin, J.; Song, C.; Tang, M.; Zhang, Y.; Wang, J. Exploring the Spatial Characteristics of Inbound Tourist Flows in China Using Geotagged Photos. Sustainability 2019, 11, 5822. [Google Scholar] [CrossRef]
- Huang, X.T.; Li, M.X.; Zhang, J.R.; Zhang, L.L.; Zhang, H.P.; Yan, S. Tourists’ spatial-temporal behavior patterns in theme parks: A case study of Ocean Park Hong Kong. J. Destin. Mark. Manag. 2020, 15, 100411. [Google Scholar] [CrossRef]
- Ye, Z.Q.; Liu, Y.J.; Wang, P.F. Action mechanism and policy suggestions of big data to promote high-quality development of tourism. Bus. Econ. 2022, 41, 132–141. [Google Scholar]
- Rech, J. Discovering trends in software engineering with google trend. ACM 2007, 32, 1–2. [Google Scholar] [CrossRef]
- Li, Y.J.; Liao, C.L.; Li, Y. Research of influence mechanism of consumer’s self selection bias on online reviews. Soft Sci. 2015, 29, 105–109. [Google Scholar]
- Ginsberg, J.; Mohebbi, M.H.; Patel, R.S.; Brammer, L.; Smolinski, M.S.; Brillant, L. Detecting influenza epidemics using search engine query data. Nature 2009, 457, 1012–1014. [Google Scholar] [CrossRef] [PubMed]
- Su, H.; Kang, W.J. Spatial-temporal characteristics of the network attention to classical red tourist attractions. J. Arid Land Res. Environ. 2022, 36, 200–208. [Google Scholar]
- Liang, L.; Fu, H.Y.; Li, J.Q.; Li, B.R. Spatio-temporal dynamic evolution and influencing factors of net celebrity city network attention: A case of Xi’an. Sci. Geogr. Sin. 2022, 42, 1566–1576. [Google Scholar]
- Ding, Z.W.; Ma, F.F.; Zhang, G.S. Spatial differences and influencing factors of urban network attention by Douyin fans in China. Geogr. Res. 2022, 41, 2548–2567. [Google Scholar]
- Ma, L.J.; Liu, C. Study on the preference and influencing factors of potential customers for city food in China—Based on the perspective of network attentions. Res. Dev. Mar. 2021, 37, 365–371. [Google Scholar]
- Louviere, J.J.; Hensher, D.A. Using Discrete Choice Models with Experimental Design Data to Forecast Consumer Demand for a Unique Cultural Event. J. Consum. Res. 1983, 10, 348–361. [Google Scholar] [CrossRef]
- Zhang, W.W.; Jiang, L.L. Effects of High-Speed Rail on Sustainable Development of Urban Tourism: Evidence from Discrete Choice Model of Chinese Tourists’ Preference for City Destinations. Sustainability 2021, 13, 10647. [Google Scholar] [CrossRef]
- Andersson, J.E.G. The recreational cost of coral bleaching—A stated and revealed preference study of international tourists. Ecol. Econ. 2007, 62, 704–715. [Google Scholar] [CrossRef]
- Chaminuka, P.; Groeneveld, R.A.; Selomane, A.O.; Lerland, E.C.V. Tourist preferences for ecotourism in rural communities adjacent to Kruger National Park: A choice experiment approach. Tour. Manag. 2012, 33, 168–176. [Google Scholar] [CrossRef]
- Baa, B.; Ahac, D.; Ldfa, B. Residential relocation, preferences, life events, and travel behavior: A pre-post study—ScienceDirect. Res. Transp. Bus. Manag. 2020, 36, 100483. [Google Scholar]
- Kim, D.; Kim, W.; Han, J. A perceptual mapping of online travel agencies and preference attributes. Tour. Manag. 2007, 28, 591–603. [Google Scholar] [CrossRef]
- Dadashpour, M.M.; Hassan, A.; Reza, V. A GIS-Based Assessment of Urban Tourism Potential with a Branding Approach Utilizing Hybrid Modeling. Spat. Inf. Res. 2022, 30, 399–416. [Google Scholar] [CrossRef]
- Hsu, T.K.; Tsai, Y.F.; Wu, H.H. The preference analysis for tourist choice of destination: A case study of Taiwan. Tour. Manag. 2009, 30, 288–297. [Google Scholar] [CrossRef]
- Ma, M.Y.; Tang, J.X. Interactive coercive relationship and spatio-temporal coupling coordination degree between tourism urbanization and eco-environment: A case study in Western China. Ecol. Indic. 2022, 142, 109149. [Google Scholar] [CrossRef]
- Zhou, J. Statistical Research on the Development of Rural Tourism Economy Industry under the Background of Big Data. Mob. Inf. Syst. 2021, 2021, 9152173. [Google Scholar] [CrossRef]
- Bec, A.; Moyle, B.; Timms, K.; Schaffer, V.; Skavronskaya, L.; Little, C. Management of immersive heritage tourism experiencs: A conceptual model. Tour. Manag. 2019, 72, 117–120. [Google Scholar] [CrossRef]
- Wang, J.W.; Wang, G.Q.; Zhang, S.Y.; Wang, X. Estimating population size of informal employment in urban tourism based on capture-mark-recapture approach: A case study of Beijing. Sci. Geogr. Sin. 2022, 42, 1239–1249. [Google Scholar]
- Xiao, Z.F.; Li, R.; Duan, S.; Peng, X.W. Study on temporal and spatial pattern evolution of tourism ecological security in Chengdu-Chongqing urban agglomeration. World Reg. Stud. 2023, 1–12. Available online: https://cc0eb1c56d2d940cf2d0186445b0c858lib.v.ntu.edu.cn:4443/kcms/detail/31.1626.P.20220429.0833.002.html (accessed on 20 December 2022).
- Sofi, A.A.; Bhat, M.Y.; Ahmad, L.; Aara, R.R.; Aswani, R.S. Renewable energy and transitioning towards sustainable tourism: Inferences from kernel density and nonparametric approach. Renew. Energy 2022, 193, 963–975. [Google Scholar] [CrossRef]
- Sun, G.N. International tourism payment equation, payment grade and tourism inclination. Geogr. Terri. Res. 2001, 17, 50–54. [Google Scholar]
- Wang, S.J.; Berbekova, A.; Uysal, M. Pursuing justice and quality of life: Supporting tourism. Tour. Manag. 2022, 89, 104446. [Google Scholar] [CrossRef]
- Dolnicar, S.; Cvelbar, L.K.; Grün, B. A sharing-based approach to enticing tourists to behave more environmentally friendly. J. Travel Res. 2019, 58, 241–252. [Google Scholar] [CrossRef] [PubMed]


Disclaimer/Publisher’s Note: The statements, opinions and data contained in all publications are solely those of the individual author(s) and contributor(s) and not of MDPI and/or the editor(s). MDPI and/or the editor(s) disclaim responsibility for any injury to people or property resulting from any ideas, methods, instructions or products referred to in the content. |
© 2023 by the authors. Licensee MDPI, Basel, Switzerland. This article is an open access article distributed under the terms and conditions of the Creative Commons Attribution (CC BY) license (https://creativecommons.org/licenses/by/4.0/).