Article

Impact-Asymmetric Analysis of Bike-Sharing Residents’ Satisfaction: A Case Study of Harbin, China

1
College of Landscape Architecture, Northeast Forestry University, Harbin 150040, China
2
Academic Affairs Office, Northeast Forestry University, Harbin 150040, China
3
School of Architecture and Urban Planning, Huazhong University of Science and Technology, Wuhan 430074, China
4
Society Hub, The Hong Kong University of Science and Technology (Guangzhou), Guangzhou 511400, China
5
CAUPD Beijing Planning and Design Consultants Co., Ltd., Hainan Branch, Haikou 570100, China
*
Authors to whom correspondence should be addressed.
Sustainability 2023, 15(2), 1670; https://doi.org/10.3390/su15021670
Submission received: 21 November 2022 / Revised: 2 January 2023 / Accepted: 12 January 2023 / Published: 15 January 2023
(This article belongs to the Special Issue Sustainable Transportation and Urban Planning)

Abstract

:
Harbin, China, has a large population density and a large number of motor vehicles. To alleviate traffic congestion, based on the survey data of bike-sharing riders in the new and old urban areas of Harbin in May 2022, this paper uses an impact-asymmetric analysis and gradient enhancement decision tree to analyse the asymmetric relationship between bike-sharing travel environment elements and cyclists’ satisfaction, and the optimisation strategy for the bike-sharing riding environment was obtained so that more residents can choose to ride. This research shows that the infrastructure of the motorway in the old urban area had the greatest impact on the overall satisfaction, while the travel quality of the shared bikes in the new urban area had the greatest impact on the overall satisfaction. In addition, due to the differences in urban environments and satisfaction, planning directions are different when satisfying cyclists in the new and old urban areas. The old urban area should emphasise cycling comfort and road coherence to provide a good travel environment; however, the new urban area should focus on the operation of shared bikes to meet the needs of cyclists. Therefore, future research should formulate refined improvement strategies for different regions.

1. Introduction

At the conclusion of 2020, the total number of civilian cars in Harbin was 2.127 million, and at the end of 2021, the total number of civilian cars in Harbin was 2.222 million, and the number of motor vehicles was still increasing [1,2]. In 2021, Harbin ranked eighth in China regarding traffic congestion during commuting peak, with a congestion index of 1.741, and the congestion index increased by 5.69% year-on-year in 2020 [3]. As traffic congestion intensifies, the environmental pollution and energy consumption problems it brings also severely constrain socioeconomic development, and urban traffic congestion needs urgent improvement [4]. In recent years, major cities have promoted bike sharing as a green mode of travel, which is essential in easing traffic congestion in Chinese cities, in addition to providing convenience and reducing travel costs for urban residents [5]. In 2017, approximately 8000 shared bikes were launched in Harbin; however, by 2021, the total number of shared bikes in Harbin reached 100,000.
Bike sharing is becoming increasingly popular in urban space transportation systems. Based on the concept of sustainable travel, it can mainly solve the “last kilometer” problem in the urban transportation system and environmental problems caused by traditional transportation, and it is conducive to improving the health level of residents [6]. With the growing number of cyclists in cities, road safety is becoming more important. According to statistics, there are currently a high number of road accidents involving motor vehicles and cyclists in many cities, among which cyclists suffer the most serious injuries [7,8]. Thus, in order to protect the safety of cyclists, attract more residents to choose shared bikes for travel, and optimise the urban bike travel environment, increasing road safety is an urgent problem to be solved [9].
The old urban areas of Harbin have a long history, complex road network, and high population density, while the new urban areas have wide and straight urban roads, younger residents, and better urban greening. Therefore, the travel demand of the new and old urban residents will also differ [10]. Detailed research on the satisfaction of bike-sharing riders in both urban areas with the travel environment facilitates the improvement in the travel environment and the comfort of riding.
Combined with gradient boosting decision trees (GBDT) and impact-asymmetry analysis (IAA), this study analysed residents in the old and new urban areas of Harbin, China to understand the differences in residents’ perceptions and suggest accurate bike-sharing travel environment optimisation countermeasures through an impact-asymmetric analysis of satisfaction. The findings showed that 90% of the travel environment elements had an asymmetrical and nonlinear relationship with residents’ satisfaction. Secondly, there were significant differences in the travel environment elements of concern to residents in the old and new urban areas, and this paper proposes targeted strategies for improvement.
The structure of this paper is as follows: the first section introduces the research background; the second section reviews the research on the cycling environment and rider satisfaction; the third section introduces the method of data acquisition and analysis method; the fourth section discusses the analysis results; and the fifth section focuses on the research results and puts forward the optimisation strategy.

2. Literature Review

In 2009, Sener et al. divided the factors affecting cycling into five categories and used the logit model to analyse the route choice preference of commuter cyclists. The results showed that the travel time was the most important factor for bicycle commuters to choose the travel route [11]. In 2011, Winters et al. used exploratory factor analysis to extract and evaluate 73 motivators and deterrents to cycling and found that the five most significant categories of factors affecting cycling were safety, ease of cycling, weather conditions, route conditions, and the degree of mixing with motor vehicles [12]. In 2012, Li Zhibin and Wang Wei et al. used a probit model to compare cyclists’ perceived comfort on segregated cycle facilities and on-street cycle facilities and found that cyclists were more comfortable on physically segregated cycle lanes than on marked segregated cycle lanes [13]. In 2014, Hull et al. compared the service level of bicycle infrastructure in six European cities through a field survey and a questionnaire survey. The survey found that cycling safety, comfort, and road network continuity significantly impacted cyclists’ travel choices [14]. In 2014, Pan Huijing et al. used a discrete choice model to quantify the effect of the road environment on cyclists’ route preferences. The results showed that the environmental elements of greatest concern to cyclists were bicycle lane type, motor vehicle traffic flow, separation facility, motor vehicle on-street parking, and streetscape [15]. In 2014, Guo Chunlin et al. constructed a bicycle riders’ satisfaction model on urban roads, and the results showed that the patency and comfort of bicycle lanes had the greatest impact on cyclists’ satisfaction [16]. In 2016, Zhu Wei analysed the impact of the cycling environment on cyclists’ route choice through the discrete choice model and found that cyclists focus more on the safety of the travel environment [17]. In 2017, Guo et al. used the ordered probit model to study the factors influencing the satisfaction of bike-sharing users in Ningbo, and the results showed that satisfaction with bike-sharing was influenced by household income, bike-sharing station location, and users’ perceptions of bike sharing, and that there was a positive and strong correlation between the use of bike sharing and satisfaction [18]. In 2017, Zhou Simeng constructed a structural equation model of bike sharing user satisfaction and concluded that bike-sharing rider satisfaction was positively related to five variables: safety and environmental friendliness, flexibility and convenience, distribution and parking of bike sharing, appearance and performance, and service and maintenance [19].
In 2020, Hardinghau et al. used a multinomial mixed logit discrete choice model to investigate the impact of route preference and road infrastructure on cyclists in Greece and Germany. They concluded that route preference is more affected by road environment and that bicycle infrastructure is more effective at attracting cyclists [20]. In 2021, Xu Jun et al. established a cyclist satisfaction model for different bike lanes, and the results showed that the most important factor affecting cycling was to ensure the safety of cycling [21]. In 2021, Liu Yan et al. used the hierarchical logit model and hybrid choice model to analyse the impact of improving the cycling environment on residents’ travel behaviour and concluded that improving the cycling environment would significantly drive bus, subway, and private car passengers to choose bicycles [22].
In summary, domestic and foreign scholars have used various methods to study the choice of bicycle travel and suggest strategies to improve the travel environment. However, these studies are based on the overall urban environment, without a differentiated analysis of different travel environments in both urban areas, and the improvement strategies lack pertinence [23,24]. In this paper, the gradient boosted decision tree (GBDT) method was used to solve the multicollinearity problem, reduce the error, and propose a more accurate optimisation strategy for the urban bike-sharing travel environment.

3. Data and Methods

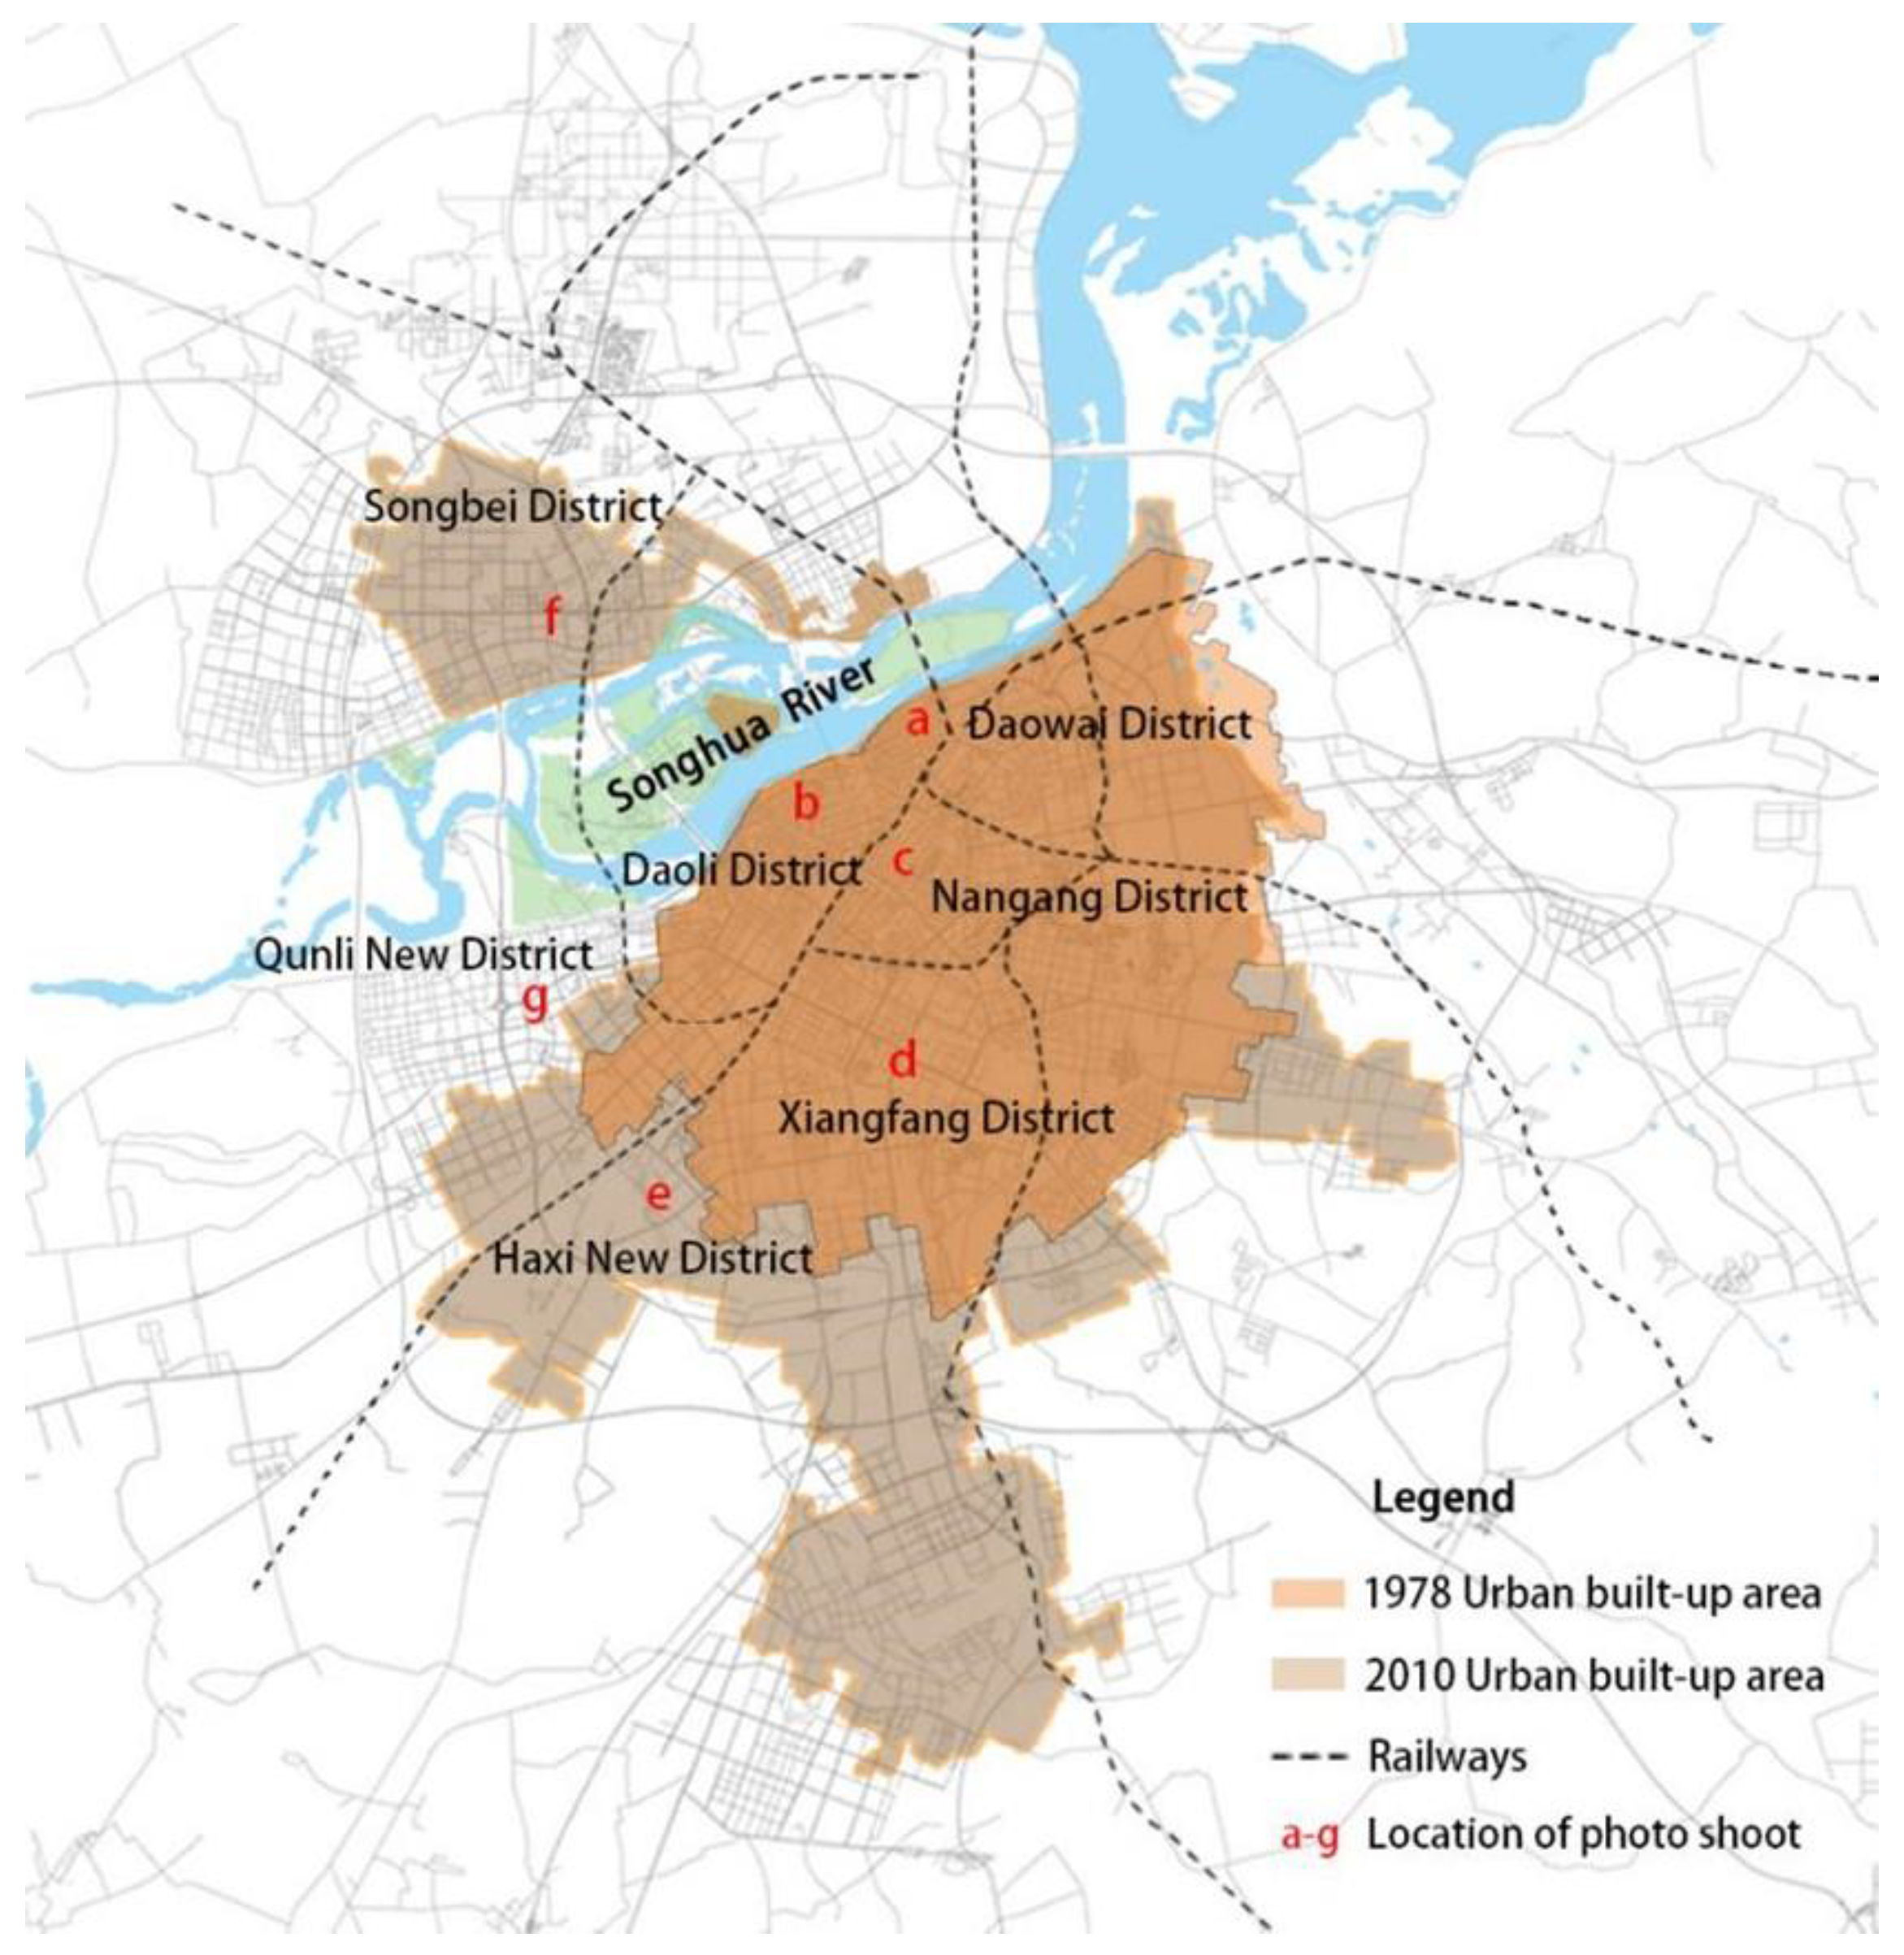
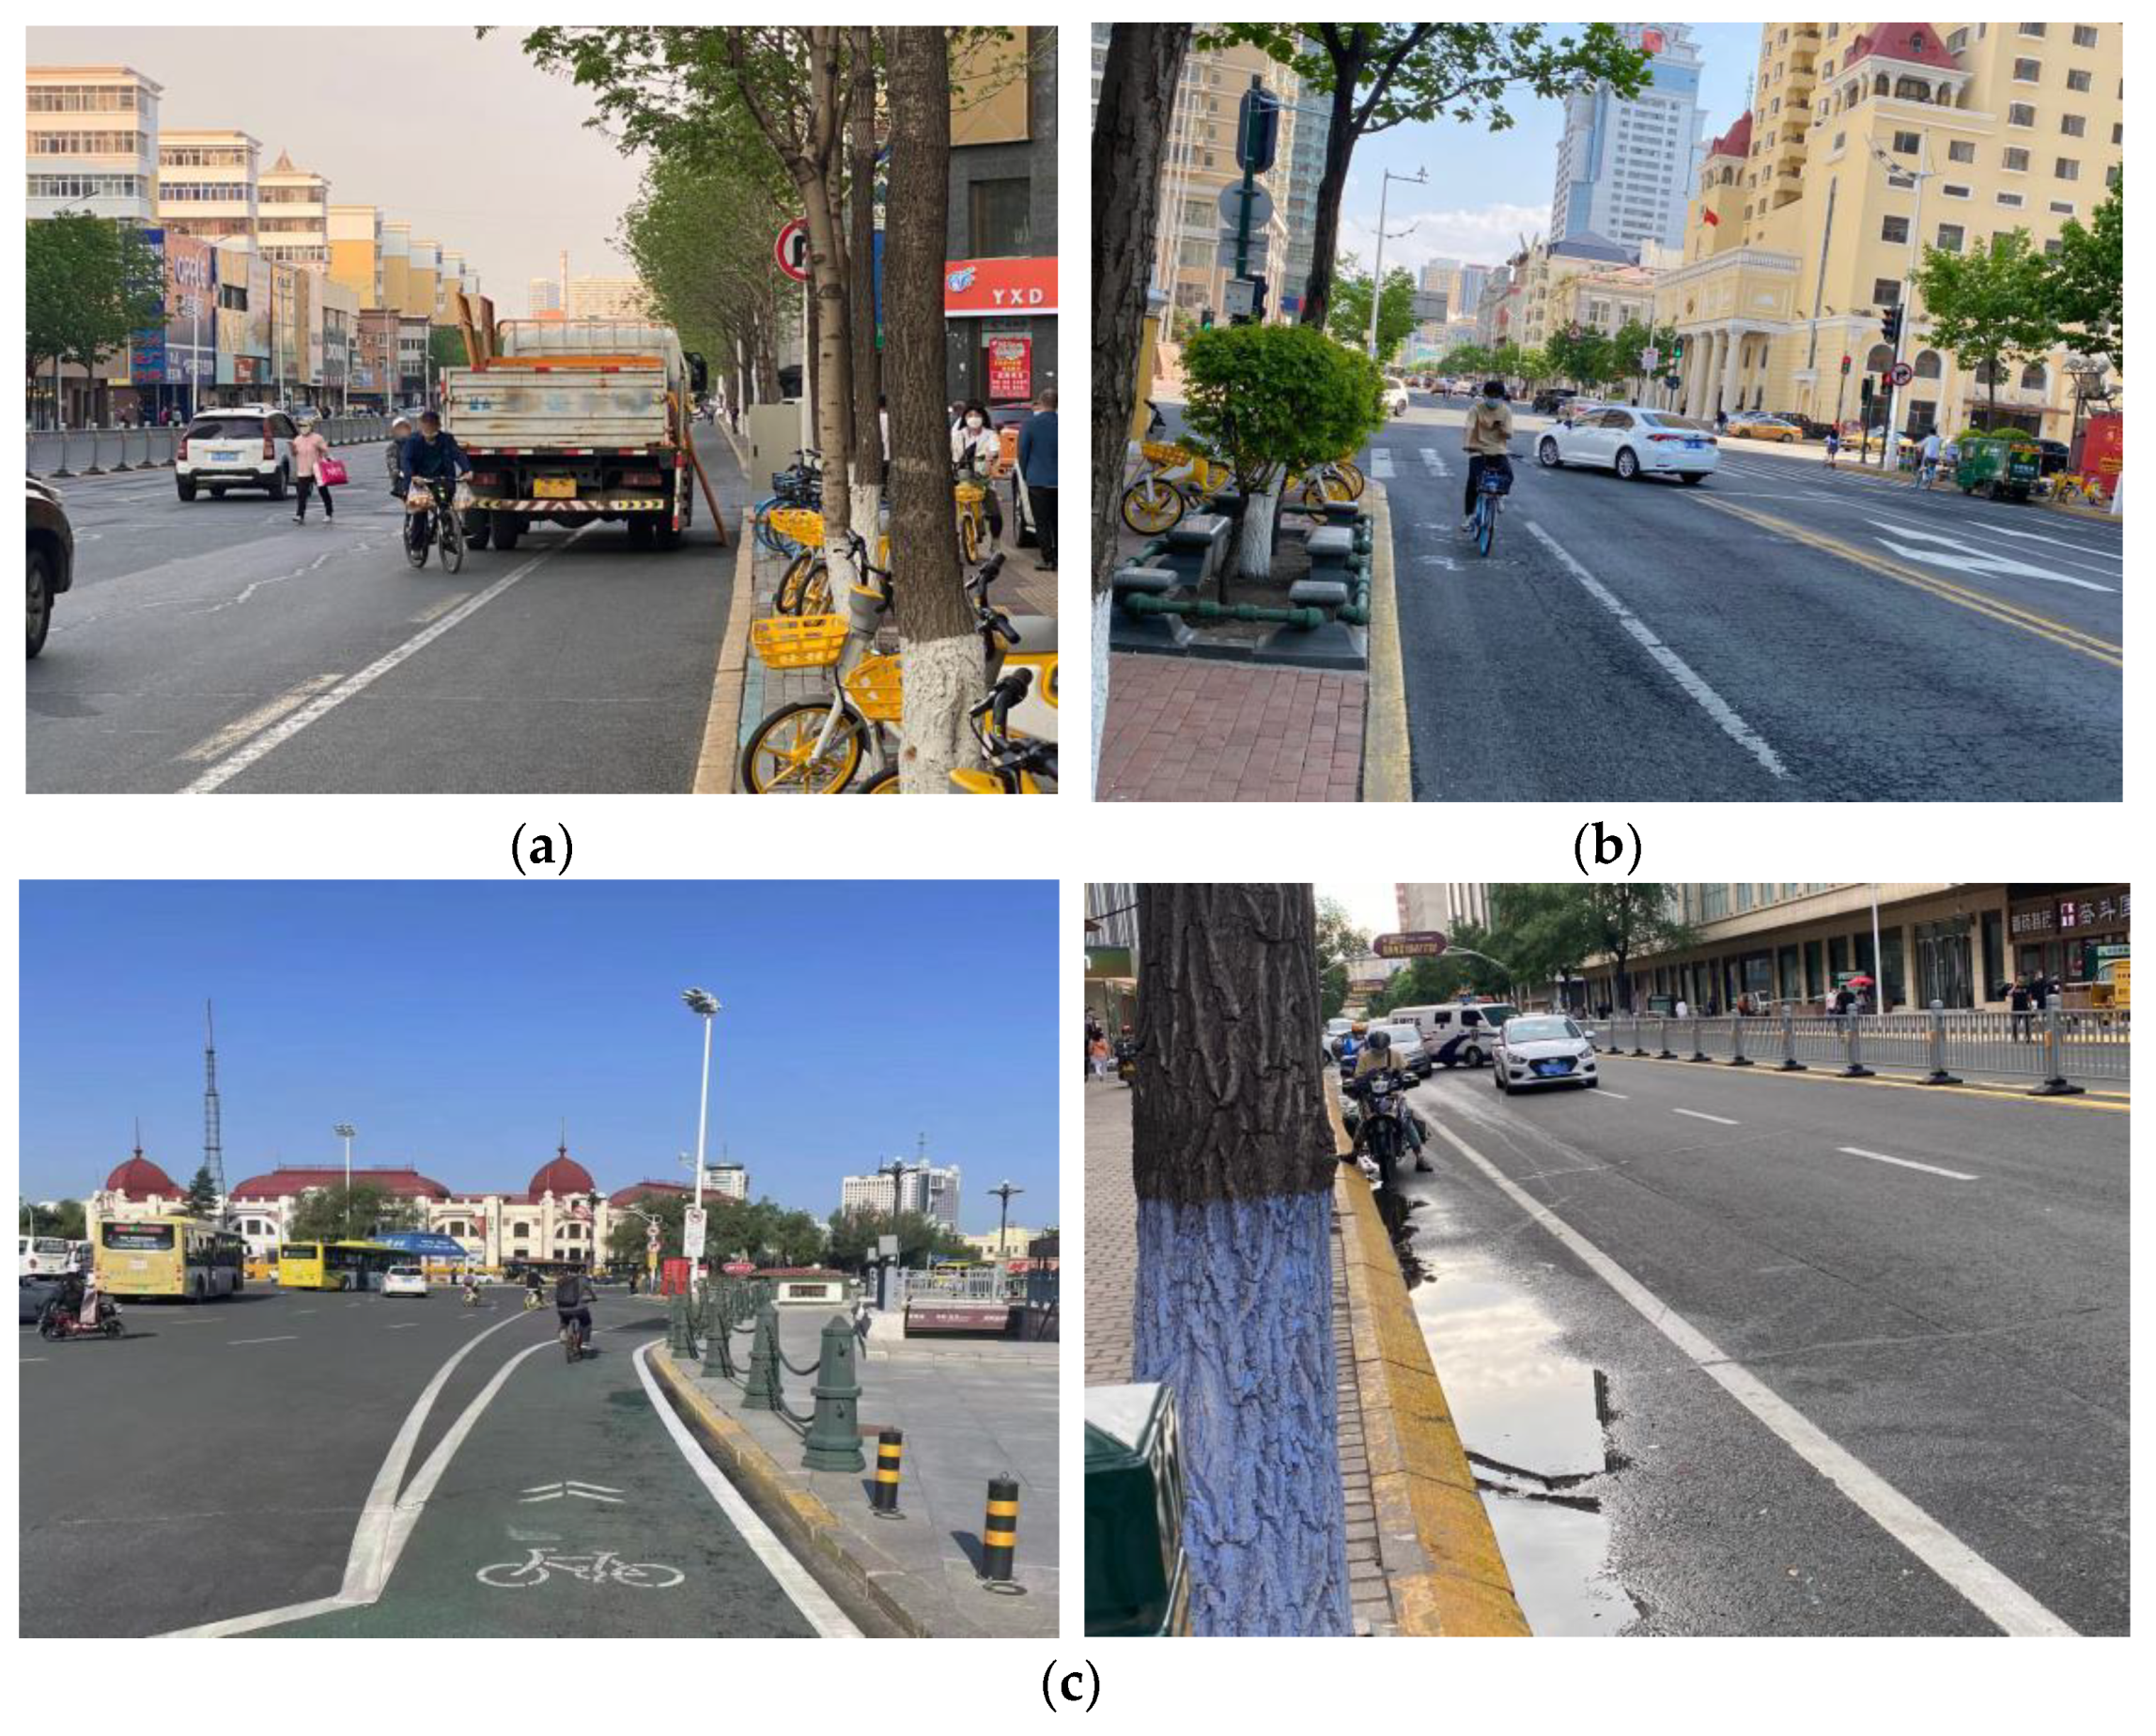
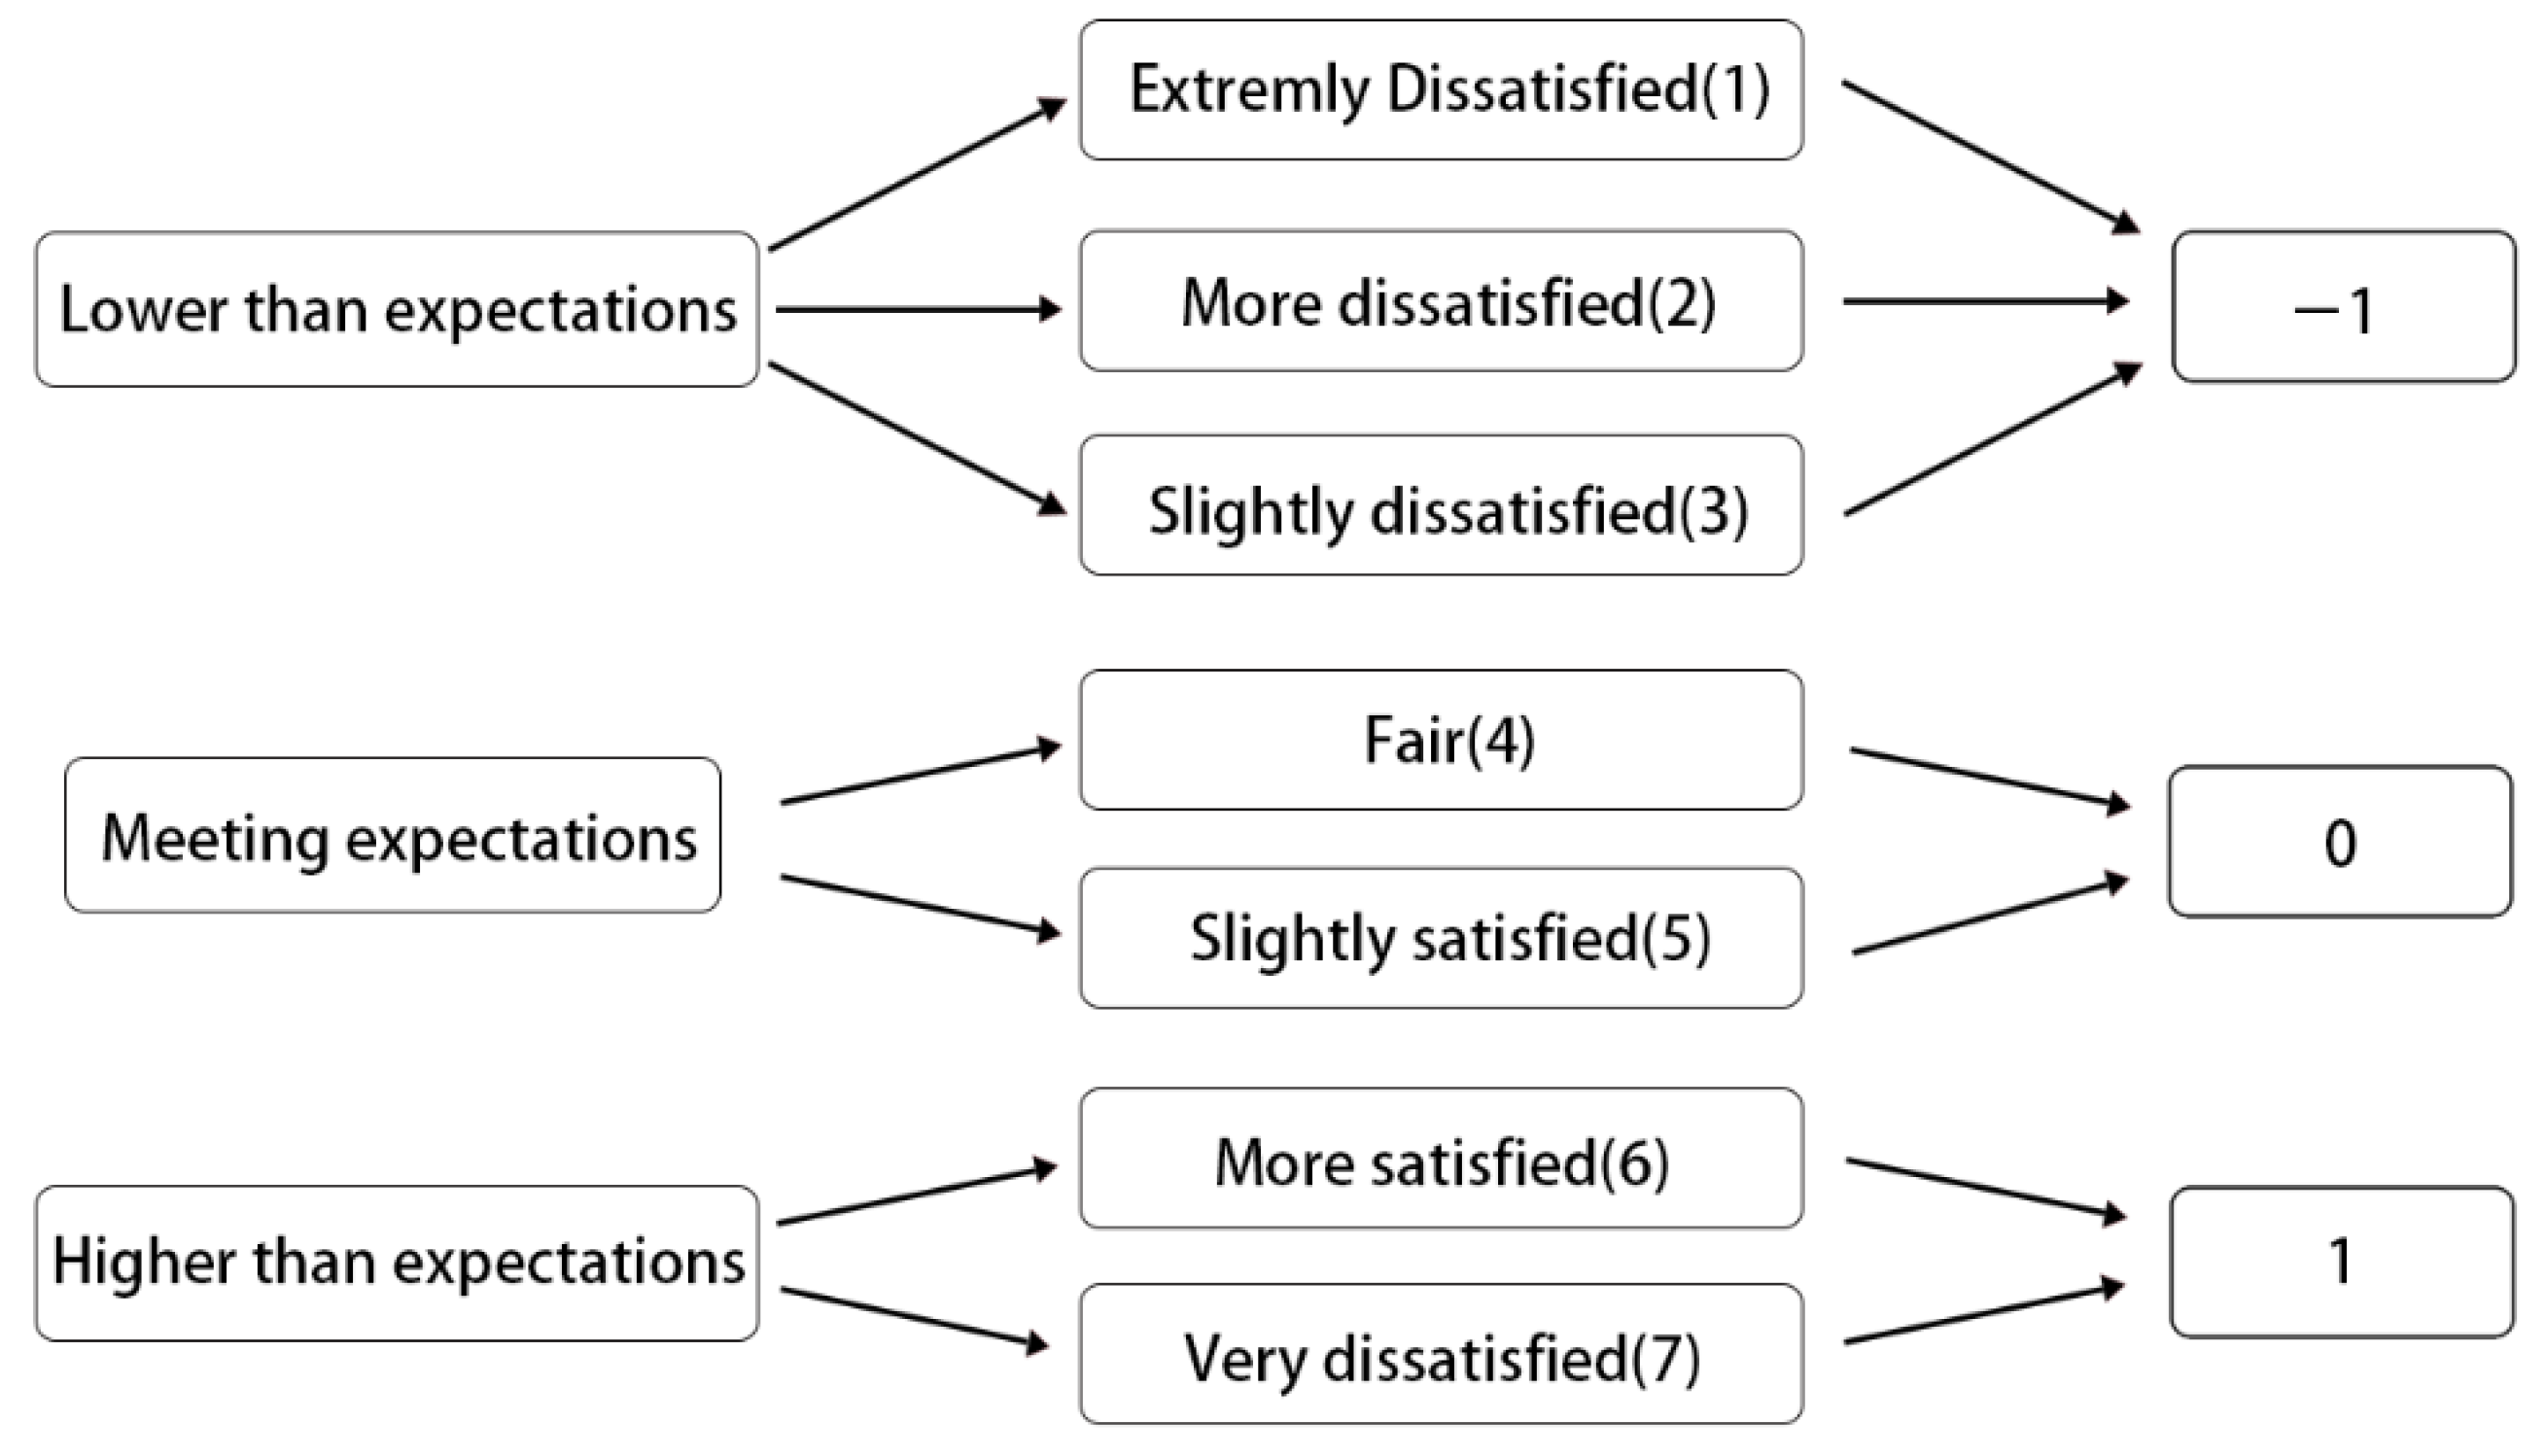
3.1. Data and Variables

Through the review of domestic and foreign literature on travel environments, combined with field research and interviews, the evaluation system of the bicycle travel environment was established, and comfort, safety, consistency, and operation were selected as the index system criteria, as shown in Table 1.
The survey was conducted in May 2022 in Harbin, China, the capital of Heilongjiang province in the country’s northeast. By the conclusion of 2021, Harbin had a permanent population of over 9 million people.
The survey was pretested by bike-sharing riders and revised based on their feedback, and the questionnaire was released in May 2022 through an online random sample. A total of 753 questionnaires were sent out, of which 412 chose to ride shared bikes for daily travel, including 182 in the old urban area and 230 in the new urban area. These questionnaires were selected for data analysis. In this paper, 1978 was used as the time node to divide the old and new urban areas in the main urban area of Harbin. The areas that had been planned before 1978 were categorised as the old urban area. This included the Daowai District, Xiangfang District, Daoli District, and Nangang District, while the new urban areas included the Songbei District, Haxi New District, and Qunli New District. The questionnaires were distributed in the business districts where people gathered in the new and old urban areas, as shown in Figure 1 and Figure 2 and Table 2.
The questionnaire included four sections: satisfaction evaluation of bicycle travel environment, satisfaction evaluation of shared bikes, personal information, and residents’ travel characteristics. We asked respondents to score in the order of “very dissatisfied” (1) to “very satisfied“ (7), indicating their satisfaction with the 31 elements and overall satisfaction on the questionnaire. In addition, the questionnaire collected the travel characteristics of the respondents, including the daily cycling distance, the purpose of the trip, the cycling time, and the daily cycling time. Personal information included age, gender, educational background, occupation, personal monthly income, and vehicle ownership.
As shown in Table 3, the respondents in the new urban area were younger than those in the old urban area. The majority of the respondents in the old urban area were aged between 19–35 and 36–59, accounting for 48.4% and 42.9%, respectively, while 71.3% of the respondents in the new urban area were aged between 19 and 35. In the old urban areas, 34% of the residents had a monthly personal income between 1000 and 3834 yuan, while 34.3% of the residents in the new urban areas had a monthly income below 1000 yuan. In the old urban area, 50% of the respondents were office workers, while 51.3% in the new urban area were students. Furthermore, the majority of the residents in the old urban areas were middle-income office workers, and their travel purpose was transiting to work, accounting for 25.0%. The new urban residents were mostly low-income students and their travel purpose was leisure, accounting for 25.2%.

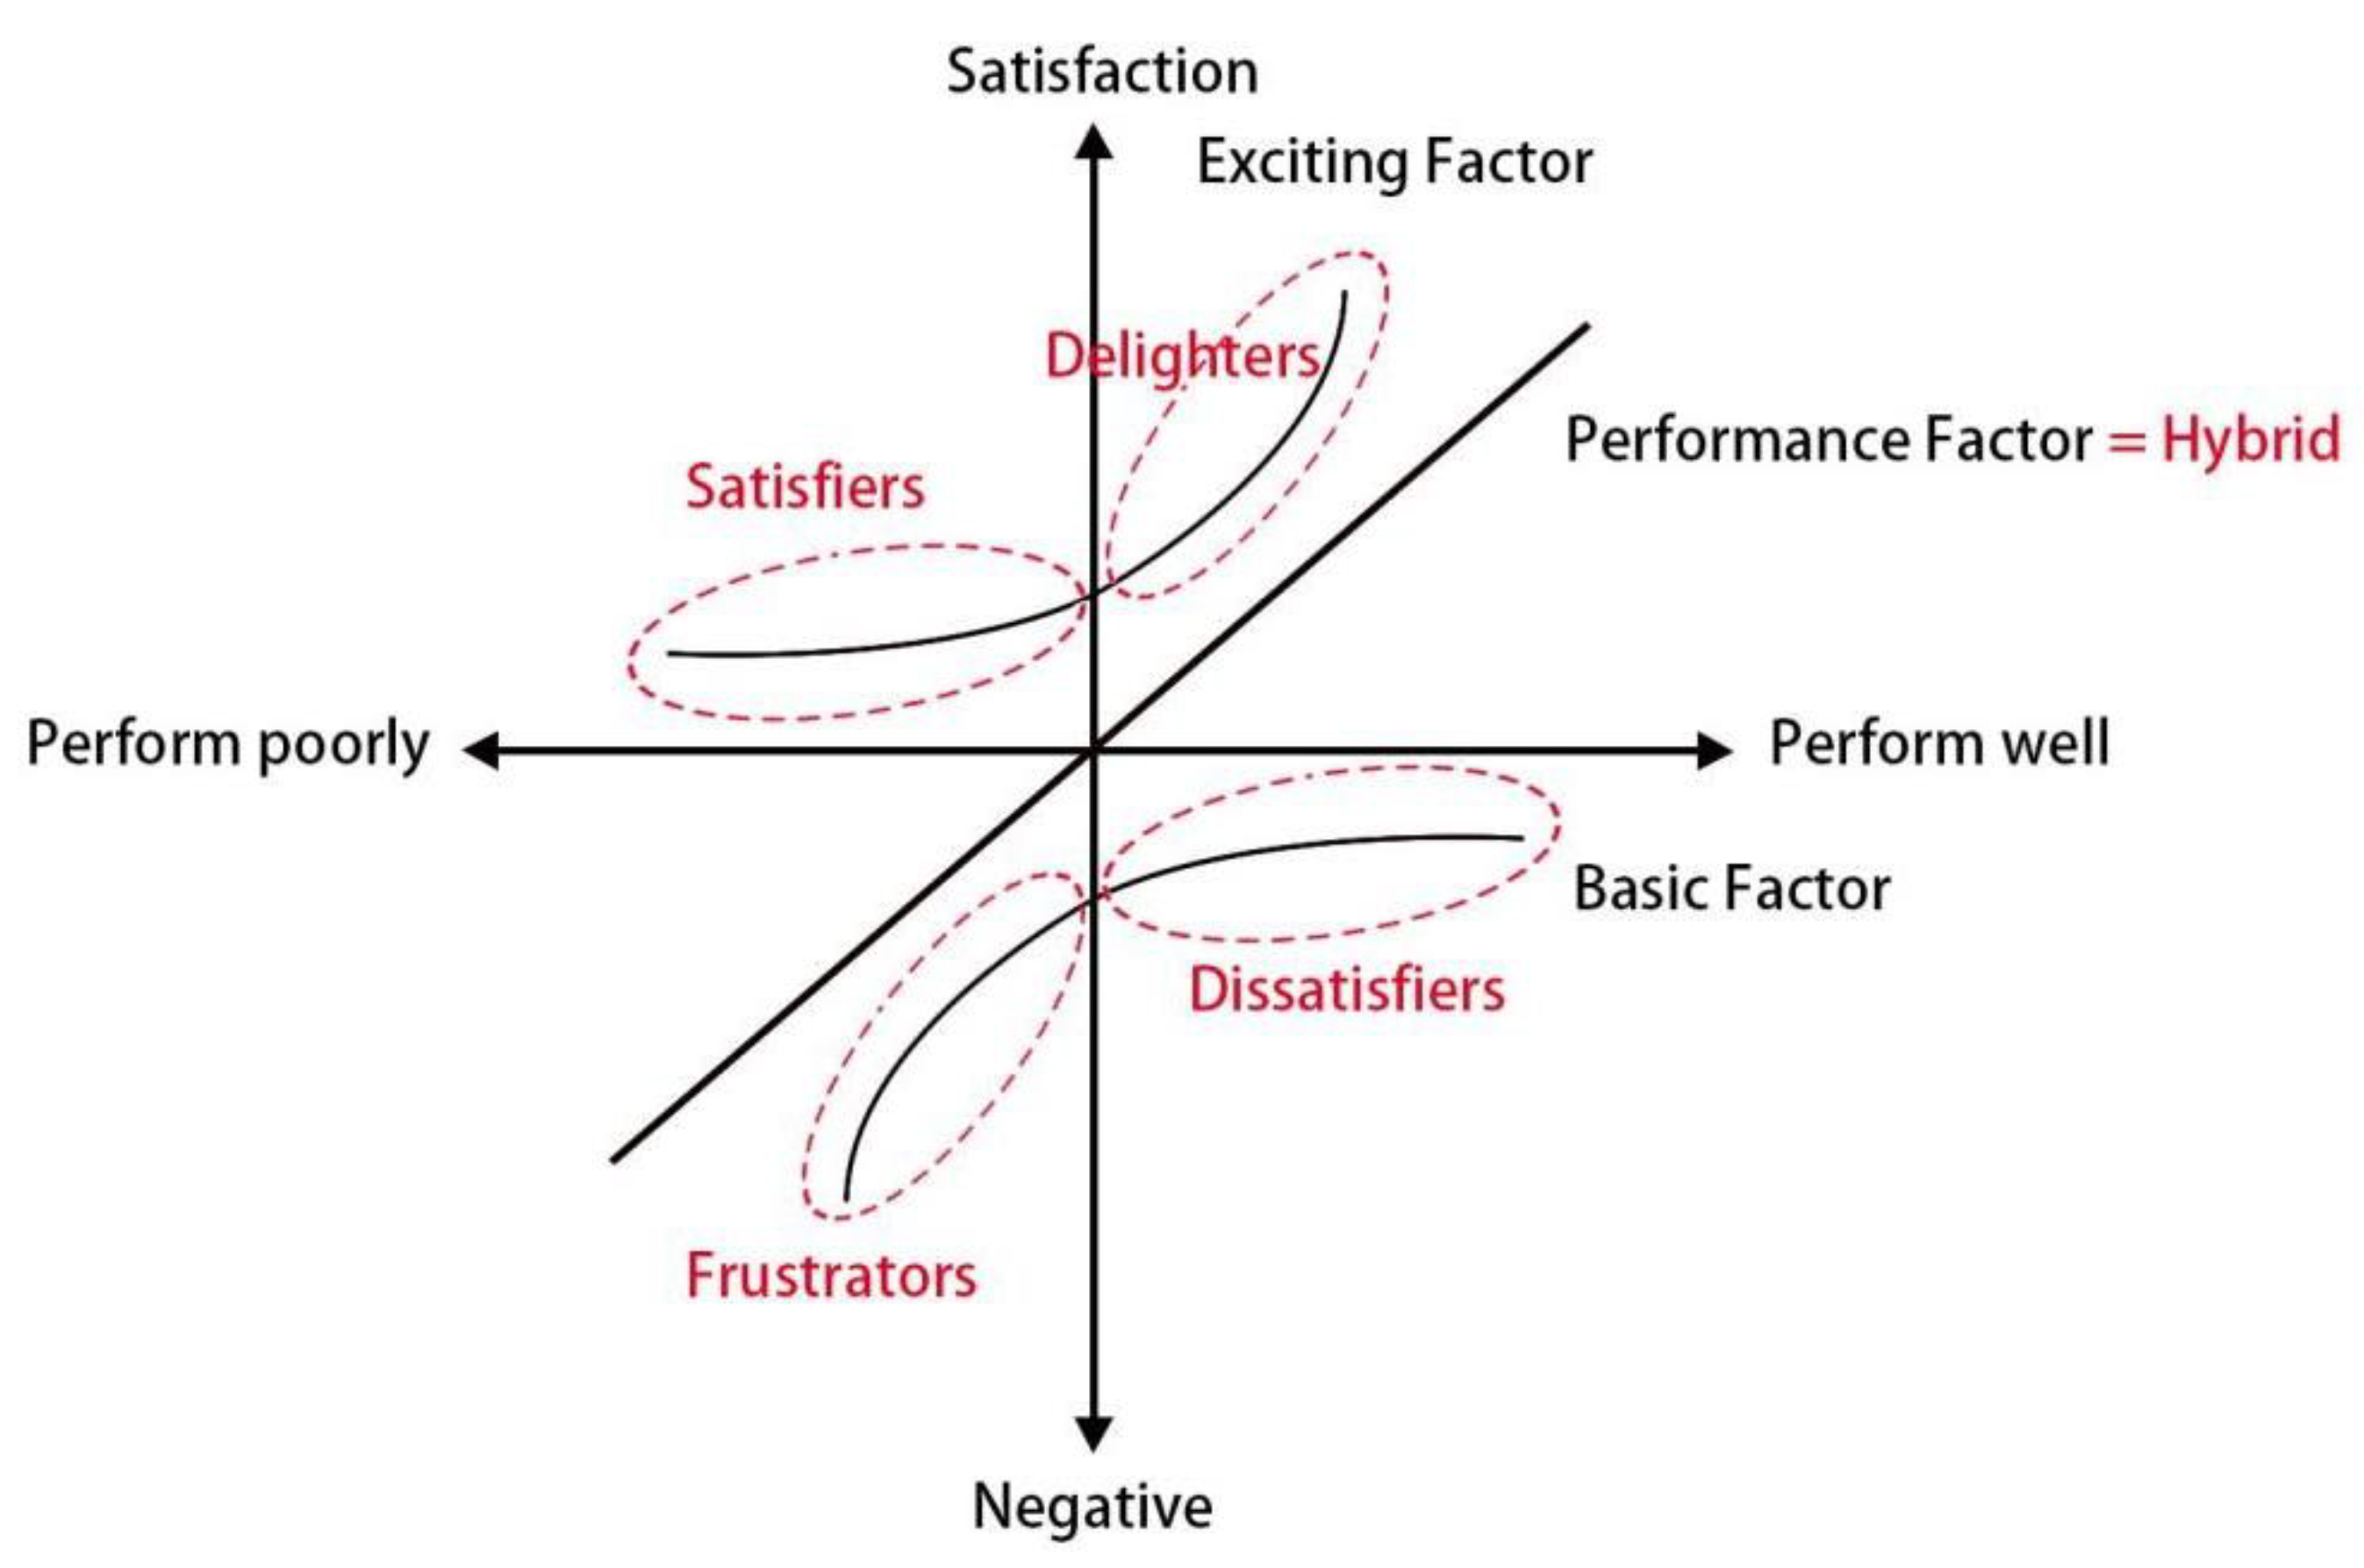
3.2. Analytical Methods

To analyse satisfaction, previous scholars have used factor analysis and the Kano model in the early stage and then gradually changed to IPA analysis, the IPA-Kano model, and asymmetric influence analysis. Simultaneously, certain scholars have used the structural equation model to study traveller satisfaction [25,26,27]. In 2017, Cao et al. used the IPA method and the three-factor theory to compare and analyse the traffic satisfaction data of bus rapid transit passengers, bus passengers, and subway passengers in Guangzhou, China, and obtained the improvement priorities for different transportation services [28]. In 2020, Fang Dewei et al. used the bus passenger satisfaction data of Harbin City to derive the optimisation strategy of public transport services through the IPA-Kano model, emphasised the importance of asymmetry in the study of bus satisfaction, and determined the priority of bus station service improvement [29]. In 2020, Sun Shan et al. proposed the priority of factor improvement of the bus station waiting area by using the IPA method and the three-factor theory and concluded the importance of asymmetry in the study [30]. In 2021, Yin Jiangbin et al. constructed a structural equation model to study the relationship between subway and residents’ satisfaction. The results showed that residents living near the subway station had higher life satisfaction and travel satisfaction than those living far away from the subway station [31].
Kano proposed the three-factor theory from the two-factor theory, which is mainly used to classify and prioritise the needs of customers [32]. At the same time, the three-factor theory takes into account the nonlinear, asymmetrical relationship between the measured object and overall satisfaction [33]. According to the three-factor theory, the influencing factors are divided into three categories: performance factors, basic factors, and excitement factors according to their effects on overall satisfaction [34], as shown in Figure 3. The basic factor is considered a “must” factor and significantly impacts overall satisfaction when it performs poorly, but only a minor impact when it performs well. The excitement factor was considered an “additional” factor that had a significant impact on overall satisfaction only when it performed well. The effect of the performance factors is linear, while the effect of basic and excitatory factors is nonlinear.
Mikulic and Prebezac in 2008 proposed an alternative approach to classify elements, impact-asymmetry analysis (IAA), which is widely used in the public transport and tourism fields [35]. The IAA is based on similar principles to the three-factor theory but emphasises the magnitude of each factor’s impact on overall satisfaction when classifying factors. Three-factor theory and IAA usually use dummy variable regression for data analysis, but while three-factor theory only classifies service factors based on significance levels (i.e., p-value), IAA is based on the ability of factors to increase or decrease overall satisfaction. This method classifies the different factor types in the three-factor theory more precisely, and it can prioritise the factors for improvement more precisely. In 2020, Wu et al. used IAA to discuss the nonlinear impact of service attributes on bus rapid transit passenger satisfaction. Based on factor classification and attribute performance, they obtained the five attributes that had the greatest impact on the overall satisfaction of bus rapid transit [36]. In 2021, Fang et al. used the IAA method to analyse the asymmetric relationship between bus service attributes and passenger satisfaction in Harbin. By comparing the overall satisfaction factor structure of fixed passengers and selected passengers, they proposed the optimal improvement strategy of bus services for different passenger groups [37].
IAA is based on the three-factor theory and uses dummy variables to classify factors into five categories based on their impact on overall satisfaction: delighters, satisfiers, hybrids, dissatisfiers, and frustrators. Frustrators and dissatisfiers are equivalent to the basic factors in three-factor theory, the hybrids are equivalent to the performance factor in the three-factor theory, and the satisfiers and delighters are equivalent to the arousal factor in the three-factor theory. The delighters are the extreme case of the satisfiers, and when satisfied, it increases customer satisfaction significantly. Frustrators are the extreme case of the dissatisfiers, and when performed poorly, it can severely reduce customer satisfaction. Satisfiers are perceived as value-added attributes that do not reduce satisfaction when they perform poorly but can increase satisfaction if provided. Hybrids are factors that have a relatively linear and symmetrical relationship with satisfaction, reducing it when it performs poorly and increasing it when it performs well. Dissatisfiers are usually considered to be the most basic customer need and they reduce overall satisfaction when it performs poorly and conversely have a limited effect on satisfaction enhancement.
Among those factors that have a greater impact on overall satisfaction and perform poorly, the frustrators and dissatisfiers should be prioritised for improvement because they have a greater negative impact on overall satisfaction when they perform poorly. However, the poorly performing satisfiers and delighters have a lower priority for improvement because they have a smaller impact on overall satisfaction when they perform poorly. In addition, when considering improvement priorities, it is essential to focus on the actual impact of the factor on overall satisfaction. When a poorly performing factor is a frustrater or dissatisfier but has a small impact, its negative impact is also small; therefore, those elements that have a greater practical impact on improving overall satisfaction should be prioritised.
This study used a gradient boosting decision tree to analyse the relative importance of each element. The gradient boosted decision tree (GBDT) was originally used for predicting and interpreting data and has been widely used in the transport sector in recent years [38,39,40]. The GBDT method is an integrated tree-based approach: it constructs a number of single decision trees and then combines the results of these decision trees. It approximates the true value and minimises the loss function by iteratively interpreting the prediction error until the loss function remains stable or reaches a minimum value [41,42]. The decision tree is the basic algorithm of the GBDT model and optimises rankings by showing the relative importance of elements to overall satisfaction compared to traditional regression models, solves the problem of multicollinearity, reduces errors, and improves the accuracy of the findings [43,44,45].

4. Discussion

4.1. Contribution of Travel Environment Elements to Overall Satisfaction

First, a normal distribution analysis using SPSS 26.0 yielded an overall mean satisfaction value of 4.37, so four and five were selected as reference variables and then the 31 travel environment elements were recoded. Respondents rated their satisfaction with the travel environment on a scale from 1–7, and the scored data were then recoded into three values: −1 (very dissatisfied, dissatisfied and slightly dissatisfied), 0 (average and slightly satisfied) and 1 (satisfied and very satisfied), indicating below expectations, in line with expectations, and above expectations, respectively, as shown in Figure 4.
Factor classification was then determined by calculating the impact-asymmetry (IA) index. When the expression of various environmental elements was dissatisfied, neutral, and satisfied, the gradient boosted decision tree (GBDT) model was used to calculate their impact on overall satisfaction (POSS), which was expressed as POSSd, POSSn, and POSSs, respectively. The IA index for the elements were calculated as follows:
  • Range of the impact on overall satisfaction (RIOS) = POSSs − POSSd
  • Satisfaction-generating potential (SGP) = (POSSs − POSSn)/RIOS
  • Dissatisfaction-generating potential (DGP) = (POSSn − POSSd)/RIOS
  • Impact-asymmetry (IA) index = SGP − DGP
Finally, the elements were classified according to the threshold definitions used in Lee and Min: delighter (IA ≥ 0.7), satisfier (0.2 ≤ IA < 0.7), hybrid (−0.2 < IA < 0.2), dissatisfier (−0.7 < IA ≤ −0.2), and frustrator (IA ≤ −0.7) [46].
We developed separate GBDT models for the old town and new town, with the covariates being 11 respondents’ travel characteristics: area of residence, gender, age, educational background, occupation, income, car ownership, daily travel distance, number of rides per week, duration of the ride, and frequency of riding shared bikes. The independent variables were 31 travel environment factors and the dependent variable was overall satisfaction. After 3073 optimal iterations, the model provided the relative impact of satisfaction with the 31 independent variables on overall satisfaction, and we selected environmental factors with a relative impact of at least 2% for further analysis, including 17 in the old urban areas and 14 in the new urban areas.

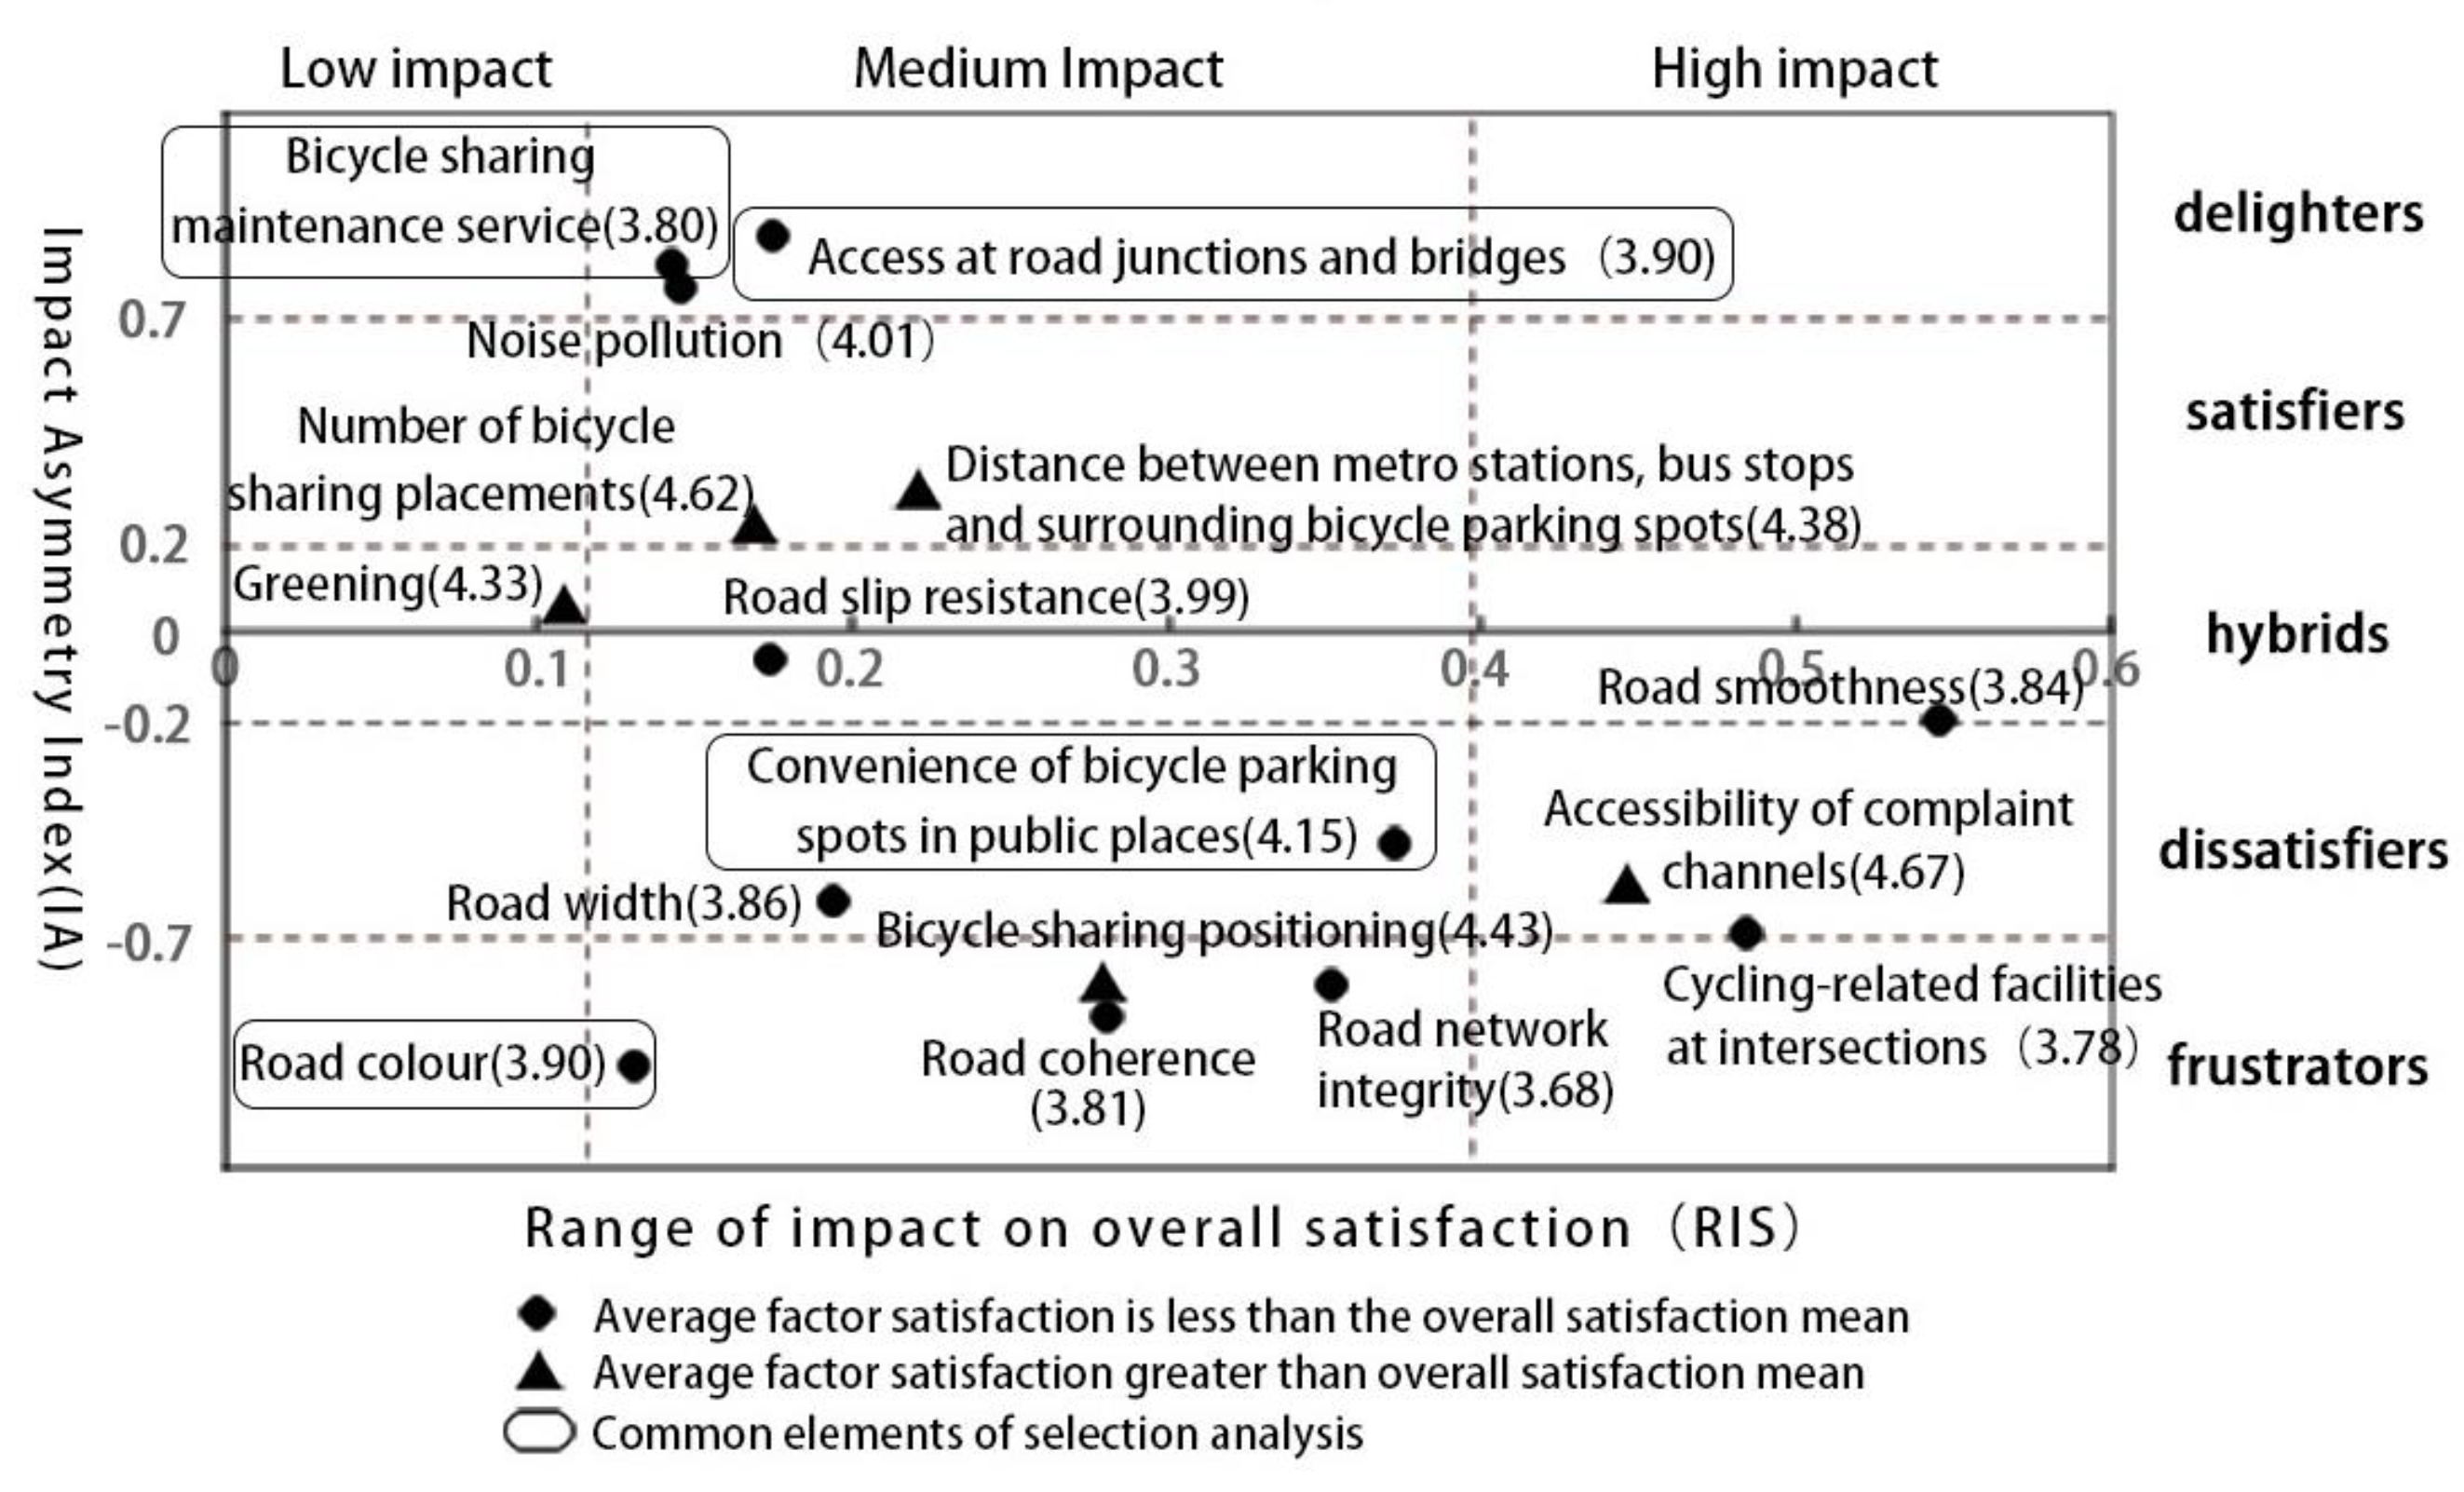
4.2. Impact-Asymmetric Analysis

Table 4 demonstrates the relative influence of various elements of the travel environment in the old urban area on overall satisfaction. Bicycle-related facilities at road intersections had the highest relative impact in the old urban area, accounting for 12.22%. The old urban area road traffic network is complex. The road intersection traffic and traffic flow more, and there is a lack of nonmotor vehicle special lights, nonmotor vehicle driveways or ground traffic signs, and nonmotor vehicles signs such as infrastructure, which reduces the safety of the ride, prevents the guarantee of rider way, causes serious machine conflict, and affects the rider’s travel experience.
In the old urban area, 36.5% of the relative impact derives from the road surface condition, with road smoothness accounting for 10.89%, road network integrity accounting for 8.94%, and road coherence accounting for 6.35%, and these three factors account for the largest proportion. Given the age of the buildings in the old urban area, the road construction standards were low during this period. Harbin is a cold city, and the roads were alternately frozen and thawed under the influence of the climate. In addition, the maintenance was not timely and in place and the road surface was uneven, cracked, and had other problems, which affected cycling comfort. Secondly, the roads in the old urban area are narrow, the population is large, there is a shortage of parking spaces, parking and businesses occupying the roads are serious issues, the space for cycling is squeezed, and the coherence of nonmotorised lanes and the integrity of the road network cannot be guaranteed.
As shown in Figure 5, road smoothness, cycling-related facilities at intersections, and the accessibility of complaint channels have the greatest impact on overall satisfaction in the old town, with road smoothness and cycling-related facilities at intersections being below the overall satisfaction mean. Therefore, they should be prioritised for improvement. Simultaneously, they are dissatisfaction factors, so it is only necessary to improve them to the level expected by cyclists.
The convenience of bicycle parking spots in public places, road network integrity, road coherence, bicycle-sharing positioning, width of cycle lanes, and road colour are in the medium impact range, and they are among the dissatisfaction factors and frustration factors. Therefore, they should be optimised after the elements that have a high impact on overall satisfaction have been improved.
Road slip resistance and greening are performance factors, among which road slip resistance satisfaction is low, and further optimisation is required to improve overall satisfaction. The distance between metro stations, bus stops, and surrounding bicycle parking spots; access at road junctions and bridges; number of bicycle-sharing placements; noise pollution; and bicycle-sharing maintenance services are among the satisfaction and pleasure factors. Satisfaction with access at road junctions and bridges, noise pollution, and bicycle-sharing maintenance services are lower than the overall satisfaction mean. This is due to the high density of roads, road crossings, and overpasses and underpasses in the old town area, which significantly reduce the connectivity and ease of cycling. These elements require improvement to a level above cyclists’ expectations in order to significantly increase overall satisfaction.
As shown in Table 5, services related to bicycle-sharing operations in new urban areas accounted for 46.08% of the overall satisfaction impact, including the number of bicycle-sharing placements, bicycle-sharing maintenance services, bicycle-sharing positioning, riding prices, and accessibility of complaint channels. This is because there is ample space for shared bicycle parking in new urban areas. Respondents in the new district are younger and are able to use mobile phone software to use and locate bicycles skilfully and are more aware of the services and advantages of shared bicycles. Consequently, there are a high number of shared bikes and a high usage rate. In addition, the relative influence of road surface conditions and the cycling environment on overall satisfaction is relatively small in the new urban areas, with a total of 23.79% of the six items.
As shown in Figure 6, in the new urban area, bicycle-sharing maintenance services, the timeliness of snow removal, and air pollution are unsatisfactory factors, which are in the medium range of influence, and their satisfaction is low. Therefore, improvement should be a priority.
Access at road junctions and bridges, road network integrity, and road coherence are dissatisfaction and frustration factors with a low level of satisfaction and a stable impact on overall satisfaction. Therefore, their improvement will not significantly improve overall satisfaction; the more important travel elements should be optimised before improving these three areas, and it is sufficient to improve them to a level that facilitates the basic needs of travellers.
Road colour, distance between metro stations, bus stops, surrounding bicycle parking spots, the convenience of bicycle parking spots in public places, and environmental health are satisfaction and pleasure factors that have a minor impact on overall satisfaction. However, their satisfaction is lower than the average value of overall satisfaction; therefore, they must be improved beyond travellers’ expectations.
The other four factors are all satisfaction and pleasure factors, and they have a strong influence on overall satisfaction because the current level of bike-sharing-related services in the new urban areas is good, and travellers are highly satisfied with them; therefore, they should be maintained.

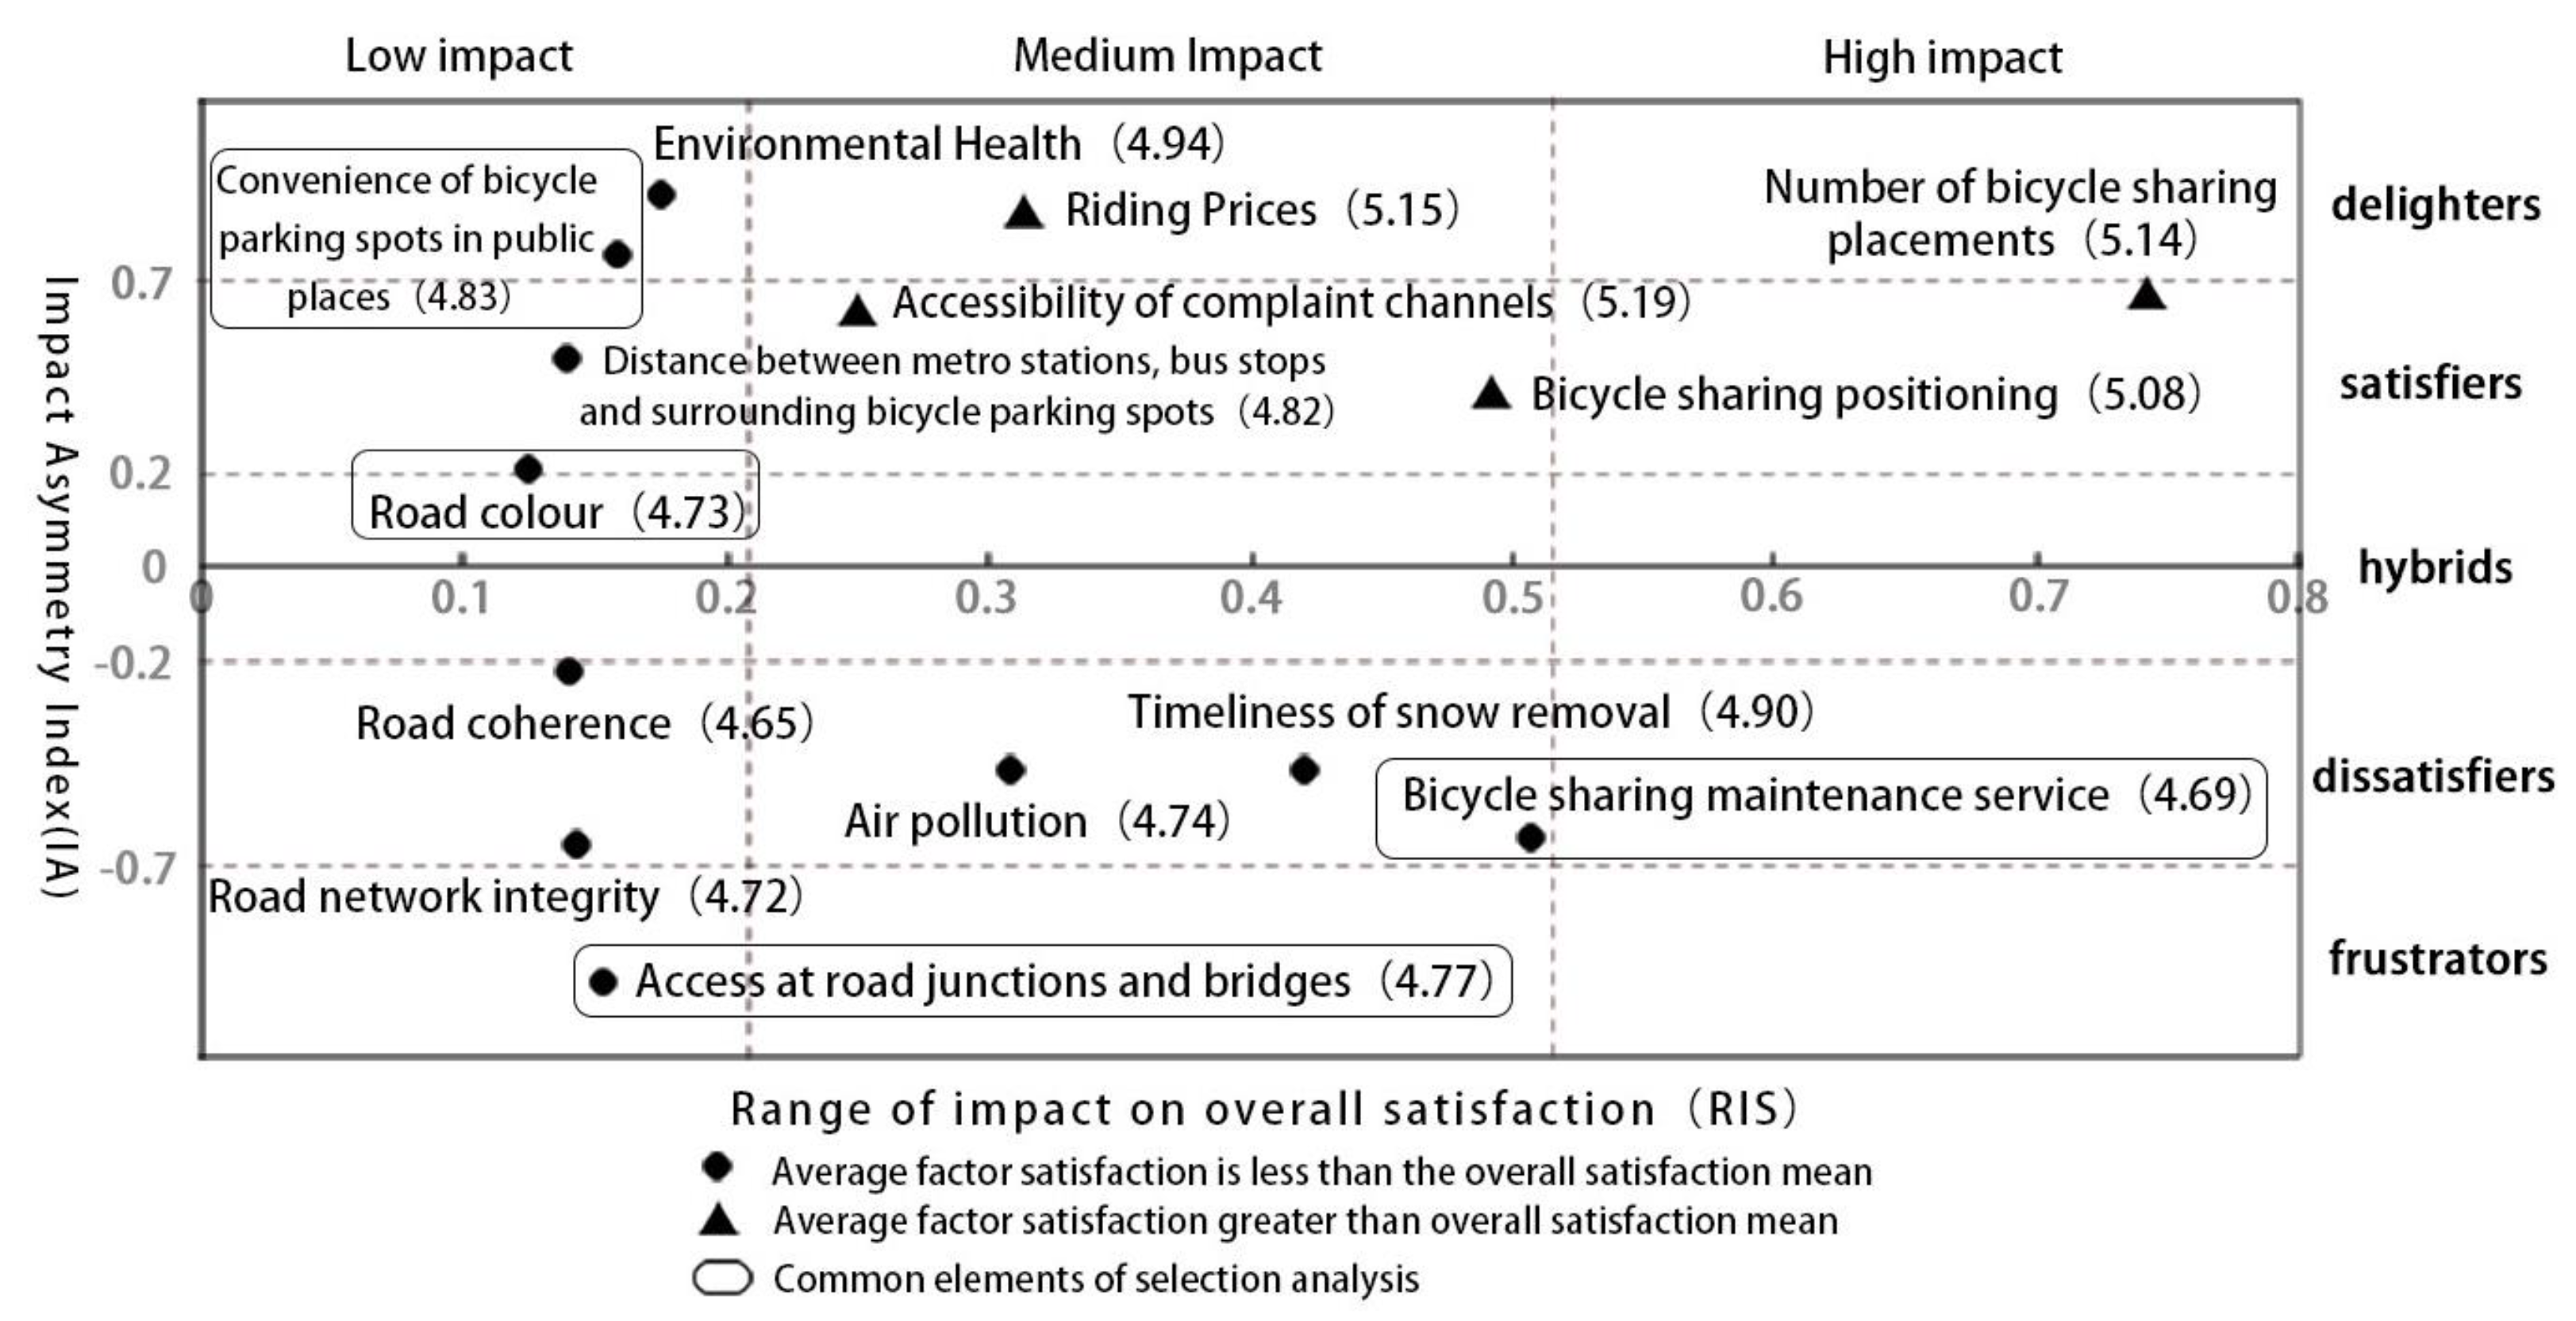
4.3. Differentiation Analysis of New and Old Urban Areas

Among the common environmental factors in both urban areas, four pairs of environmental factors with large factor category gaps and low satisfaction levels were selected for comparative analysis. The convenience of parking in public places is an unsatisfactory factor in the old city, and due to the narrow road space in the old city, there is a serious lack of space for shared bicycle parking. In the new city, it is a pleasant factor, but the satisfaction level is lower than the average value of overall satisfaction.
The satisfaction of bicycle-sharing maintenance service is low in both urban areas, which requires improvement. In the old urban areas, it is a pleasure factor, but in the new urban areas, it is a dissatisfaction factor, which reflects the differences in the needs of travellers in the new and old urban areas. In the old urban area, the maintenance service of shared bikes requires improvement above the expectation of residents to significantly improve the overall satisfaction. This can be gradually improved with sufficient funds. In the new urban area, when the maintenance service is poor, travellers will feel very dissatisfied, and it is necessary to improve the timeliness and effectiveness of shared bike maintenance.
Access at road junctions and bridges is a pleasure factor in the old urban area and a frustration factor in the new urban area, with different needs for improvement. In the old urban area, this problem is not significant because the intersection is small, the traffic flow is dense, the speed is slow, and the single-vehicle traffic is relatively easy. Therefore, to improve the residents’ satisfaction, the improvement must exceed the residents’ expectation value. In the new urban area, the road is wide and straight, the vehicle speed is fast, the intersection scale is wide, the traffic signal time is short, the sense of security of cyclists is reduced, and cyclists cannot easily pass. Safe and effective intersection design is required to meet the basic traffic needs of residents.
The colour of the road is a frustrator in the old town, as nonmotorised lanes are seriously missing and road space is limited; thus, improvements should be made to protect cyclists’ right of way and just meet residents’ expectations. In the new urban area, the road colour is a satisfaction factor and the nonmotorised lanes in the new urban area are divided predominantly in the form of road marking or a green isolation belt, and the cyclists’ right of way is basically guaranteed. This improvement can be considered after the priority improvement in other environmental elements.

5. Conclusions

This study combines impact-asymmetry analysis (IAA) and a gradient boosted decision tree (GBDT) to assess satisfaction with the shared bicycle travel environment in the new and old urban areas of Harbin. This innovative approach provides a detailed classification of travel environment elements and found an asymmetrical relationship between travel environment elements and satisfaction in the new and old urban areas. Consequently, this study improves the research methodology for satisfaction with the shared bicycle travel environment in China. Combined with the regional travel environment, the impact range is used to establish priorities for improvement and propose more precise improvement strategies. The specific findings of the study are as follows:
First, the satisfaction of the bike-sharing travel environment in the old urban area is lower than that in the new urban area. Therefore, it is necessary to focus on improving the bike-sharing travel environment in the old urban area to provide residents with a more friendly and comfortable cycling environment. This study showed that the old urban area must emphasise the problems of “road smoothness“, “cycling-related facilities at intersections“, and “convenience of bicycle parking spots in public places“. Optimising the facilities associated with road junctions can be achieved by setting up special signals and shelters for bicycles. Improving the smoothness of the road surface requires regular maintenance and upkeep, while improving the ease of parking shared bikes can be achieved by examining the location of the drop-off points, the flow of people around the area, and other factors to find the best place to drop off bikes and the best number of bikes to match the area.
Second, the quality of the travel environment in the new urban area is higher than that in the old urban area. In addition, the road infrastructure in the new urban area is relatively perfect, and residents have higher requirements for the environment. Therefore, residents pay more attention to travel quality issues such as bicycle maintenance services and road environmental health, and since they have a greater impact on overall satisfaction, it is vital to improve these issues. These elements are dissatisfiers and have a limited impact on overall satisfaction once residents’ expectations are met. Investment should be optimised so that these elements are met but do not significantly exceed residents’ expectations. Improving the maintenance service for shared bikes could start with improving the quality of the bikes, while underground parking garages could be built to reduce damage to the bikes from external factors. Improvements to the travel environment in new urban areas could improve the timeliness of snow removal in winter as well as the quality of greenery, which could reduce urban air pollution.
Third, 90% of the travel environment elements showed an asymmetric relationship with overall satisfaction. This indicates that cyclists in the new and old urban areas had significantly different expectations for the travel environment of shared bikes. In both old and new urban areas, 14 travel environment elements had asymmetric effects on overall satisfaction, among which nine elements in old urban areas belonged to dissatisfaction factors and frustration factors and five elements belonged to pleasure factors and satisfaction factors. In the new urban area, six elements belong to dissatisfaction factors and frustration factors, and eight elements belong to pleasure factors and satisfaction factors. Therefore, optimisation countermeasures should be formulated according to local conditions to meet residents’ cycling needs. In the differentiated analysis of the old and new urban areas, we compared four pairs of environmental elements. Among them, optimising the convenience of parking in public places in the old urban areas can be achieved by establishing above-ground three-dimensional parking spaces or underground parking garages to meet parking demand, while in the new urban areas, the needs of cyclists in different locations can be met by enhancing the dynamic and balanced management between parking spots. In older urban areas, bicycle-sharing maintenance services need to be significantly improved above residents’ expectations, while in newer urban areas, the timeliness and effectiveness of bicycle maintenance needs to be improved. In older urban areas, improving bicycle access at road junctions and bridges needs to exceed residents’ expectations, while in newer urban areas, cyclist safety needs to be improved and bicycles need to be easier to navigate. In older urban areas, road colour can be optimised by marking nonmotorised lanes and paving, while in newer urban areas, road colour can be prioritised after other environmental elements have been improved.
There are limitations in the application of impact-asymmetry analysis. As there is no relevant theoretical guidance on the selection of asymmetric indicator thresholds, there is no consensus on the selection of thresholds in the previous literature. In 2017, Lai and Hitchcock chose 0.2 and 0.6 as thresholds [47]. Lee and Min (2013) [46], Dong (2019) [41], and Fang (2021) [37] chose 0.2 and 0.7 as the threshold values. In addition, this paper provides a theoretical basis for the optimisation of urban bicycle-sharing travel systems and constructs an asymmetric influence model of satisfaction. However, the scope of the study is limited to Harbin city, and further research can expand the analysis area to more provinces and use multiple information sources such as big data to more accurately analyse the usage characteristics of cyclists and refine the satisfaction of different types of people by analysing information such as cycling time, starting and ending distance, cycling usage gathering locations, surrounding land environment, and type.

Author Contributions

Conceptualisation, D.F. and L.Z.; methodology, D.F. and L.Z.; validation, L.Z.; formal analysis, L.Z. and S.S.; investigation, D.F., Y.C., L.Z., S.S., L.H., Y.X., and Q.Z.; resources, D.F.; writing—original draft preparation, L.Z.; writing—review and editing, L.Z.; visualisation, D.F.; supervision, D.F.; project administration, D.F.; funding acquisition, Y.C. All authors have read and agreed to the published version of the manuscript.

Funding

This research was funded by the Fundamental Research Funds for the Central Universities of China, grant number 2572019BK01.

Institutional Review Board Statement

Not applicable.

Informed Consent Statement

Not applicable.

Data Availability Statement

The basic data are available from the first author upon request.

Acknowledgments

Many thanks to Cao at the University of Minnesota for his guidance on this paper, and to the seniors who helped send out the questionnaires.

Conflicts of Interest

The authors declare no conflict of interest.

References

  1. 2020 Harbin National Economic and Social Development Statistical Bulletin. Available online: http://www.harbin.gov.cn/art/2021/4/30/art_25924_1099261.html (accessed on 25 October 2022).
  2. 2021 Harbin National Economic and Social Development Statistical Bulletin. Available online: http://www.harbin.gov.cn/art/2022/5/18/art_25924_1259352.html (accessed on 25 October 2022).
  3. Annual China Urban Traffic Report 2021. Available online: https://jiaotong.baidu.com/cms/reports/traffic/2021/index.html (accessed on 27 October 2022).
  4. Qin, J. Study on the Alleviating Effect of Shared Mobility on Urban Traffic Congestion; Harbin Institute of Technology: Harbin, China, 2021. [Google Scholar]
  5. Li, J.; Ma, M.; Xia, X.; Ren, W. The Spatial Effect of Shared Mobility on Urban Traffic Congestion: Evidence from Chinese Cities. Sustainability 2021, 13, 4065. [Google Scholar] [CrossRef]
  6. Macioszek, E.; Cieśla, M. External Environmental Analysis for Sustainable Bike-Sharing System Development. Energies 2022, 15, 791. [Google Scholar] [CrossRef]
  7. Macioszek, E.; Granà, A. The Analysis of the Factors Influencing the Severity of Bicyclist Injury in Bicyclist-Vehicle Crashes. Sustainability 2022, 14, 215. [Google Scholar] [CrossRef]
  8. Sun, X.L. A Study on Automotive-Bicycle Traffic Accident Analysis and Simulation; Harbin Institute of Technology: Harbin, China, 2015. [Google Scholar]
  9. Sorkou, T.; Tzouras, P.G.; Koliou, K.; Mitropoulos, L.; Karolemeas, C.; Kepaptsoglou, K. An Approach to Model the Willingness to Use of E-Scooter Sharing Services in Different Urban Road Environments. Sustainability 2022, 14, 15680. [Google Scholar] [CrossRef]
  10. Mo, H.; Wei, Z.; Zhai, Q. Travel Behaviors and Influencing Factors of Bike Sharing in Old Town: The Case of Guangzhou. South. Archit. 2019, 1, 7–12. [Google Scholar] [CrossRef]
  11. Sener, I.N.; Eluru, N.; Bhat, C.R. An analysis of bicycle route choice preferences in Texas, US. Transportation 2009, 36, 511–539. [Google Scholar] [CrossRef] [Green Version]
  12. Winters, M.; Davidson, G.; Kao, D.; Teschke, K. Motivators and deterrents of bicycling: Comparing influences on decisions to ride. Transportation 2011, 38, 153–168. [Google Scholar] [CrossRef]
  13. Li, Z.; Wang, W.; Liu, P.; Ragland, D. Physical environments influencing bicyclists’perception of comfort on separated and on-street bicycle facilities. Transp. Res. Part D Transp. Environ. 2012, 17, 256–261. [Google Scholar] [CrossRef]
  14. Hull, A.; O’ Holleran, C. Bicycle infrastructure: Can good design encourage cycling? Urban Plan Transp. Res. 2014, 2, 369–406. [Google Scholar] [CrossRef] [Green Version]
  15. Pan, H.J.; Zhu, W.; Wang, D. Evaluation and Improvement of Bicycle Travel Environment Based on the Cycling Route Choice Behavior. Shanghai Urban Plan. Rev. 2014, 2, 12–18. [Google Scholar] [CrossRef]
  16. Guo, C. Research of Cyclists’ Satisfaction on Urban Road; Chang ‘an University: Xi’an, China, 2014. [Google Scholar] [CrossRef]
  17. Zhu, W.; Zhai, B.X.; Jian, D. Evaluation and Optimization of Urban Bicycle Travel Environment based on a Visualized SP Method: Model construction and application in central Shanghai. Urban Plan. Forum. 2016, 3, 85–92. [Google Scholar] [CrossRef]
  18. Guo, Y.; Zhou, J.-B.; Wu, Y.; Li, Z. Identifying the factors affecting bike-sharing usage and degree of satisfaction in Ningbo, China. PLoS ONE 2017, 12, 1851. [Google Scholar] [CrossRef] [PubMed] [Green Version]
  19. Zhou, S.M. Study on Influence Factors of Satisfaction of Shared Bicycle User: In the Case of Kunming. Logist. Technol. 2017, 36, 35–39. [Google Scholar] [CrossRef]
  20. Hardinghaus, M.; Papantoniou, P. Evaluating Cyclists’ Route Preferences with Respect to Infrastructure. Sustainability 2020, 12, 3375. [Google Scholar] [CrossRef] [Green Version]
  21. Xu, J.; Xu, M.; Zhang, L.; Guo, J. Research on Construction and Activation of Cyclist Satisfaction Model. Mod. Urban Res. 2021, 5, 77–82. [Google Scholar] [CrossRef]
  22. Liu, Y. Research on the Impact of Residents’ Travel Behavior Based on the Improvement of Cycling Environment on Bicycle Tracks; Beijing Jiaotong University: Beijing, China, 2021. [Google Scholar]
  23. Qian, J.; Wang, D.; Niu, Y. Analysis of factors influencing urban residents’ satisfaction with the use of public bicycles in the city: A case study of Suzhou City. Geogr Res. 2014, 33, 358–371. [Google Scholar] [CrossRef]
  24. Feng, Y. Survey Research on Urban Residents’ Satisfaction with Shared Bicycles: Based on Survey Data of Nanchang City in 2017. Res. World 2018, 7, 13–18. [Google Scholar] [CrossRef]
  25. Li, F.Y.; Zhang, R.F. Significance Degree of Customer Demands of Sharing Bike Based on Kano Model. Packag. Eng. 2018, 39, 5. [Google Scholar] [CrossRef]
  26. Zhang, C.; Cao, X.; Nagpure, A.; Agarwal, S. Exploring rider satisfaction with transit service in Indore, India: An application of the three-factor theory. Transp. Lett. Int. J. Transp. Res. 2019, 11, 469–477. [Google Scholar] [CrossRef]
  27. Cui, J.C.; Fang, B.; Ren, Y. Influence Factors of Residents’ Commuting Satisfaction Based on Structural Equation Model: A Case Study of Yangzhou. Mod. Urban Res. 2018, 4, 115–122. [Google Scholar] [CrossRef]
  28. Cao, J.; Cao, X. Comparing importance-performance analysis and three-factor theory in assessing rider satisfaction with transit. J. Transp. Land Use 2017, 10, 65–68. [Google Scholar] [CrossRef] [Green Version]
  29. Fang, D.W.; Wang, X.; Sun, S. Optimization Strategies of Bus Transit Service Quality Based on IPA-Kano Model: A Case Study of Public Transport in Harbin. Sci. Technol. Eng. 2020, 20, 13454–13459. [Google Scholar]
  30. Sun, S.; Fang, D.W.; Cao, J. Exploring the asymmetric influences of stop attributes on rider satisfaction with bus stops. Travel. Behav. Soc. 2020, 19, 162–169. [Google Scholar] [CrossRef]
  31. Yin, J.B.; Cao, J.; Huang, X.Y. Association between subway and life satisfaction: Evidence from Xi’ an, China. Transp. Res. Part D Transp. Environ. 2021, 96, 102869. [Google Scholar] [CrossRef]
  32. Kano, N.; Seraku, N.; Takahashi, F.; Tsuji, S. Attractive quality and must-be quality. J. Jpn. Soc. Qual. Control 1984, 14, 39–48. [Google Scholar]
  33. Berger, C.; Blauth, R.; Boger, D. Kano’s methods for understanding customer-defined quality. Cent. Qual. Manag. J. 1993, 2, 3–35. [Google Scholar]
  34. Matzler, K.; Sauerwein, E.; Heischmidt, K. Importance-performance analysis revisited: The role of the factor structure of customer satisfaction. Serv. Ind J. 2003, 23, 112–129. [Google Scholar] [CrossRef]
  35. Mikuli, J.; Prebeac, D. Prioritizing improvement of service attributes using impact range-performance analysis and impact-asymmetry analysis. Manag. Serv. Qual. 2008, 18, 559–576. [Google Scholar] [CrossRef]
  36. Wu, X.; Cao, X.; Ding, C. Exploring rider satisfaction with arterial BRT: An application of impact asymmetry analysis. Travel. Behav. Soc. 2020, 19, 82–89. [Google Scholar] [CrossRef]
  37. Fang, D.; Xue, Y.; Cao, J.; Sun, S. Exploring satisfaction of choice and captive bus riders: An impact asymmetry analysis. Transp. Res. Part D Transp. Environ. 2021, 93, 102798. [Google Scholar] [CrossRef]
  38. Friedman, J.H. Greedy Function Approximation: A Gradient Boosting Machine. Ann. Stat. 2000, 29, 1189–1232. [Google Scholar] [CrossRef]
  39. Ding, C.; Wu, X.; Yu, G.; Wang, Y. A gradient boosting logit model to investigate driver’s stop-or-run behavior at signalized intersections using high-resolution traffic data. Transp. Res. Part C Emerg. Technol. 2016, 72, 225–238. [Google Scholar] [CrossRef]
  40. Zhang, Y.; Haghani, A. A gradient boosting method to improve travel time prediction. Transp. Res. Part C Emerg. Technol. 2015, 58, 308–324. [Google Scholar] [CrossRef]
  41. Dong, W.; Cao, X.; Wu, X.; Dong, Y. Examining pedestrian satisfaction in gated and open communities: An integration of gradient boosting decision trees and impact-asymmetry analysis. Landsc. Urban Plan. 2019, 185, 246–257. [Google Scholar] [CrossRef]
  42. Ding, C.; Cao, X.; Næss, P. Applying gradient boosting decision trees to examine non-linear effects of the built environment on driving distance in Oslo. Transp. Res. Part A Policy Pract. 2018, 110, 107–117. [Google Scholar] [CrossRef]
  43. Tao, T.; Wang, J.Y.; Cao, X.Y. Exploring the non-linear associations between spatial attributes and walking distance to transit. J. Transp. Geogr. 2020, 82, 102560. [Google Scholar] [CrossRef]
  44. Zhang, W.; Zhao, Y.; Cao, X.; Lu, D.; Chai, Y. Nonlinear effect of accessibility on car ownership in Beijing: Pedestrian-scale neighborhood planning-ScienceDirect. Transp. Res. Part D Transp. Environ. 2020, 86, 102445. [Google Scholar] [CrossRef]
  45. Shao, Q.; Zhang, W.; Cao, X.; Yang, J.; Yin, J. Threshold and moderating effects of land use on metro ridership in Shenzhen: Implications for TOD planning. J. Transp. Geogr. 2020, 89, 102878. [Google Scholar] [CrossRef]
  46. Lee, J.S.; Min, C.K. Prioritizing convention quality attributes from the perspective of three-factor theory: The case of academic association convention. Int. J. Hosp. Manag. 2013, 35, 282–293. [Google Scholar] [CrossRef]
  47. Lai, I.; Hitchcock, M. Sources of satisfaction with luxury hotels for new, repeat, and frequent travelers: A PLS impact-asymmetry analysis. Tour. Manag. 2017, 60, 107–129. [Google Scholar] [CrossRef]
Figure 1. Regional division of the new and old urban areas in Harbin. Source: modified according to the impression of Harbin.
Sustainability 15 01670 g001
Figure 2. Comparison of travel environment between new and old urban areas ((ad) for old urban areas, (eg) for new urban areas). (a) Jingyu Business Circle, Daowai District; (b) Central Street Business Circle, Daoli District.; (c) Qiulin Business Circle, Nangang District; (d) Lesong Business Circle, Xiangfang District; (e) Wanda Business Circle, Haxi New District; (f) Wanxianghui Business Circle, Songbei District; (g) Qunli Business Circle, Qunli New District.
Sustainability 15 01670 g002aSustainability 15 01670 g002b
Figure 3. Impact-asymmetric analysis based on three-factor theory.
Sustainability 15 01670 g003
Figure 4. Transcoding map of travel environment elements.
Sustainability 15 01670 g004
Figure 5. Impact-asymmetry analysis matrix of the bike-sharing travel environment in old urban areas. Note: the numbers in brackets are the average satisfaction for each element.
Sustainability 15 01670 g005
Figure 6. Impact-asymmetry analysis matrix for the shared bicycle travel environment in new urban areas. Note: the numbers in brackets are the average satisfaction for each element.
Sustainability 15 01670 g006
Table 1. Evaluation index system of bicycle travel environment.
First Level
Indicator
Secondary
Indicators
Tertiary Indicators
ComfortRoad surface conditionWidth of cycle lanes
Road smoothness
Road colour
Waterlogging of roads
Timeliness of snow removal
Illegal occupation of cycle paths
Cycling environmentArchitectural views and landmarks along the cycle path
Greening effect
Air pollution
Environmental Health
Noise pollution
SafetyRoad facilitiesRoad surface skid resistance
Street lighting
Segregation effect of the bicycle lane barrier
Cycling-related facilities at intersections
Crowd behaviourLane grabbing by motor vehicles and bicycles
Occupation of cycle lanes by buses when parking
Retrograde traffic in cycle lanes
Bicycle body safetyBicycle-sharing body mass
ConsistencyRoad connectionsRoad coherence
Access at road junctions and bridges
Road network integrity
OperationBicycle parkingDistance between metro stations, bus stops,
and surrounding bicycle parking spots
Convenience of bicycle parking spots in public places
Convenience of single car parking facilities in the community
Related servicesNumber of bicycle-sharing placements
Bicycle-sharing maintenance service
Bicycle-sharing positioning
Time for the deposit to arrive after applying for a deposit refund
Accessibility of complaint channels
Riding prices
Table 2. Road condition survey of nonmotorised lanes near business districts in new and old urban areas.
Urban
Divisions
District NameRoad NameRoad LevelPresence or
Absence of
Nonmotorised Lanes
Whether There Is Any Motor Vehicle TrafficNonmotorised Lane FormWith Other Lane Splitting MethodsWhether There Is Green
Separation Belt
Bicycle Signs or NotBike Lane Signage or NotNonmotorised Lane Width (m)
OlddistrictJingyu Business
Circle, Daowai District
North Seventh StreetSecondary trunk roadNoYesNoNoNoNoNoNo
Jingyang StreetSecondary trunk roadYesYesMotor and nonmotor vehicle separatedRoad markingNoNoNo0.6
Changchun StreetBranch roadNoYesNoNoNoNoNoNo
Central Street
Business Circle, Daoli District
Youyi RoadArterial roadYesNoMotor and nonmotor vehicle separatedRoad markingNoYesNo0.7
Shangzhi StreetSecondary trunk roadYesNoMotor and nonmotor vehicle separatedRoad markingNoYesNo1.2
Stalin StreetBranch roadNoYesNoNoNoNoNoNo
Songbei Business Circle, Nangang
District
Dongdaizhi StreetArterial roadOne sided with roadYesMotor and nonmotor vehicle separatedRoad markingNoNoNo0.7
Minyi StreetSecondary trunk roadNoYesNoNoNoNoNoNo
Post StreetBranch roadNoYesNoNoNoNoNoNo
Lesong Business
Circle, Xiangfang District
Hexing
Road
Arterial roadNoNoNoNoNoNoNoNo
Songxin StreetBranch roadYesYesMotor and nonmotor vehicle separatedRoad markingNoNoNo2.0
Xingfu RoadBranch roadNoYesNoNoNoNoNoNo
New districtWanda
Business Circle,
Haxibusiness District
Haxi StreetArterial roadYesNoMotor and nonmotor vehicle separatedRoad markingNoYesNo2.5
Harmony RoadArterial roadYesYesMotor and nonmotor vehicle separatedRoad markingNoYesYes1.8
Zhongxing StreetSecondary trunk roadYesYesShared-use sidewalkRoad dividersYesYesYes1.5
Wanxianghui
Business Circle,
Songbei District
World Trade BoulevardArterial roadYesYesMotor and nonmotor vehicle separatedRoad markingNoNoNo1.2
Expo RoadSecondary trunk roadYesYesShared-use sidewalkRoad dividersYesYesNo0.6
Long Tang StreetSecondary trunk roadYesYesMotor and nonmotor vehicle separatedRoad markingNoNoNo1.8
Qunli Business Circle,
Qunli
New District
Qunli AvenueArterial roadYesNoShared-use sidewalkRoad dividersYesYesYes2.0
Rongjiang RoadSecondary trunk roadYesYesShared-use sidewalkRoad dividersYesYesYes2.0
Yuanjiang RoadBranch roadYesYesMotor and nonmotor vehicle separatedRoad markingNoYesNo0.7
Table 3. Basic information collection of respondents.
Demographic
Information
ClassificationPercentage
Old Urban AreaNew Urban Area
GenderMale47.8%52.2%
Female52.2%47.8%
Age12–18 years old6.6%2.2%
19–35 years old48.4%71.3%
36–59 years old42.9%23.9%
60+ years old2.2%2.6%
Academic qualificationsJunior high school and below2.7%2.6%
High school17.0%4.3%
University61.5%82.6%
Graduate and above18.7%10.4%
ProfessionalStudent31.3%51.3%
Commuter50.0%36.1%
Individual worker2.7%2.6%
Freelancer7.7%4.3%
Retired3.3%2.6%
Other4.9%3.0%
Personal monthly income<100016.5%34.3%
1000–383434.1%23.9%
3835–599923.6%21.3%
6000–10,00015.4%13.5%
More than 10,00010.4%7.0%
Number of travel weeks1 or less27.4%28.7%
2 to 3 times43.4%47.8%
4 to 7 times13.7%16.1%
8 to 10 times7.7%1.3%
More than 10 times7.7%6.1%
Length of travel0 to 10 min12.6%17.4%
11–20 min33.5%40.8%
21–30 min29.7%26.1%
31–40 min12.1%12.4%
41–60 min4.9%3.2%
1 h or more7.1%5.5%
Travel purposeGo to work25.0%16.5%
Go to school9.2%17.0%
Exercise21.9%21.9%
Shopping19.4%16.0%
Play21.6%25.2%
Other2.8%3.3%
Table 4. Impact-asymmetry analysis of travel environment elements in old urban areas.
Environmental
Elements
Relative
Importance (%)
RIOSSGPDGPIAClassificationSatisfaction
Average
Cycling-related facilities at intersections12.220.480.150.85−0.69Dissatisfier3.78
Road smoothness10.890.550.400.60−0.21Dissatisfier3.84
Road network integrity8.940.350.090.91−0.82Frustrator3.68
Convenience of bicycle parking spots in public places6.590.370.250.75−0.49Dissatisfier4.15
Road coherence6.350.280.0580.94−0.88Frustrator3.81
Accessibility of complaint channels4.700.450.200.80−0.59Dissatisfier4.67
Bicycle-sharing positioning4.090.280.080.92−0.83Frustrator4.43
Road width4.050.190.190.81−0.62Dissatisfier3.86
Access at road junctions and bridges3.770.180.950.050.90Delighter3.90
Distance between metro stations, bus stops, and surrounding bicycle parking spots3.720.220.650.350.31Satisfier4.38
Road slip resistance3.380.170.470.53−0.07Hybrid3.99
Bicycle-sharing maintenance service3.050.140.920.080.84Delighter3.80
Road colour2.890.1301−1Frustrator3.90
Number of bicycle-sharing placements2.240.170.610.390.22Satisfier4.62
Travel distance2.220----------
Noise pollution2.170.150.900.100.80Delighter4.01
Greening2.170.110.520.480.04Hybrid4.33
Table 5. Impact-asymmetry analysis of travel environment elements in new urban areas.
Environmental ElementsRelative
Importance (%)
RIOSSGPDGPIAClassificationSatisfaction
Average
Number of bicycle-sharing placements15.580.740.830.170.65Satisfier5.14
Bicycle-sharing maintenance service9.420.510.180.82−0.64Dissatisfier4.69
Bicycle-sharing positioning8.490.490.710.290.41Satisfier5.08
Riding prices7.920.310.920.080.84Delighter5.15
Timeliness of snow removal6.670.420.260.74−0.48Dissatisfier4.90
Environmental health5.970.180.950.050.90Delighter4.94
accessibility of complaint channels4.670.250.800.200.61Satisfier5.19
Convenience of bicycle parking spots in public places4.270.160.870.130.75Delighter4.83
Air pollution3.650.310.260.74−0.48Dissatisfier4.74
Distance between metro stations, bus stops, and surrounding bicycle parking spots3.290.140.750.250.50Satisfier4.82
Road coherence2.530.140.380.62−0.24Dissatisfier4.65
Road network integrity2.490.140.170.83−0.66Dissatisfier4.72
Road colour2.480.130.620.380.24Satisfier4.73
Access at road junctions and bridges2.240.150.010.99−0.99Frustrator4.77
Disclaimer/Publisher’s Note: The statements, opinions and data contained in all publications are solely those of the individual author(s) and contributor(s) and not of MDPI and/or the editor(s). MDPI and/or the editor(s) disclaim responsibility for any injury to people or property resulting from any ideas, methods, instructions or products referred to in the content.

