1. Introduction
There are spatial differences in the production of dairy products due to differences in natural resource endowments and certain other factors. Consequently, it is challenging to match global dairy production and consumption fully [
1]. The dairy trade has become vital to balance the regional supply and demand and promote industrial restructuring, effectively alleviating the pressure on resources and the environment [
2].
Since the beginning of the 21st century, through the further strengthening of global economic openness, the proportion of dairy trade in international trade has also been increasing [
3]. From 2010–2014, global dairy exports grew at a rate of 4.6% [
4]. Global dairy trade value will grow by 2.10–13.95% by the year 2030 [
5]. However, the general global supply of dairy products is tight due to overall economic changes, dairy prices, agricultural politics, and the COVID-19 pandemic [
6,
7,
8,
9,
10,
11]. The U.S. Department of Agriculture (USDA) forecast reports that Australia and New Zealand are likely to be affected by weather, and the expected milk production will decrease by 0.5% and 3.3% on a yearly basis, respectively. Furthermore, milk production in the European Union is expected to display a downfall of 1.9%, owing to tight energy supplies and hot and dry weather. At large, milk production is expected to decline by 0.5% in 2022, leading to relative tightness of the global dairy supply. OECD-FAO Agricultural Outlook 2022–2031 points out that political conflicts, the COVID-19 pandemic, and several other factors have further influenced the global value chain, affecting the supply logistics’ network of manufacturing and production. Therefore, it is likely that the global dairy trade pattern is significantly changing [
6,
12].
In addition, globalization will lead to specialization and networking of dairy trade, increase interconnectivity and interdependence among countries. However, there needs to be more analysis of the evolving dairy trade system from a network perspective. This paper aims to further deepen our understanding of the global dairy trade from the perspective of complex networks. This paper innovatively uses the CNA method to describe the evolutionary characteristics of the global dairy trade network from overall structure, individual structure, and core–periphery structure. Additionally, the QAP regression method is used to analyze the influencing factors of the global dairy trade network. The main goals of this paper are the following three.
Goal 1: To explore the evolutionary characteristics of the global dairy trade pattern.
Goal 2: To analyze the influencing factors affecting the global dairy trade pattern.
Goal 3: To make recommendations for the sustainable development of the global dairy trade.
The remainder of this study is organized as follows.
Section 2 reviews extant literature on dairy trade and trade networks.
Section 3 presents the research methodology and data sources.
Section 4 and
Section 5 perform the empirical analysis with interpretation and further discussion of the study results. Lastly,
Section 6 summarizes the conclusions of this research study.
2. Literature Review
Why is the global dairy trade happening? There are three main theories that can explain it.
Adam Smith and David Ricardo put forward the theory of absolute advantage: a country should export products with higher production technology and lower production costs than other countries, and import products with lower production technology and higher production costs.
David Ricardo further deepened the theory by proposing the theory of comparative advantage: trade between countries arises from the relative differences in production technology and production costs of the same product.
The neoclassical trade school, represented by Heckscher–Ohlin, proposed the theory of factor shares: resource endowment determines the price of that resource, which affects the price competitiveness of products. Countries should export products that are relatively abundant in their resources and import products that are relatively scarce in resources.
Based on the above three theories, scholars have conducted a lot of research on the global dairy trade. The existing research mainly focuses on three aspects.
First, the current trade situation and trade potential. Hockmann et al. analyze the competitiveness of the dairy products trade in Belarus and suggest that Belarusian milk powder and condensed milk are highly competitive [
13]. Similarly, Xu et al. measure the trade competitiveness index of Australian and New Zealand dairy products and affirm the significance of these two countries in the context of international dairy products trade [
14]. Santos, B.R.L. et al. used the diamond model to compare the competitiveness of dairy products in Brazil and Uruguay. The results show that Uruguay has a more efficient and competitive dairy production [
15].
Second, the impact of participation in the dairy trade. More points out that Ireland is the world’s largest infant formula producer, and the rapid development of the global dairy trade has placed higher quality requirements on its products [
16]. Trade may exacerbate the negative influence if there are product quality problems. For example, Pinior, B et al. argue that trade in dairy products may accelerate the spread of contaminated milk, and exacerbate the risk of disease transmission [
1]. Huang, J.K. et al. pointed out that China will continue to increase its dairy imports over the next decade. It could provide opportunities for many exporting countries to expand production and conserve global resources [
17]. However, not all possible impacts of the dairy trade are negative. Wu et al. report that the dairy trade alleviates the pressure on global carbon emissions [
18,
19,
20].
Third, the influencing factors of dairy trade factors. We produced
Table 1 based on the last five years of research on factors influencing dairy trade [
21,
22,
23,
24,
25,
26,
27,
28,
29].
The proposed results greatly enrich the research in the field of dairy trade but are mainly based on a static perspective. In addition, these results do not dynamically portray the evolution characteristics of the dairy trade pattern. There is a need to understand the evolution of dairy trade patterns and the factors influencing them from a dynamic perspective. The CNA offers a methodological approach to address these questions by focusing on projected associations and attempting to reflect nodes’ position and overall characteristics of the regional network. Since the 21st century, some studies have incorporated this method into international trade research and concluded that international trade networks demonstrate typical characteristics such as high clustering coefficients, small-world attributes, and scale-free distributions [
30,
31]. Consistent with these studies, scholars attach weights to the trade network since they analyze the topology of the trade network and infer that the country’s GDP, trade policies, and other factors affect the global trade network [
32,
33,
34]. Presently, complex network analysis methods have been widely used in international trade, focusing on energy and agricultural products [
35,
36,
37,
38,
39], with relatively less focus on the dairy products’ trade network pattern.
Based on the studies above, this research study adopts CNA to analyze the evolutionary characteristics and influencing factors of the global dairy trade network. The notable research contributions of this paper are to examine the influencing factors of dairy trade networks from the perspectives of differences in economic development levels, geographical distance differences, common languages, shared borders, and joint regional trade agreements. Thus, this research paper provides a reference for the sustainable development of the dairy trade.
3. Materials and Methods
3.1. Global Dairy Trade Network Construction
This study establishes a global dairy trade network G = (A, W, T) with the help of UCINET 6.0 software. From the perspective of complex network theory, the countries represent the nodes, the edges denote the trade flows, and the export value means the weight. In case country i exports dairy products to country j in year t, an edge between node i and node j is established, and aij(t) = 1, Wij(t) = export value. Contrary to this, there is no edge between i and j, and aij(t) = 0, Wij(t) = 0.
3.2. Network Analysis Indicators
3.2.1. Node Degree and Distribution of Node Degree
The node degree denotes the number of all nodes in the network that are connected to a specific node. It can reflect the degree of diversification of a country’s trade objects [
35]. The higher the node degree, the more countries trade with that country [
40]. Furthermore, node degree can be divided into in-degree and out-degree based on the trade flow. The in-degree refers to the number of countries that country
i imports and the out-degree refers to the number of countries that country
i exports. The sum of the in-degree and out-degree is reported as the node degree, which is estimated with the help of below mathematical expression:
where
ki,
kin,
kout,
N represent the node degree of node
i, out-degree of node
i, in-degree of node
i, and the total number of nodes, respectively.
The node degree distribution can be expressed as
p(
k) =
nk/
n when there are
nk nodes with node degree
k for a network with
n nodes. The cumulative distribution of
P(
k ≥
k0) is as follows:
where
P(
k ≥
k0), and
kmax show the cumulative distribution of node degrees and the maximum node degree, respectively. The network is assumed scale-free when the node degree distribution of each node in this network conforms to the power–law distribution of Equation (5) [
41]. A few nodes hold several connections in a scale-free network, whereas most countries possess a small number of connections.
3.2.2. Node Strength
Node strength highlights the connection between a node and all its connected nodes. The trade flow size is used as a metric in this paper. In addition, node strength represents the sum of out-strength and in-strength. The higher the node strength, the higher the significance and influence of the node in the network.
where
sout,
sin stands for out-strength and in-strength respectively, whereas
wij,
wji indicate the trade value from country
i to country
j and the trade value from country
j to country
i, respectively.
3.2.3. Density
Network density connotes the overall closeness between countries in a trade network. The higher the network density, the closer the trade relationship between the countries in the trade network. The mathematical expression for the density of the directed trade network is as follows [
42]:
where
D,
A, and
N mean the network density, the number of trade links actually occurring, and the number of all countries, respectively.
3.2.4. Reciprocity Coefficient
The reciprocity coefficient evaluates the extent to which two-way trade occurs between two countries in a trade network. The higher the reciprocity coefficient, the greater the trade complementarity between the two countries. The reciprocity coefficient is estimated below [
43]:
where
ρ represents the reciprocity coefficient.
aij = 1 if there is a trade relationship between
i and
j, otherwise
aij = 0. Lastly,
N denotes the number of nodes.
3.2.5. Average Distance
The average distance represents the average closest distance between countries to generate links. It serves as one of the indicators to measure the efficiency of connectivity between countries. The shorter the average distance, the higher trade accessibility and trade probability between two countries. The expression to estimate the average distance is as follows [
44]:
where
L denotes the average distance,
N represents the number of nodes, and
d(
i,
j) shows the shortest path between node
i and node
j in the network.
3.2.6. Average Clustering Coefficient
The clustering coefficient measures the closeness between two countries that are connected to the same country in a trade network. A higher clustering coefficient indicates better connectivity between neighboring countries. The average of all clustering coefficients is termed the average clustering coefficient, which is computed as [
44]:
where
C reflects the average clustering coefficient,
N means the number of nodes, and
ki shows the node degree of node
i.
3.2.7. Core–Periphery Structure
Both weighted and unweighted commodity trade networks exhibit a core–periphery structure for inter-country commodity trade [
32,
45]. Periphery countries demonstrate fewer ties with other countries, whereas core countries will display direct ties with most of the network. The core degree of each node is calculated in this paper based on a continuous core–periphery model. A particular core degree is assigned to each point in the continuous model, with a maximization condition that needs to be satisfied as below:
where
c denotes the core degree of each node, the core–periphery structure exists when
ρ reaches its maximum value [
46]. A node core degree greater than 0.1 serves as a core country, while a node core degree less than 0.01 means a periphery country, and a node core degree between 0.01 and 0.1 represents a semi-periphery country.
3.3. QAP Analysis Method
QAP analysis method is a non-parametric estimation resampling method to study the correlation between two “relationship matrices”. It is difficult to use OLS and other conventional statistical tests for relational data because these tests have relatively strict assumptions. The nodes in the network are connected, which is not consistent with the assumption of independent and homogeneous distribution. Meanwhile, there are correlations between various independent variables. If the traditional test method is used, the problem of multicollinearity will occur, increasing the variance of the parameter estimates, and the suggestion of significance of the variables will lose significance [
47]. Compared with traditional OLS regression, QAP regression has advantages in dealing with multi-collinearity and structural autocorrelation, and it is widely used in empirical models based on relational data regression [
48,
49,
50]. Therefore, this paper uses QAP regression to analyze the influencing factors of global dairy trade networks. QAP regression method majorly ascertains the association between multiple relationship matrices and one relationship matrix to exhibit the establishment of several relationships for another relationship impact. The calculation methods are as follows. Firstly, the matrix needs to be transformed into a long vector and compute the correlation coefficient between the two variables. Secondly, the rows and corresponding columns should be randomly replaced in the matrix to calculate the regression coefficients between the matrices after the replacement. This process should be repeated to obtain the regression coefficients’ distribution. Thirdly, there is also a need to determine whether the results derived in the first step fall into the distribution’s acceptance domain while examining the significance of the regression coefficients. In this paper, the QAP regression method is applied to study the influencing factors of the global dairy products trade network based on the relationship matrix of dairy products between countries and their relationship matrix of influencing factors.
Present studies focus on the factors influencing trade associations between countries based on the following aspects.
(1) The difference in the level of economic development between countries: The classical gravity model theory suggests a positive correlation between the size of trade between two countries and the size of the economy between countries [
51]. Based on the theory of comparative advantage, countries import products with comparative disadvantages, develop industries with advantages, and export products with comparative advantages. Since differences in the level of economic development lead to differences in industrial structure, the higher the difference in the level of economic development and the higher the industrial gap, the higher the chances that trade will happen.
(2) Differences in income levels: The preference similarity theory holds that countries with similar income levels may have similar preferences. Therefore, there is a trade demand between these countries [
52]. Since income level affects the structure of food consumption, higher income levels not only increase the general level of food consumption but also the demand for protein foods in the dietary structure of the population [
35]. Therefore, the smaller the income difference, the more likely it is that trade will occur.
(3) Population size: Population size represents market size to a certain extent [
52]. The larger the gap in population size, the more significant the gap in market size, and the more likely it is that there is a shortage or surplus of goods, thus facilitating trade to occur.
(4) Geographical distance: The proximity between nations is an important factor that affects trade. The closer two countries are, the lower the trade risks and transportation costs and the higher the possibility of trade [
53].
(5) Shared border: McCallum proposed the famous “border puzzle” in 1995, thereby putting forward that the proximity of land is also an imperative factor that affects the scale of trade [
54]. Shared borders facilitate bilateral trade due to the lower cost of foreign transportation [
55,
56]. Countries with shared borders are more likely to trade due to similarities in lifestyles and food habits.
(6) Cultural differences: Cultural differences also serve as an important factor affecting trade. Countries with similar cultural backgrounds are more inclined to form stable, trusting associations with each other to promote trade relationships [
57,
58].
(7) Regional trade agreements: The signing and upgrading of trade agreements are conducive to communication and consultation among countries in the organization for strengthening trade ties ad resolving trade issues [
59].
Equation (15) is established in this paper based on existing studies to analyze the influencing factors of the global dairy trade network. The specific meaning of each variable and data treatment are populated in
Table 2.
3.4. Data Sources
HS codes are used in this study to determine the classification of dairy products [
2], particularly un-concentrated milk and cream (HS0401), solid milk and cream (HS0402), sour milk (HS0403), whey (HS0404), butter (HS0405), and cheese (HS0406). The dairy trade data are obtained by summing up data corresponding to the above codes in the UN Trade Database (
https://comtrade.un.org/data (accessed on 5 November 2022)) for the time period ranging from 2000 to 2020.
4. Results
4.1. Overall Structural Characteristics of Global Dairy Trade Network
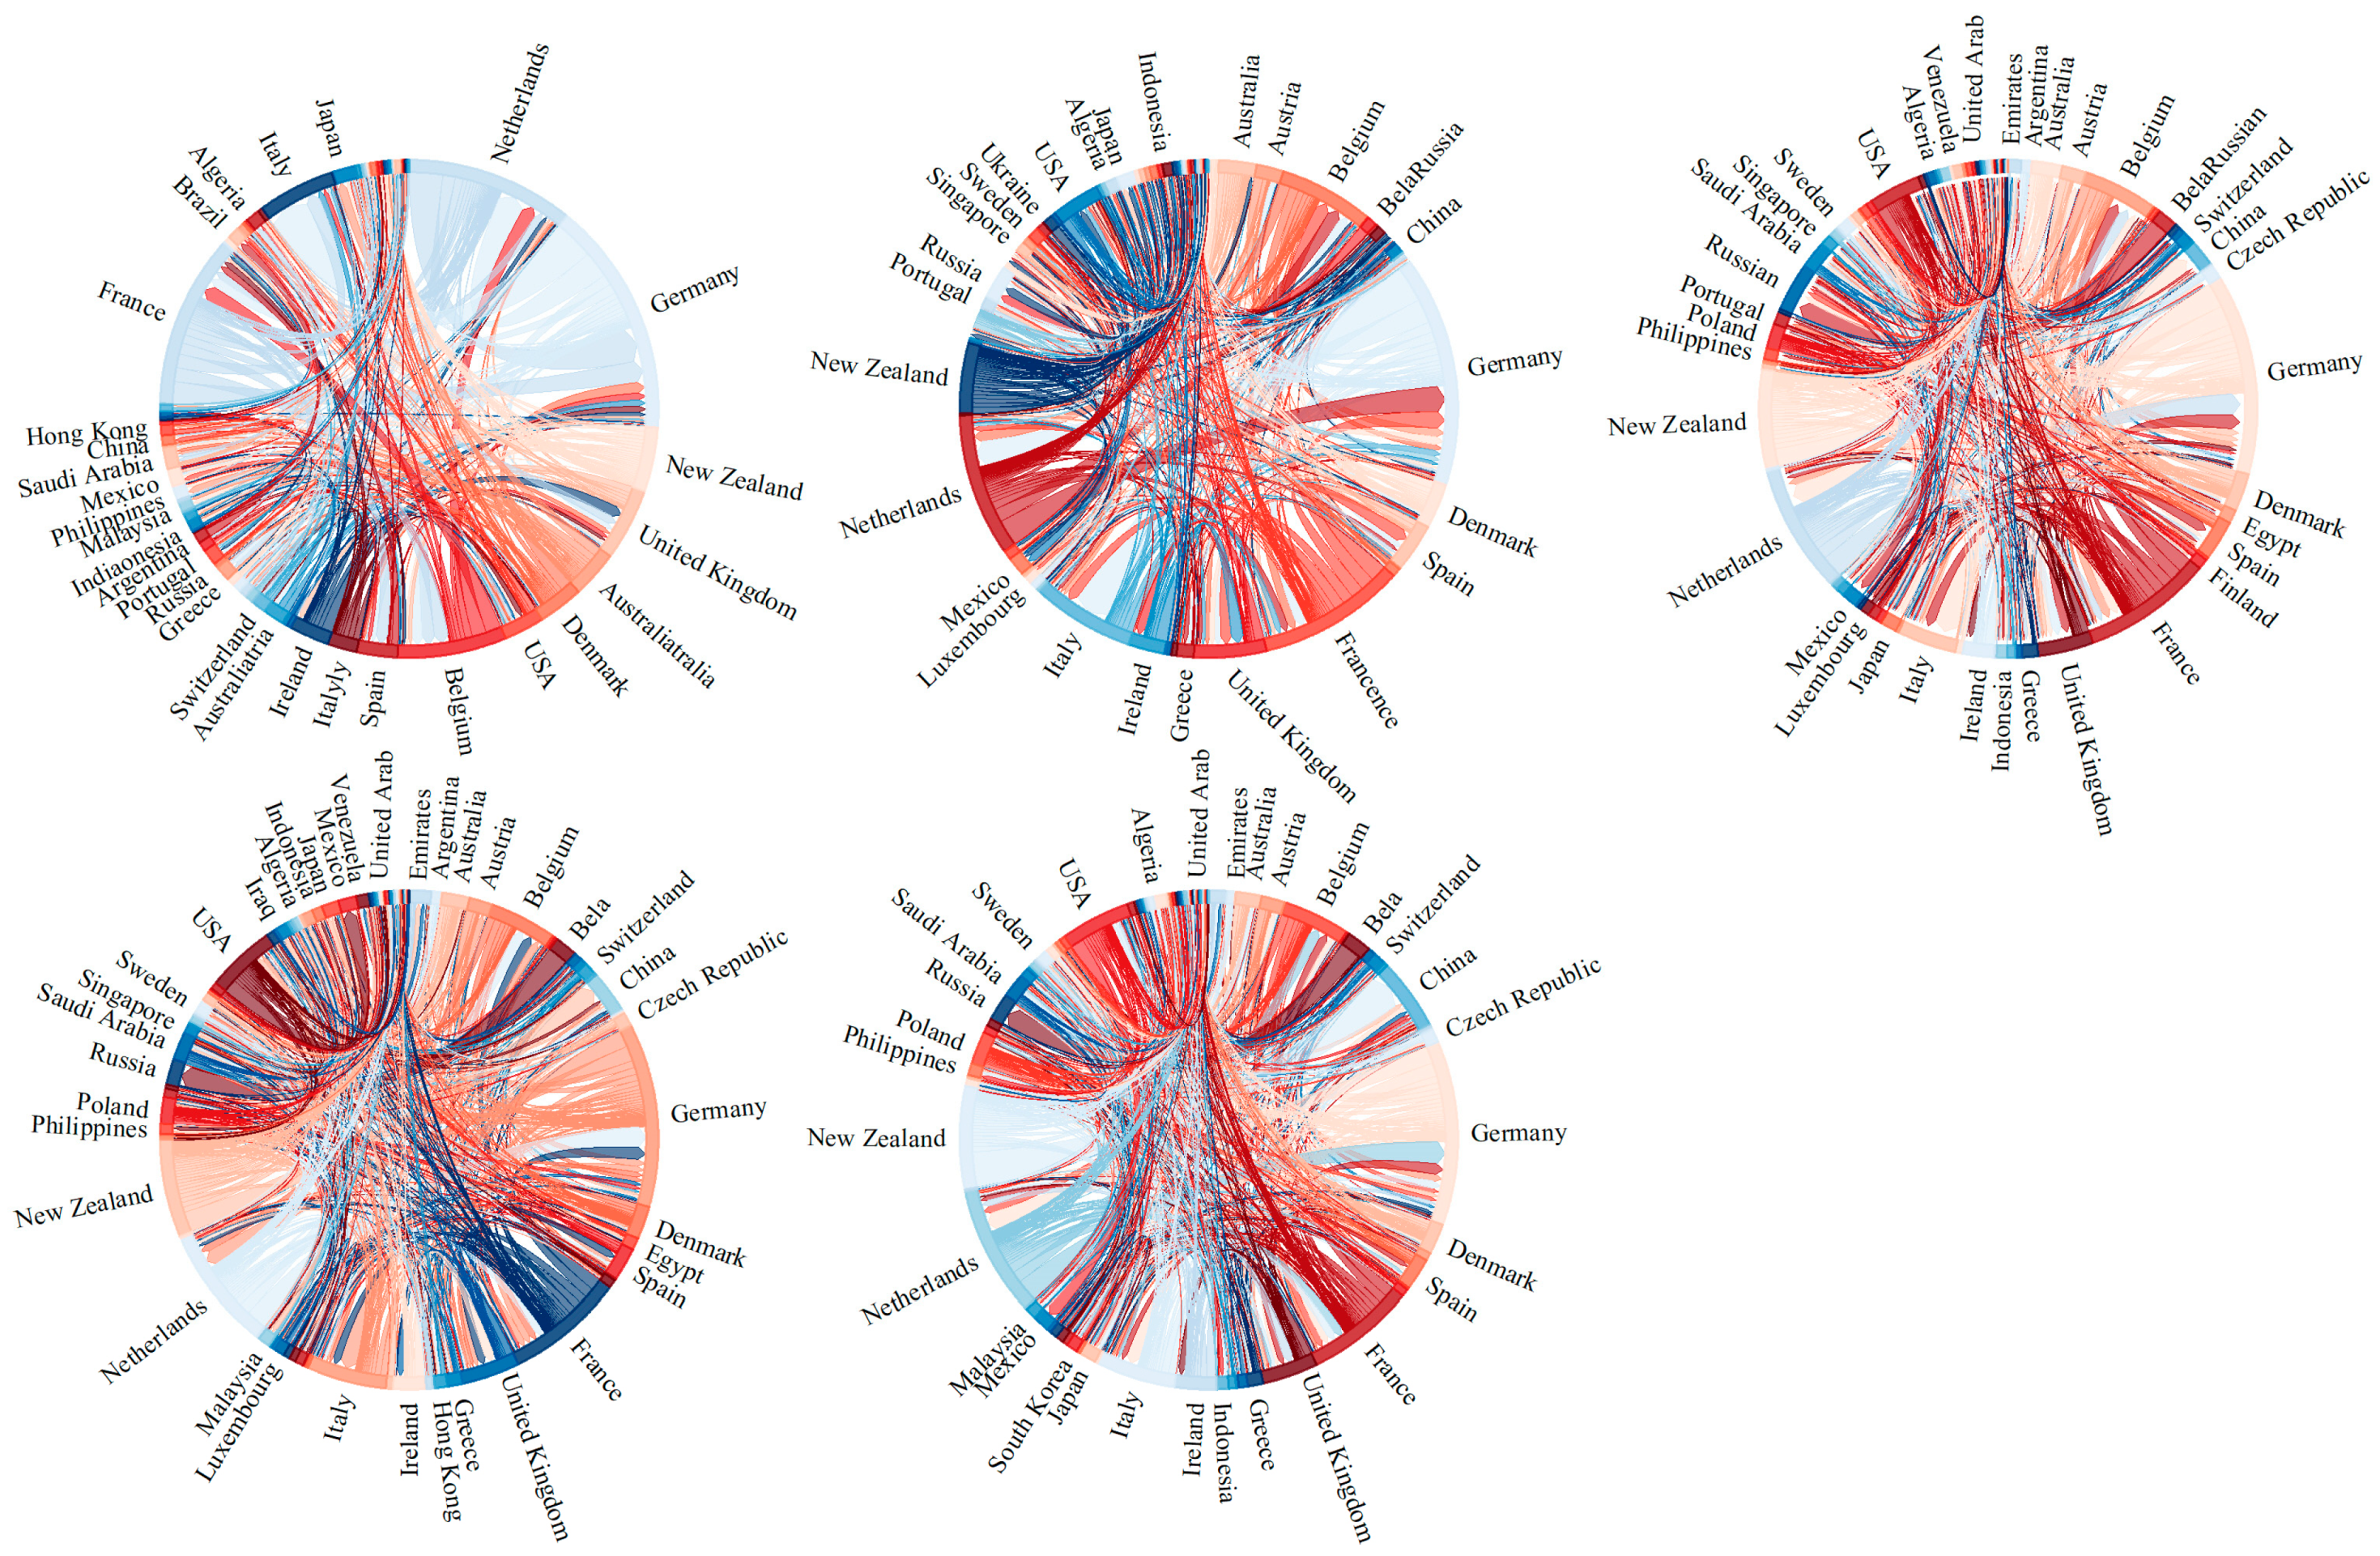
The global dairy trade network has become a complex and interdependent network system as depicted in
Figure 1. In addition, there has been a rapid development in the global dairy trade from 2000 to 2020. The export volume extended from 19.56 million tons to 35.83 million tons, whereas the export value rose from 25.05 billion USD to 79.86 billion USD, thereby indicating an increase of 83.18%, and 218.77%, respectively. The size of the trade network also expanded significantly, with the number of nodes in the trade network uplifting from 234 to 239 (a rise of 2.14%). Moreover, the trade relations between countries/regions also exhibit an uplift, with trade links growing from 3814 to 5017, thus displaying a hike of 31.54%. In the same vein, the average degree of the network increased from 16.299 to 20.992, thereby indicating that the average number of trading partner countries per country grew from 16 to 21. Specifically, the main exporting countries are the Netherlands, France, Germany, the United Kingdom, the United States, Belgium, New Zealand, Italy, Australia, and so on. Among them, the Netherlands, France, and Germany perennially occupy the top three. Italy’s ranking has risen. The United Arab Emirates and Malaysia rose to the top. Australia’s ranking has declined. The United States, the United Kingdom, Belgium, New Zealand, etc., did not change much. The main importing countries are the United States, France, the United Kingdom, Germany, Japan, China, Saudi Arabia, the United Arab Emirates, Canada, Australia and so on. Among them, the United States, France, Saudi Arabia, the United Arab Emirates and other countries always ranked relatively high. Therefore, in general, the dairy trade network is becoming more and more complex.
The scale of the global dairy trade network has been expanding based on the dynamic characteristics of the trade network. Meanwhile, the nodes and edges have also been boosted significantly (
Figure 2). On the one hand, the nodes in the network have increased by 31.54%; on the other hand, the edges have increased by 2.14%. This means that the growth rate of edges is higher than that of nodes. Interestingly, the number of nodes declined rapidly in 2000 and rose rapidly in 2020. The World Dairy Situation 2001 Report indicates that global milk production is expected to be 579 million tons in 2001, a slowdown from 574 million tons in 2000 and 567 million tons in 1999. The decrease in the number of nodes in 2000 may be due to a reduction in the supply of milk production. As for 2020, the global spread of COVID-19 has caused a significant increase in demand for milk worldwide. As demand for dairy products has rebounded from its low point in early 2020, overall dairy prices are gradually stabilizing, and global dairy trade is gradually recovering. The rapid growth of nodes and edges indicates that the range of countries engaged in the global dairy trade is inflating, whereas the interdependence of countries is deepening. Therefore, the trade relationships tend to be complex.
Figure 3 demonstrates four indicators of network evolution. The density of the global dairy trade network has increased from 0.070 to 0.088, with a maximum level of 0.100. The density growth signifies that the dairy trade between countries has become increasingly close. Moreover, the average path length has shortened from 2.3 to 2.2, and there is an improvement in the transmission efficiency of the network. The trend of the average clustering coefficient is similar to that of reciprocity as both exhibit fluctuating growth, thereby indicating an increased trade complementarity among countries, higher cohesion, and stronger intra-regional trade ties. In addition to this, the global dairy trade network demonstrates a high clustering coefficient and a short path length, thus suggesting that the network carries high local clustering and small-world characteristics.
The degree distribution curve of the global dairy trade network has typical long-tail distribution characteristics (
Figure 4) as per the comparison of the node degree distribution curves in 2000, 2005, 2010, 2015, and 2020. The number of nodes with small node degrees is high, whereas the number of hub nodes with large node degrees is low. The node degrees of the five years are further fitted with power functions, and all of the node degrees have passed the significance test. This means that the node degree distribution obeys the power law distribution. Furthermore, there is evident heterogeneity among the nodes, which satisfies the characteristics of the scale-free network. Finally, the power law index of the fitted equation displays an overall increasing trend from 2000 to 2020. This shows that the scale-free nature of the global dairy trade network has increased from 2000 to 2020.
4.2. Individual Structural Characteristics of Global Dairy Trade Network
As shown in
Figure 5, the out-degree and in-degree of each node display a clear pyramidal structure in each year’s dairy trade network. This indicates that plenty of trade relations are in the hands of a few nodes, further confirming that there is apparent heterogeneity among the nodes [
39]. Since the Netherlands, France, the US, Germany, the UK, Belgium, Australia, New Zealand, and Italy are the top countries in terms of out-degree, these countries have stable relationships and different export trade partnerships. Contrarily, these countries are in a critical position from the perspective of dairy export trade.
The Netherlands, Germany, and France have consistently ranked in the top three positions, whereas Italy has ranked up, and Australia has ranked down. In addition to this, the US, Canada, France, Japan, UAE, Germany, UK, China, China Hong Kong, Saudi Arabia, and Australia represent the top-ranking countries in terms of in-degree. Parallel to this, the US, UAE, Saudi Arabia, and France have consistently ranked in relatively high positions. The ranking of Asian countries such as China Hong Kong, Singapore, and China has gradually risen; thereby indicating that the import trade status has not only increased but the import sources of these countries have also become increasingly extensive. At large, the center dairy imports center is shifting from the Americas, Europe, and East Asia to North America and the Middle East. Conversely, there is no significant change in the center of exports [
2].
The node strength reflects the position of countries in the global dairy trade market. There is a yearly-basis increase in the node out-strength and node in-strength of the trade network, as illustrated in
Figure 6. This shows a persistent expansion in the value of the global dairy trade and an improvement in the trade position of the countries. On the one hand, the top-ranked countries are relatively fixed for node out-strength, with France, Germany, New Zealand, the Netherlands, and Belgium occupying the top 10 year-round. These countries have dominated the global dairy export market for a long period. Furthermore, there is also a rise in the rankings from the USA and Italy.
On the other hand, Germany, Italy, France, the Netherlands, the UK, and Belgium, represent the top-ranked countries in node in-strength. This indicates that these countries are crucial importers of dairy products. The in-strength of Russia and China have gradually entered the global top 10, thereby suggesting their increasingly significant status in import trade. Hence, France, Germany, Belgium, and the Netherlands serve as the essential import- and export two-way trade countries. Consequently, the whole industry’s chain cooperation in the dairy products trade has become much higher than past.
4.3. Core–Periphery Structure of Global Dairy Trade Network
Figure 7 exhibits the evolution of the global dairy trade network core–periphery structure. Generally, the number of trade core countries has increased significantly, from 19 to 28, and the changing trend of core–periphery distribution better fits with the development trend of economic globalization. In contrast, the number of edge countries has increased by 10, and the number of semi-periphery countries has decreased by 14. In particular, countries such as the United States, Canada, the UK, Germany, France, Ireland, Spain, Poland, Austria, the Czech Republic, Switzerland, Denmark, Greece, Italy, Australia, and New Zealand are highly mature in terms of the dairy technologies, such as dairy farming, dairy product processing, and large-scale farm construction; therefore, these countries constitute major positions in the global dairy trade across the year [
39]. Owing to the advantage of ports and policies, economies such as Malaysia and Indonesia have gradually managed to become the core of dairy trade through re-export trade.
Similarly, Egypt, with its well-developed ports and golden waterways of the Suez Canal, is emerging as a core country for the dairy trade. With an excellent geographical location, natural and healthy soil, and a suitable climate, Turkey has been producing dairy products of perfect quality and is gradually becoming the core of the dairy trade. The increase in the number of high-yielding crossbred cows has led to a parallel increase in total milk production in South Africa. The South African dairy consumption market is growing at a steady rate. Brazil and Argentina are the first and second largest milk producers in the entire South American region and the world’s leading exporters of dairy products. Both countries are particularly suitable for dairy farming due to their rich pasture resources. In addition, domestic dairy farms are becoming increasingly specialized in terms of the health conditions of the animals, genetic material, breeding techniques, and feed, accelerating the entry of both countries into the core of the dairy trade. Therefore the global dairy trade network structure is becoming more diversified.
4.4. Factors Influencing Global Dairy Trade Network
This study conducts regression analysis based on the QAP regression method with the global dairy trade network as the explained variable, while using differences in economic development level, differences in population size, differences in per capita income level, differences in geographical distance, common language, shared border, and joint regional trade agreement as explanatory variables. The regression results of the unweighted network (
Table 3) and the weighted network (
Table 4) are obtained by performing 2000 permutations and regression analysis using Ucinet software, respectively. The significance levels in the table reflect the significance of the actual regression coefficients [
60]. All regression models have passed the 1% level of statistical significance test with a good fit and reliable explanatory power.
As shown in
Table 3, in the unweighted network,
ADJ-R2 grew from 0.191 to 0.275, indicating that the explanatory power of these seven variable matrices for the global dairy trade network increased from 19.1% to 27.5%, and all passed the 1% significant level test.
The coefficients of PIN and DIS are always negative and increasing, growing from −0.252 and −0.312 to −0.3 and −0.358, respectively. This indicates that the gap in per capita income level and geographical distance are always inhibitors to establishing dairy trade relations between countries, and the depression effect is getting stronger. The coefficients of CON changed from positive to negative in 2015, indicating that the impact of common border on dairy trade relations changed from promoting to inhibiting, which is inconsistent with the hypothesis. The coefficients of LAN are always significantly positive but decrease, indicating that common language is always conducive to building dairy trade relations, and the promotion effect is reducing. The coefficients of GDP are 0.083, 0.126, and 0.130 in 2005, 2015, and 2020, respectively, and pass the significance test, indicating that the difference in economic level plays an increasingly positive role. Similarly, RTA becomes significant after 2005.
The POP only passed the significance test in 2020; therefore, population size may not be the major factor affecting the dairy trade’s relations.
As shown in
Table 4, in the weighted network,
ADJ-R2 grew from 0.267 to 0.352, indicating that the explanatory power of these seven variable matrices for the global dairy trade network increased from 26.7% to 35.2%, and all passed the 1% significant level test.
The coefficients of PIN and DIS are always negative and fluctuate in growth. This indicates that the gap in per capita income level and geographical distance are always inhibitors to the dairy trade value, and the depression effect is getting stronger.
The coefficients of LAN are always significantly positive but decrease, indicating that common language is always conducive to dairy trade value and the promotion effect is reducing. The coefficient of RTA is significant from 2005, increasing from 0.023 to 0.138, indicating that regional trade agreements help to increase the dairy trade value. Similarly, GDP becomes significant after 2010, from 0.087 to 0.0123, indicating that the greater the difference in economic levels, the more favorable it is to promoting the dairy trade value.
The POP only passed the significance test in 2020; therefore, population size may not be the major factor that affects the dairy trade value. Interestingly, the contribution of shared borders to the dairy trade value has gradually disappeared, suggesting that dairy products may not comply with the “border puzzle”.
4.5. Robustness Tests
This study applies stepwise regression as a robustness test to ensure the credibility of the QAP regression results. The procedure is: (1) In each trade network, one variable is excluded at a time and the remaining six variables are used for QAP regression. The process is carried out seven times. (2) Compare the significance and direction of the coefficients of the variables with the original model. (3) If the significance and direction of the coefficients of the variables do not change dramatically, it can indicate that the model we set is robust and credible.
The year 2000 is the starting time point of the study and 2020 is the end time point of the study. Robustness tests on these two-time points help verify the variables’ trends. Therefore, this paper performs stepwise regressions of the unweighted network and the weighted network in 2000 (
Table 5 and
Table 6) and 2020 (
Table 7 and
Table 8).
The results in
Table 5 show that the rest of the variables in the 2000 unweighted network, except
POP and
CON, pass the significance test and the direction of the impact coefficient is consistent with the original model. The stepwise regression does not cause a directional change in the variables.
The results in
Table 6 show that the rest of the variables in the 2000 weighted network, except
POP and
RTA, pass the significance test and the direction of the impact coefficient is consistent with the original model. The stepwise regression does not cause a directional change in the variables.
The results in
Table 7 show that almost all variables in the 2020 unweighted network pass the significance test and the direction of the impact coefficient is consistent with the original model.
The results in
Table 8 show that all variables in the 2020 weighted network, except
POP, pass the significance test and the direction of the impact coefficient is consistent with the original model. As a result, the robustness mentioned above in the test results reveals that the QAP regression results are reliable.
5. Discussion
This paper examines the factors that affect the global dairy trade network using the QAP method. The results indicate that most variables are significant in unweighted and weighted networks. Moreover, the significance level demonstrates dynamic changes over time, confirming dairy products’ specificity.
The per capita income level, geographical distance gap, and common language are consistently significant, with regression coefficients increasing. This shows that these factors exhibit an increasingly significant role in trade. These research findings corroborate the inferences presented by Ma and He, Zhou and Tong, and Egger and Lasssmann, respectively [
38,
52,
61].
Regional trade agreements have been significant factor influencing dairy trade almost since 2005, hence highlighting that RTAs effectively eliminate trade barriers, streamline trade processes, and facilitate trade occurrence. These implications are in line with Ganbaatar et al. [
62]. Real trade agreements also serve as a basis to explain this perspective. For instance, China’s trade in dairy products imported from New Zealand increased to
$4.13 billion from
$1.30 billion for the period ranging from 2014–2010, after China signed an FTA with New Zealand in 2008.
The difference in the level of economic development exerts a significantly positive role after 2010. This means that the higher the difference in the level of economic development, the higher the chances of trade occurrence. This notion is similar to the findings of Duan et al. [
35]. In 2020, the dairy trade occurred in 239 countries worldwide. This shows that this perspective also has practical significance. Additionally, developed economies such as Germany, France, Netherlands, USA, UK, Denmark, Poland, Spain, and Italy traded dairy products with more than 130 countries around the globe. In contrast to this, developing nations such as Israel, Panama, and Palestine traded with less than 30 countries.
The regression coefficient of shared borders changes from positive to negative in the unweighted network. This means that shared borders prevent the establishment of dairy trade associations between countries, which is beyond expectations. Since neighboring countries may present similar characteristics in terms of dairy production and consumption and represent minor product differences, these countries prefer to trade with external countries. Alternatively, the weighted network’s regression coefficient of the shared border is still positive but gradually becomes insignificant. This pattern is contrary to the “border puzzle” proposed by McCallum as economies such as Malaysia and Indonesia have become new hubs for re-exporting dairy products with the advantage of ports. Moreover, there is a gradual expansion of trade patterns from Europe and America to Asia, thereby weakening the role of common borders.
In terms of significance, the population size gap may serve as a minor factor that affects the dairy trade, supporting the findings of Chung et al. [
63]. The increase in population size deepens the domestic division of labor, reducing the demand for international trade.
6. Conclusions
This study paper investigates the evolutionary characteristics of the global dairy trade pattern in terms of the overall structure, individual characteristics, and core–periphery structure based on the complex network analysis method. Subsequently, QAP analyzes the factors that affect the dairy trade network. The major conclusions of this paper are drawn as follows.
(1) Global dairy trade network continues to expand in terms of the overall structure, with an increase in the number of trade links and trading countries. A few hub countries hold a large number of trade links, with the attributes of a scale-free network. The dairy trade relations between countries become increasingly close; thus, the transmission efficiency of the network increases, and the degree of intra-regional trade cohesion improves, with the characteristics of a typical small-world network.
(2) From the perspective of individual characteristics, the heterogeneity of countries is evident. The USA, UAE, and France serve as the primary importers of dairy products, while the Netherlands, France, and Germany are the major exports of dairy products. Meanwhile, these countries play a dominant role across the year. The import center of dairy products has shifted from Europe, America, and East Asia to North America, the Middle East, and East Asia, while there is no significant change in the export center.
(3) In the context of core–periphery structure, such as the trend of economic globalization, there is a significant increase in the core–periphery countries. In contrast, the semi-periphery countries have decreased over time. Moreover, countries such as the U.S., Canada, and France perennially occupy the core position. Alternatively, states such as Indonesia and Malaysia represent the newly emerging core countries.
(4) The difference in per capita income level, geographical distance gap, and common language are the factors that constantly affect each country’s dairy trade relations and trade value, based on the results of QAP regressions. Differences in economic levels and regional trade agreements have gradually become critical influencing factors. In addition to this, the shared borders are not conducive to establishing dairy trade links, since the value of dairy trade may not follow the “border effect”.
The above results indicate that the factors influencing the global dairy trade network are highly complex and heterogeneous compared to other products. This paves potential directions for future research, such as climate and price factors [
64,
65,
66]. Refining these studies enables the uncovering of the unique factors affecting the dairy trade. There are also some limitations in this paper. We may not consider factors such as dairy production and cattle stock in each country. Future studies can be further improved. In order to promote the sustainable development of the global dairy trade, the following recommendations should be taken into account. Firstly, countries should strengthen their infrastructure construction, such as roads and railway lines, to reduce the cost of trade flow and weaken the inhibiting effect of geographical distance on trade. Secondly, there is a need to improve cultural identity and strengthen mutual political trust among the states. Lastly, countries should strengthen their economic exchange setups to promote the development of regional free trade agreements.
This paper extends the application of CNA in international trade and analyzes the influencing factors of dairy trade networks using the QAP method. It helps other scholars to conduct further research and also helps to promote the sustainable development of dairy trade on a global scale.


