Article

Pandemic-Induced Shifts in Climate Change Perception and Energy Consumption Behaviors: A Cross-Country Analysis of Belgium, Italy, Romania, and Sweden

1
Aero-Thermo-Mechanics Department, Faculty of Applied Sciences, Université Libre de Bruxelles, 1050 Bruxelles, Belgium
2
Department of Electrotechnics and Measurements, Faculty of Electrical Engineering, Technical University of Cluj-Napoca, 400114 Cluj-Napoca, Romania
3
Surgical Department, University of Oradea, 410073 Oradea, Romania
*
Author to whom correspondence should be addressed.
Sustainability 2023, 15(20), 14679; https://doi.org/10.3390/su152014679
Submission received: 19 August 2023 / Revised: 9 September 2023 / Accepted: 29 September 2023 / Published: 10 October 2023

Abstract

:
This research explores the impact of the COVID-19 pandemic on consumer behavior and preferences related to household energy consumption through actions to fight climate change in Belgium, Romania, Italy, and Sweden. Using data from two Eurobarometer surveys conducted in 2019 and 2021, the study examines shifts in climate change perception, actions to combat climate change, and the influence of socio-economic and demographic variables on these actions. Depending on the country, the findings reveal significant pandemic-induced changes in public perceptions of climate change and personal actions to combat it. Age, gender, and education level were found to influence climate change actions. Financial constraints also significantly influenced the adoption of energy-efficient behaviors. Our research enriches existing knowledge by exploring the influence of the COVID-19 pandemic on climate change perceptions and actions across diverse European countries, shedding light on the interplay between global crises and sustainability. The research methodology, including chi-square tests, logistic regression, and effect size measurements, provides a robust framework for understanding how economic factors and consumer behaviors are contributing to the development of effective energy policies.

1. Introduction

The transition to renewable energy sources is a crucial step in mitigating climate change and achieving sustainable development goals. Understanding consumer behavior and preferences regarding energy consumption is vital for effective policymaking and the promotion of clean energy adoption. This research aims to investigate the primary parallels and contrasts among consumers from four European Union (EU) countries—Belgium, Romania, Italy, and Sweden—regarding their shifts in climate change perception due to the pandemic (O1). The selection of these countries allows for an examination of consumer behavior in diverse cultural and economic contexts within Europe. The four countries are from the main regions of Europe as defined by the UN: Western, Eastern, Southern, and Northern Europe [1]. The variation in economic development among these countries offers a unique perspective on the impact of economic factors on consumer behavior and energy consumption patterns. Sweden, with a strong environmental awareness, may demonstrate distinct consumer preferences and behaviors compared to Romania, which is at the bottom of the rank [2]. A study analyzing the distribution of environmental behavior patterns in the EU-27 reveals that each of the selected countries (Belgium, Italy, Romania, and Sweden) in the present study belongs to a different cluster [3].
Additionally, we aim to investigate the impact of the COVID-19 pandemic on consumers’ preferences and behaviors regarding the actions to fight climate change among the surveyed countries (O2). The COVID-19 pandemic has brought unprecedented challenges and triggered shifts in societal behaviors and priorities. By investigating changes in consumer attitudes and behaviors toward sustainable energy during the global crisis, we can determine the extent to which the pandemic has affected the action to fight climate change taken in relation to energy consumption in their households.
The third objective is to find how different socio-economic and demographic variables dictate the action to fight climate change, in terms of energy consumption in households (O3). By examining the factors influencing consumers’ choices, we aim to identify common trends and distinct characteristics within each country. This analysis will provide insights into the current energy landscape and inform strategies for promoting sustainable energy consumption. By including countries with varying economic development levels, researchers can investigate how factors such as gender, age, education, income levels, and community in which the respondents live shape consumer behavior and choices related to action to fight climate change. In marketing, demographic and socio-economic data aid in tailoring messages and strategies to specific target audiences, providing insights into preferences, behaviors, and needs. This comparative approach allows for a nuanced understanding of the interplay between economic factors and consumer behavior, contributing to the development of effective energy policies and interventions tailored to the specific contexts of each country.
Practically, this study will answer a few questions: How have the perceptions of climate change among consumers in Belgium, Romania, Italy, and Sweden shifted due to the pandemic, and how do these shifts vary across these diverse cultural and economic contexts? How has the pandemic influenced household energy consumption behaviors in these countries, and are there noticeable trends or shifts? Which socio-economic and demographic variables, such as gender, age, education, and income, play a significant role in influencing actions taken to combat climate change in terms of household energy consumption? Considering the diverse economic development levels of the selected countries, how do these variables shape consumer behavior and choices, and are there common or distinct patterns observed across these nations?
This research significantly contributes to the existing knowledge by broadening our understanding of several crucial aspects. Firstly, by investigating consumers from diverse EU countries—Belgium, Romania, Italy, and Sweden—we gain insights into their shifting perceptions of climate change as influenced by the COVID-19 pandemic. This multi-country approach provides a comprehensive view of the cultural, economic, and societal influences that shape individuals’ attitudes toward climate change.
Moreover, the study extends the scope by assessing the impact of the pandemic on consumers’ preferences and behaviors related to climate change actions. By exploring these shifts in the context of energy consumption, the research reveals the intricate interplay between global crises and sustainable practices.

2. Literature Review

2.1. Changes in the Perception and Behaviors Related to Climate Change, Due to COVID-19 Pandemic

Viewing the COVID-19 pandemic as a consequence of human interference with nature [4] introduces significant talking points. It suggests that understanding the impacts of the pandemic could be key in heightening environmental awareness and promoting eco-friendly behaviors. This concurs with the outcomes of research that emphasizes the correlation between cognizance of the harm inflicted on nature by humans and the embrace of pro-environmental behavior following COVID-19 [5]. Furthermore, the fear triggered by the pandemic appears to positively influence environmentally friendly values and actions. At least one study has indicated that individuals who harbor a fear of COVID-19 are more inclined to demonstrate pro-environmental behaviors and partake in green purchasing [6]. This insinuates that fear could act as a catalyst for individuals to opt for environmentally considerate choices. However, it is crucial to acknowledge that the pandemic’s influence on pro-environmental conduct and decision making is not homogeneous. Some research has reported inconsistent effects on the expenses tied to such behaviors and the decision-making process [7]. Ruiu et al. disclosed that those who are younger and more educated perceive the COVID-19 outbreak as a chance to adopt pro-environmental conduct and sustainable attitudes [8]. This underscores the intricate array of factors that shape individual choices and the necessity for more in-depth exploration of the interplay between fear, awareness, and decision making concerning environmental issues.
Moreover, the economic repercussions of the pandemic seem to have a dual effect on the perception of climate change and the endorsement of eco-friendly policies. Individuals who have endured financial strain express an escalated worry about climate change, but they are less likely to back green policies [9]. This hints at the need to untangle the complex interrelation between financial situations, environmental worries, and policy support.
Various studies have examined the impact of COVID-19 on residential energy consumption, particularly during lockdown periods. Researchers such as Aldubayan and Krarti (2022) found that electricity consumption in residential buildings of Saudi Arabia surged by 25.2% during the lockdown, with increased usage of lighting, appliances, and air conditioning [10]. Similar increases in energy consumption were observed in other countries, including Canada [11], India [12,13], Switzerland [14], etc. The rise in energy demand was attributed to factors such as changed schedules, increased occupancy, and water heaters [14]. These studies also highlighted the importance of household characteristics, climate, and location in shaping residential energy consumption patterns.
The most commonly adopted actions to enhance household energy consumption and therefore to fight climate change are insulating homes for improved efficiency, opting for low-energy homes, purchasing energy-efficient appliances, installing equipment to reduce energy consumption, and embracing solar panel installations.
Given the circumstances of the COVID-19 pandemic, as daily activities predominantly occurred within the confines of one’s home, the physical characteristics of the living space gained significance. The perception of the work environment underwent a transformation during the COVID-19 pandemic, compelling individuals to carry out their professional duties within their homes [15]. The integration of remote work blurred the boundaries between home and office spaces [16], and several attributes emerged as crucial such as effective thermal and acoustic insulation [17].
According to a study conducted in England, households with well-insulated houses experienced minimal impact on their household budget during the lockdown. On the other hand, households with poorly insulated houses faced increased financial strain during the lockdown and tended to consume more energy for heating [18]. Even if it is obvious that those factors should have changed the demand for home insulation, the lockdown due to the pandemic, the socio-demographic factors, and financial insecurity may also play a role in actions to fight climate change.
Home Energy Management Systems (HEMSs) are an important part of smart homes and offer various benefits, including cost savings for users and utility providers [19], integration with smart grids [20], and allowing energy usage comparisons over time [19]. Importantly, HEMSs can help lower-income households by addressing factors such as high energy costs [21]. A study conducted in New York revealed that the factors influencing the adoption intention of HEMSs are attitude, perceived behavioral control, adoption intention of HEMS energy features, social norms, and cybersecurity. The same study showed that cost concern was not significant. Demographically, younger individuals and those in larger households showed higher adoption intentions [21].
Energy consumption in households also depends on the appliances used by the inhabitants. In one study, Genjo et al. [22] explored the correlation between household appliance ownership and electricity consumption in Japanese households. Their findings revealed a connection between the number of home appliances owned and residential electricity usage. During the imposed lockdown due to the pandemic, in Mexico, there was increased usage of technological devices such as mobile devices and computers, stove activity, and washing machine usage [23].
The COVID-19 outbreak has had a significant impact on the solar industry, particularly in terms of installation and commissioning efforts that require technician mobility [24]. Smaller companies specializing in selling solar panels for roofs have been hit the hardest, facing difficulties with customer order cancellations or postponements due to pandemic concerns [25]. Surveys conducted by SEIA reveal industry concerns related to project debt availability, tax equity availability, liquidity, construction delays, customer acquisition, customer credit, force majeure, interconnection delay, permitting delays, and supply chain delays [26].

2.2. Socio-Cultural and Demographic Factors Influencing the Energy Consumer Behavior in Households

Global warming due to human activities increased by 0.8–1.2 °C compared with the pre-industrial period [27], while households are an important contributor to GHG (greenhouse gas) emissions. Worldwide, households emitted 72% of the total GHG [28], while in the US, energy use in households was responsible for 20% of GHG total emissions in 2019 [29]. To arrive at zero net emissions of GHG by 2050, the core point of the Green Deal, it is crucial to find ways to decrease the usage of non-renewable, polluting sources, especially in the household sector. But decreasing GHG emissions cannot be done without changing consumer behavior [30,31,32]. The literature shows that residential energy is used more often in heating, domestic hot water, and cooking appliances. Bosseboeuf et al. (2015) show that the greatest share of energy is consumed by heating in the Netherlands [33]. The same study shows that building insulation, occupant behavior, and hours of maximum heating all have an influence on the energy consumption for heating. A study conducted in UK households shows that 19% of energy is consumed by stand-by appliances [34], while in Denmark 10% [35]. Hot water is the third energy consumer in Dutch households and is strongly related to the number of people per household [33] and the frequency of showers [36].
Besides the final utilization of energy per household, the literature shows that factors like gender, marital status, education, type of community, and age and many other socioeconomic factors have an influence on the type of energy used in households [37,38].
When considering age as a determinant of energy consumption in households, young females tend to prioritize environmental protection over security and exhibit a stronger preference for renewable energy [39]. Younger individuals, regardless of gender, tend to have higher preferences for renewable energy as they prioritize environmental protection over security [40]. Age has been identified as a significant indirect factor influencing heating and cooling energy consumption across various countries [41,42,43]. Based on the discussion above, the following hypothesis is proposed:
H1. 
Age has a significant influence on consumers’ climate change actions.
Gender, along with other factors, can be associated with household energy use patterns, although the correlation may be weaker compared to other determinants such as income, household composition [44], dwelling characteristics, and cultural norms [45]. Men show a greater willingness to invest financially in renewable energy [39]. A study from Sweden shows gender influences energy use and the propensity to change energy habits [46]. Based on the gathered data, we propose the following hypothesis:
H2. 
Gender plays a significant role in shaping consumers’ climate change actions.
A large body of literature shows that education is one of the key elements that influence energy consumption patterns. Education level could potentially influence energy consumption patterns, with higher-educated individuals showing distinct behaviors compared to those with lower education. For instance, higher-educated individuals might adjust their thermostat for fewer hours at the highest temperature set-point, suggesting a potential association between education and energy-saving behaviors [41]. The authors of a study conducted in Timor-Leste observed a progressive increase in the likelihood of households using electricity, a cleaner energy source compared to kerosene and other fuels, as the education level of the household head increases. Conversely, there was a gradual decrease in the probability of using kerosene and fuelwood as the level of education increased [47]. In EU countries, the level of education plays a significant role in energy-related behaviors, with higher education levels being associated with the adoption of energy-efficient technologies and the use of energy conservation practices. Furthermore, individuals with a university education tend to place greater importance on energy savings for greenhouse gas reductions while assigning less importance to financial reasons [48]. Research indicates that households in India, with a higher number of educated females between 10 and 50 years old are more likely to opt for clean sources of energy [49]. Additionally, households where both the household head and spouse have higher levels of education tend to use modern energy sources [50]. Higher levels of education are associated with a greater likelihood of using modern energy sources and a reduced reliance on solid fuels [51]. These findings highlight the positive impact of education on energy choices and the potential for improved energy consumption patterns. Thus, the following hypothesis is formulated:
H3. 
Education level impacts consumers’ climate change actions.
Energies used in urban households are characterized by their convenience, cleanliness, and efficiency, in contrast to rural areas where biomass and coal are commonly used as fuels [52]. The same study shows that urban areas tend to have higher energy consumption for entertainment and electric appliances, while rural districts have larger energy consumption for cooking purposes. Urbanization, a social process of global significance, involves concentrated human presence in residential and industrial settings, resulting in transformative effects [53]. Economic structure transformations, changes in location, and evolving lifestyles have led to rapid urbanization and an increased demand for modern fuels [54]. According to research conducted by Heinonen and Junnila [55] and Wiedenhofer et al. [56], it was found that urbanization plays a role in shaping energy consumption patterns in the residential sector. In line with the studied literature, the following hypothesis is formulated:
H4. 
Community type (urban, suburban, rural) influences consumers’ climate change actions.
Financial difficulty measures provide insight into household problems that can have severe consequences, such as the potential disconnection of electricity or gas due to frequent utility bill non-payment [57]. Also, difficulties in paying the bills can be an expression of the income level in the households. Another study using empirical analysis demonstrates a positive correlation between the deployment of renewables and higher household electric bills, which has subsequently led to increased opposition toward renewable energy policies among voters. Using two-way fixed-effects models, the study reveals that countries with a greater reliance on renewables tend to experience higher taxes on electric bills, indicating a positive association between renewables deployment and elevated energy costs for households [58]. Considering the literature, the following hypothesis is formulated:
H5. 
Individuals who experience greater difficulties paying their bills are less likely to engage in climate change actions compared to those who face fewer financial challenges.
This research fills several knowledge gaps by providing a comprehensive cross-country analysis of climate change perceptions and behaviors, examining the pandemic’s impact on climate action, investigating the influence of socio-economic and demographic factors, and emphasizing the importance of tailored energy policies and marketing strategies.

3. Materials and Methods

To examine the influence of COVID-19 on climate change perception, actions to fight climate change, and the factors that influenced those actions in Belgium, Italy, Romania, and Sweden, we used two surveys conducted by Eurobarometer. The first survey (Eurobarometer, 91.3) took place in April 2019, prior to the pandemic, with 27,655 participants from all 27 EU countries representing diverse demographic and social groups [59]. The second survey (Eurobarometer 95.1) was conducted in March–April 2021, during the second wave of the COVID-19 pandemic, involving 26,669 respondents [60]. This two-year timeframe allowed us to assess the impact of the pandemic on the analyzed factors. Respondents were randomly selected in each EU country, considering population density proportional to population size, ensuring representative surveys across selected EU countries [61]. In 2019, Belgium had 1029 respondents, Italy had 1022 respondents, Romania had 1053 respondents, and Sweden had 1034 respondents. In 2021, the number of respondents remained relatively stable, with Belgium having 1032 respondents, Italy having 1022 respondents, Romania having 1045 respondents, and Sweden having 1045 respondents.
For the first objective (O1), the data comparison was conducted using the variables presented in Table 1, for 2019 and 2021. Participants from the four countries under study were asked to select one answer indicating what they perceived as the most serious problem facing the world (Q1). The data collected were transformed into percentages of individuals, and later, the percentage change in concern for climate change was calculated. This percentage change represents the increase or decrease in concern for climate change between the two years. The same steps were taken to find the differences in actions for fighting climate change before and during the pandemic (Q2).
To find how socio-economic and demographic factors are influencing the actions to fight climate change by reducing energy consumption in households after the pandemic and also the main differences between the four countries, two categories of variables were considered. On one side, for energy consumption behavior in households to fight climate change, the elements considered were as follows: improving home insulation to reduce energy usage, buying a low-energy home, purchasing energy-efficient appliances, installing equipment to lower energy consumption, and installing solar panels (Table 1, Q2). On the other side, the socio-economic and demographic variables considered were age, education, gender, type of community, and difficulties in paying the bills (Table 2, Q3). The data were inputted into SPSS-28, where they were cleaned, recoded, and readied for analysis to address the questions pertaining to the third objective.
The first step was to find what is the influence of various factors on consumers’ energy consumption patterns through climate change actions. We employed the chi-square test to analyze nominal versus nominal data. Effect size measurements, namely Cramer’s V and eta squared, were utilized for different statistical tests. Cramer’s V is a measure of association used for the chi-squared test of independence. It quantifies the strength of association between two categorical variables [62]. The formula to calculate Cramer’s V is as follows (1):
V = χ 2 n min k 1 ,   c 1
where V represents Cramer’s V; χ² is the chi-squared test statistic; n is the total sample size; k is the number of categories (levels) in the row variable; and c is the number of categories (levels) in the column variable.
By taking the square root of the ratio between the chi-squared test statistic and the product of the sample size and the smaller of (k−1) and (c−1), Cramer’s V is computed. It ranges between 0 and 1, where higher values indicate a stronger association between the variables.
Eta squared is a standardized measure used in analysis of variance (ANOVA) models to quantify the effect size. Eta squared (η²) is a statistical measure that quantifies the proportion of variance in an outcome variable that can be attributed to a predictor variable, considering other predictors [63].
The equation for eta squared is (2)
η 2 = σ 2 e f f e c t σ 2 t o t a l
where σ²effect refers to the variance explained by the predictor variable, and σ²total represents the total variance, which includes the sum of squares of the predictor variable and the error term.
In simpler terms, eta squared provides an indication of how much of the variability in the outcome variable can be accounted for by the predictor variable. A higher eta squared value indicates a stronger association between the predictor and outcome variables, suggesting that the predictor variable has a larger impact on explaining the variability in the outcome. Eta squared values below 0.01 are negligible, while values between 0.01 and 0.04 are considered weak. Associations ranging from 0.04 to 0.16 are moderately strong, those between 0.16 and 0.36 are relatively strong, and values between 0.36 and 0.64 indicate strong associations. Eta squared values exceeding 0.64 represent very strong associations [63].
To determine the relationship between variables in an association, regression analysis was utilized to determine the extent to which the dependent variable changes with variations in the independent variable.
Logistic regression is particularly well-suited for analyzing questions related to action taken for climate change, where respondents are asked to choose between taking a specific action or not. It allows for the examination of the relationship between predictor variables such as age (a), education level (b), gender (c), community type (d), income level (e), and the likelihood of individuals taking the desired climate change action (f). As a dependent variable, the answers about five analyzed actions, from 2021, were considered: Q2. (a) insulated home better; Q2. (b) bought low-energy home; Q2. (c) purchase energy-efficient appliances; Q2. (d) installing equipment to lower energy consumption; and Q2. (e) install solar panels.
By estimating the coefficients and odds ratios, logistic regression provides insights into the factors that influence the likelihood of engaging in the targeted climate change action. It is a valuable method for understanding the determinants of behavior and making predictions about the probability of individuals taking specific climate-related actions. When there is one independent variable and one categorical dependent variable, binary logistic regression (univariate) was used. The Formula (3)
P Y = 1 1 + e ( b 0 + b 1 x 1 )
shows P is the probability of Y occurring, e is the natural logarithm base (=2.7182), b0 is the interception at y-axis, and b1 is the line gradient [64]. For assessing the model, Cox and Snell’s R2CS and Nagelkerke’s R2N were calculated. Both are measures used in logistic regression to assess the proportion of variance explained by the model, with values that range between 0 and 1 (0 indicates that the model explains none of the variance in the dependent variable, and 1 indicates a perfect fit) [65]. To find the contribution of predictors, the Wald statistic (Wald) was calculated. If the Wald value is statistically different from zero, it suggests that the predictor variable makes a meaningful contribution to predicting the outcome [65]. To analyze the strength and direction of the relation between the variables, the odds ratio (OR) and 95% confidence interval for the odds ratio (95% C.I. for OR) value were used. OR provides information about the odds of an event occurring, while 95% C.I. for OR provides a range of values within which the true OR is likely to lie with 95% confidence [65].
Binary logistic regression relies on a few key assumptions [66]. First, the observations should be independent, meaning that the outcome of one observation does not affect another. In this study, the data from Eurobarometer meets this independence requirement. Second, perfect multicollinearity, where independent variables have a perfect linear relationship, should be avoided. Variance inflation factor (VIF) values were calculated, and all data showed no signs of collinearity, with VIF values below 2. Third, no outliers were found based on z-scores within the range of −2.5 to 2.5, indicating no significant deviations from the mean. Lastly, linearity assumes a linear relationship between continuous predictors and a transformed outcome variable, ensuring accurate interpretation of coefficients.

4. Results and Discussions

4.1. Changes in the Perception of Climate Change and Action to Fight Climate Change Due to COVID-19 Pandemic

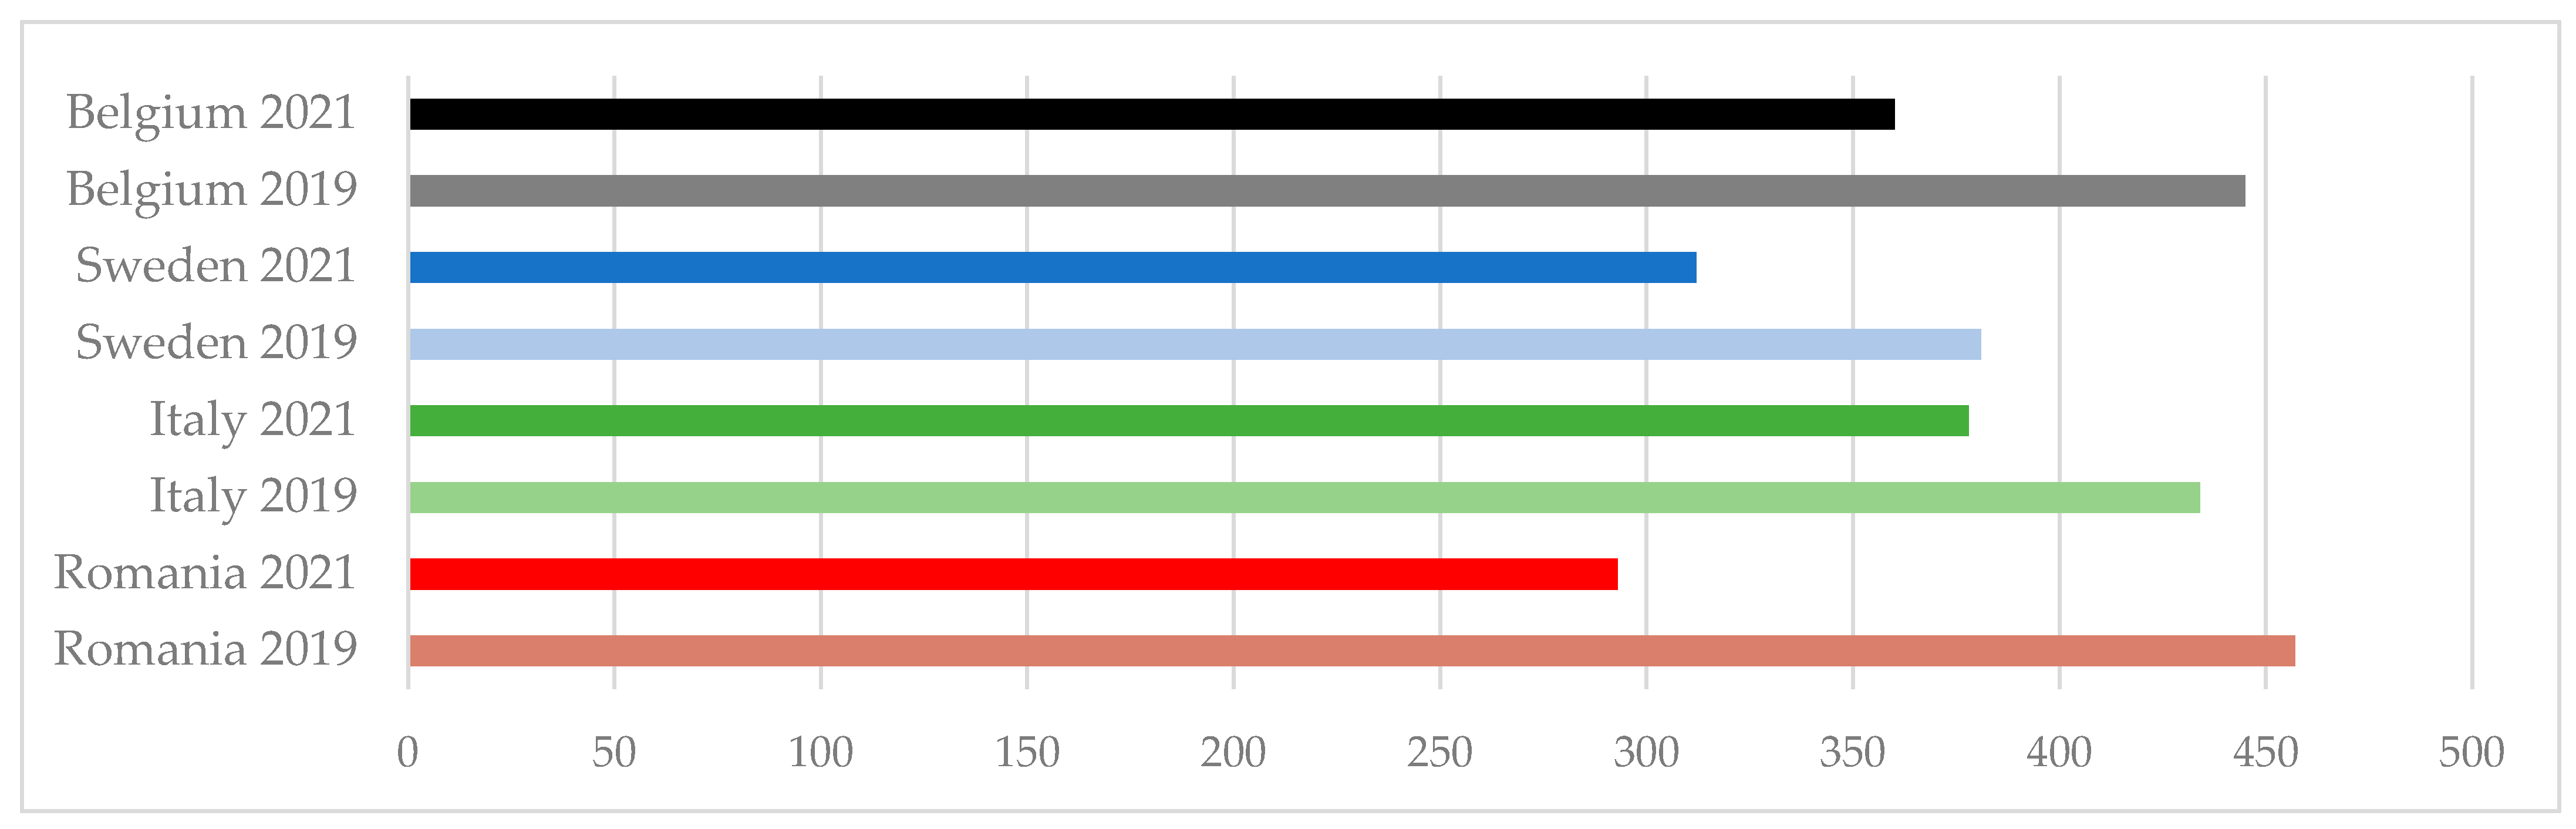
Based on the data from the surveys conducted in all four countries, it can be observed that the significance of the climate change issue decreased after the pandemic (Figure 1). Among these countries, Romanians experienced the largest decline in considering climate change as a global concern, with a decrease of 35.87%. Among many elements, economic, social, cultural, and political factors within Romania may contribute to this shift. Interestingly, while Romanians were the most concerned about this issue in 2019, they became the least concerned in 2021. The study reveals that among the four countries examined, Italians displayed the lowest rate of change in their perception of climate change as the most pressing global problem. They exhibited a modest decrease of only 12.9% from 2019. This finding suggests that Italians maintained a relatively consistent belief in the significance of climate change as a pressing issue compared to the other countries in the study. When examining the data in relation to the actions taken to control the virus, there seems to be no discernible connection. In an effort to combat the spread of the virus, various governments implemented specific actions. Romania and Italy were the most proactive, each taking 23 actions. In contrast, Sweden took the fewest measures with only 10 actions. Meanwhile, Belgium put into place 19 actions to address the situation [67].
These findings indicate a potential shift in the level of concern for climate change after the pandemic, with varying magnitudes across the studied countries. Economic factors and other contextual aspects may contribute to these changes in perception.
The provided data offer insights into personal actions related to fighting climate change and the impact of the pandemic across the four studied countries. When comparing the years 2019 and 2021, several trends emerge (Figure 2).
In Belgium, the number of respondents taking personal action to decrease energy consumption and fight climate change, such as insulating homes, buying low-energy homes, and the use of energy-saving equipment, decreased from 2019 to 2021. The investment in energy-efficient household appliances and installation of solar panels increased in the same period. Meanwhile, the number of respondents who reported no actions remained relatively stable.
In Italy, there was a noticeable decrease in all categories of climate change action between 2019 and 2021, while the number of respondents reporting no actions slightly increased.
In Romania, there was a decrease in most categories of climate change action between 2019 and 2021. The number of respondents taking personal action, improving insulated homes, buying low-energy homes, and investing in energy-efficient appliances slightly decreased. Similarly, the use of energy-saving equipment and installation of solar panels showed a decline.
Sweden experienced a similar trend, with a significant decrease in all categories of climate change action from 2019 to 2021. The number of respondents taking personal action, improving insulated homes, buying low-energy homes, and investing in energy-efficient appliances showed a substantial decline. Likewise, the use of energy-saving equipment and installation of solar panels decreased. The number of respondents reporting no actions also saw a notable increase. One notable observation is the category labeled “Other” under the actions taken to fight climate change. This category encompasses actions such as considering travel carbon footprint, reducing and separating waste, and using fewer disposable items. In Italy, the number of individuals who opted for these “Other” actions increased from 1230 in 2019 to 1380 in 2021. Similarly, in Sweden, there was a significant rise in this category, with the count going from 2684 in 2019 to 2405 in 2021. Romania also saw an increase, from 870 in 2019 to 941 in 2021. These figures suggest a growing awareness and adoption of diverse, perhaps less conventional, personal measures to address climate change in these countries. Additionally, when looking at the perception of serious world problems, the “Other” category remains relatively consistent across the years for each country, indicating that respondents have a varied understanding of global challenges beyond the listed options.
Overall, the data suggest a decrease in reported actions related to fighting climate change and improving energy efficiency from 2019 to 2021. This trend may indicate the impact of the COVID-19 pandemic on individuals’ engagement in climate-conscious behaviors. Overall, the data highlight both positive and negative trends in the adoption of personal actions related to fighting climate change. The decreases in certain actions emphasize the need for continued efforts to encourage sustainable behaviors. Conversely, the increases in other actions demonstrate progress and the growing commitment toward mitigating climate change.
These findings can guide policymakers and organizations in tailoring strategies and interventions to further promote sustainable practices and address any barriers or challenges specific to each country. By leveraging the insights gained from this analysis, stakeholders can foster greater engagement, raise awareness, and drive positive change toward a more sustainable future.

4.2. Socio-Cultural and Demographic Factors Influencing the Energy Consumer Behavior in Households

4.2.1. The Influence of Age on Consumers’ Climate Change Actions

The data analysis reveals the impact of various energy-saving measures in homes across Belgium, Italy, Romania, and Sweden and the association of these actions with age (Table 3).
Starting with better home insulation, the association between age and this measure is found to be weak in Italy, Romania, and Sweden, while it is negligible in Belgium. The η² value is 0.009 in Belgium, indicating that age has a weak or negligible influence on the decision to improve home insulation.
Next, when considering the purchase of a low-energy home, the association between age and this action is weak or non-existing across all four countries. The η² values range from 0.003 in Romania to 0.014 in Italy.
In the case of using energy-efficient household appliances, the association between age and this action is weak in Belgium, Italy, and Romania. However, it is moderately strong in Sweden, with an η² value of 0.073. This indicates that age has a more significant effect on the decision to use energy-efficient appliances in Sweden compared to the other countries.
Regarding the installation of energy-saving equipment at home, the association between age and this action is weak in Belgium, Romania, and Sweden and negligible in Italy, with an η² value of 0.006. This suggests that age has a weak or negligible effect on the decision to install energy-saving equipment at home.
Lastly, for the installation of solar panels at home, the association between age and this action is negligible in all countries. The η² values range from 0.003 in Italy to 0.013 in Belgium, suggesting that age has a negligible effect on the decision to install solar panels at home.
In general, the data suggest that age has a weak or negligible effect on the decision to take different actions to fight climate change by reducing energy consumption in homes across the four countries. The only exception is the use of energy-efficient household appliances in Sweden, where age has a moderately strong effect.
Further, logistic regression was used to find whether age is associated with the studied action to fight climate change, in each of the four countries. The preliminary analysis shows that the assumption of multicollinearity was met (VIF = 1.0), and there were no outliers. Table 4 allows us to perform an analysis for the countries with a significant relationship between age as an independent variable and the actions taken to fight climate change.
For better home insulation, age is a significant predictor in Italy and Sweden, with odds ratios of 1.269 and 1.278, respectively, indicating that as age increases, the likelihood of insulating homes better also increases in these countries. The model explains 2.7% of the variance in Italy and 3.1% in Sweden and correctly classifies 90.4% and 91.5% of the cases, respectively.
When considering buying a low-energy home, age negatively predicts this action in Belgium, with an OR of 0.84, suggesting that as age increases, the likelihood of buying a low-energy home decreases. The model explains 1% of the variance and correctly classifies 93.3% of the cases.
In the case of using energy-efficient household appliances, age is a significant predictor in Italy and Sweden, with ORs of 1.094 and 1.244, respectively, indicating that as age increases, the likelihood of using energy-efficient appliances also increases in these countries. The model explains 0.7% of the variance in Italy and 4.6% in Sweden, but the percentage of correctly classified cases is lower in these countries, at 63.9% and 56.8%, respectively.
Regarding the installation of energy-saving equipment at home, age negatively predicts this action in Belgium and Romania, with ORs of 0.801 in both countries, suggesting that as age increases, the likelihood of installing energy-saving equipment at home decreases. However, in Sweden, age positively predicts this action, with an OR of 1.322, indicating that as age increases, the likelihood of installing energy-saving equipment at home increases. The model explains 2% of the variance in Belgium and Romania and 4% in Sweden and correctly classifies 89.9%, 94.6%, and 91% of the cases, respectively.
In summary, age is a significant predictor of taking different actions to fight climate change in the analyzed countries, but the direction of the association (positive or negative) varies depending on the specific action and country. The models generally explain a small portion of the variance in these actions, suggesting that other factors not included in the model may also be influential. The models are generally accurate in predicting whether an individual will take a specific action based on their age, although the accuracy is lower for using energy-efficient household appliances in Italy and Sweden. While the literature suggests younger individuals lean toward renewable energy [39,40], our data indicate age’s influence on energy-saving measures is often weak or negligible.
There is no correlation between installing solar panels and age, in any studied country. Installing solar panels involves a notable initial cost, making both younger individuals, still solidifying their financial status, and older ones on fixed incomes or with conservative spending habits potentially wary. The long-term nature of the return on this investment might not appeal to older individuals who feel they will not maximize the benefits, while younger ones might have other financial priorities. Housing plays a role too; younger people often rent, limiting their ability to install panels, whereas older individuals might live in unsuitable homes. The complexity of solar technology can be daunting for some, especially older individuals unfamiliar with newer technology. Moreover, inconsistent information dissemination means not everyone is equally informed about solar benefits. Lastly, the availability of government incentives can significantly influence the decision across all ages.

4.2.2. The Role of Gender in Shaping Consumers’ Climate Change Actions

Based on the provided data (Table 5), the analysis suggests that gender does not play a significant role in shaping consumers’ climate change actions across the analyzed countries. The results show that there is no significant association between gender and the decision to insulate homes better or buy a low-energy home in any of the countries. This indicates that both men and women are equally likely to take these actions to fight climate change.
When it comes to using energy-efficient household appliances, a significant association with gender is observed in Belgium and Sweden. This suggests that in these countries, one’s gender might influence the decision to use energy-efficient appliances, although the strength of this association is weak.
Similarly, there is no significant association between gender and the decision to install energy-saving equipment at home in any of the countries. This suggests that the decision to install such equipment is not influenced by gender.
Finally, the decision to install solar panels at home shows a significant association with gender in Belgium and Sweden. In Italy and Romania, no significant association between gender and any of the actions is observed, suggesting that men and women in these countries are equally likely to take these actions to fight climate change.
In summary, while gender shows some association with certain actions to combat climate change in Belgium and Sweden, the strength of these associations is weak. In Italy and Romania, gender does not appear to significantly influence these actions.
Table 6 explores the relationship between gender and various actions to combat climate change across Belgium and Sweden. These actions are the ones that we found an association with (Table 5): using energy-efficient household appliances and installing solar panels at home.
In both Belgium and Sweden, gender significantly predicts the use of energy-efficient household appliances. The ORs are 0.703 and 0.606, respectively. Given that higher values are associated with women (coded in the analysis as 2), these ORs less than 1 suggest that men are less likely to use energy-efficient appliances compared to women in these countries. The model explains 1% of the variance in Belgium and 2% in Sweden and correctly classifies 59% and 60.2% of the cases, respectively. Specifically, men are less likely to use these appliances compared to women in these countries. However, the strength of this association is weak.
In Belgium, gender is a significant predictor of installing solar panels at home, with an OR of 1.597. Since higher values are associated with women (2), this OR greater than 1 suggests that women are more likely to install solar panels at home compared to men. The model explains 15% of the variance and correctly classifies 72.4% of the cases.
In summary, the data suggest that women in Belgium and Sweden are more likely than men to use energy-efficient household appliances and to install solar panels at home in Belgium. Contrary to literature emphasizing gender’s role in energy consumption [39,44,46] our findings suggest a more muted gender influence on climate change actions across studied countries. Notably, Belgium and Sweden show modest gender differences in adopting energy-efficient appliances and solar panels. Women in these countries seem more inclined toward eco-friendly choices. Yet, these associations are weak, hinting at evolving gender norms in environmental decisions. This highlights the dynamic interplay of gender and environmental consciousness, warranting further research.

4.2.3. The Impact of Education Level on Consumers’ Climate Change Actions

The analysis of the data shows that education level influences some of the consumers’ actions to fight climate change (Table 7). In summary, these results suggest that education level has a significant effect on certain climate change actions in Italy, Romania, and Sweden, but the effect sizes are generally small, indicating that education level explains a small proportion of the variance in these actions.
In Belgium, the level of education does not seem to significantly impact most climate change actions. While there is a minor impact on actions like buying low-energy homes, the overall influence remains limited. Education exhibits a range of associations with climate change actions in Italy. These associations vary from weak (e.g., for buying low-energy homes) to strong, particularly in the context of energy-efficient household appliances. In Romania, education shows predominantly weak associations with climate change actions. The strongest association, while still weak, is seen in the context of improving home insulation. The effect size for these actions is weak, indicating that while education level does have a significant effect, it only explains a small portion of these behaviors. Education’s associations with climate change actions in Sweden are generally weak. The strongest of these weak associations are observed in the context of buying low-energy homes and energy-efficient household appliances.
The data in Table 8 show that in Italy, an increase in education level is associated with a significant increase in the use of energy-efficient household appliances. Specifically, for each step up in education level, the odds of using such appliances increase by approximately 104%. However, education level only accounts for between 2.5% and 3.4% of the variation in this behavior, and the model’s predictive accuracy is 68.1%.
In Romania, higher education levels are significantly associated with three different actions to combat climate change. Firstly, for each increase in education level, the odds of better home insulation increase by approximately 94.5%, although education level only explains between 1.4% and 2.1% of the variance in this behavior. The model correctly predicts this action in 76.8% of cases. Secondly, the odds of using energy-efficient household appliances increase by approximately 141% for each step up in education level. Education level accounts for between 2.7% and 3.8% of the variation in this behavior, and the model’s predictive accuracy is 69.6%. Lastly, the odds of installing energy-saving equipment at home increase by approximately 139% for each increase in education level. However, education level only explains between 0.7% and 2.2% of the variance in this behavior, but the model correctly predicts this action in an impressive 94.6% of cases.
In Sweden, an increase in education level is significantly associated with an increase in the use of energy-efficient household appliances. For each step up in education level, the odds of using such appliances increase by approximately 64%. However, education level only accounts for between 1.5% and 2.1% of the variation in this behavior, and the model’s predictive accuracy is 60.2%.
Drawing from established literature, it is evident that education significantly influences energy consumption patterns. As highlighted by [41], higher-educated individuals often exhibit energy-saving behaviors, a sentiment further reinforced by studies in Timor-Leste [47] and the EU [48]. Our results resonate with these findings, especially in Italy, Romania, and Sweden, where heightened education levels correlate with the adoption of energy-efficient appliances. However, the magnitude and specific behaviors differ across countries, suggesting that while the broader trend aligns with [41,47,48], regional nuances necessitate tailored approaches to promote sustainable energy practices.

4.2.4. Community Type and Climate Change Actions

The findings of the study suggest that the impact of community type (urban, suburban, rural) on consumers’ climate change actions can vary (Table 9).
In Belgium, community type does not significantly affect most of the analyzed categories, including having insulated homes, purchasing low-energy homes, adopting energy-efficient household appliances, and utilizing energy-saving equipment in homes. However, there is a weak association between community type and installed solar panels, indicating that the specific type of community may play a role in the decision to install solar panels in residential settings.
Similarly, in Romania, community type does not demonstrate a significant influence on consumers’ climate change actions related to having insulated homes, purchasing low-energy homes, adopting energy-efficient household appliances, utilizing energy-saving equipment, or installing solar panels.
In Italy, there is no significant association between the type of area and most of the actions, except for using energy-efficient household appliances, where the association is weak (η² = 0.019). This suggests that the type of area has a minimal influence on these actions in Italy, except for using energy-efficient household appliances.
In Sweden, community type shows a significant association with having insulated homes, indicating that the specific community setting may affect the likelihood of homes being insulated. However, community type does not significantly impact other actions to fight climate change.
The analysis highlights that the influence of community type on consumers’ climate change actions is not consistently significant across the analyzed countries. Nevertheless, certain exceptions, such as the significant association between community type and installed solar panels in Belgium and having insulated homes in Sweden, suggest that community characteristics can play a role in shaping individuals’ choices related to climate change.
For the adoption of insulated homes in Sweden, there is a significant negative relationship with the type of community (Table 10), with an OR of 0.576. This suggests that for each unit increase in community type (moving from rural to larger towns), the odds of better home insulation decrease by about 42.4%. The model explains 3.1% of the variance (R² N = 0.031) and correctly classifies 91.5% of the cases.
In Italy, community type significantly predicts the use of energy-efficient household appliances, with an OR of 1.283. This suggests that for each unit increase in community type, the odds of using energy-efficient household appliances increase by about 28.3%. The model explains 0.7% of the variance (R² N = 0.007) and correctly classifies 63.9% of the cases.
In Belgium, community type significantly predicts the installation of solar panels at home, with an OR of 0.645. This suggests that for each unit increase in community type, the odds of installing solar panels at home decrease by about 35.5%. The model explains 2.9% of the variance (R² N = 0.029) and correctly classifies 72.4% of the cases.
The literature emphasizes urban households’ preference for energy efficiency and convenience, while rural areas lean toward traditional energy sources like biomass and coal [52]. Urbanization’s transformative effects on energy consumption are also highlighted [53,56]. Our study, however, presents a more complex picture. In Romania, community type has negligible influence on climate change actions. Italy shows a slight inclination toward energy-efficient appliances in urban settings, while in Sweden, urbanization seems to decrease the likelihood of better home insulation. Cultural traditions and habits, even in urban environments, can significantly shape energy consumption behaviors, sometimes diverging from typical urban trends. Additionally, economic variations, particularly between urban and rural regions within countries, can impact the adoption of cleaner energy. In certain nations, financial constraints in urban zones might hinder the shift toward more sustainable energy solutions.

4.2.5. The Relationship between Financial Challenges and Consumers’ Engagement in Climate Change Actions

When comparing the influence of difficulties paying bills on climate change actions across countries, the analysis reveals a few interesting facts (Table 11). In Belgium, difficulties paying bills do not significantly impact the likelihood of engaging in most of the climate change actions in homes. However, there is a significant association between difficulties paying bills and installed solar panels (η² = 0.013).
Italy shows slightly stronger but still weak associations between payment difficulties and certain energy efficiency factors like insulated homes, the use of energy-efficient household appliances, and the installation of solar panels.
In Romania, the data show that difficulties paying bills have a significant influence on the likelihood of having insulated homes. There is not a significant impact on purchasing low-energy homes, adopting energy-efficient household appliances, utilizing energy-saving equipment, or installing solar panels.
Difficulties paying bills do not significantly affect the likelihood of taking any action to reduce energy consumption and fight climate change in Sweden.
These findings highlight the importance of considering country-specific factors and contexts when examining the relationship between financial difficulties and individuals’ engagement in climate change actions. People who have difficulties in paying their bills often struggle to afford actions that require financial resources, such as the ones mentioned. We also must consider the help schemes offered by the state. At least one study examines the allocation of funds in EU countries, aimed at assisting individuals in better managing the crisis caused by the pandemic and increase in energy prices [68].
In Italy, people who struggle to pay their bills are more likely to have better-insulated homes and adopt energy-efficient household appliances compared to those who do not have financial difficulties (Table 12). The ORs are 1.297 and 1.191, respectively, suggesting that as the frequency of difficulties in paying bills increases, so does the likelihood of these actions. The models explain 1.7% and 1% of the variance in these actions, respectively.
In Belgium, there is also a significant positive relationship between difficulties paying bills and the installation of solar panels at home. Individuals who struggle to pay their bills are 67% more likely to install solar panels compared to those without financial difficulties. Difficulties paying bills explain around 1.3% of the variation in the data. The model performs well, correctly predicting the outcomes in 72.4% of cases.
The results from Italy and Belgium intriguingly suggest that individuals facing financial difficulties, as evidenced by challenges in paying bills, are more inclined to adopt energy-efficient measures such as better home insulation, energy-efficient appliances, and solar panel installations. This counterintuitive finding might be driven by the long-term cost savings associated with these energy-efficient measures, which could be particularly appealing to those under financial strain. The literature provides a complementary perspective. In essence, while individual households in Italy and Belgium seem to be adopting energy-efficient measures as a strategy to combat financial difficulties, there is a broader context to consider. The transition to renewables, while environmentally crucial, might be inadvertently burdening households with higher costs. But both countries took steps to alleviate the financial burden of the energy costs in this period. In 2021, Belgium introduced a social energy tariff to support vulnerable households and provided an energy check for added relief. They also established a fund to assist households with gas and electricity costs. On the other hand, Italy implemented measures to offset rising power prices, including the removal of certain system charges and a reduction in VAT on natural gas. Additionally, Italy enhanced the “social bonus” to further aid families facing economic challenges [69]. This dichotomy underscores the importance of crafting renewable energy policies that are both environmentally and economically sustainable for consumers.
To gain a deeper understanding and develop more effective marketing strategies for promoting consumer actions to combat climate change, we employed a forward method to identify the cumulative factors influencing each of these actions. Besides the already mentioned predictors of different actions, Table 13 shows the impact of socio-economic factors on climate-friendly behaviors by country.
In the context of Belgium, we investigated how socio-economic factors influence the probability of individuals installing solar panels in their homes. Our analysis revealed that facing difficulties in paying bills had a notable and positive impact, implying that those with financial challenges are more inclined to embrace this environmentally conscious behavior. Additionally, we observed a significant positive association with gender (1), indicating that men exhibit a slightly higher tendency to adopt solar panel installation. The collective model exhibited strong statistical significance and accounted for 3.1% of the observed variability.
The data from Italy show that age exhibited a significant positive association, suggesting that as individuals get older, they are more likely to consider enhancing the insulation of their homes. Additionally, facing difficulties paying bills had a notable positive impact on this behavior. The overall model was highly significant and accounted for 4.8% of the observed variability.
In Romania, the adoption of home insulation improvements is predicted by education and difficulties in paying the bills. Specifically, individuals with higher levels of education are more likely to adopt home insulation improvements, as indicated by a positive coefficient (B = 0.2, p < 0.001). Facing difficulties in paying bills also shows a significant positive association with this behavior (B = 0.44, p < 0.001). The overall model is highly significant, with a chi-square value of 1103.058 (p < 0.001), indicating that the model provides valuable insights into this behavior. Moreover, the model explains 4% of the variance in the adoption of home insulation improvements and correctly classifies 76.8% of cases.
When considering the installation of energy-saving equipment, age and education emerged as influential factors. Younger individuals are more likely to install such equipment, as evidenced by a negative coefficient for age (B = −0.22, p = 0.015). Similarly, individuals with higher levels of education exhibit a greater likelihood of installing energy-saving equipment, with a positive coefficient (B = 0.26, p = 0.006). The model for this behavior is also significant, with a chi-square value of 14.085 (p = 0.001), explaining 3.9% of the variance.
Age and the type of community are significant factors influencing the adoption of home insulation improvements in Sweden. Specifically, age has a positive association with this behavior, indicating that older individuals are more likely to adopt such improvements (B = 0.22, p = 0.001). In contrast, the type of community shows a negative association; individuals residing in rural areas or villages are less likely to adopt home insulation improvements compared to those in other types of communities (B = −0.49, p = 0.001).
Education and age are key factors influencing the use of energy-efficient household appliances in Sweden. Higher education levels are positively associated with this behavior, indicating that individuals with more education are more likely to use energy-efficient appliances (B = 0.15, p = 0.001). Additionally, age has a positive association, with older individuals being more likely to use such appliances (B = 0.21, p < 0.001).
Age and gender are significant factors influencing the adoption of energy-saving equipment at home. Age has a positive association with this behavior, indicating that older individuals and men are more likely to adopt energy-saving equipment.

5. Conclusions

For the first objective (O1), the gathered data show that the COVID-19 pandemic has significantly influenced public perceptions of climate change across Belgium, Romania, Italy, and Sweden, with Romania seeing the most substantial decline and Italy maintaining relative consistency. This shift underscores the importance of national context and continuous public engagement in climate action, even amidst other global crises.
The COVID-19 pandemic also has had a noticeable impact on personal actions to combat climate change across Belgium, Italy, Romania, and Sweden (O2), with a general decrease in energy-saving behaviors observed from 2019 to 2021. Despite the overall downward trend, some actions such as investing in energy-efficient appliances and installing solar panels have seen an increase in certain countries like Belgium, indicating a mixed response to the pandemic. These findings underscore the need for tailored strategies to promote sustainable practices in each country, addressing specific barriers and leveraging areas of progress to foster greater engagement in climate-conscious behaviors.
Analyzing the influence of socio-cultural and demographic factors on consumer behavior in households (O3), it can be observed that age significantly influences climate change actions across the studied countries, with older individuals in Italy and Sweden more likely to insulate their homes and use energy-efficient appliances. However, the likelihood of buying a low-energy home and installing energy-saving equipment decreases with age in Belgium and Romania. Gender also plays a role, particularly in Belgium and Sweden, where women are more likely to use energy-efficient appliances and install solar panels. In conclusion, while higher levels of education in Italy, Romania, and Sweden are associated with an increased likelihood of adopting various climate change mitigation actions in households, the proportion of variation in these actions explained by education level is relatively small, indicating the influence of other significant factors. Financial constraints, represented by difficulties in paying bills, significantly influence the adoption of energy-efficient behaviors, particularly in Italy and Belgium.
While the factors examined in this study do exert some influence on actions taken to reduce household energy consumption, their impact is relatively minor. Therefore, future research should explore whether other elements such as governmental financial help, tax incentives, macroeconomic conditions, and cultural factors might provide a more comprehensive explanation for these actions.

Author Contributions

Conceptualization, I.A.I. and P.H.; methodology, I.A.I.; software, I.A.I.; validation, P.H., D.D.M. and A.C.; formal analysis, I.A.I., A.C. and D.D.M.; investigation, P.H.; resources, I.A.I. and A.C.; data curation, A.C.; writing—original draft preparation, I.A.I.; writing—review and editing, I.A.I., P.H., D.D.M. and A.C.; visualization, P.H., D.D.M. and A.C.; supervision, I.A.I.; project administration, I.A.I.; funding acquisition, I.A.I. All authors have read and agreed to the published version of the manuscript.

Funding

This research was funded by the European Union’s Horizon 2020 research and innovation program under the Marie Sklodowska-Curie grant number 801505.

Institutional Review Board Statement

Not applicable.

Informed Consent Statement

Not applicable.

Data Availability Statement

Not applicable.

Conflicts of Interest

The authors declare no conflict of interest.

References

  1. United Nations. Classification and Definition of Regions UN. Available online: https://esa.un.org/MigFlows/Definition%20of%20regions.pdf (accessed on 25 July 2023).
  2. Mikuła, A.; Raczkowska, M.; Utzig, M. Pro-Environmental Behaviour in the European Union Countries. Energies 2021, 14, 5689. [Google Scholar] [CrossRef]
  3. Aral, Ö.; López-Sintas, J. Environmental behavior patterns across clusters of European Union countries: Uncovering heterogeneity in the attitude-behavior-context relationship. J. Clean. Prod. 2023, 388, 135936. [Google Scholar] [CrossRef]
  4. Harvey, D. Anti-capitalist politics in the time of COVID-19. Jacobin Mag. 2020, 20, 1–13. [Google Scholar]
  5. Daryanto, A.; Song, Z.; Soopramanien, D. The COVID-19 pandemic as an impetus for pro-environmental behaviours: The role of causal attribution. Pers. Indiv. Differ. 2022, 187, 111415. [Google Scholar] [CrossRef]
  6. Sajid, K.S.; Hussain, S.; Hussain, R.I.; Mustafa, B. The effect of fear of COVID-19 on green purchase behavior in Pakistan: A multi-group analysis between infected and non-infected. Front. Psychol. 2022, 13, 826870. [Google Scholar] [CrossRef]
  7. Urban, J.; Kohlová, M.B. The COVID-19 crisis does not diminish environmental motivation: Evidence from two panel studies of decision making and self-reported pro-environmental behavior. J. Environ. Psychol. 2022, 80, 101761. [Google Scholar] [CrossRef]
  8. Ruiu, G.; Ruiu, M.L.; Ragnedda, M. How the COVID-19 pandemic impacted the perception of climate change in the UK. Am. Behav. Sci. 2022, 00027642221085885. [Google Scholar] [CrossRef]
  9. Mohommad, A.; Pugacheva, E. International Monetary Fund. 2021. Available online: https://www.google.com/url?sa=t&rct=j&q=&esrc=s&source=web&cd=&cad=rja&uact=8&ved=2ahUKEwjckMzi_db_AhXE2aQKHaDTAXoQFnoECEQQAQ&url=https%3A%2F%2Fwww.ncbi.nlm.nih.gov%2Fpmc%2Farticles%2FPMC9039586%2F&usg=AOvVaw1IyRwXlO3JaFCz56v0U35A&opi=89978449 (accessed on 20 June 2023).
  10. Aldubyan, M.; Krarti, M. Impact of stay home living on energy demand of residential buildings: Saudi Arabian case study. Energy 2022, 238, 121637. [Google Scholar] [CrossRef]
  11. Abdeen, A.; Kharvari, F.; O’Brien, W.; Gunay, B. The impact of the COVID-19 on households’ hourly electricity consumption in Canada. Energy Build. 2021, 250, 111280. [Google Scholar] [CrossRef]
  12. Qarnain, S.S.; Sattanathan, M.; Sankaranarayanan, B.; Ali, S.M. Analyzing energy consumption factors during coronavirus (COVID-19) pandemic outbreak a case study of residential society. Recovery Util. Environ. Eff. 2020, 1–20. [Google Scholar] [CrossRef]
  13. Chattopadhyay, K.; Garg, V.; Paruchuri, P.; Mathur, J.; Valluri, S. Impact of COVID-19 on energy consumption in a residential complex in Hyderabad, India. Energy Inform. 2022, 4, 49. [Google Scholar] [CrossRef]
  14. Todeschi, V.; Javanroodi, K.; Castello, R.; Mohajeri, N.; Mutani, G.; Scartezzini, J.L. Impact of the COVID-19 pandemic on the energy performance of residential neighborhoods and their occupancy behavior. Sustain. Cities Soc. 2022, 82, 103896. [Google Scholar] [CrossRef]
  15. Kocur-Bera, K. Impact of the COVID-19 Pandemic Era on Residential Property Features: Pilot Studies in Poland. Int. J. Environ. Res. Public Health 2022, 19, 5665. [Google Scholar] [CrossRef]
  16. Kang, B.; Won, J.; Kim, E.J. COVID-19 Impact on Residential Preferences in the Early-Stage Outbreak in South Korea. Int. J. Environ. Res. Public Health 2021, 18, 11207. [Google Scholar] [CrossRef]
  17. Cuerdo-Vilches, T.; Navas-Martín, M.Á.; Oteiza, I. A Mixed Approach on Resilience of Spanish Dwellings and Households during COVID-19 Lockdown. Sustainability 2020, 12, 10198. [Google Scholar] [CrossRef]
  18. Sen, A.; Al-Habaibeh, A. The effect of COVID-19 pandemic on energy demand, carbon emission and household budget of households in England due to working from home. In Proceedings of the 12th International Conference on Applied Energy, Bangkok, Thailand, 1–10 December 2020. [Google Scholar]
  19. Zhou, S.; Wu, Z.; Li, J.; Zhang, X.P. Real-time energy control approach for smart home energy management system. Electr. Power Compon. Syst. 2014, 42, 315–326. [Google Scholar] [CrossRef]
  20. Fan, X.; Qiu, B.; Liu, Y.; Zhu, H.; Han, B. Energy visualization for smart home. Energy Procedia 2017, 105, 2545–2548. [Google Scholar] [CrossRef]
  21. Chen, C.F.; de Rubens, G.Z.; Xu, X.; Li, J. Coronavirus comes home? Energy use, home energy management, and the social-psychological factors of COVID-19. Energy Res. Soc. Sci. 2020, 68, 101688. [Google Scholar] [CrossRef]
  22. Genjo, K.; Tanabe, S.I.; Matsumoto, S.I.; Hasegawa, K.I.; Yoshino, H. Relationship between possession of electric appliances and electricity for lighting and others in Japanese households. Energy Build. 2005, 37, 259–272. [Google Scholar] [CrossRef]
  23. Jaimes Torres, M.; Aguilera Portillo, M.; Cuerdo-Vilches, T.; Oteiza, I.; Navas-Martín, M.Á. Habitability, Resilience, and Satisfaction in Mexican Homes to COVID-19 Pandemic. Int. J. Environ. Res. Public Health 2021, 18, 6993. [Google Scholar] [CrossRef]
  24. Das, K. Impact of COVID-19 Pandemic Into Solar Energy Generation Sector. Renew. Sustain. Energy Rev. 2020, 127, 1–8. [Google Scholar] [CrossRef]
  25. Vaka, M.; Walvekar, R.; Rasheed, A.K.; Khalid, M. A review on Malaysia’s solar energy pathway towards carbon-neutral Malaysia beyond COVID’19 pandemic. J. Clean. Prod. 2020, 273, 122834. [Google Scholar] [CrossRef] [PubMed]
  26. Hopper, A.R. Survey Findings: Things are Bad and Getting Worse. SEIA, 26 March 2020. Available online: https://www.seia.org/blog/survey-findings-things-are-bad-and-getting-worse (accessed on 7 June 2023).
  27. Masson-Delmotte, V.; Zhai, P.; Pörtner, H.-O.; Roberts, D.; Skea, J.; Shukla, P.; Pirani, A.; Moufouma-Okia, W.; Péan, C.; Pidcock, R.; et al. Global Warming of 1.5 °C: An IPCC Special Report on the Impacts of Global Warming of 1.5 °C Above Pre-Industrial Levels and Related Global Greenhouse Gas Emission Pathways, in the Context of Strengthening the Global Response to the Threat of Climate Change; IPCC: Cambridge, UK; New York, NY, USA, 2018. [Google Scholar]
  28. Dubois, G.; Sovacool, B.; Aall, C.; Nilsson, M.; Barbier, C.; Herrmann, A.; Bruyère, S.; Andersson, C.; Skold, B.; Nadaud, F.; et al. It starts at home? Climate policies targeting household consumption and behavioral decisions are key to low-carbon futures. Energy Res. Soc. Sci. 2019, 52, 144–158. [Google Scholar] [CrossRef]
  29. Goldstein, B.; Gounaridis, D.; Newell, J.P. The carbon footprint of household energy use in the United States. Proc. Natl. Acad. Sci. USA 2020, 117, 19122–19130. [Google Scholar] [CrossRef]
  30. Maraseni, T.N.; Qu, J.; Zeng, J. A comparison of trends and magnitudes of household carbon emissions between China, Canada and UK. Environ. Dev. 2015, 15, 103–119. [Google Scholar] [CrossRef]
  31. Maraseni, T.N.; Qu, J.; Yue, B.; Zeng, J.; Maroulis, J. Dynamism of household carbon emissions (HCEs) from rural and urban regions of northern and southern China. Environ. Sci. Pollut. Res. 2016, 23, 20553–20566. [Google Scholar] [CrossRef] [PubMed]
  32. Liu, L.; Qu, J.; Maraseni, T.N.; Niu, Y.; Zeng, J.; Zhang, L.; Xu, L. Household CO2 Emissions: Current Status and Future Perspectives. Int. J. Environ. Res. Public Health 2020, 17, 7077. Available online: https://www.ncbi.nlm.nih.gov/pmc/articles/PMC7579624/#B16-ijerph-17-07077 (accessed on 18 August 2023). [CrossRef]
  33. Bosseboeuf, D.; Gynther, L.; Lapillonne, B.; Pollier, K. Energy Efficiency Trends and Policies in the Household and Tertiary Sectors; An Analysis Based on the ODYSSEE and MURE Databases. June 2015. Available online: https://www.odyssee-mure.eu/publications/archives/energy-efficiency-trends-policies-buildings.pdf (accessed on 3 June 2023).
  34. Firth, S.; Lomas, K.; Wright, A.; Wall, R. Dentifying trends in the use of domestic appliances from household electricity consumption measurements. Energy Build. 2008, 40, 926–936. [Google Scholar] [CrossRef]
  35. Gram-Hanssen, K.; Kofod, C.; Petersen, K.N. Different everyday lives: Different patterns of electricity use. In Proceedings of the 2004 American Council for an Energy Efficient Economy, Pacific Grove, CA, USA, 22–27 August 2004; pp. 1–13. [Google Scholar]
  36. Gerdes, J.; Marbus, S.; Boelhouwer, M. Energie Trends 2014. 2014. Available online: https://www.netbeheernederland.nl/_upload/Files/Energietrends_2014_140.pdf (accessed on 11 June 2023).
  37. Ramachandra, T.V.; Subramanian, D.K.; Joshi, N.V.; Gunaga, S.V.; Harikantra, R.B. Domestic energy consumptionpatterns in Uttara Kannada District, Karnataka State, India. Energy Convers. Manag. 2000, 41, 775–831. [Google Scholar] [CrossRef]
  38. Halvorsen, B.; Larsen, B. Norwegian residential electricity demand—A microeconomic assessment of thegrowth from 1976 to 1993. Energy Policy 2001, 29, 227–236. [Google Scholar] [CrossRef]
  39. Dillman, D.A.; Rosa, E.A.; Dillman, J.J. Lifestyle and home energy conservation in the United States: The poor accept lifestyle cutbacks while the wealthy invest in conservation. J. Econ. Psychol. 1983, 3, 299–315. [Google Scholar] [CrossRef]
  40. Diamantopoulos, A.; Schlegelmilch, B.B.; Sinkovics, R.R.; Bohlen, G.M. Can socio-demographics still play a role in profiling green consumers? A review of the evidence and an empirical investigation. J. Bus. Res. 2003, 56, 465–480. [Google Scholar] [CrossRef]
  41. Guerra Santin, O. Actual Energy Consumption in Dwellings: The Effect of Energy Performance Regulations and Occupant Behaviour; IOS Press: Amsterdam, The Netherlands, 2010. [Google Scholar]
  42. O’neill, B.C.; Chen, B.S. Demographic determinants of household energy use in the United States. Popul. Dev. Rev. 2002, 28, 53–88. [Google Scholar]
  43. Yun, G.Y.; Steemers, K. Behavioural, physical and socio-economic factors in household cooling energy consumption. Appl. Energy 2011, 88, 2191–2200. [Google Scholar] [CrossRef]
  44. Druckman, A.; Jackson, T. Household energy consumption in the UK: A highly geographically and socio-economically disaggregated model. Energy Policy 2008, 36, 3177–3192. [Google Scholar] [CrossRef]
  45. Jeeninga, H.; Uyterlinde, M.; Uitzinger, J. Energieverbruik van Energiezuinige Woningen; Effecten van Gedrag en Besparingsmaatregelen op de Spreiding in the Hoogte van Het Reele Energieverbruik; Energieonderzoek Centrum Nederland: Petten, The Netherlands, 2001. [Google Scholar]
  46. Carlsson-Kanyama, A.; Lindén, A.-L. Energy efficiency in residences—Challenges for women and men in the North. Energy Policy 2007, 35, 2163–2172. [Google Scholar] [CrossRef]
  47. Dil, B.R.; Khondoker, A.M.; Akhter, A. Household Energy Consumption and Its Determinants in Timor-Leste. Asian Development Review 2017, 34, 167–197. [Google Scholar] [CrossRef]
  48. Mills, B.; Schleich, J. Residential energy-efficient technology adoption, energy conservation, knowledge, and attitudes: An analysis of European countries. Energy Policy 2012, 49, 616–628. [Google Scholar] [CrossRef]
  49. Pandey, V.; Chaubal, A. Comprehending household cooking energy choice in rural India. Biomass Bioenergy 2011, 35, 4724–4731. [Google Scholar] [CrossRef]
  50. Reddy, B.; Srinivas, T. Energy use in Indian household sector–an actor-oriented approach. Energy 2009, 34, 992–1002. [Google Scholar] [CrossRef]
  51. Heltberg, R. Factors determining household fuel choice in Guatemala. Environ. Dev. Econ. 2005, 10, 337–361. [Google Scholar] [CrossRef]
  52. Cai, J.; Jiang, Z. Changing of energy consumption patterns from rural households to urban households in China: An example from Shaanxi Province, China. Renew. Sustain. Energy Rev. 2008, 12, 1667–1680. [Google Scholar] [CrossRef]
  53. Jaakson, R. Urbanization and natural environments: A position paper. Urban Ecol. 1977, 2, 245–257. [Google Scholar] [CrossRef]
  54. Lam, J. Residential sector air conditioning loads and electricity use in Hong Kong. Energy Convers. Manag. 2000, 41, 1757–1968. [Google Scholar] [CrossRef]
  55. Heinonen, J.; Junnila, S. Residential energy consumption patterns and the overall housing energy requirements of urban and rural households in Finland. Energy Build. 2014, 76, 295–303. [Google Scholar] [CrossRef]
  56. Wiedenhofer, D.; Lenzen, M.; Steinberger, J. Energy requirements of consumption: Urban form, climatic and socio-economic factors, rebounds and their policy implications. Energy Policy 2013, 63, 696–707. [Google Scholar] [CrossRef]
  57. Breunig, R.; McKibbin, R. The Effect of Survey Design on Household Reporting of Financial Difficulty. J. R. Stat. Soc. Ser. A Stat. Soc. 2011, 174, 991–1005. [Google Scholar] [CrossRef]
  58. Michaël, A. Do high electricity bills undermine public support for renewables? Evidence from the European Union. Energy Policy 2021, 156, 112400. [Google Scholar] [CrossRef]
  59. European Commission. Eurobarometer 91.3. 2019. Available online: https://search.gesis.org/research_data/ZA7572?doi=10.4232/1.13372 (accessed on 2 January 2023).
  60. European Commission; European Parliament. GESIS ZA7781 Data File Version 2.0.0. GESIS, Cologne. 2021. Available online: https://search.gesis.org/research_data/ZA7781?doi=10.4232/1.14079 (accessed on 2 January 2023).
  61. Gesis. Eurobarometer Data Service. Available online: https://www.gesis.org/en/eurobarometer-data-service/survey-series/standard-special-eb/sampling-and-fieldwork (accessed on 13 December 2022).
  62. Tomczak, M.; Tomczak, E. The need to report effect size estimates revisited. An overview of some recommended measure of effect size. Trends Sport Sci. 2014, 1, 19–25. [Google Scholar]
  63. Adams, M.; Conway, T. Eta Squared. In Encyclopedia of Quality of Life and Well-Being Research; Springer: Dordrecht, The Netherlands, 2014; pp. 1965–1966. [Google Scholar]
  64. Schüppert, A. Binomial (or Binary) Logistic Regression. In Proceedings of the Statistics Seminar, Spring, 2009. Available online: http://www.let.rug.nl/~nerbonne/teach/rema-stats-meth-seminar/presentations/Binary-Logistic-Regression-Schueppert-2009.pdf (accessed on 12 January 2023).
  65. Field, A. Discovering Statistics Using SPSS; SAGE Publications Ltd.: London, UK, 2009. [Google Scholar]
  66. Harris, J.K. Primer on binary logistic regression. Fam. Med. Com. Health 2021, 9, e00129. [Google Scholar] [CrossRef]
  67. Iancu, I.; Darab, C.; Cirstea, S. The Effect of the COVID-19 Pandemic on the Electricity Consumption in Romania. Energies 2021, 14, 3146. [Google Scholar] [CrossRef]
  68. Sgaravatti, G.; Tagliapietra, S.; Zachmann, G. National Policies to Shield Consumers from Rising Energy Prices. 13 June 2022. Available online: https://fondazionecerm.it/wp-content/uploads/2022/06/National-policies-to-shield-consumers-from-rising-energy-prices-_-Bruegel.pdf (accessed on 7 June 2023).
  69. Sgaravatti, G.; Tagliapietra, S.; Trasi, C.; Zachmann, G. National Policies to Shield Consumers from Rising Energy Prices. 4 November 2021. Available online: https://www.bruegel.org/dataset/national-policies-shield-consumers-rising-energy-prices (accessed on 5 September 2023).
Figure 1. Number of respondents that consider climate change a global concern, by country and by year. Own representation from survey data [59,60].
Sustainability 15 14679 g001
Figure 2. Number of respondents that took personal actions to fight climate change across four studied countries, in 2019 and 2021. Source: own representation from survey data [59,60].
Sustainability 15 14679 g002aSustainability 15 14679 g002b
Table 1. Questions related to actions to fight climate change.
QuestionsScale and Coding
Q1. Which is the most serious of the world problems—first climate changeDichotomous values (0—no; 1—yes)
Q2. Actions to fight climate change:
   a.  insulated home better Dichotomous values (0—no; 1—yes)
   b. bought low-energy home Dichotomous values (0—no; 1—yes)
   c. purchase energy-efficient appliances Dichotomous values (0—no; 1—yes)
   d. installing equipment to lower energy consumption Dichotomous values (0—no; 1—yes)
    e. install solar panels Dichotomous values (0—no; 1—yes)
Table 2. Questions related to socio-economic and demographic factors.
QuestionsScale and Coding
Q3. Socio-economic and demographic variables
 (a) Age (1) 15–24; (2) 25–34; (3) 35–44; (4) 45–54; (5) 55–64; (6) 65+
 (b) Education (1) No, pre-primary and primary education; (2) Secondary education (lower secondary; upper secondary; posts-secondary non tertiary education), and (3) Tertiary education (short cycle tertiary; bachelor; master; doctoral education).
 (c) Gender (1) Man; (2) woman.
 (d) Type of community (1) Rural area or village; (2) small/middle town; (3) large town.
 (e) Difficulties in paying the bills (1) Most of the time; (2) from time to time; (3) almost never/ never.
Table 3. Results of variations in the influence of age on consumers’ climate change actions.
Source of VariationCountryη²Countryη²
Insulated home betterBelgium0.009Romania0.022
Bought low-energy home0.0120.003
Energy eff HH appliances0.0230.019
Energy saving equipment home0.0260.01
Installed solar panels home0.0130.008
Insulated home betterItaly0.021Sweden0.022
Bought low-energy home0.0140.013
Energy eff HH appliances0.0390.073
Energy saving equipment home0.0060.026
Installed solar panels home0.0030.008
Degrees of freedom (Df) = 5, eta squared (η²).
Table 4. Results from binary logistic regression with age as a predictor of different actions to fight climate change.
CountryBS.E.WaldOR95% C.I. ORχ²R² CSR² N%
LLUL
(a)IT0.2390.06912.0361.2691.1091.45313.0540.0130.02790.4
SW0.2450.06713.3461.2781.121.45714.1740.0130.03191.5
(b)BE−0.1750.0844.3360.840.7130.994.1790.040.0193.3
(c)IT0.090.0395.4551.0941.0151.1815.5140.0050.00763.9
SW0.2180.03734.6261.2441.1571.33835.7980.0340.04656.8
(d)BE−0.2210.06910.1590.8010.6990.9189.8190.0090.0289.9
RO−0.2220.0856.8710.8010.6780.9467.130.0070.0294.6
SW0.2790.06617.6231.3221.161.50619.0090.0180.0491
Df = 1; p < 0.001; Belgium(BE), Italy (IT), Romania (RO), Sweden (SW); (a) Insulated home better; (b) Bought low-energy home; (c) Energy eff. HH appliances; (d) Energy saving equipment home.
Table 5. The analysis of associations between gender and consumers’ climate change actions.
Country BE (n = 1034)IT (n = 1029)RO (n = 1034)SW (n = 1045)
Insulated home better
Df = 1
Chi-square2.1720.8220.0420.639
p0.1410.3650.8380.424
Cramer’s V−0.046−0.0280.006−0.025
Bought low-energy home
Df = 1
Chi-square0.350.2420.5651.435
p0.5540.6230.4180.231
Cramer’s V−0.018−0.015−0.025−0.037
Energy eff HH appliances
Df = 1
Chi-square7.6121.080.2415.537
p0.0060.2980.625<0.001
Cramer’s V0.0860.033−0.0150.122
Energy saving equipment home
Df = 1
Chi-square0.0231.2472.0733.035
p0.880.2640.150.081
Cramer’s V0.005−0.035−0.045−0.054
Installed solar panels home
Df = 1
Chi-square10.8310.0011.394208
p<0.0010.9710.2380.04
Cramer’s V−0.1020.0010.036−0.063
Table 6. Results from binary logistic regression with gender as a predictor of different actions to fight climate change.
BS.E.WaldOR95% C.I. ORχ²R² CSR² N%
LLUL
(c)BE−0.3520.1287.590.7030.5470.903 7.64 0.0070.0159
SW−0.5010.12715.4460.6060.4720.77815.540.0150.0260.2
(e)BE0.4680.14310.7481.5971.2072.112 1206.65 0.0110.1572.4
Df = 1; p < 0.001. (c) Energy eff. HH appliances; (e) Installed solar panels home.
Table 7. The analysis of associations between education and climate change actions.
Source of VariationCountryη²Countryη²
Insulated home betterBelgium0.006Romania0.039
Bought low-energy home0.0140.008
Energy eff HH appliances0.0030.034
Energy saving equipment home0.010.013
Installed solar panels home0.0070.014
Insulated home betterItaly0.011Sweden0.011
Bought low-energy home0.0150.017
Energy eff HH appliances0.0510.023
Energy saving equipment home0.020.021
Installed solar panels home0.0130.021
Df = 8.
Table 8. Results from binary logistic regression with education as a predictor of different actions to fight climate change.
CountryBS.E.WaldOR95% C.I.for ORχ²R² CSR² N%
LLUL
IT (c)0.7120.14225.2052.0381.5432.69126.289 0.025 0.034 68.1
RO (a)0.6650.17514.3761.9451.3792.74414.428 0.014 0.021 76.8
(c)0.8790.16727.6532.4091.7363.34428.816 0.027 0.038 69.6
(d)0.8710.3028.2952.3891.3214.3217.788 0.007 0.022 94.6
SW (c)0.4920.12315.9821.6361.2852.08216.226 0.015 0.021 60.2
Df = 1; p < 0.05; (a) Insulated home better; (c) Energy eff. HH appliances; (d) Energy saving equipment home.
Table 9. The analysis of associations between community type and climate change actions.
Source of VariationCountryη²Countryη²
Insulated home betterBelgium0.004Romania0.001
Bought low-energy home0.0020.001
Energy eff HH appliances0.0010.002
Energy saving equipment home0.0010.002
Installed solar panels home0.0240.004
Insulated home betterItaly0.002Sweden0.014
Bought low-energy home0.0020.003
Energy eff HH appliances0.0190.009
Energy saving equipment home0.0010.003
Installed solar panels home0.0050.004
Eta squared (η²).
Table 10. Results from logistic regression with community type as a predictor of different actions to fight climate change.
BS.E.WaldOR95% C.I. for ORχ²R² CSR² N%
LLUL
(a) SW−0.5510.14614.2580.5760.4330.76714.6090.0140.03191.5
(c) IT0.2490.115.0871.2831.0331.5935.1250.0050.00763.9
(e)BE−0.4390.09820.20.6450.5320.78121.1490.020.02972.4
Df = 1; p < 0.05. (a) Insulated home better; (c) Energy eff. HH appliances; (e) Installed solar panels home.
Table 11. The analysis of associations between difficulties paying bills and climate change actions.
Source of VariationCountryη²Countryη²
Insulated home betterBelgium0Romania0.014
Bought low-energy home00.003
Energy eff HH appliances0.0010.004
Energy saving equipment home0.0080.002
Installed solar panels home0.0130.002
Insulated home betterItaly0.013Sweden0.001
Bought low-energy home0.0020.001
Energy eff HH appliances0.0190.002
Energy saving equipment home0.0020.006
Installed solar panels home0.010.007
Eta squared (η²).
Table 12. Results from binary logistic regression with difficulties paying bills as a predictor of different actions to fight climate change.
BS.E.WaldOR95% C.I. ORχ²R² CSR² N%
LLUL
(a)IT 0.260.0869.2121.2971.0961.5338.0640.0080.01790.4
(c) IT 0.1750.0657.1571.1911.0481.3537.2140.0070.0164
(e)BE 0.5130.14911.8111.671.2472.2381204.1360.0130.01972.4
p < 0.05; df = 1; (a) Insulated home better; (c) Energy eff. HH appliances; (e) Installed solar panels home.
Table 13. Results from binary logistic regression with multiple economic and social factors as predictors of different actions to fight climate change, in the four studied countries.
Country Variables BS.E.WaldORχ²R² N%
BelgiumInstalled solar panels homeDifficulties paying the bills 0.47 0.15 9.95 1195.48 1195.4770.03172.4
Gender (1) 0.42 0.14 8.54
Constant −2.51 0.43 34.63
ItalyInsulated home betterAge 0.26 0.07 13.95 23.27 23.270.04890.4
Difficulties paying the bills 0.31 0.09 11.75
Constant −4.1 0.43 92.51
Energy eff HH appliancesEducation 0.23 0.04 31.6 46,178 46,1780.0666.1
Age 0.14 0.04 12.07
Difficulties paying the bills 0.15 0.07 4.93
Constant −2.45 0.31 61.68
RomaniaInsulated home betterEducation 0.2 0.06 12.94 1103.06 1103.0580.0476.8
Difficulties paying the bills 0.44 0.13 11.24
Constant −3.14 0.4 62.19
Energy saving equipment home Age −0.22 0.09 5.9 14.09 14.0850.03994.6
Education 0.26 0.09 7.58
Constant −3.27 0.52 38.89
SwedenInsulated home betterAge 0.22 0.07 10.44 25.05 25.0470.05591.5
Type of community −0.49 0.15 11.18
Constant −2.25 0.43 26.98
Energy eff HH appliancesEducation 0.15 0.04 14.79 50.76 50.7570.06460
Age 0.21 0.04 30.85
Constant −2.02 0.26 58.75
Energy saving equipment home Age 0.29 0.07 18.51 23.79 23.790.04891
Gender (1) 0.45 0.22 4
Constant −3.7 0.34 117.09
Disclaimer/Publisher’s Note: The statements, opinions and data contained in all publications are solely those of the individual author(s) and contributor(s) and not of MDPI and/or the editor(s). MDPI and/or the editor(s) disclaim responsibility for any injury to people or property resulting from any ideas, methods, instructions or products referred to in the content.

