
A Sustainable and Environmentally Friendly Concrete for Structural Applications


Abstract
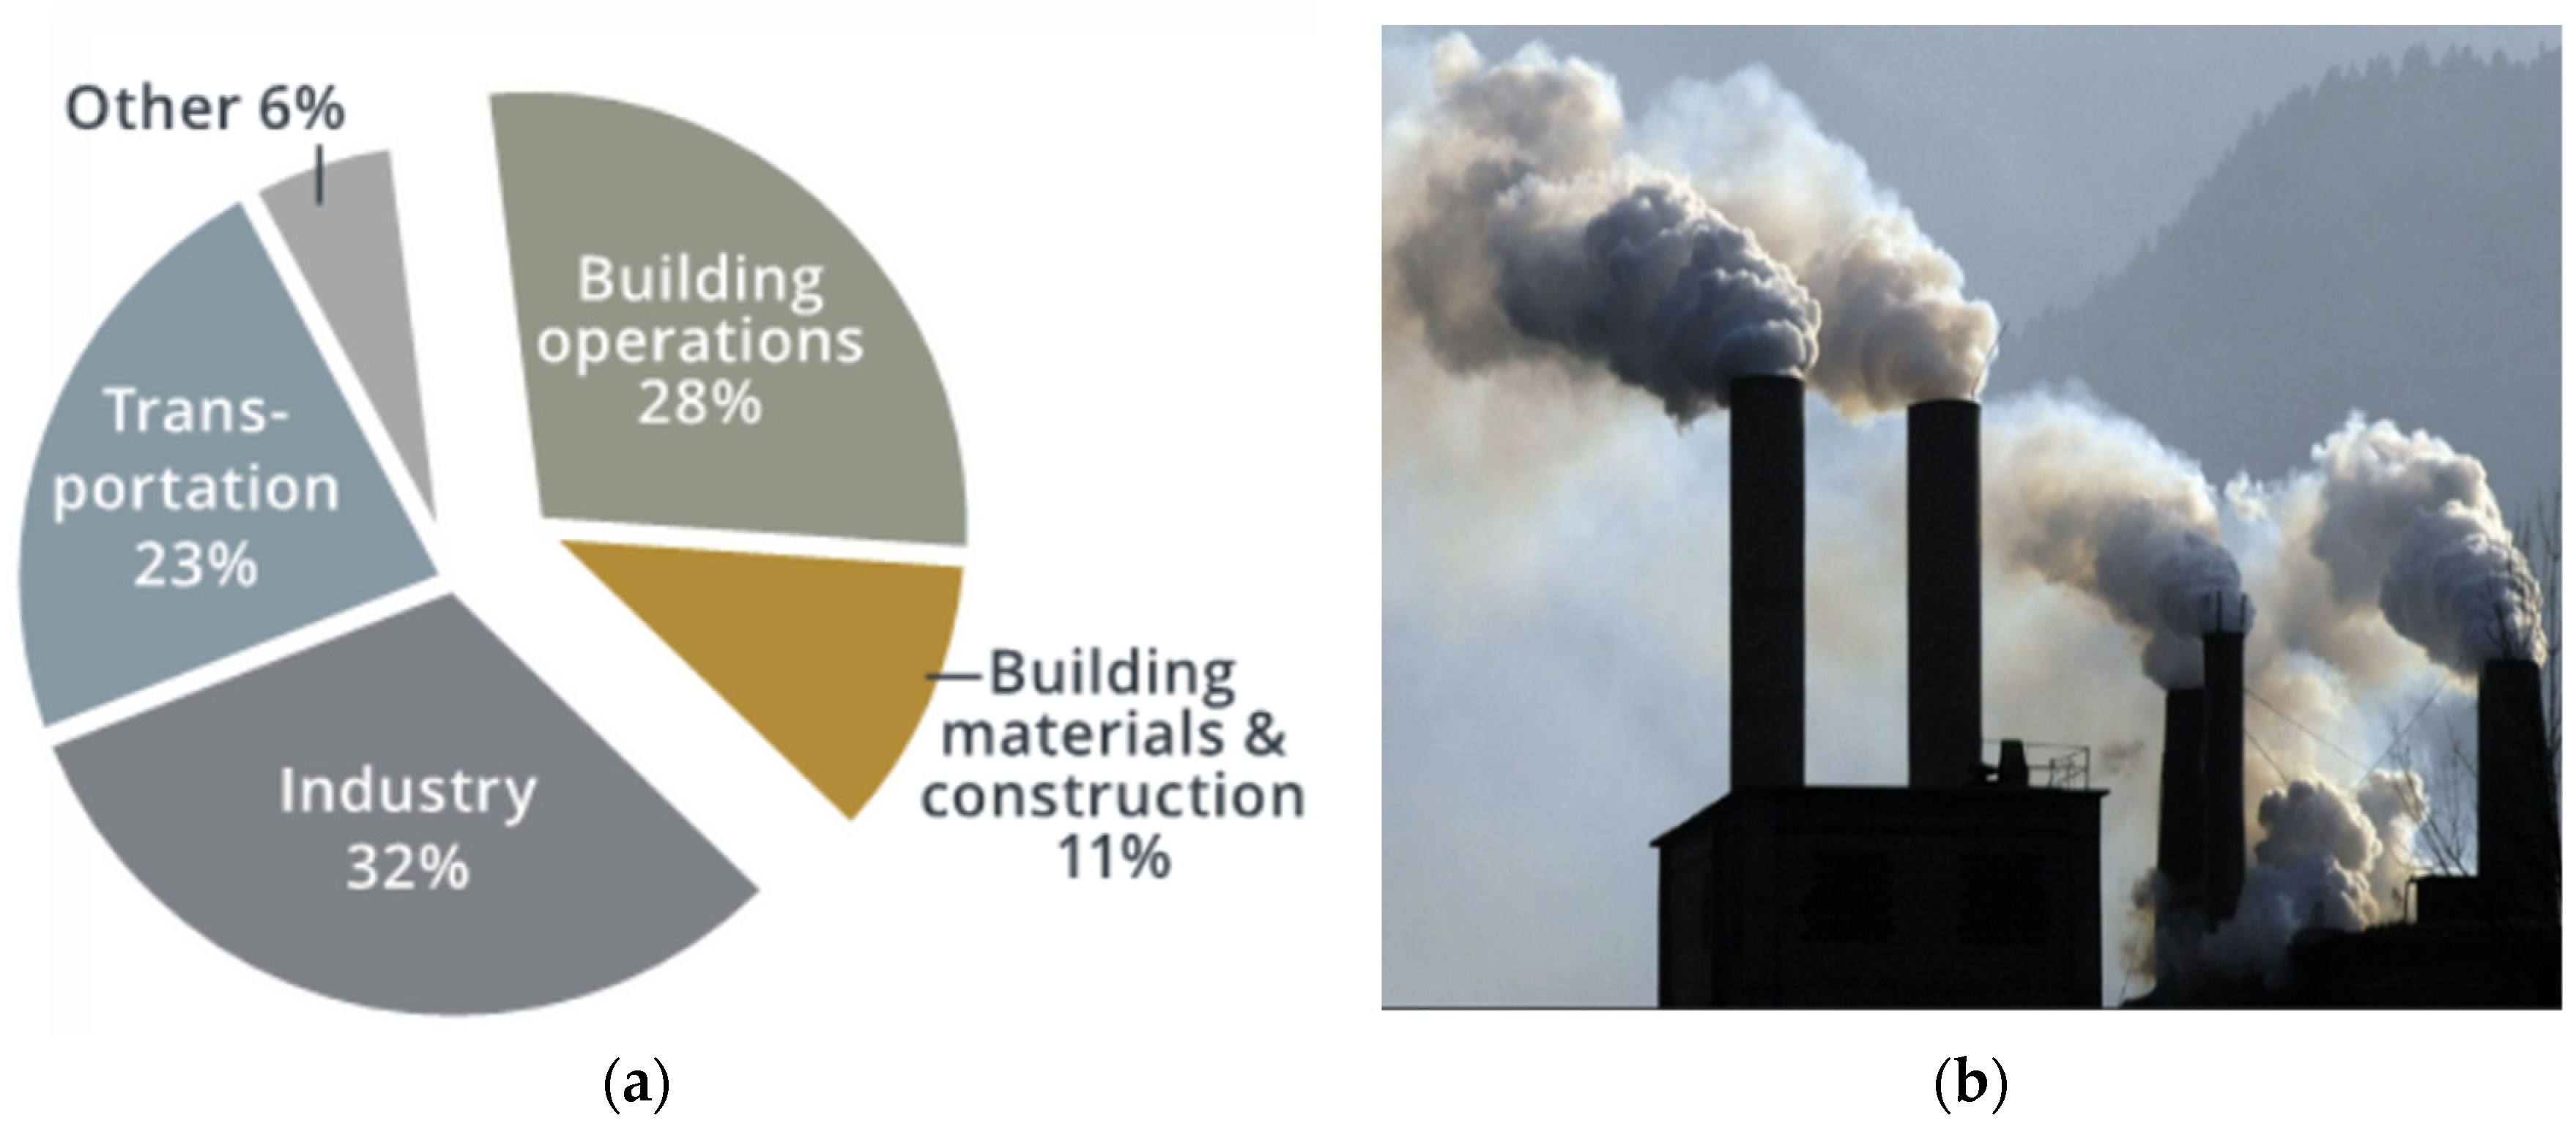
:1. Introduction
1.1. Research Gaps
1.2. Research Motivation
1.3. Research Scope
1.4. Research Objectives
- To reduce carbon emissions from the production of cement and aggregates;
- To find beneficial uses of PCC and UCA in structural concrete that not only reduce the carbon footprint of the concrete mix, but also utilizes the waste products from the sugar beet and concrete demolition sectors, along with returned concrete from ready-mix operations;
- To determine the quantities of PCC and UCA that can be incorporated in concrete mixes, while maintaining the same strength.
1.5. Literature Review
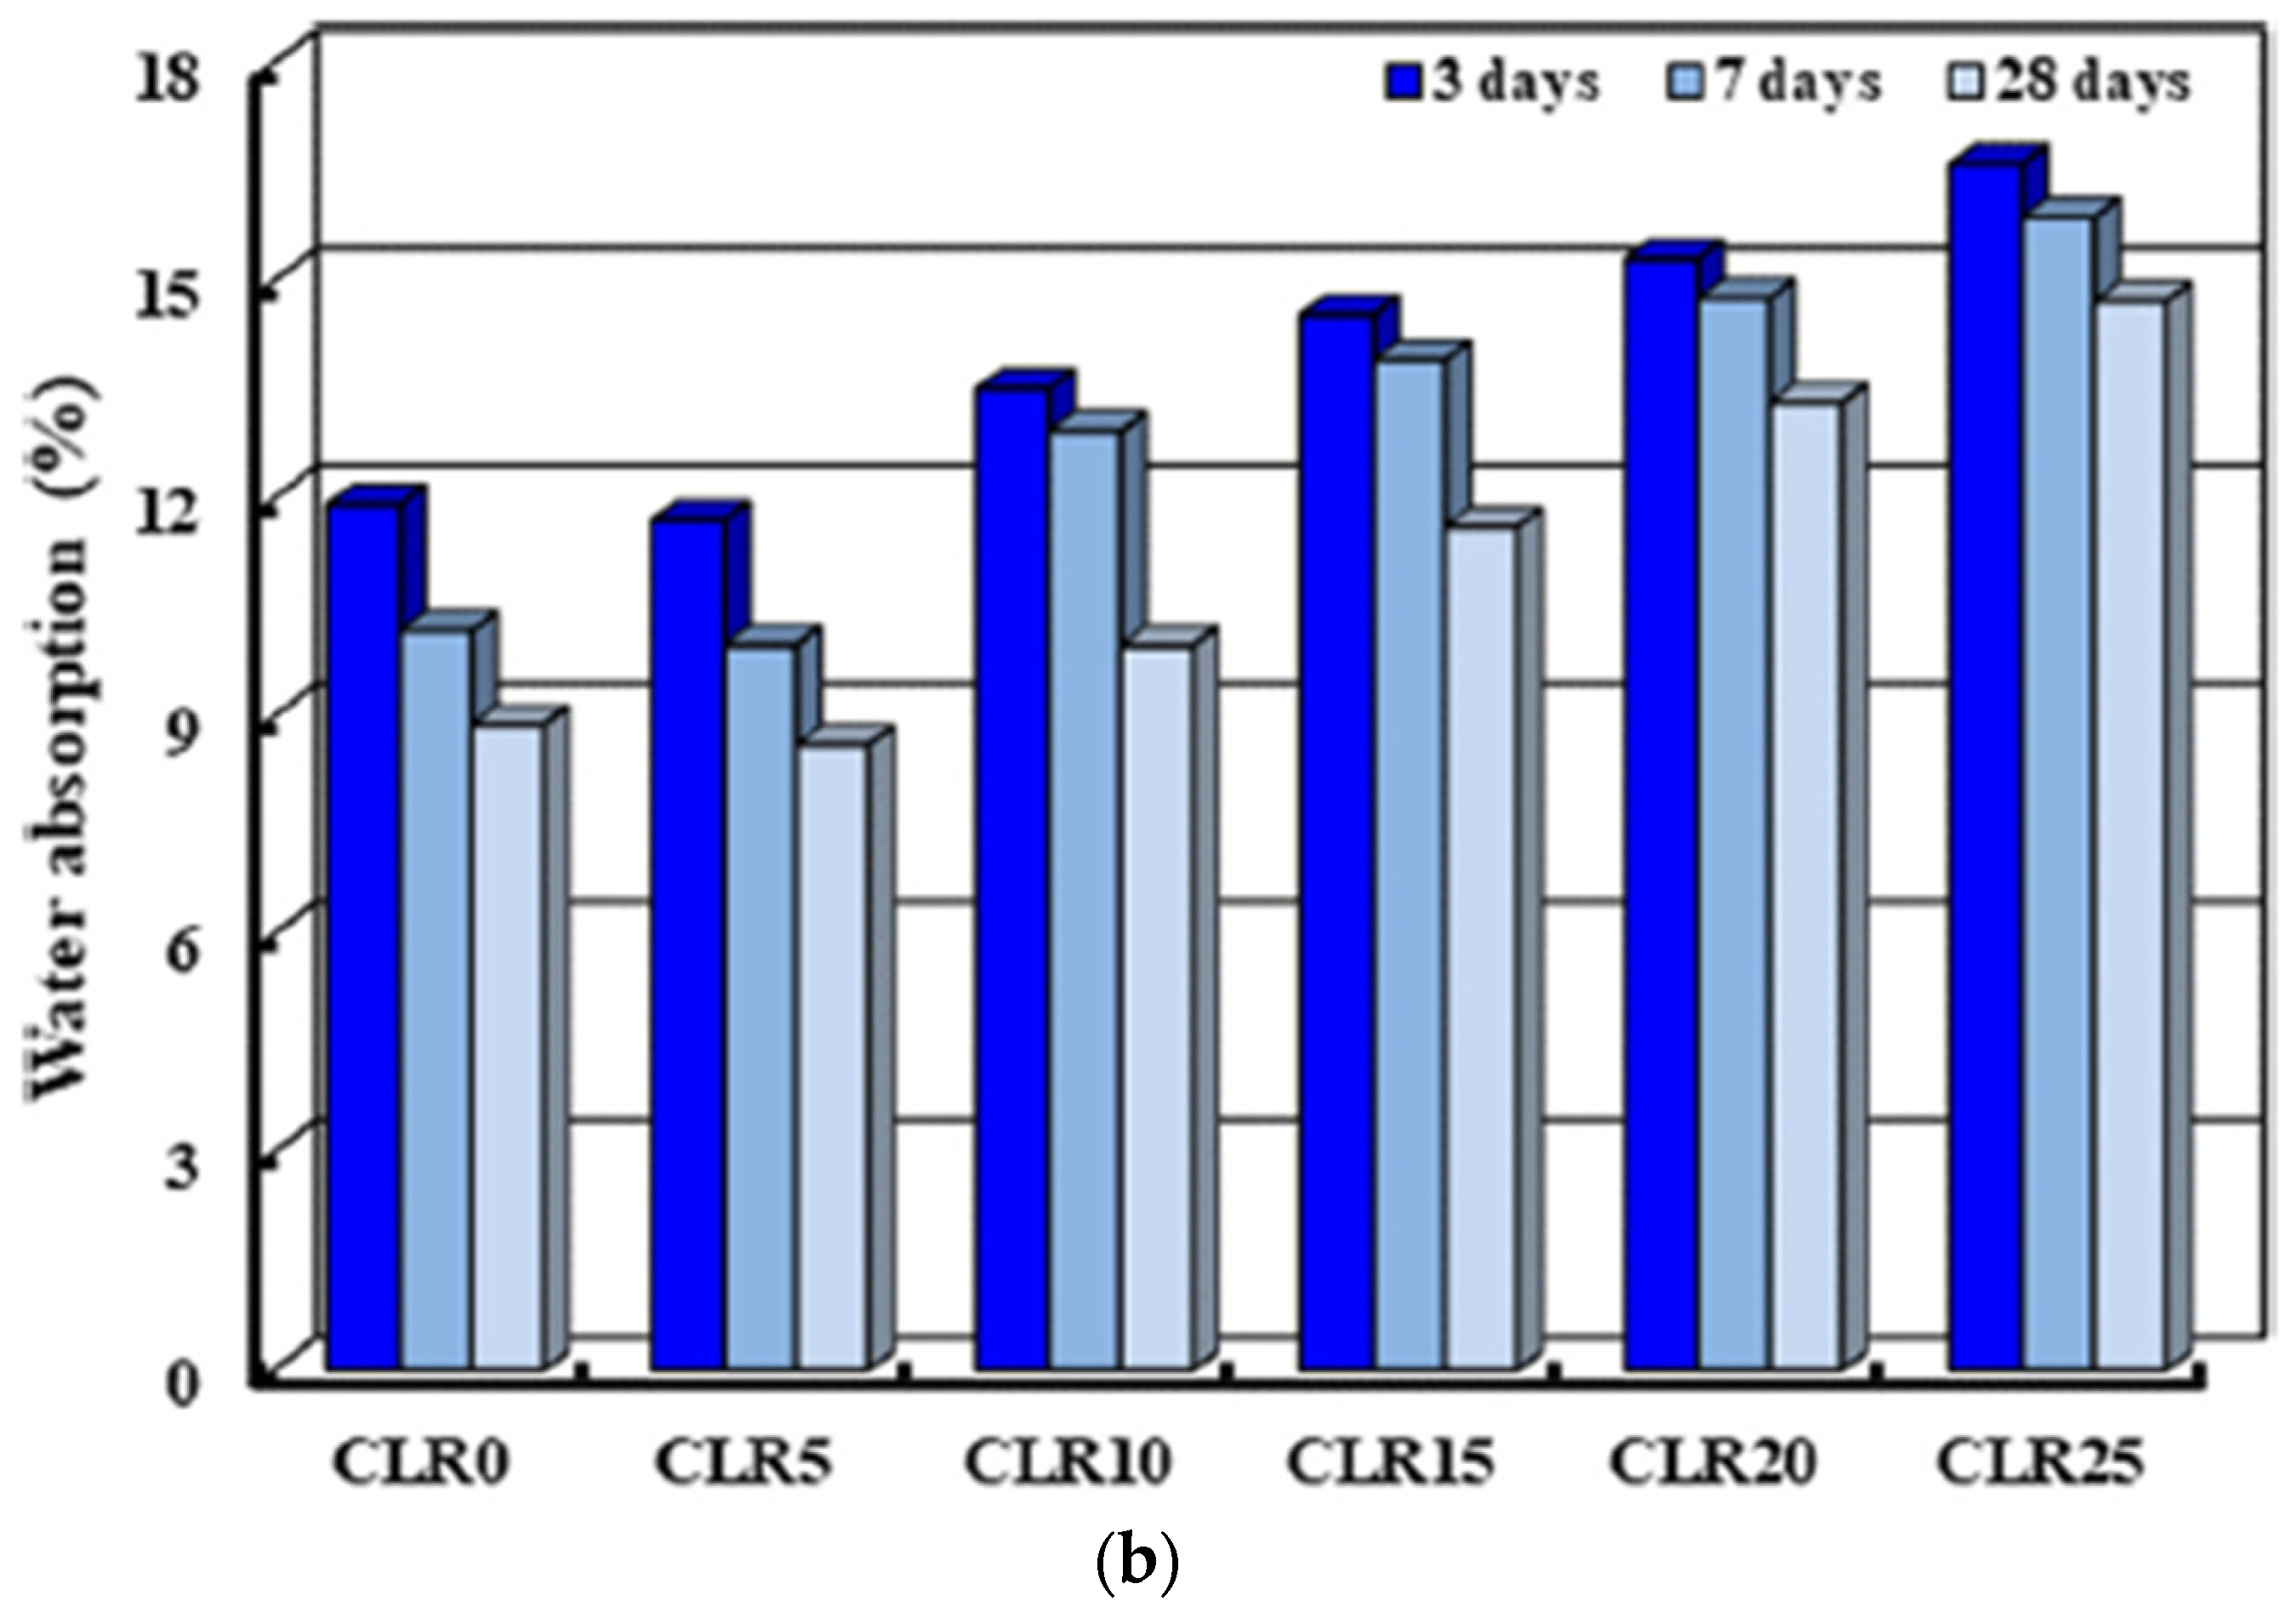
1.5.1. Precipitated Calcium Carbonate (PCC)/Carbonation Lime Residue (CLR)/Carbonation Mud/Lime Sludge
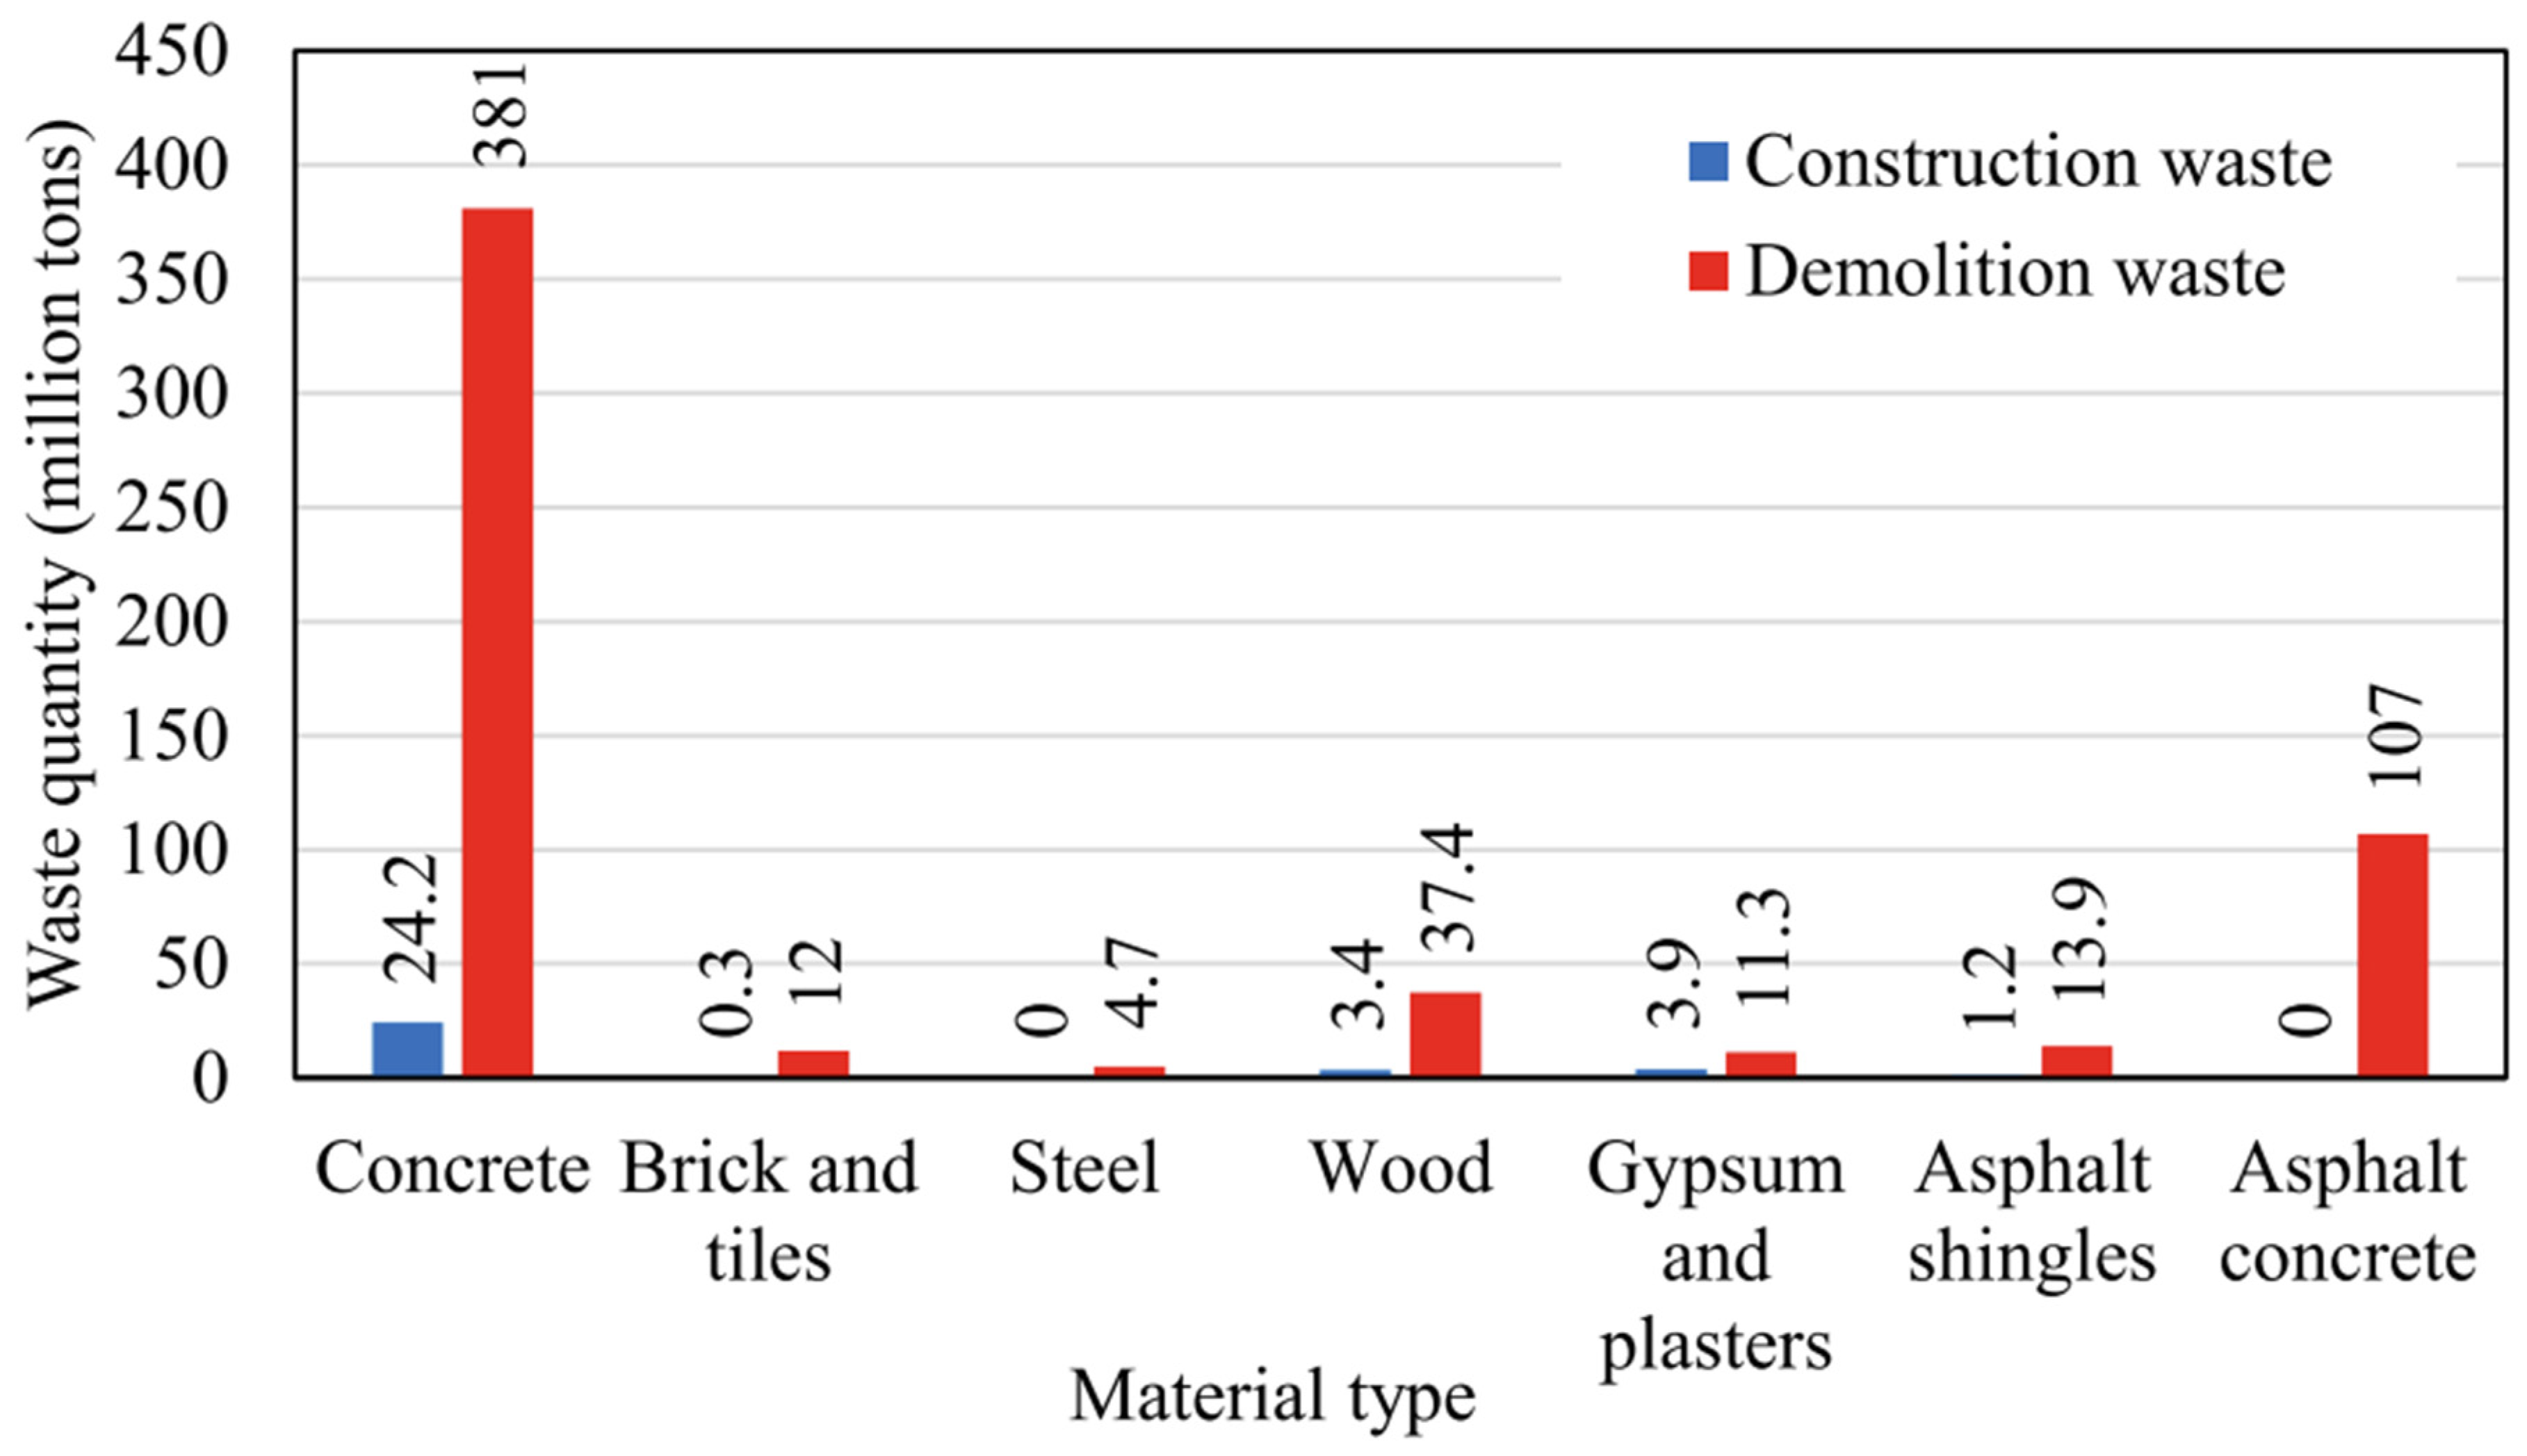
1.5.2. Recycled Concrete Aggregate (RCA) and Upcycled Recycled Concrete Aggregate (UCA)
2. Materials and Methods
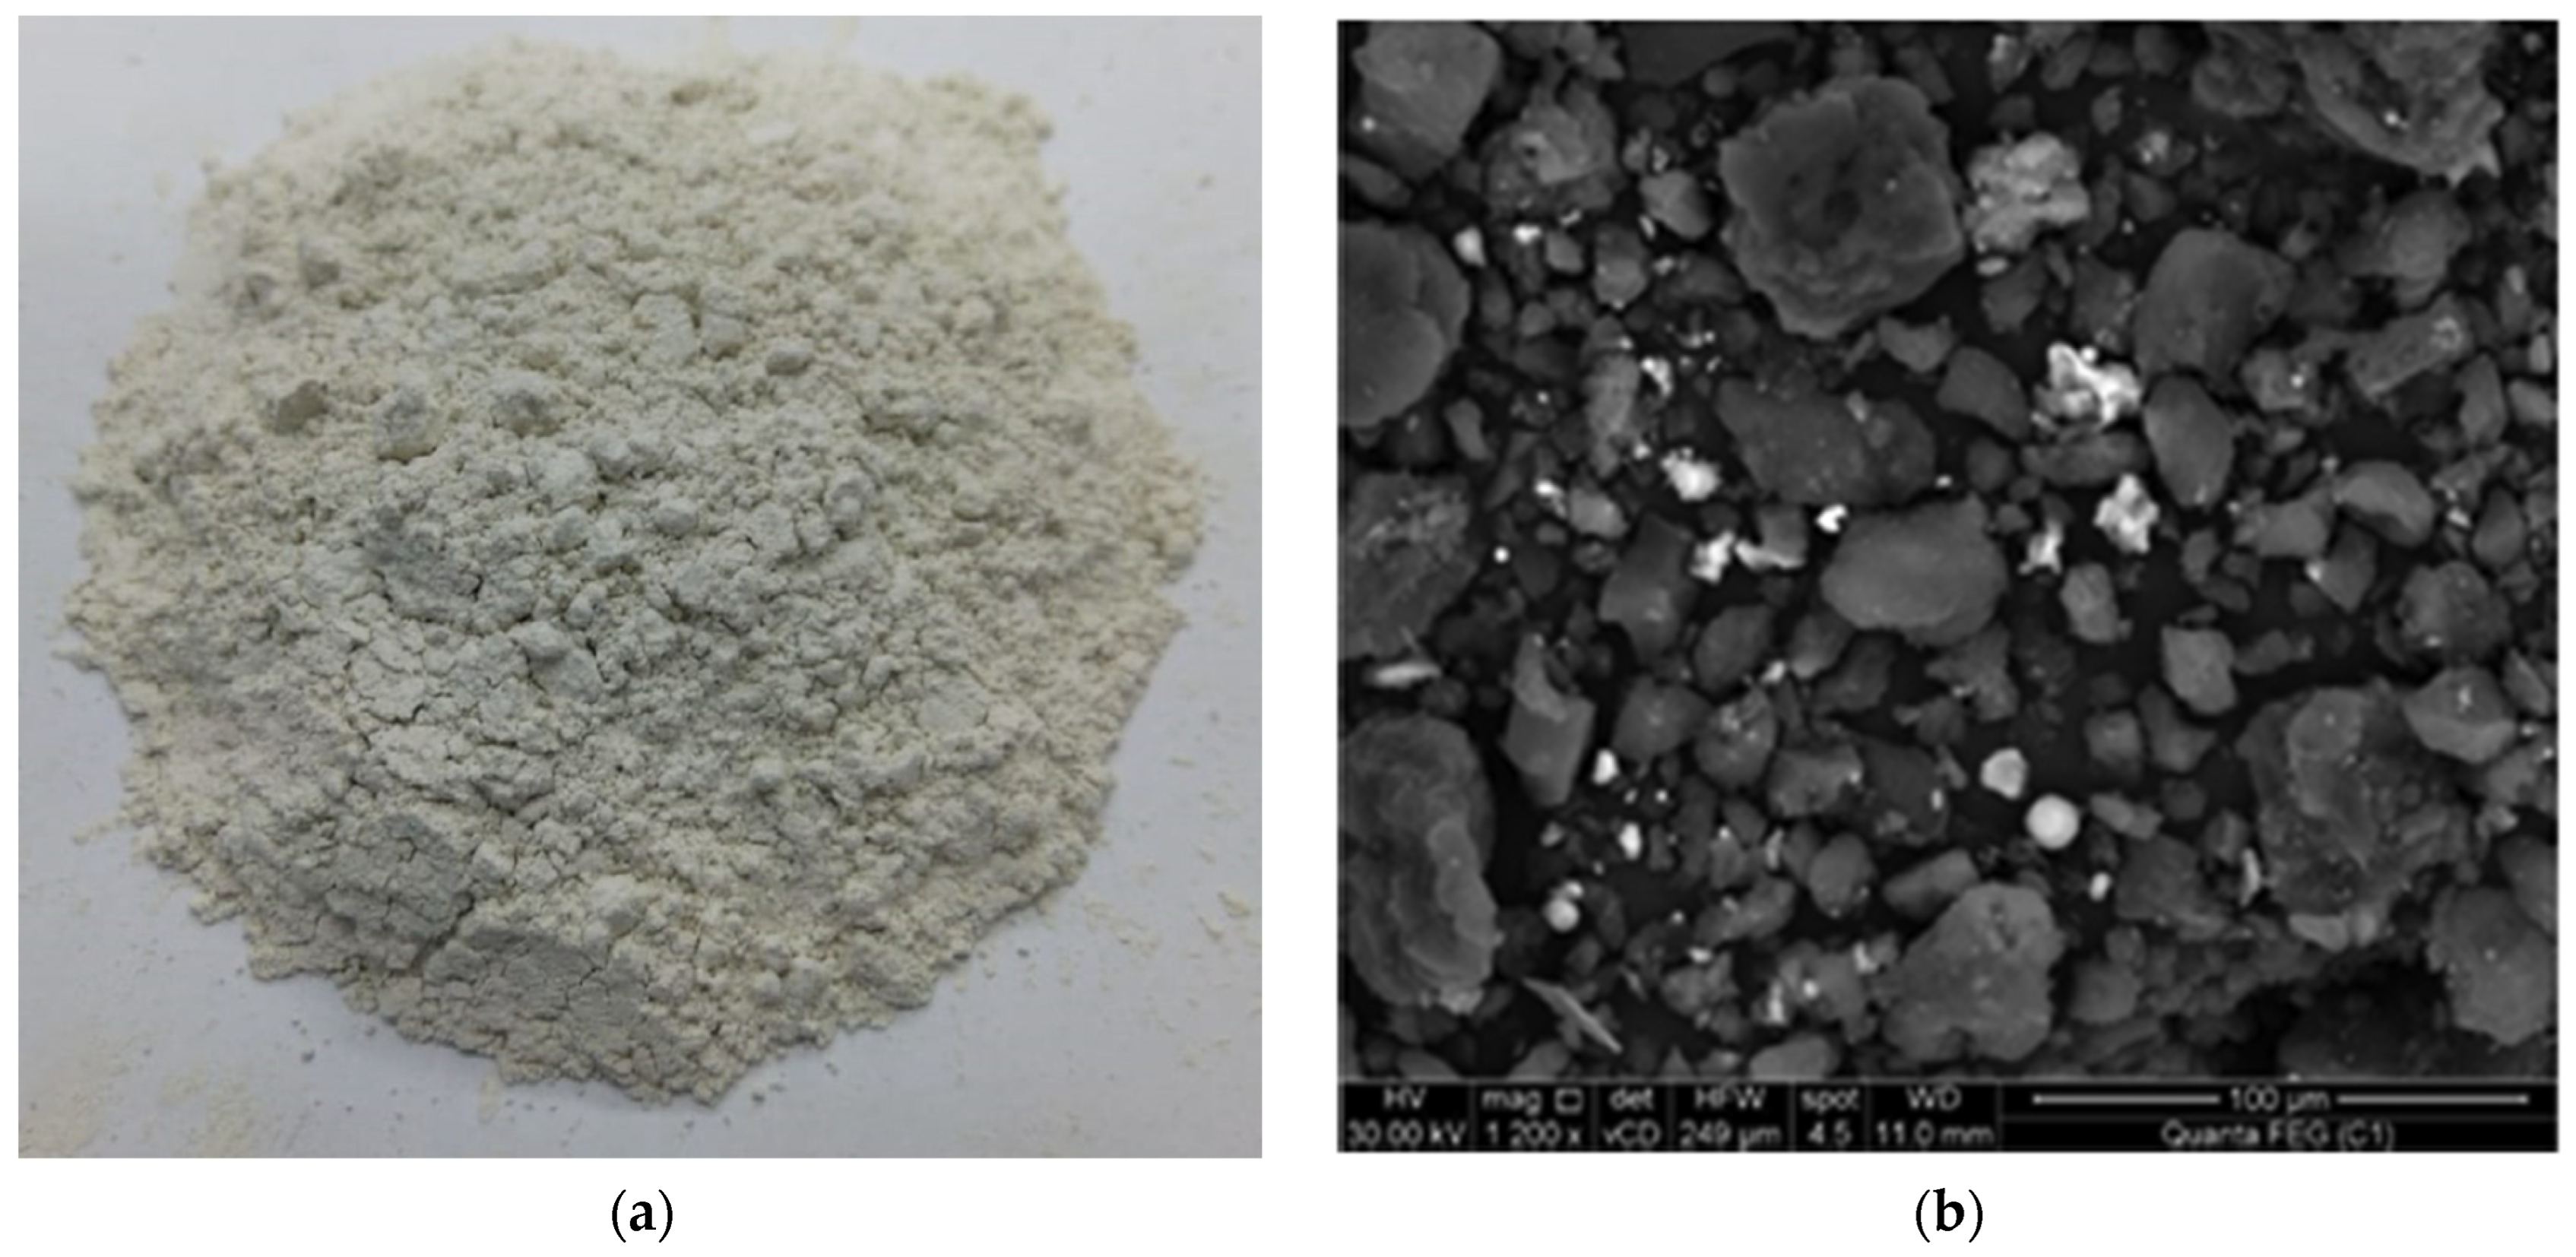
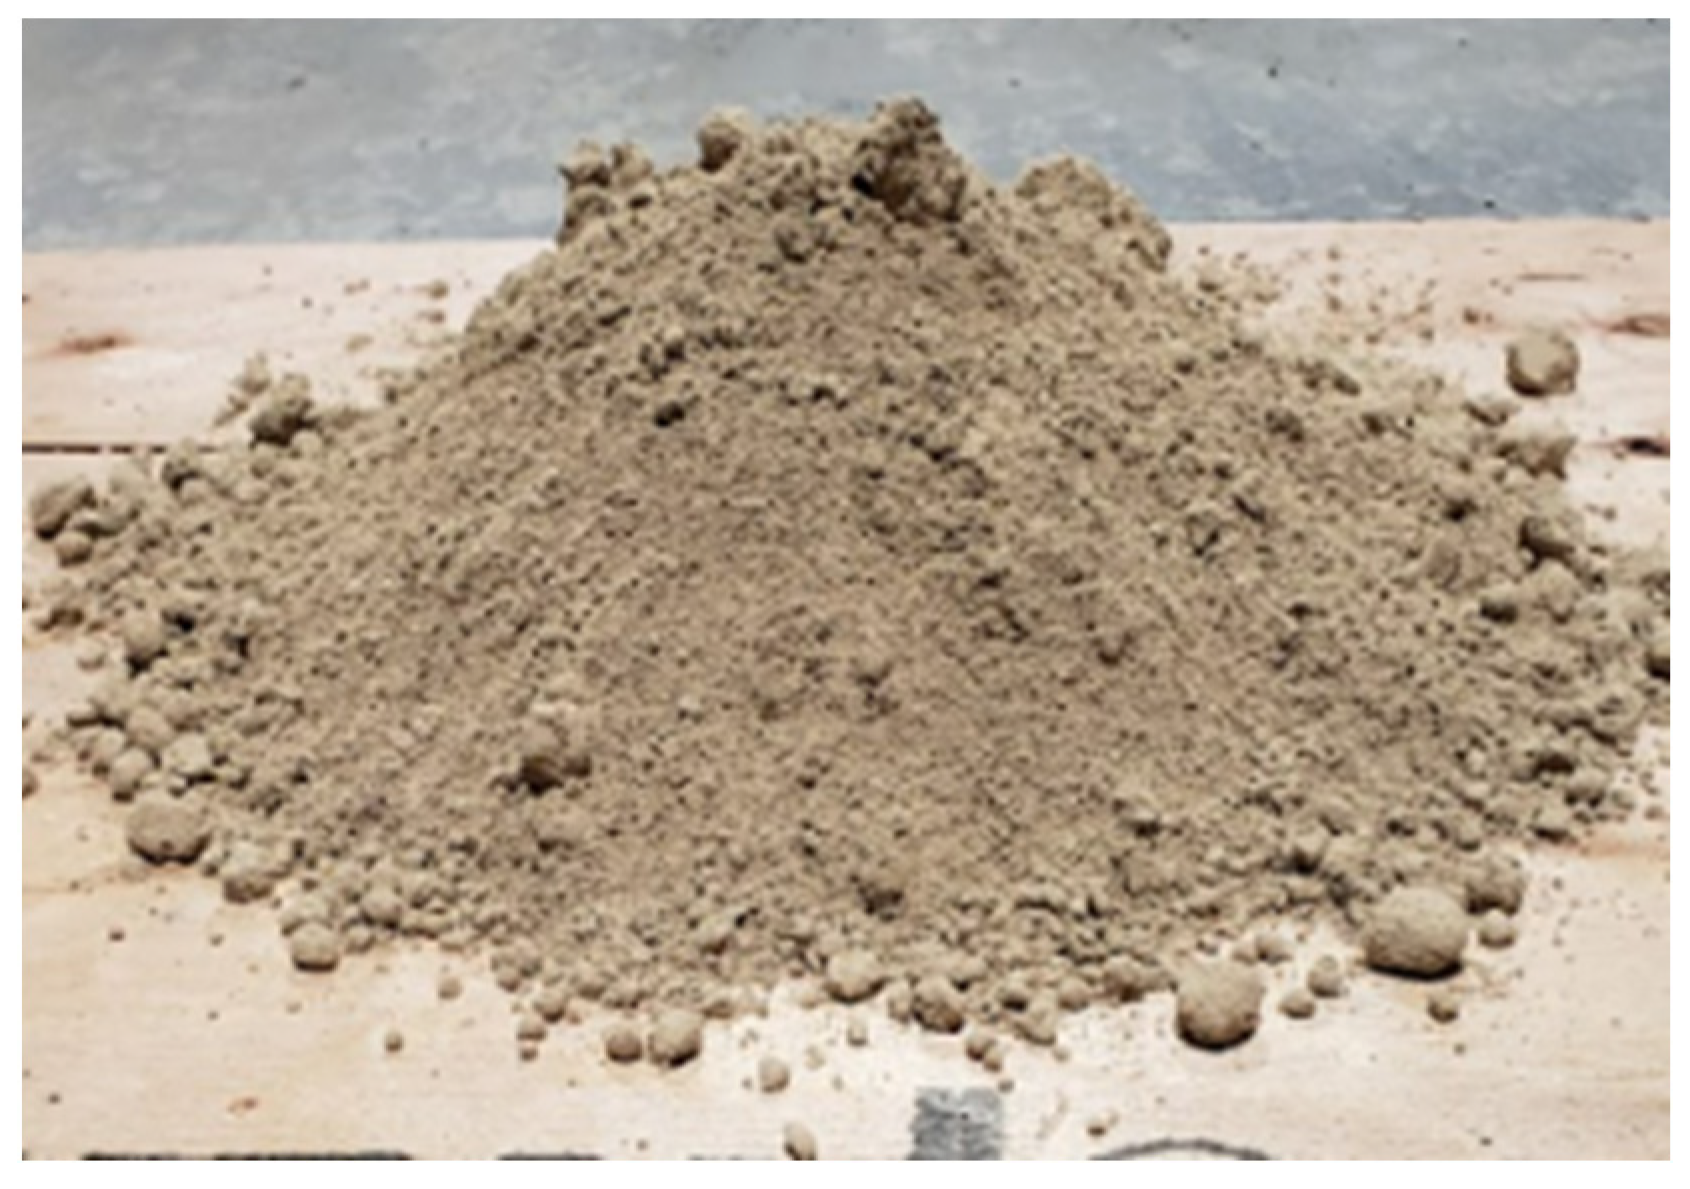
2.1. Precipitated Calcium Carbonate (PCC)
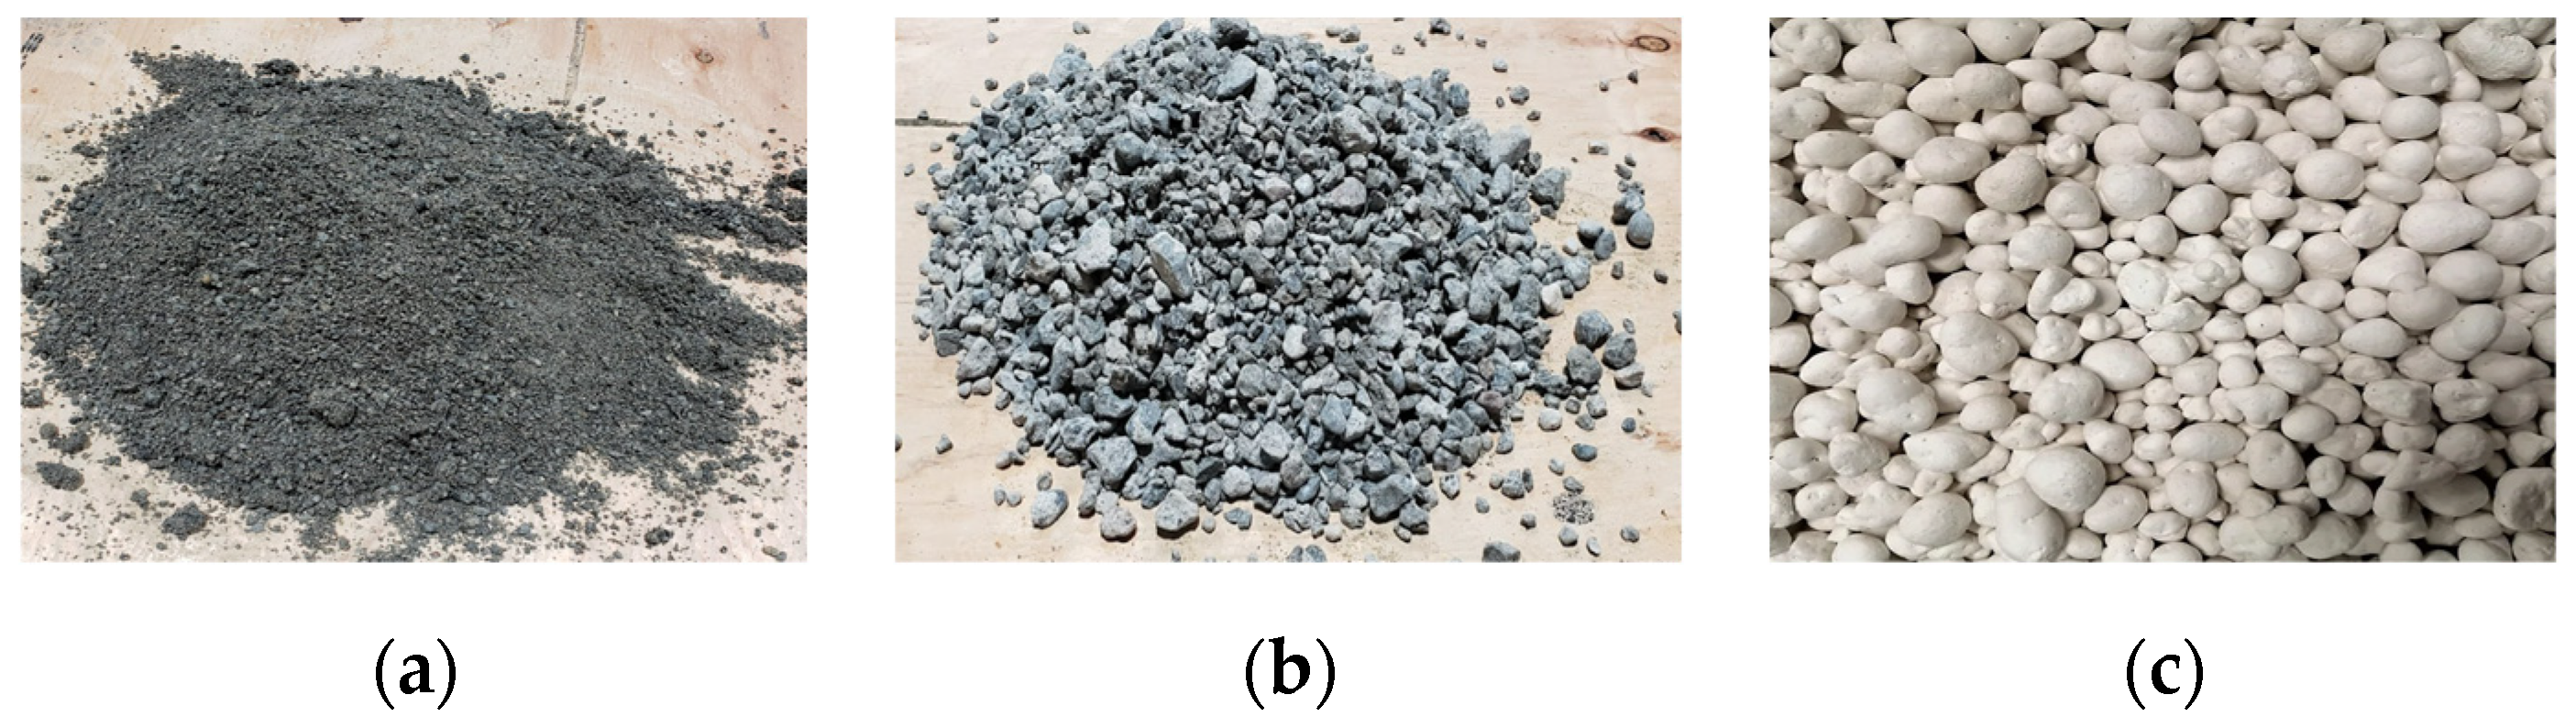
2.2. Upcycled Recycled Concrete Aggregate (Upcycled RCA or UCA)
2.3. Aggregates
2.4. Fly Ash
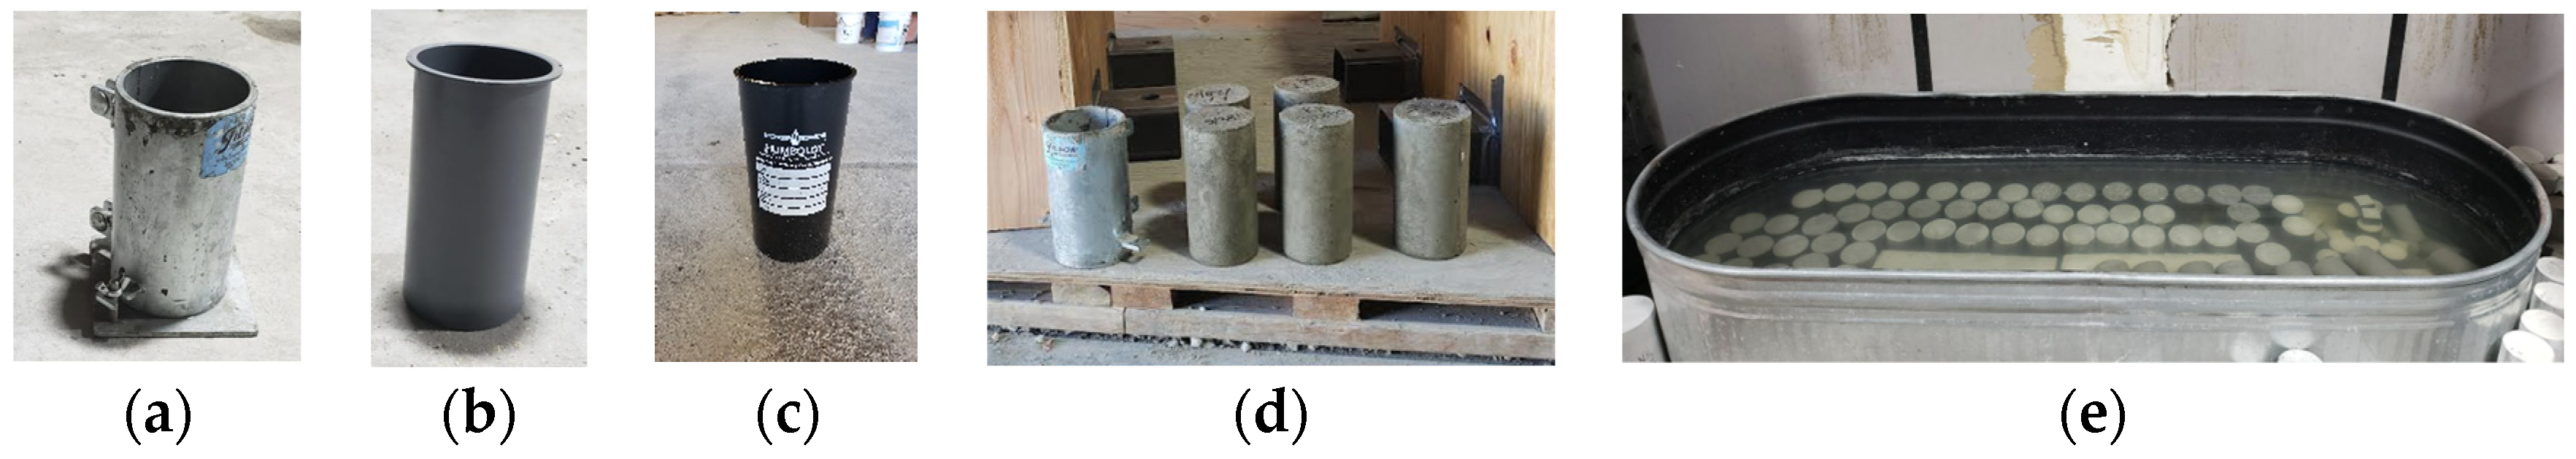
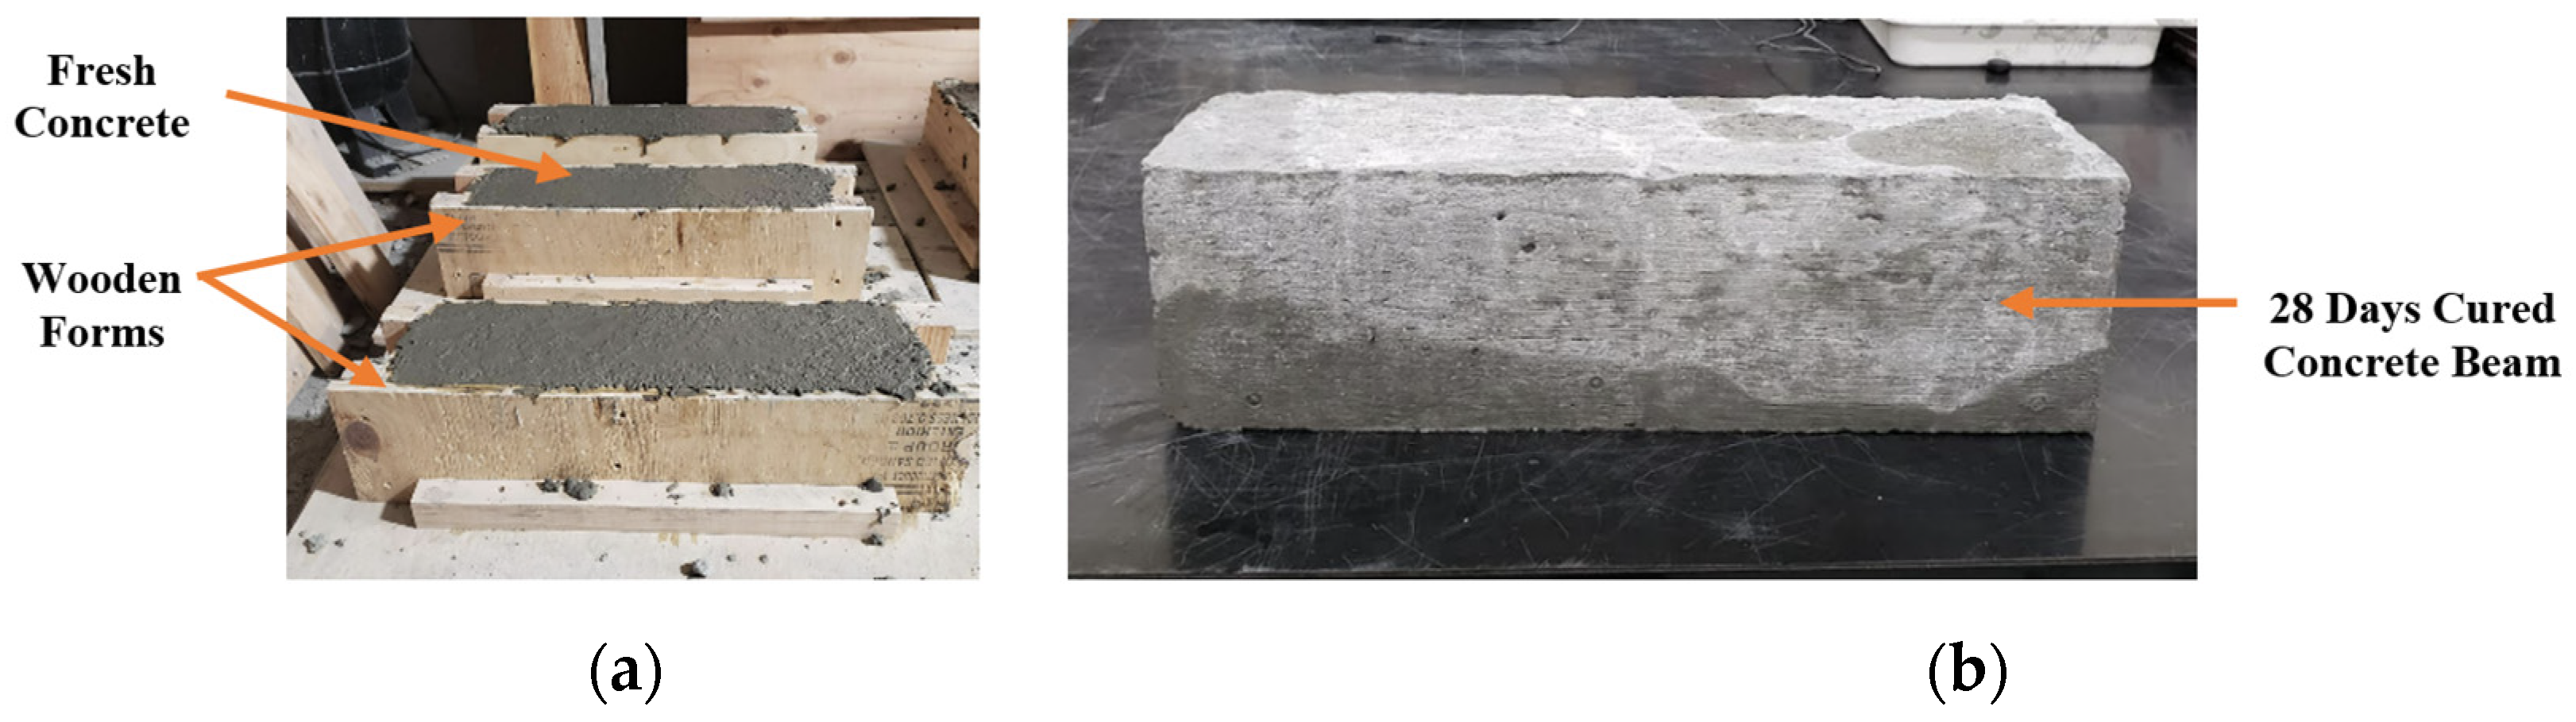
2.5. Concrete Sample Preparation
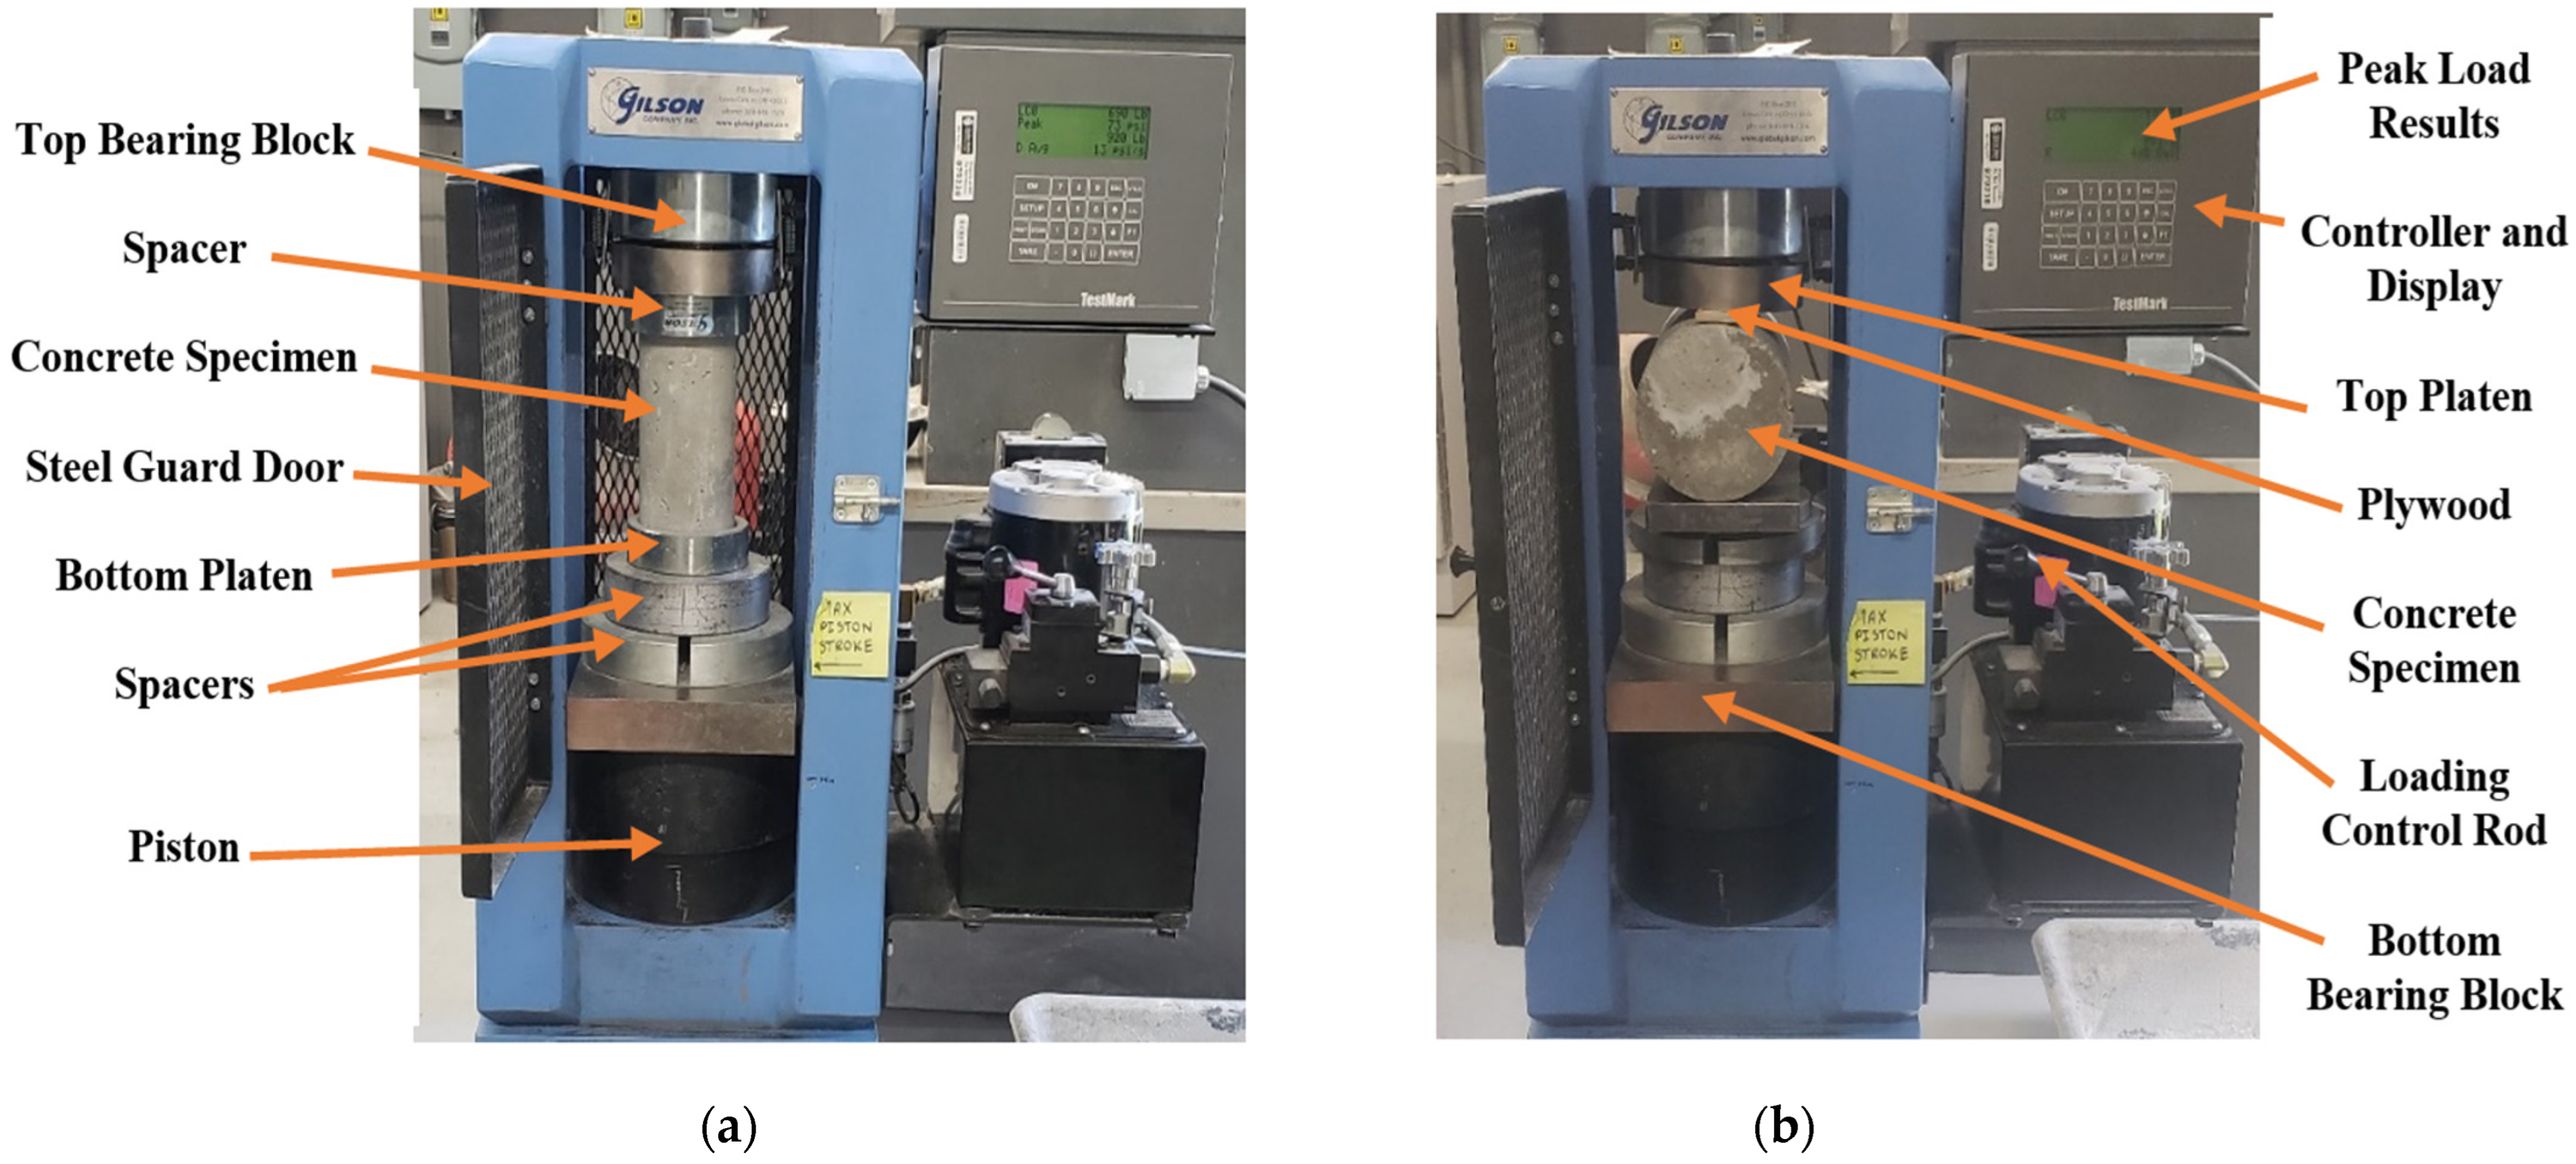
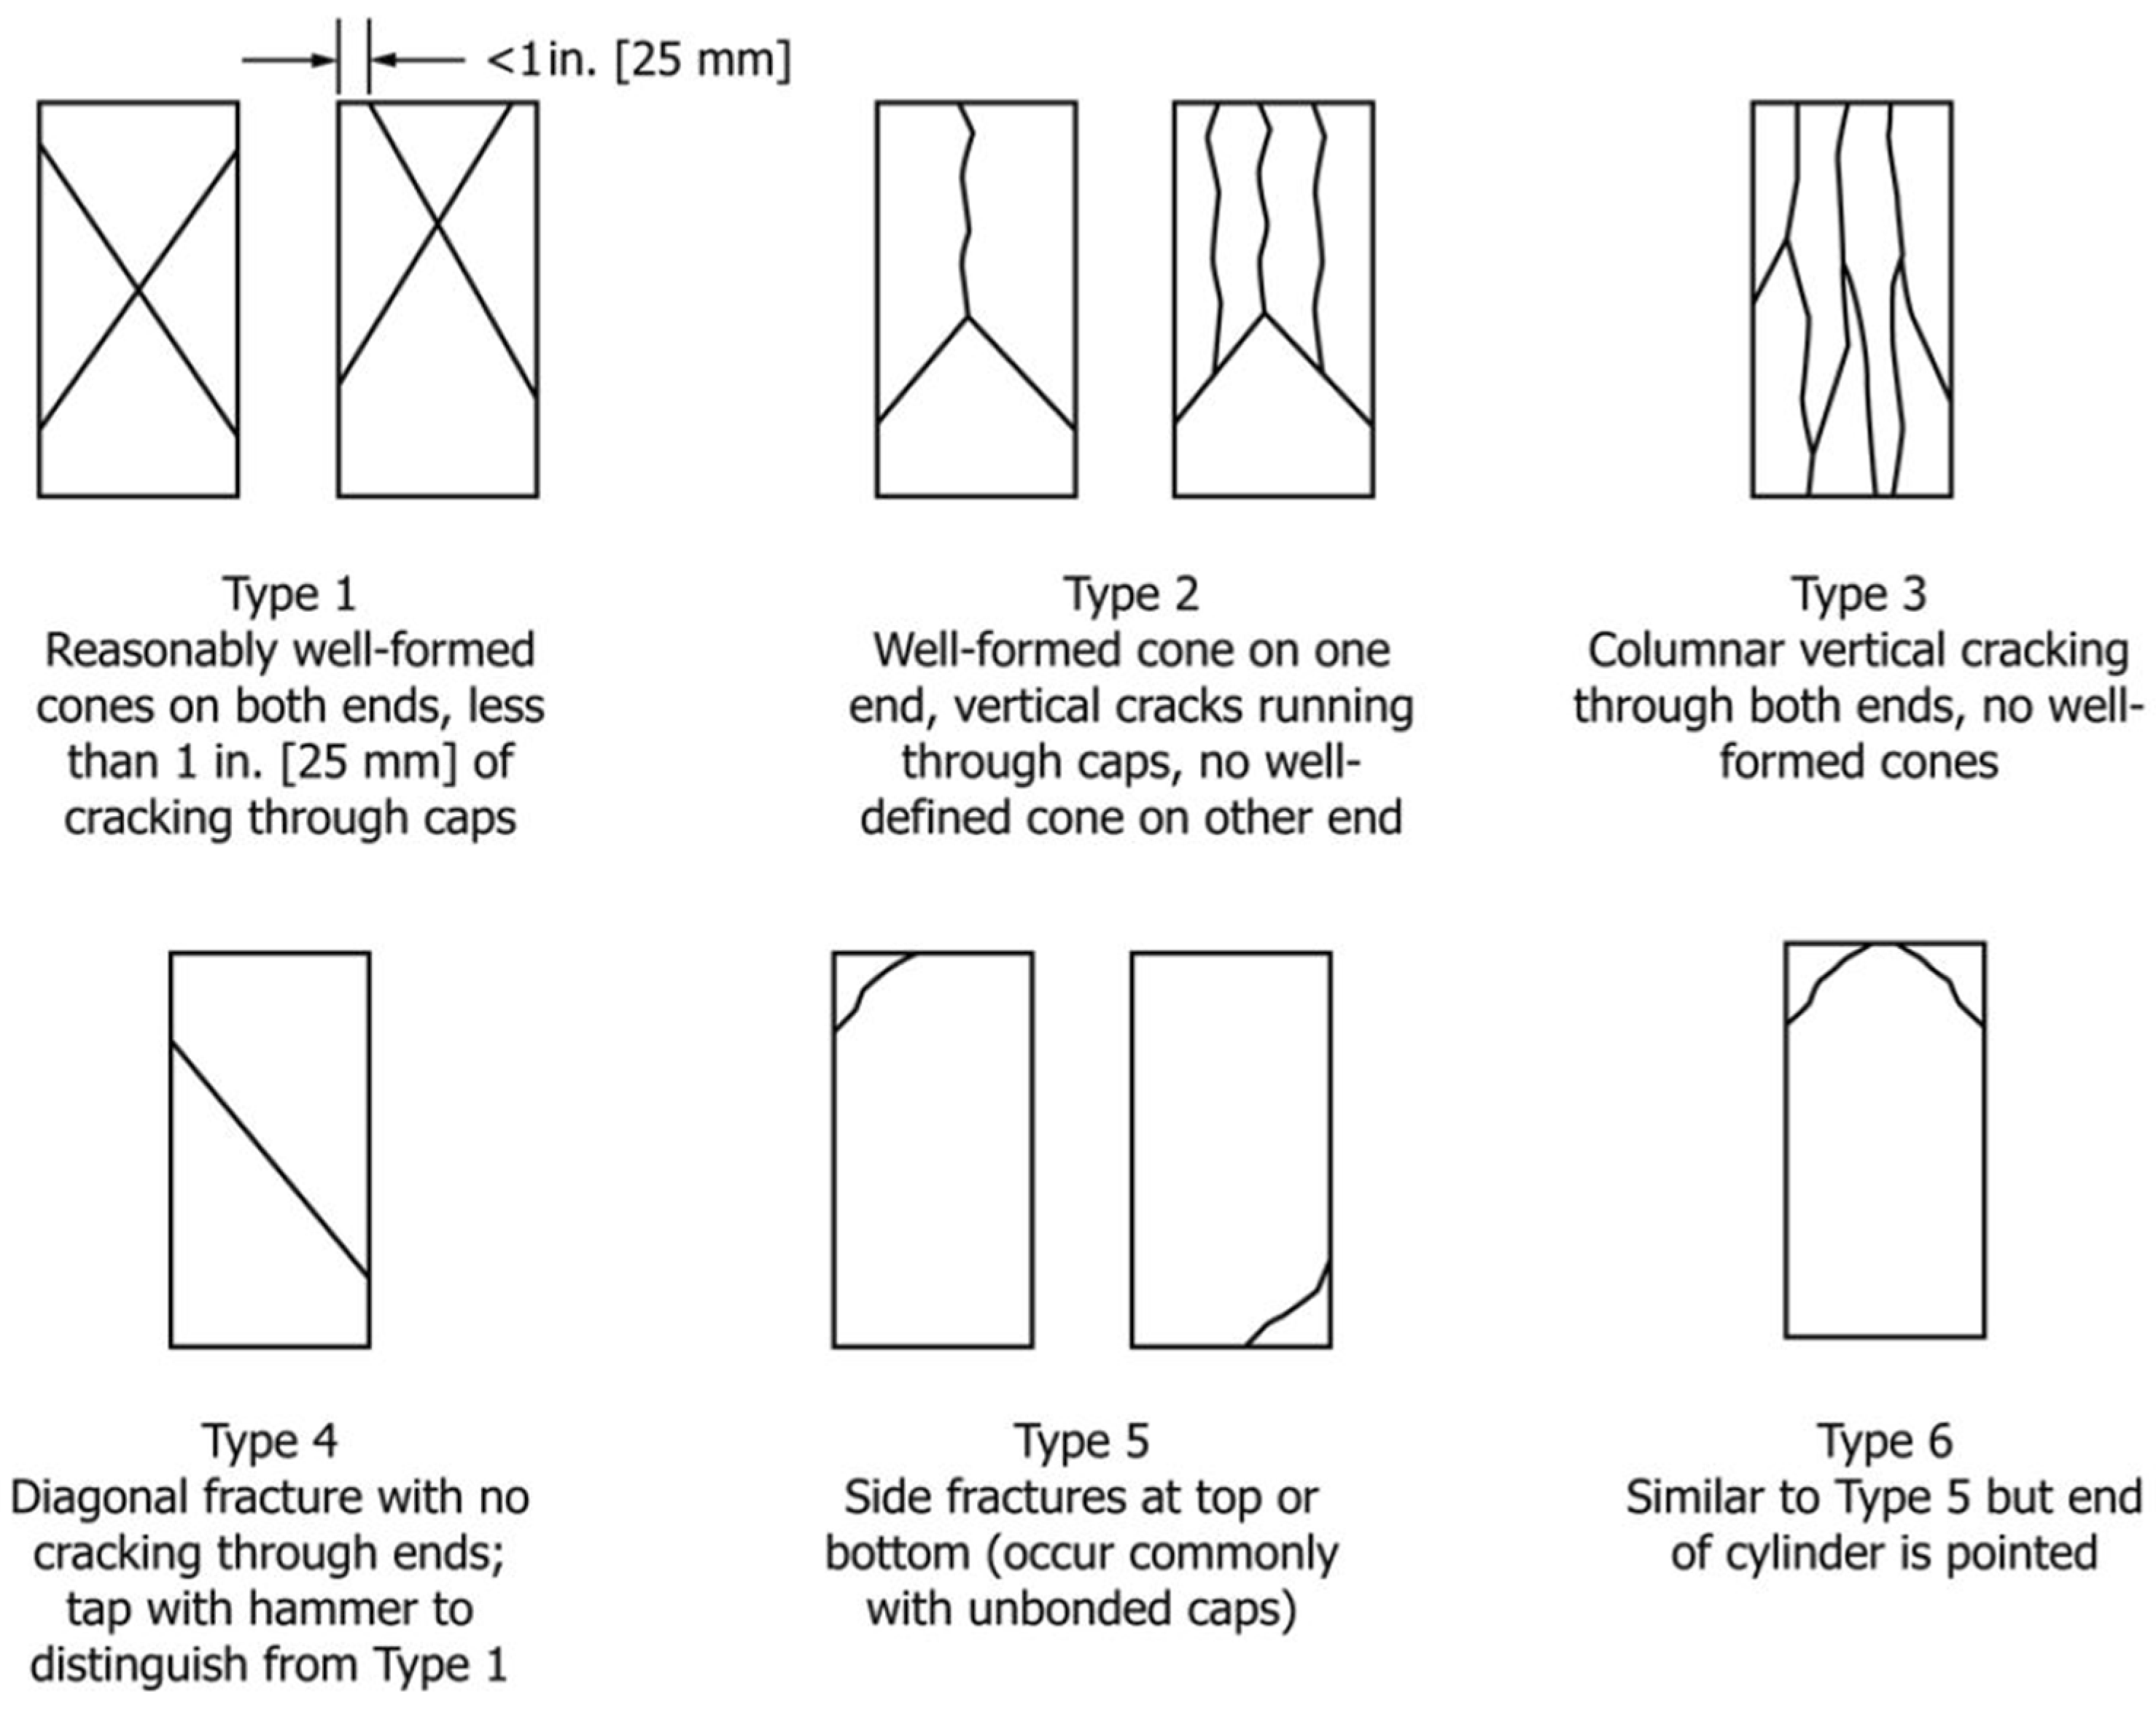
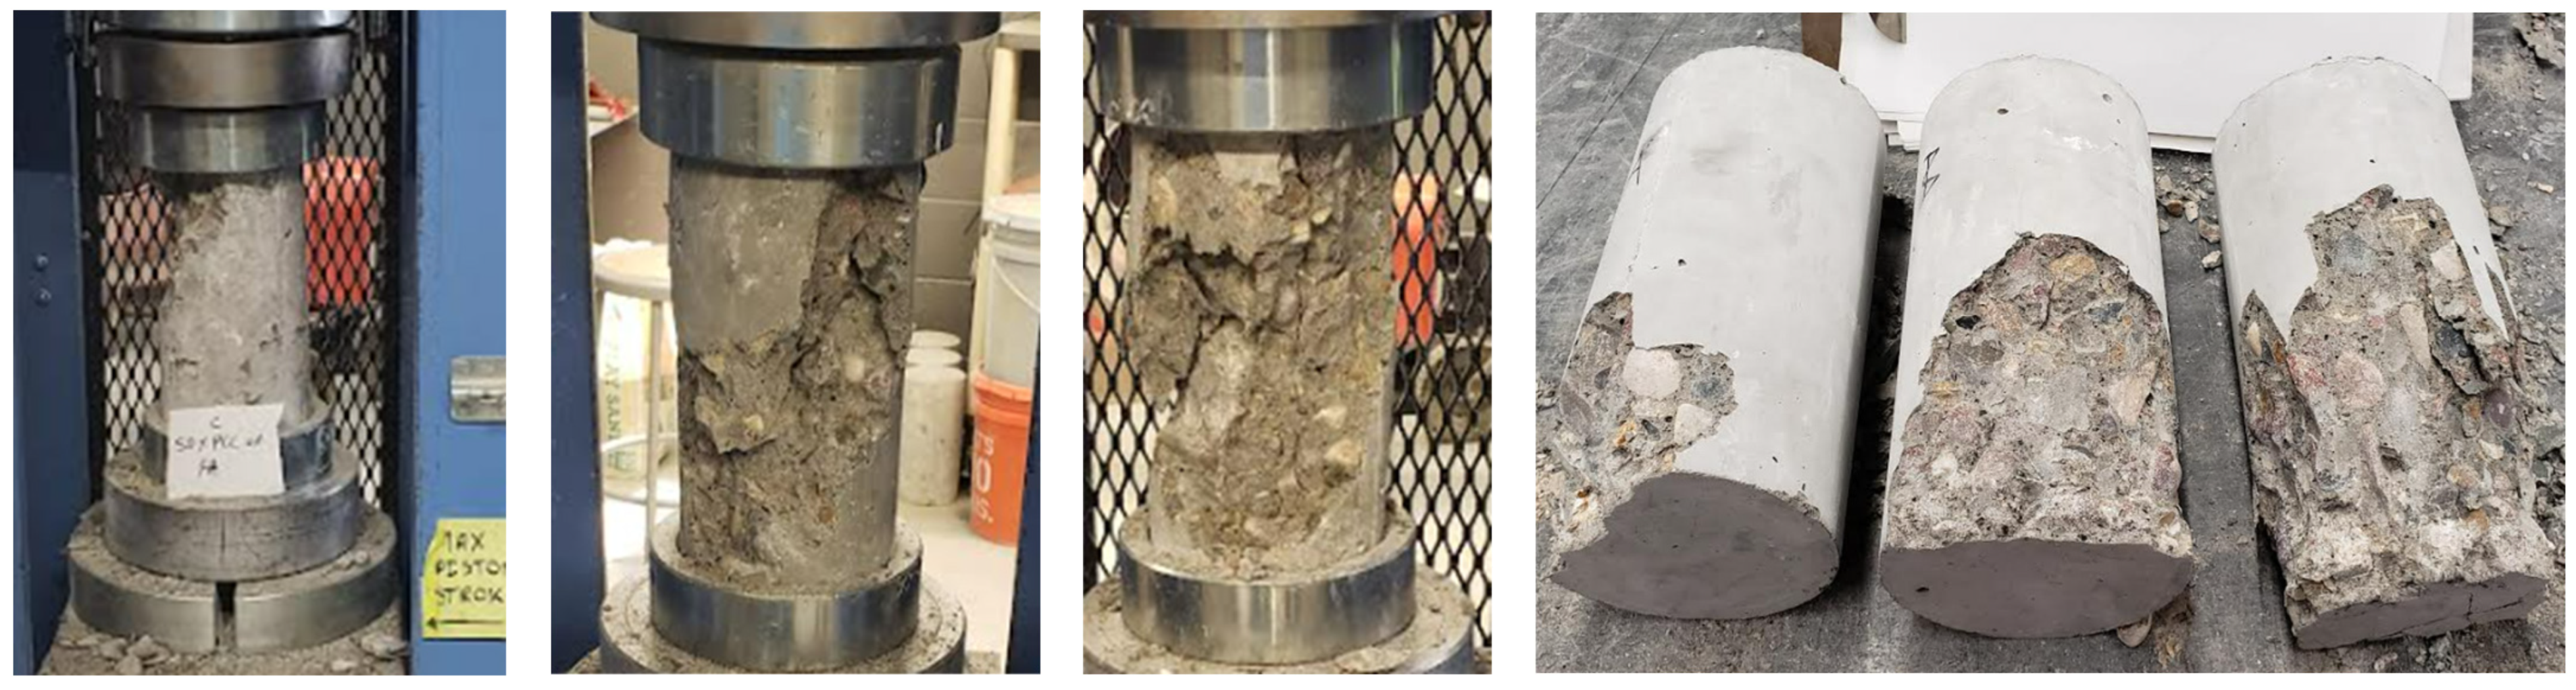
2.6. Compressive Strength Tests
2.7. Split Tensile Strength Tests
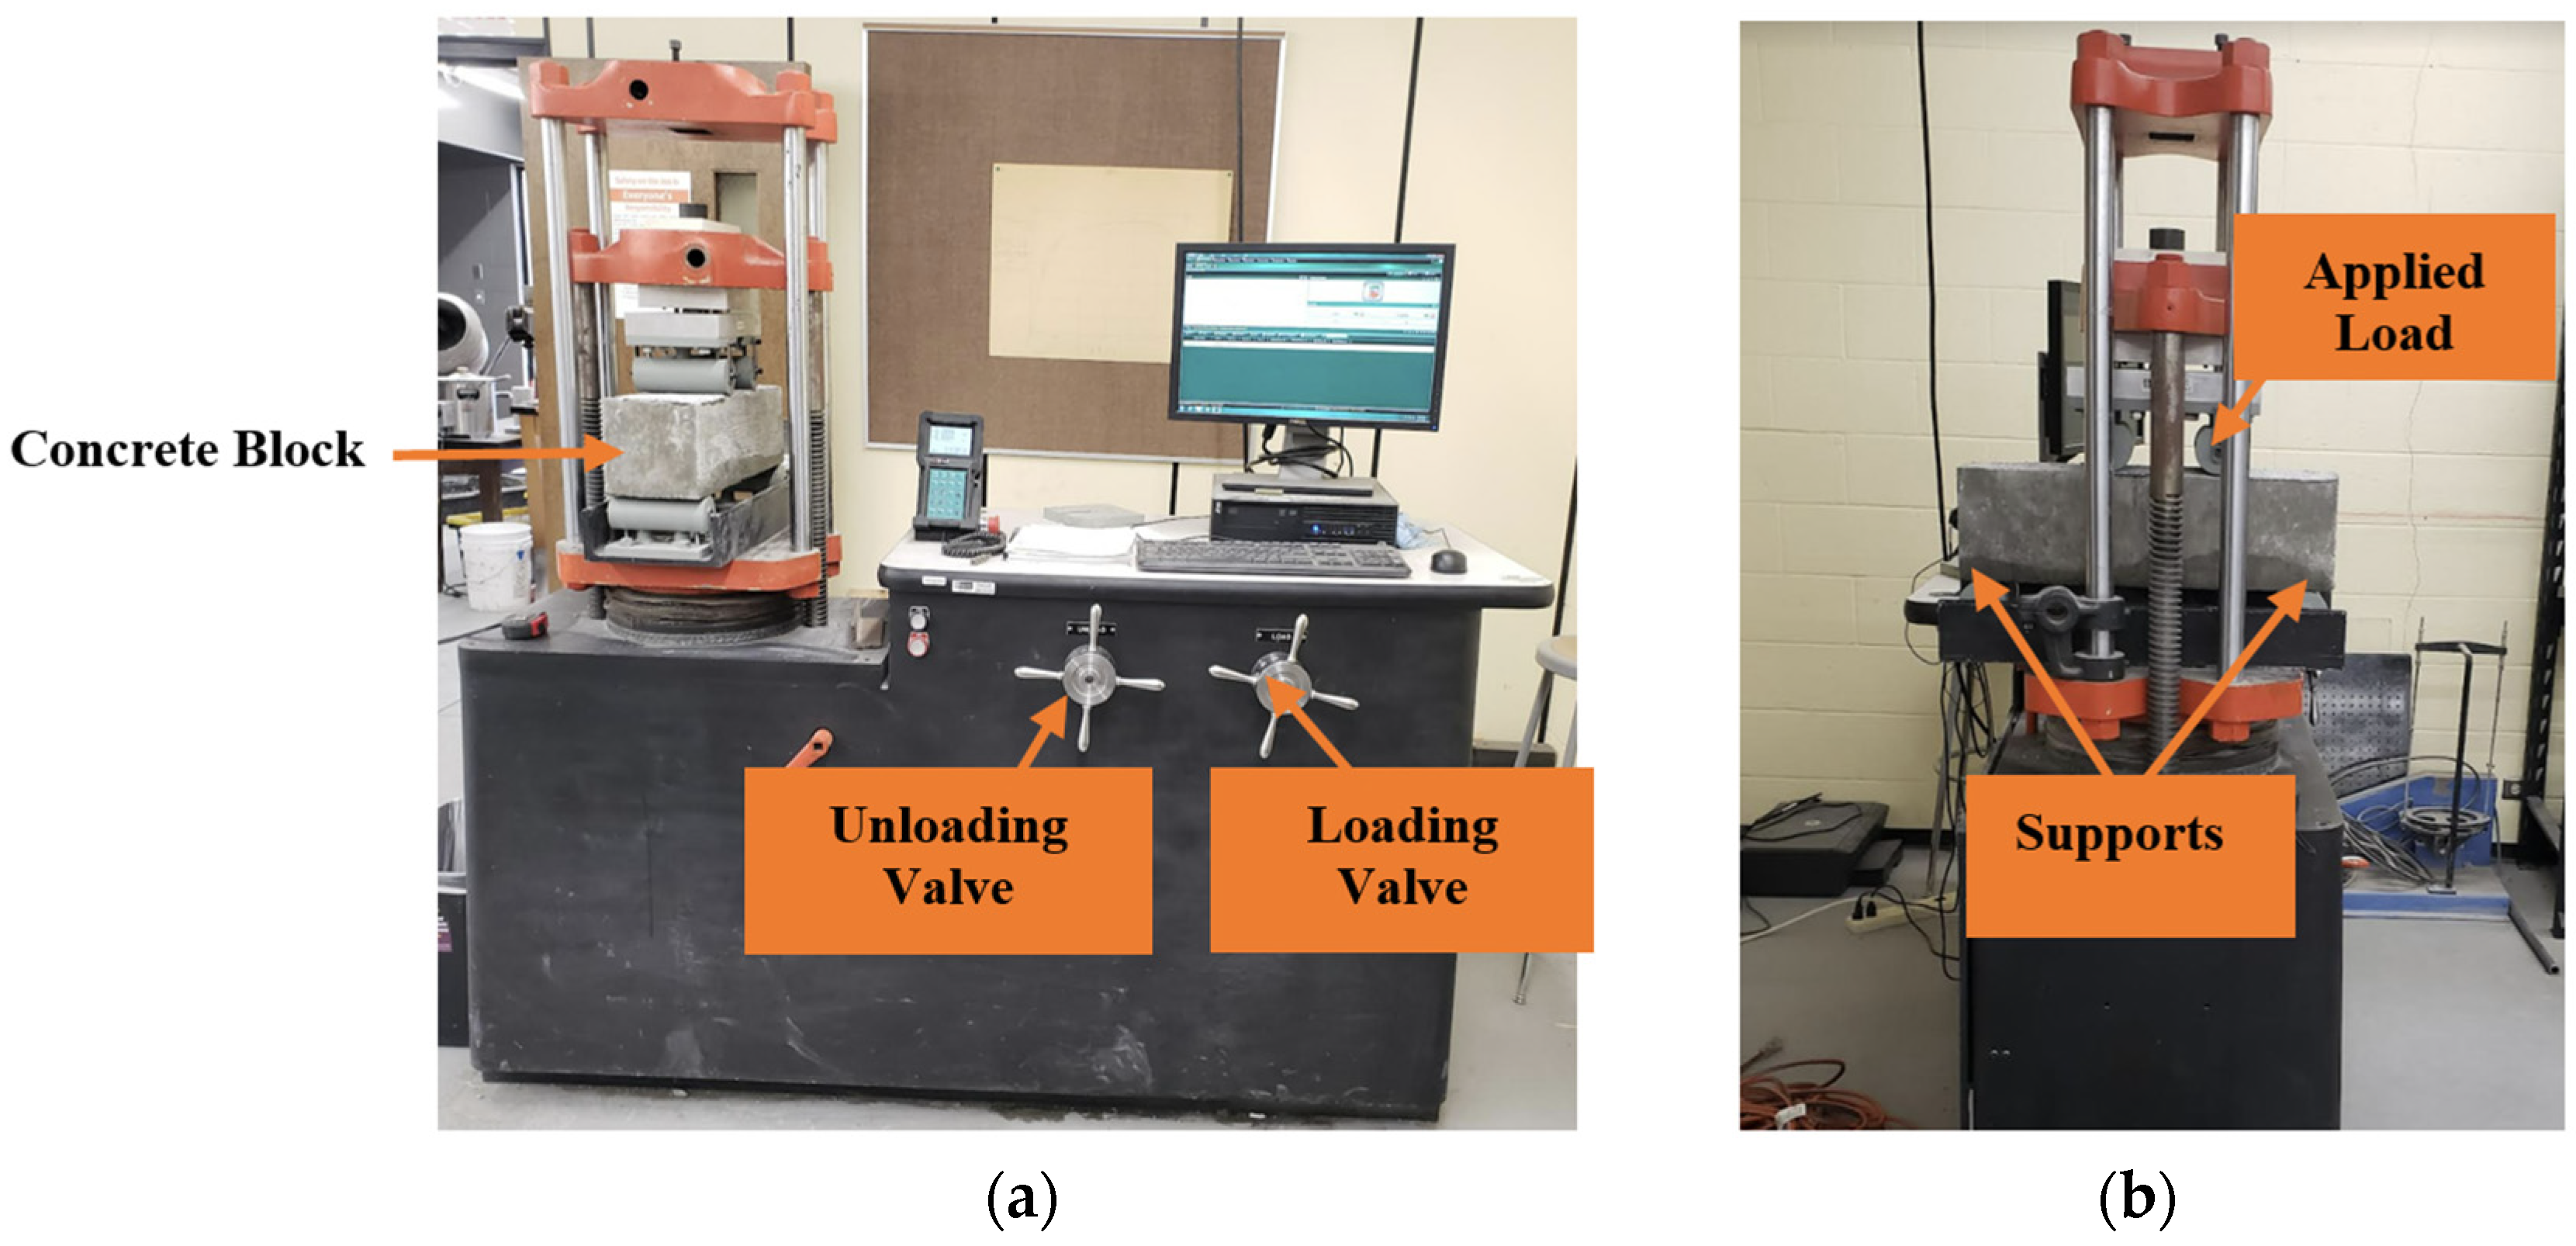
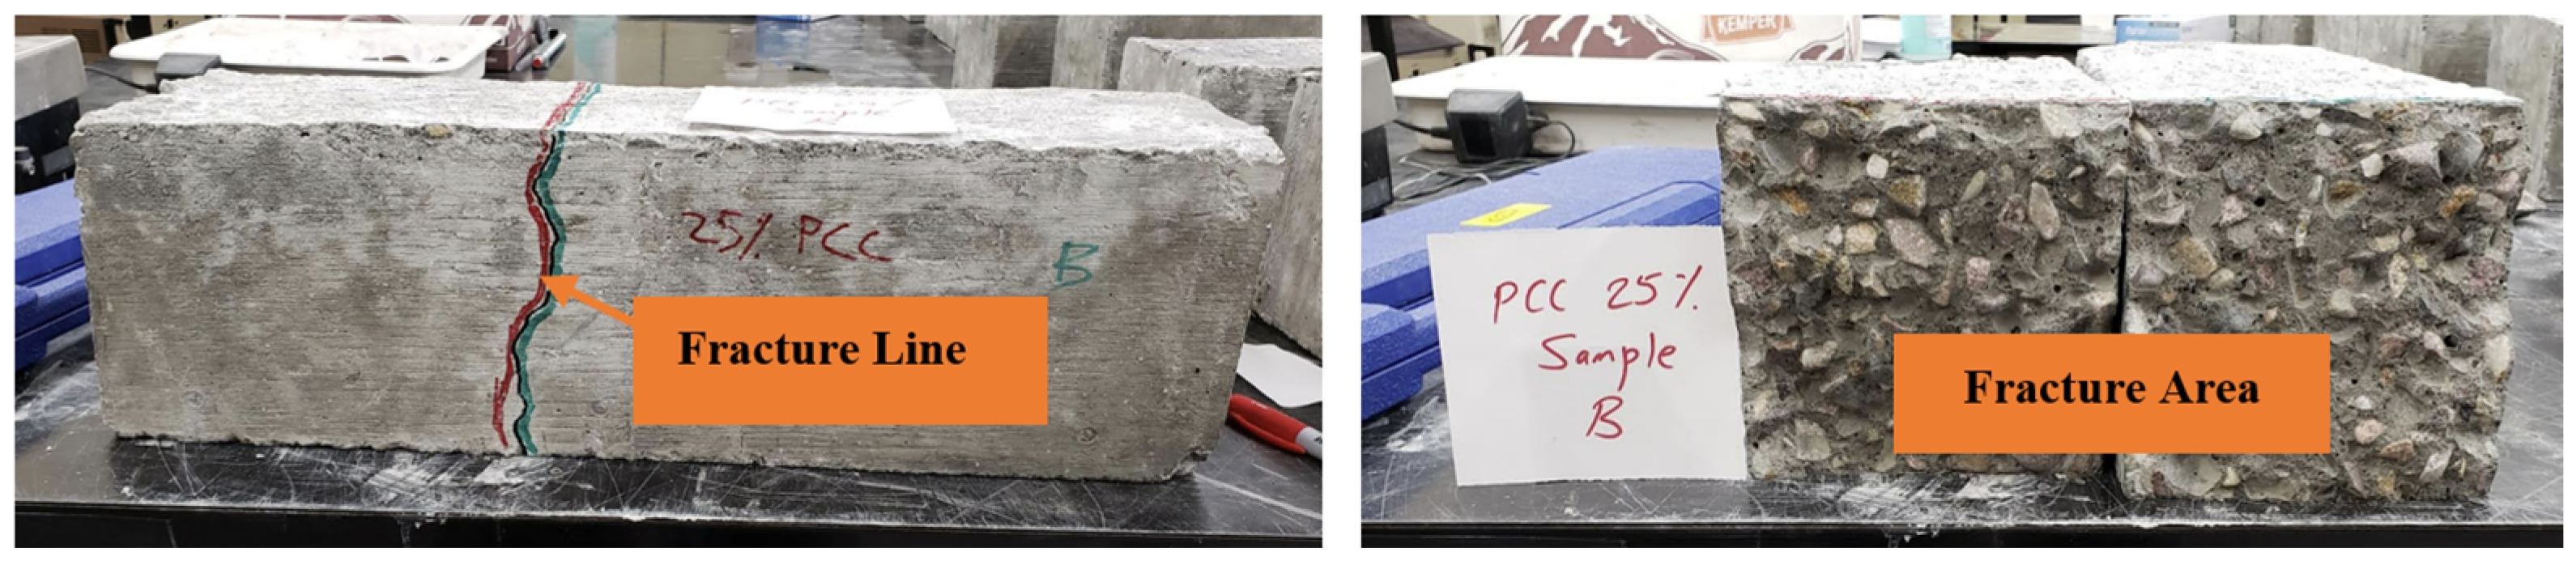
2.8. Flexural Strength Tests
2.9. Deflection
3. Results
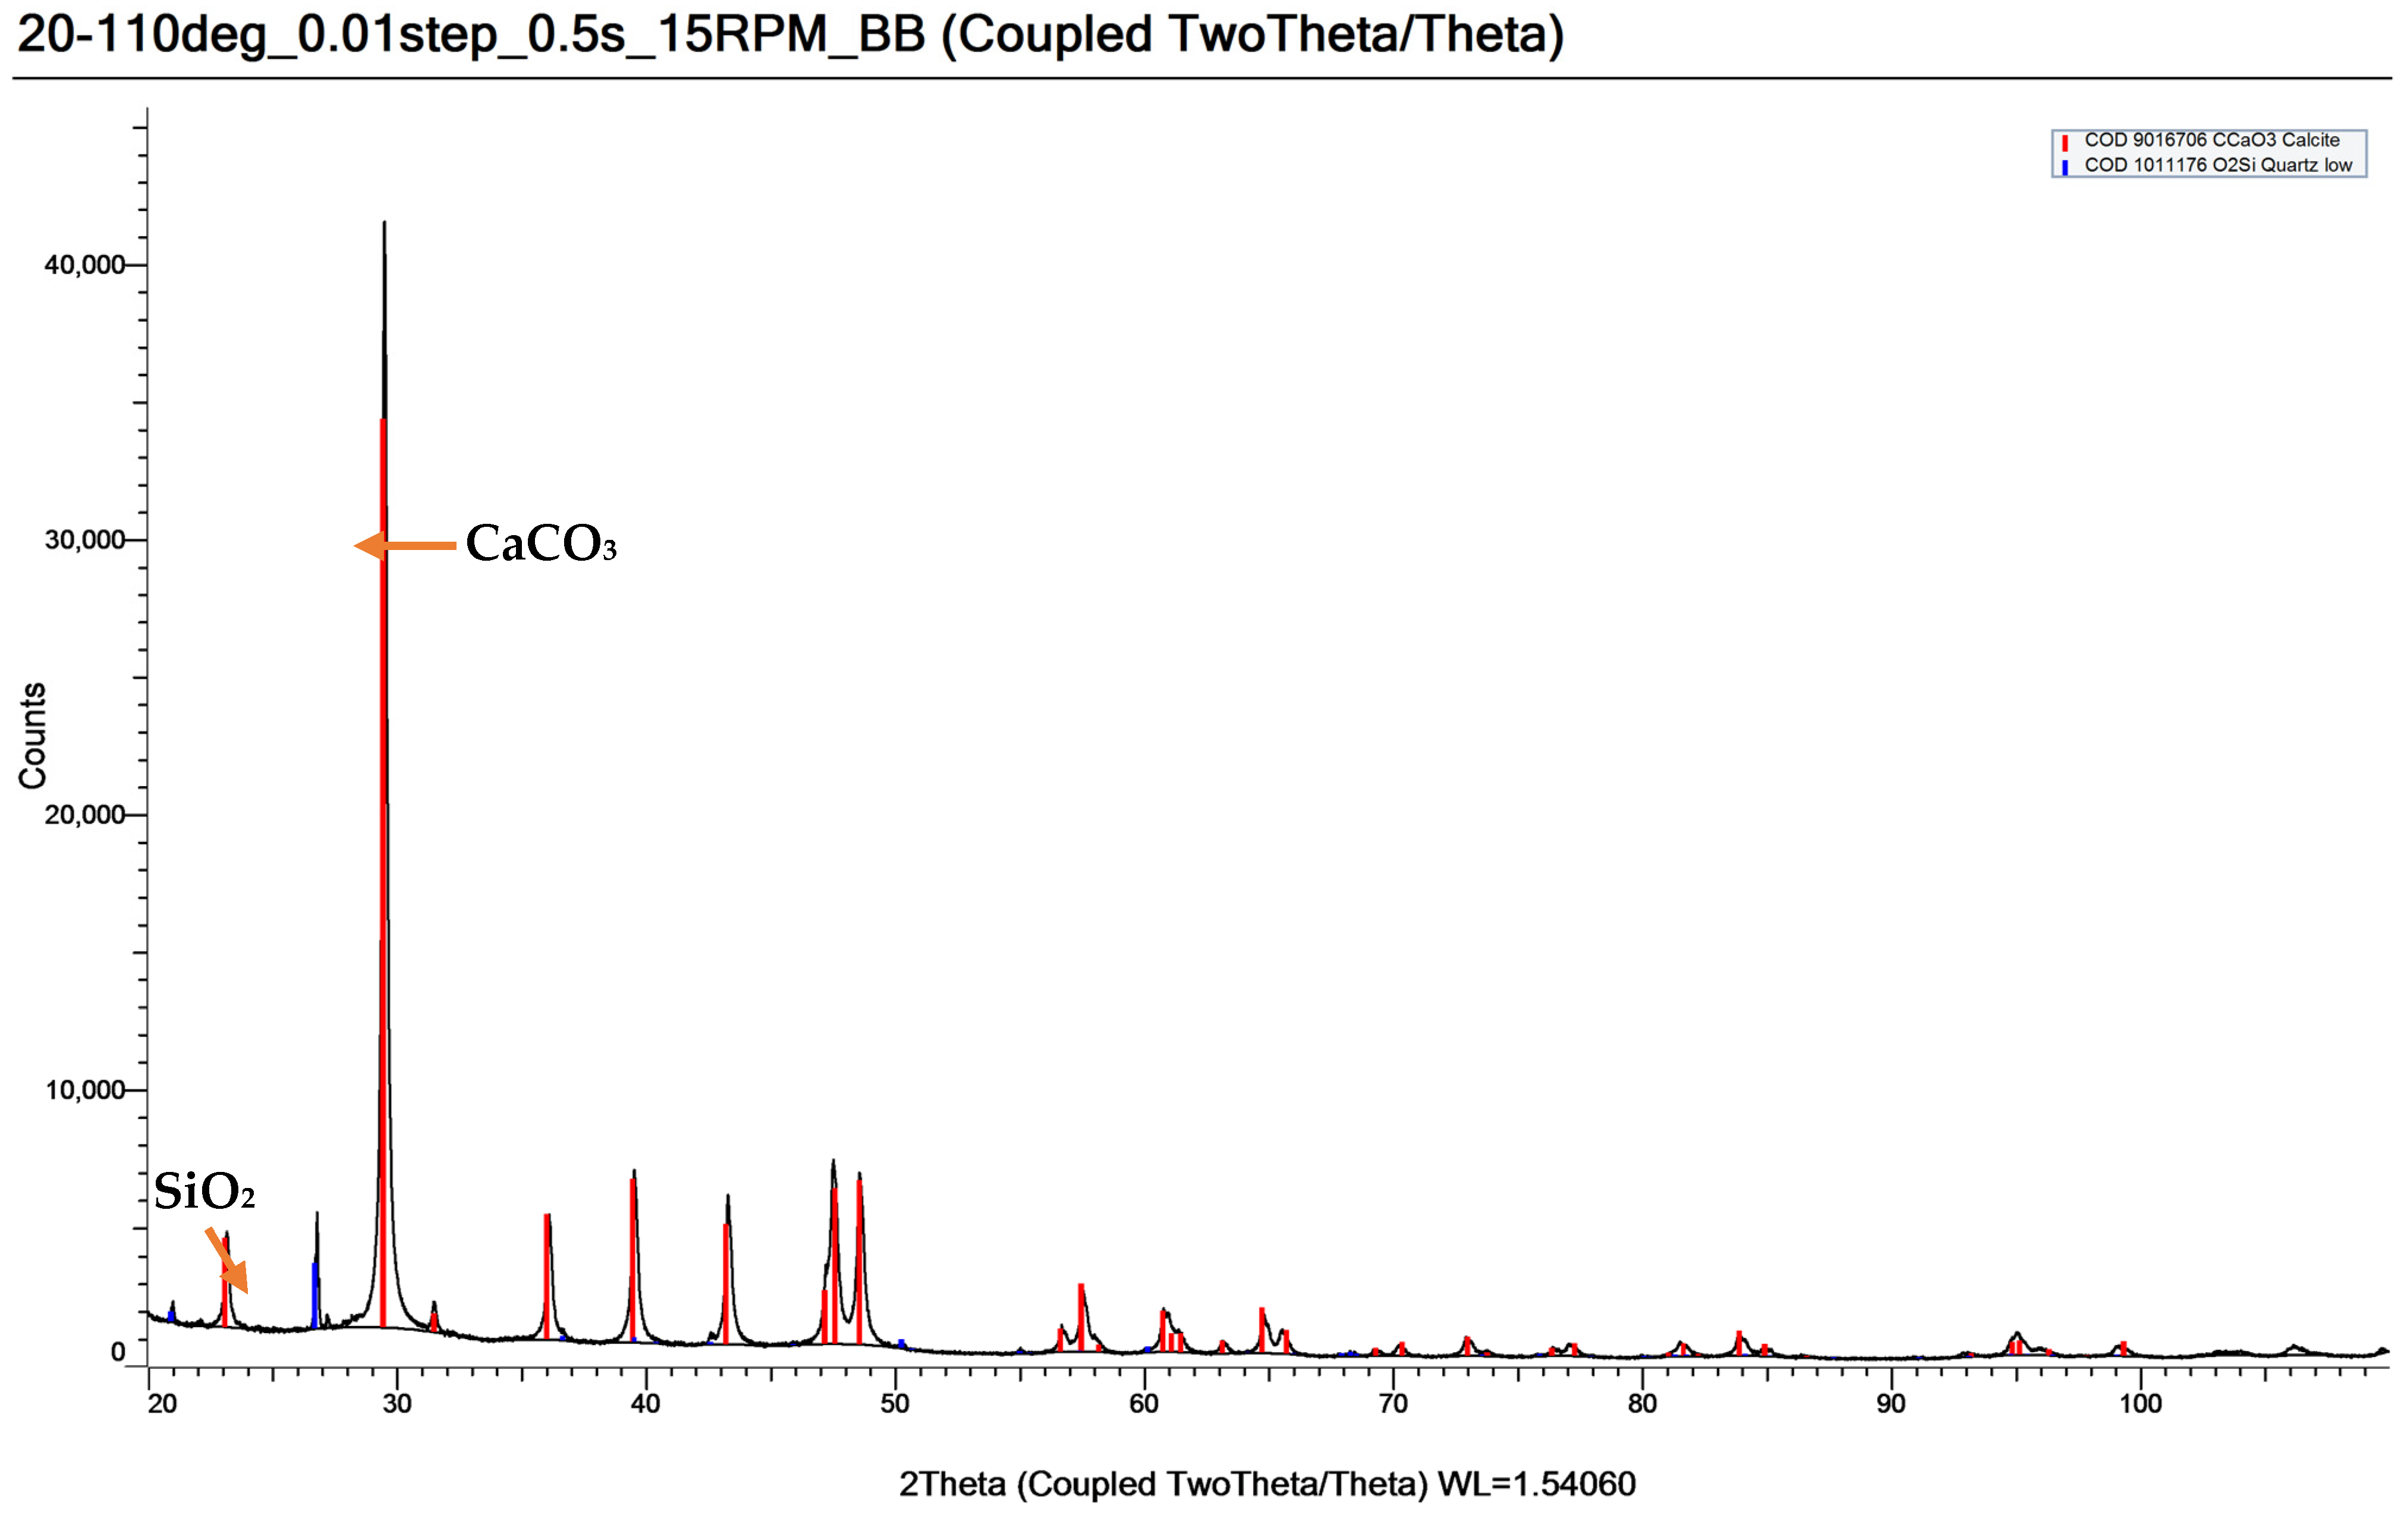
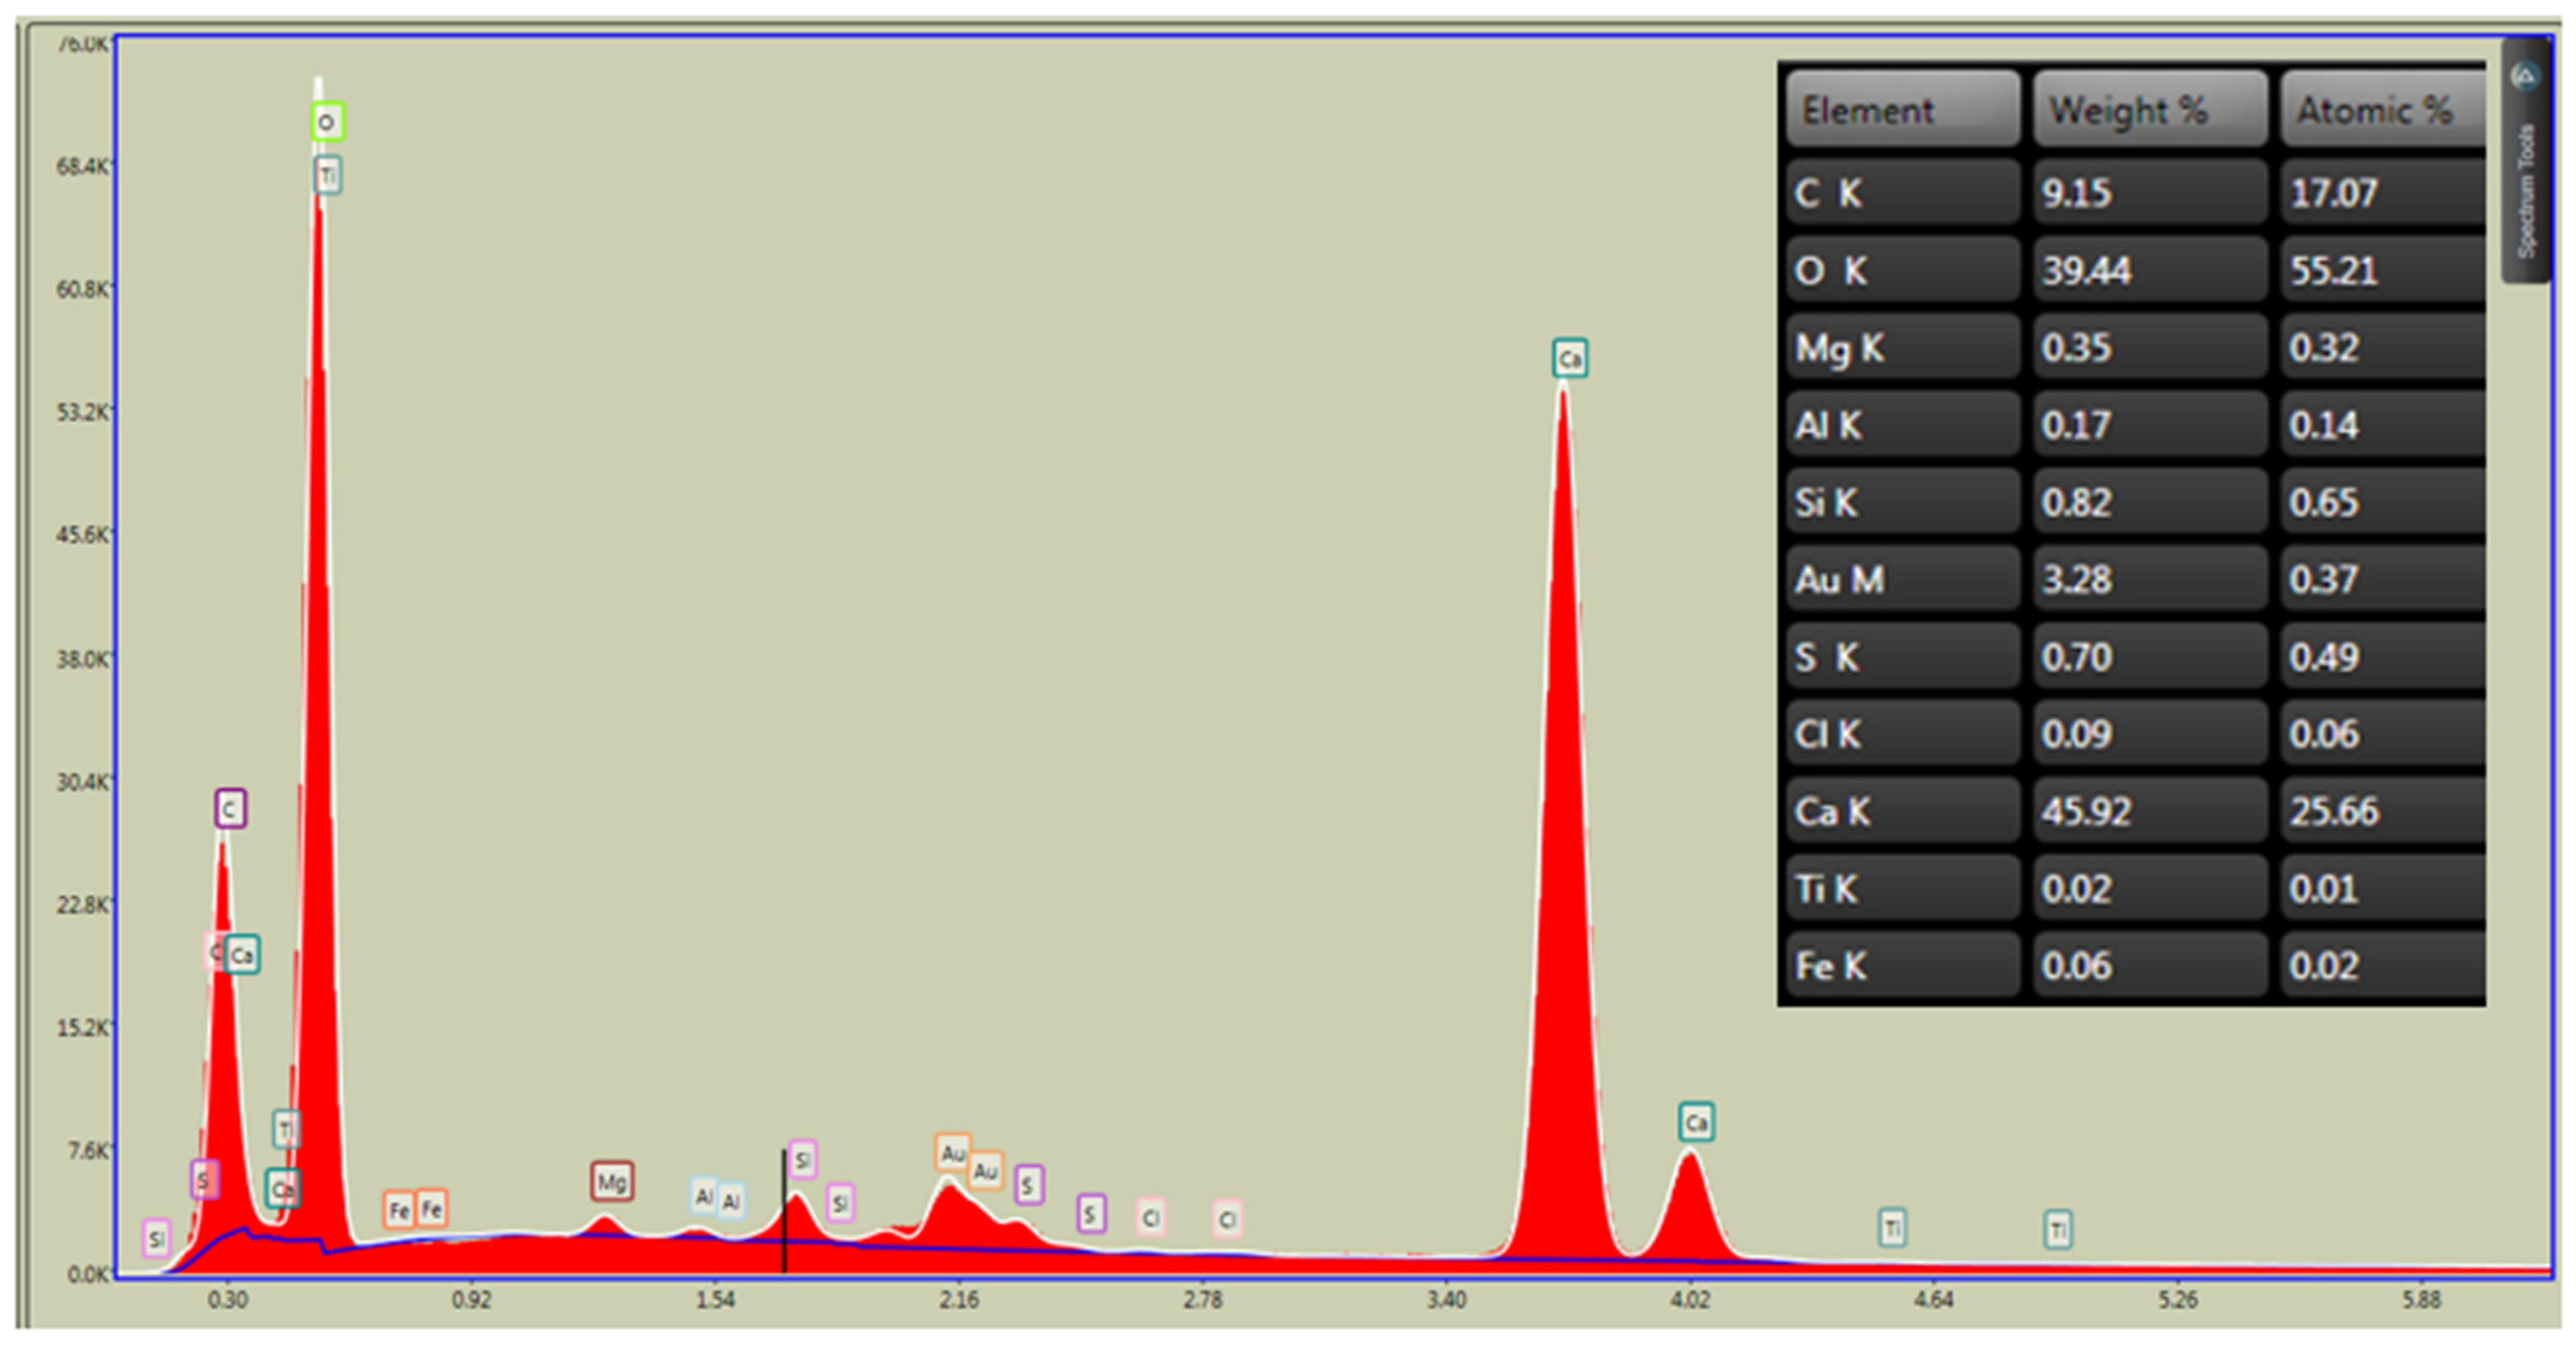
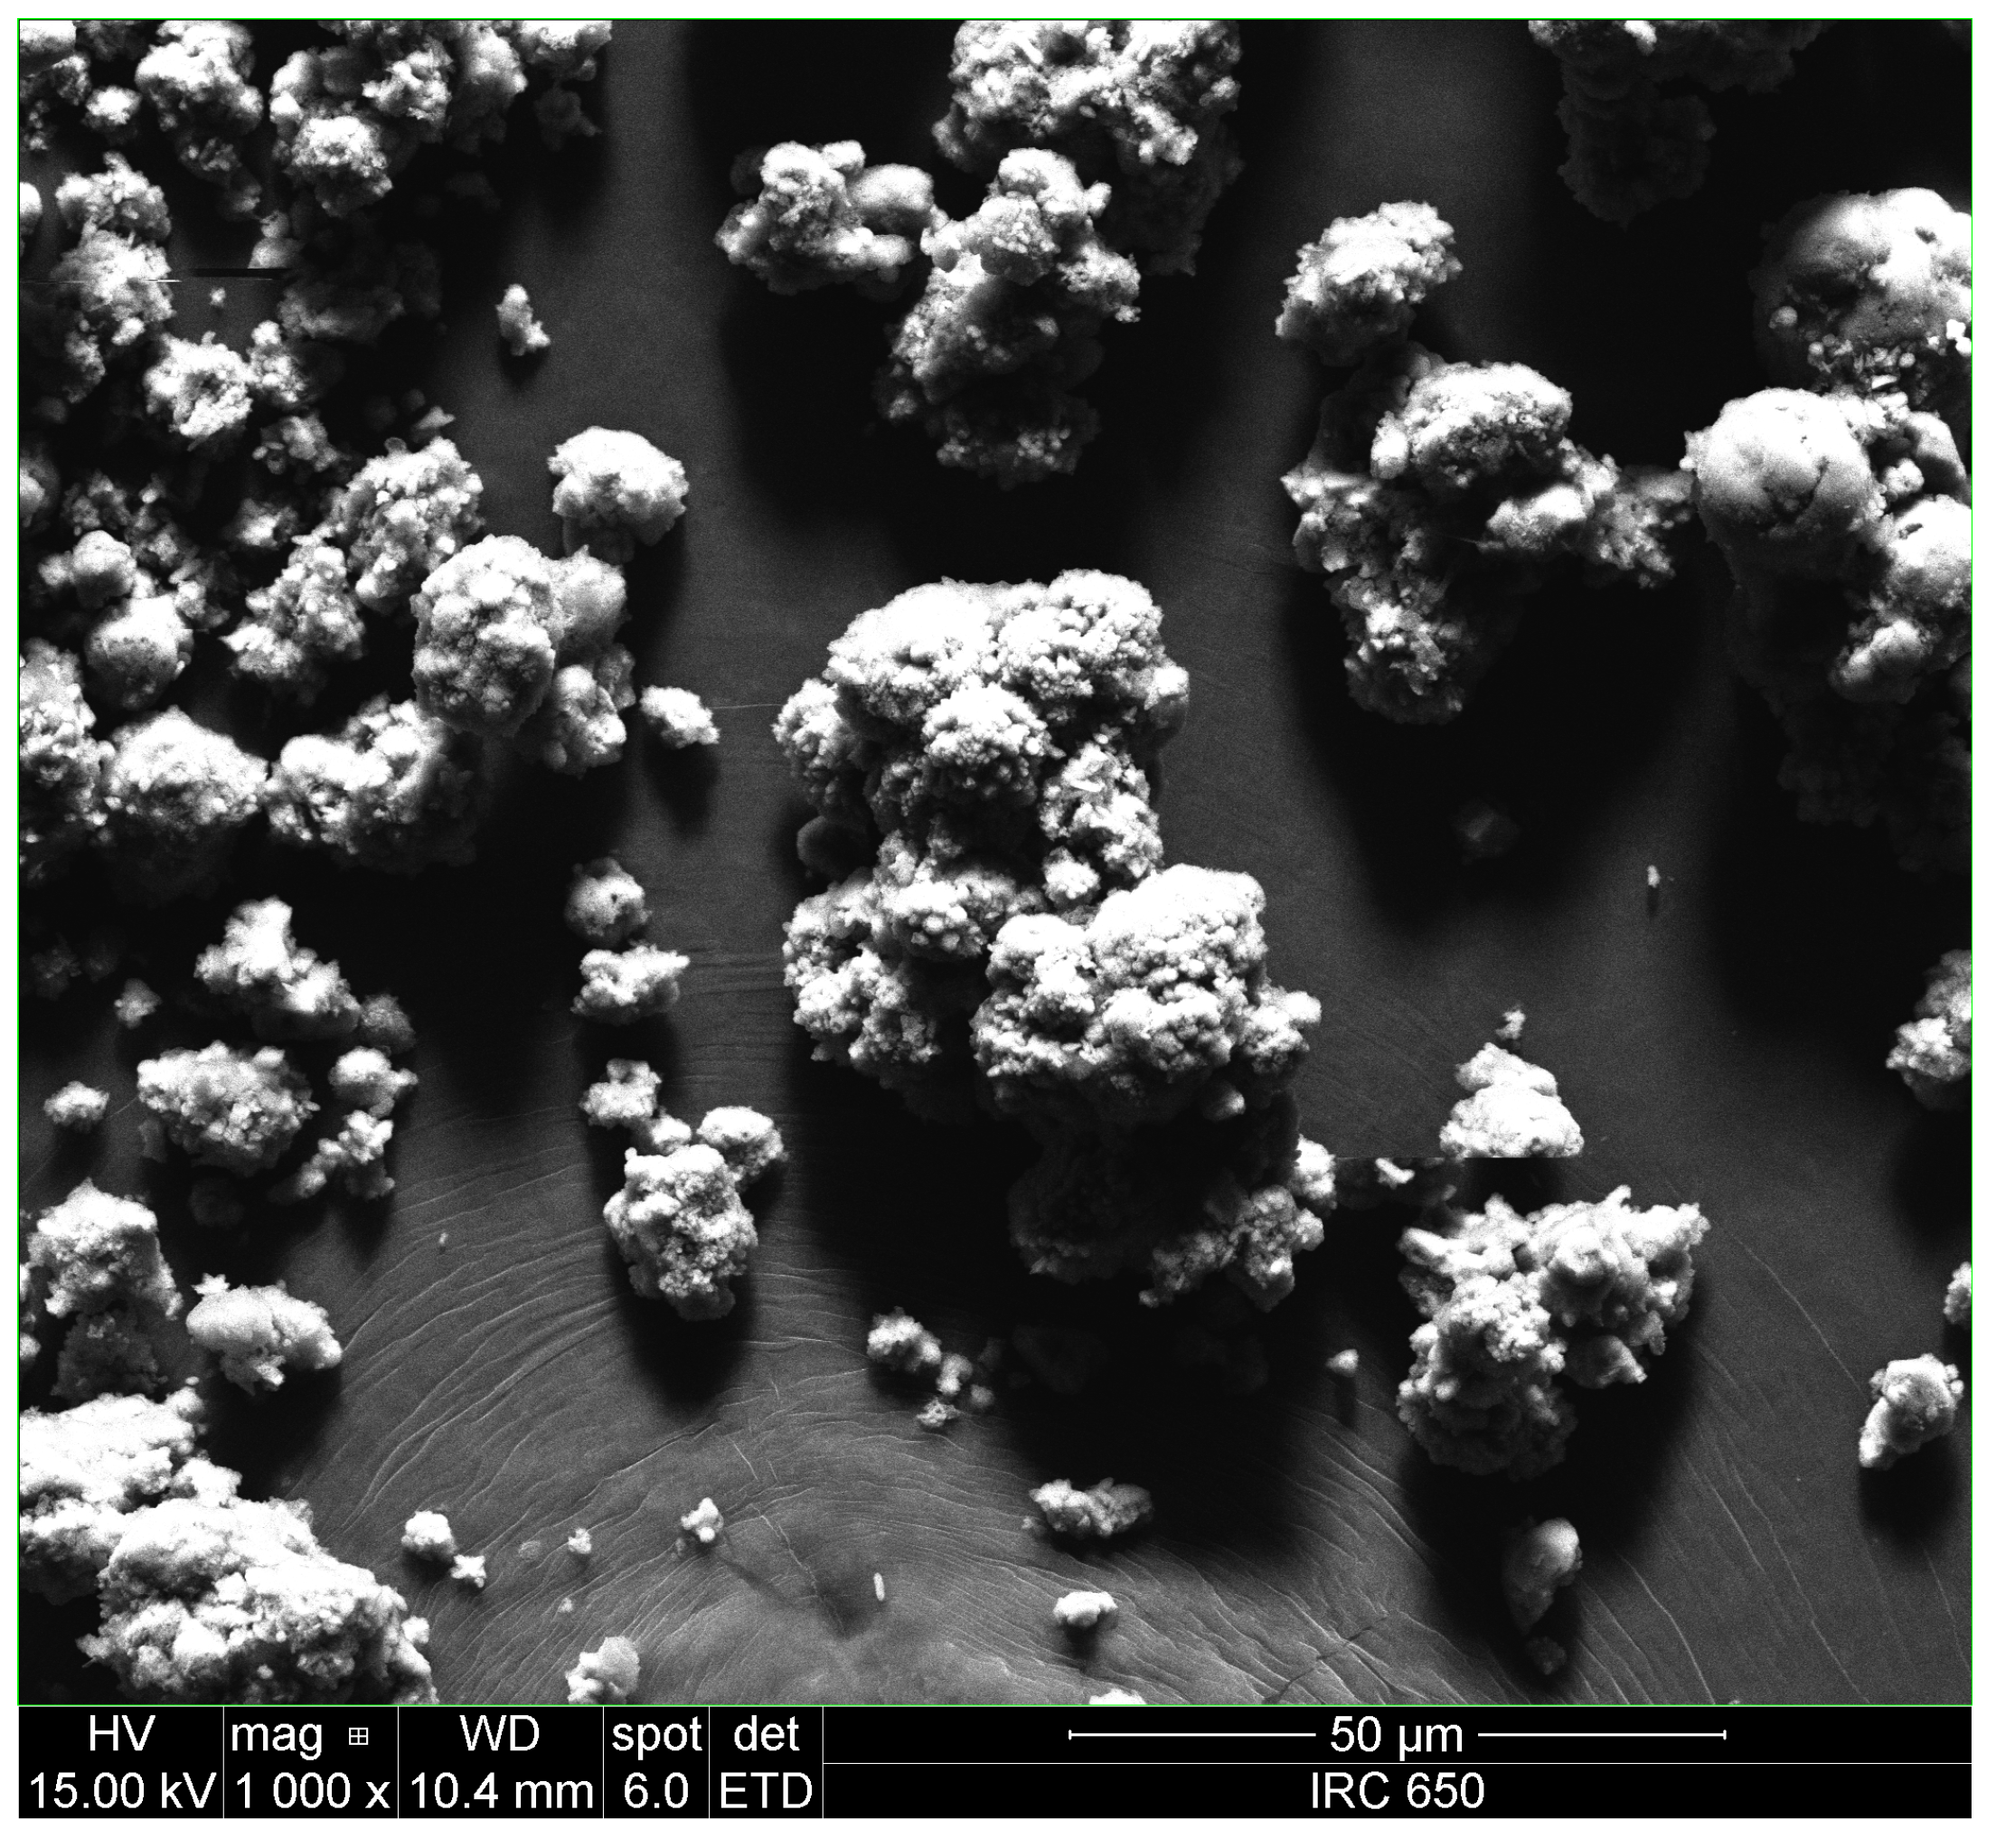
3.1. Composition of PCC
3.2. Compressive and Tensile Strength
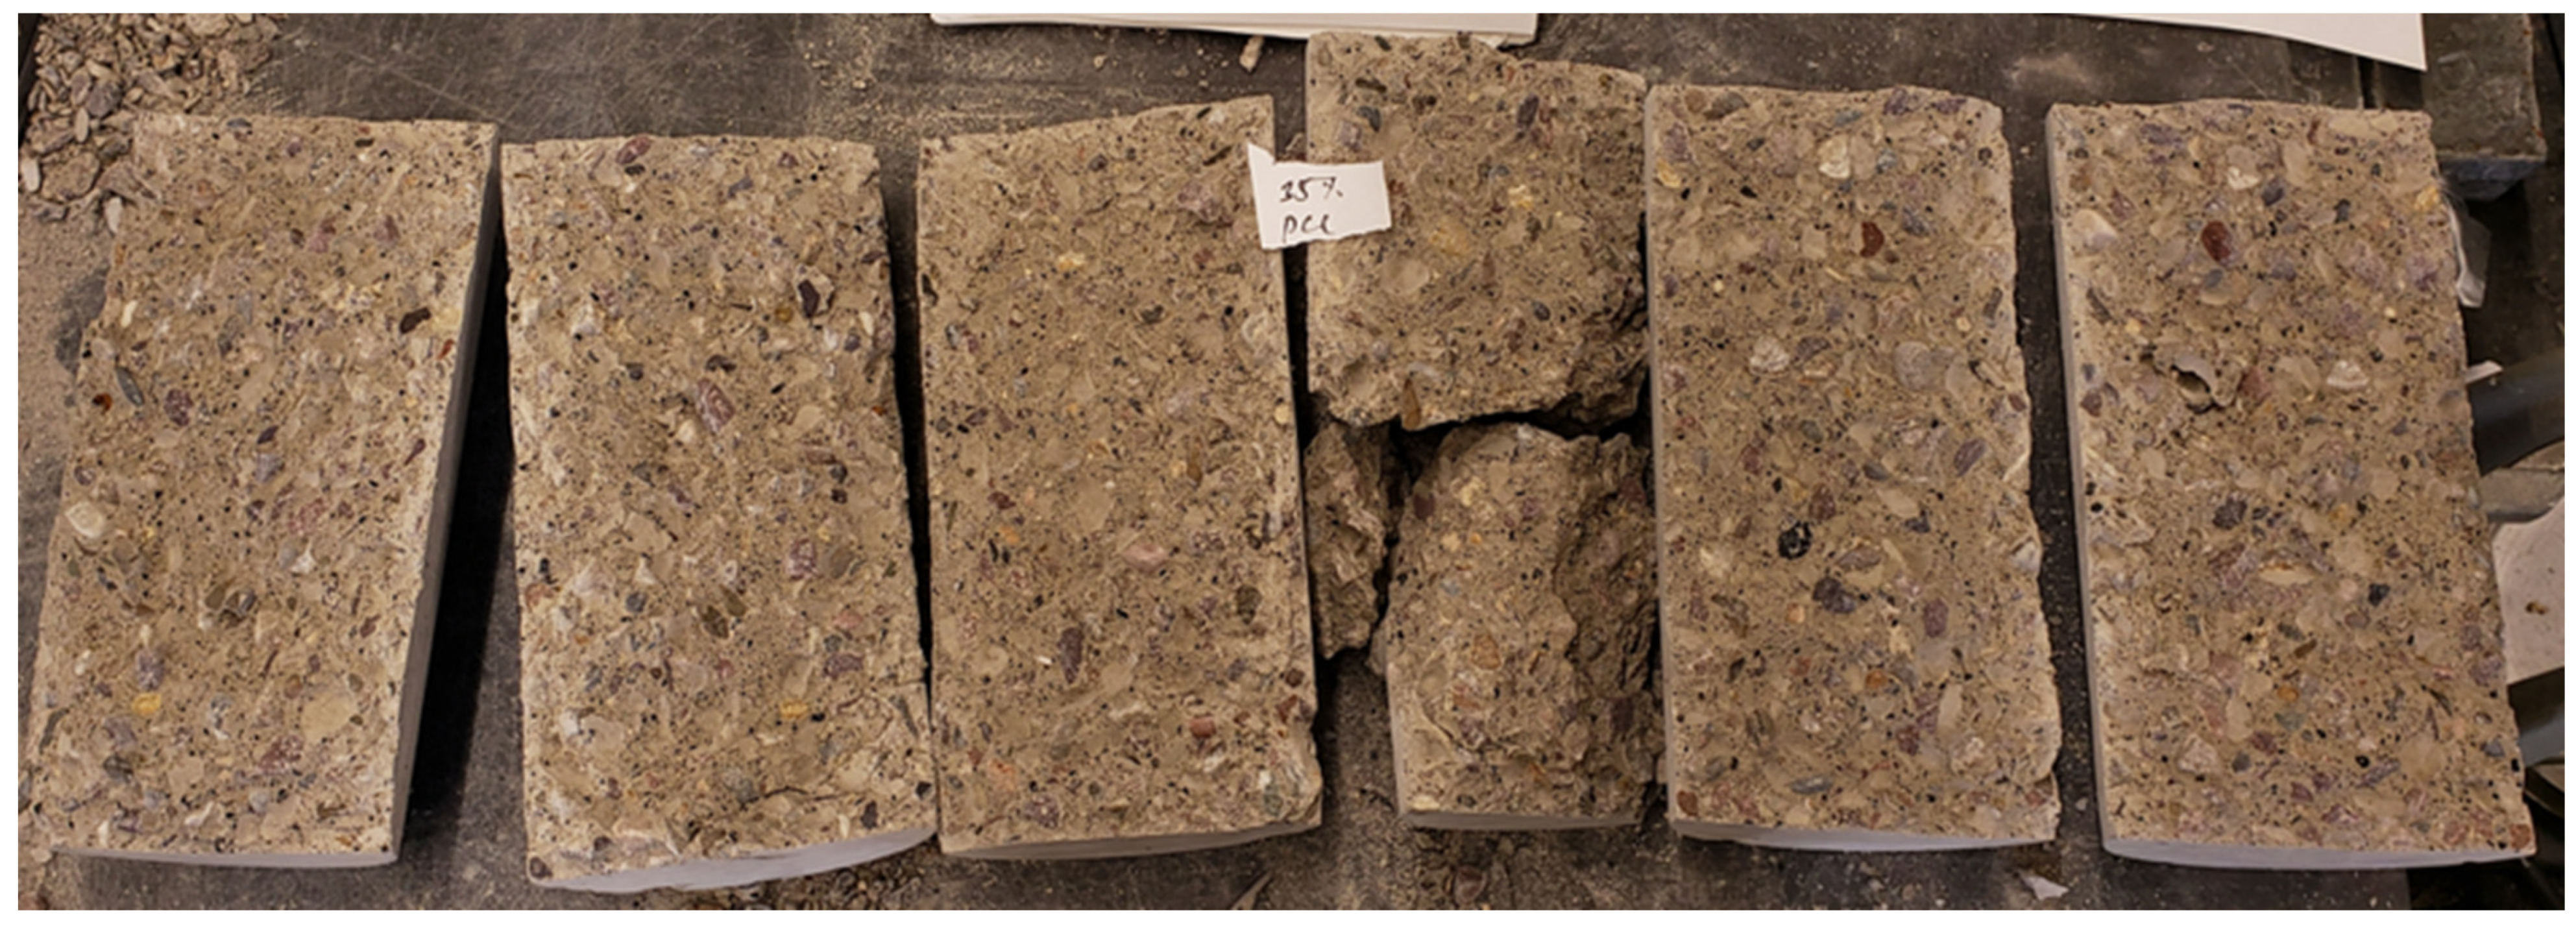
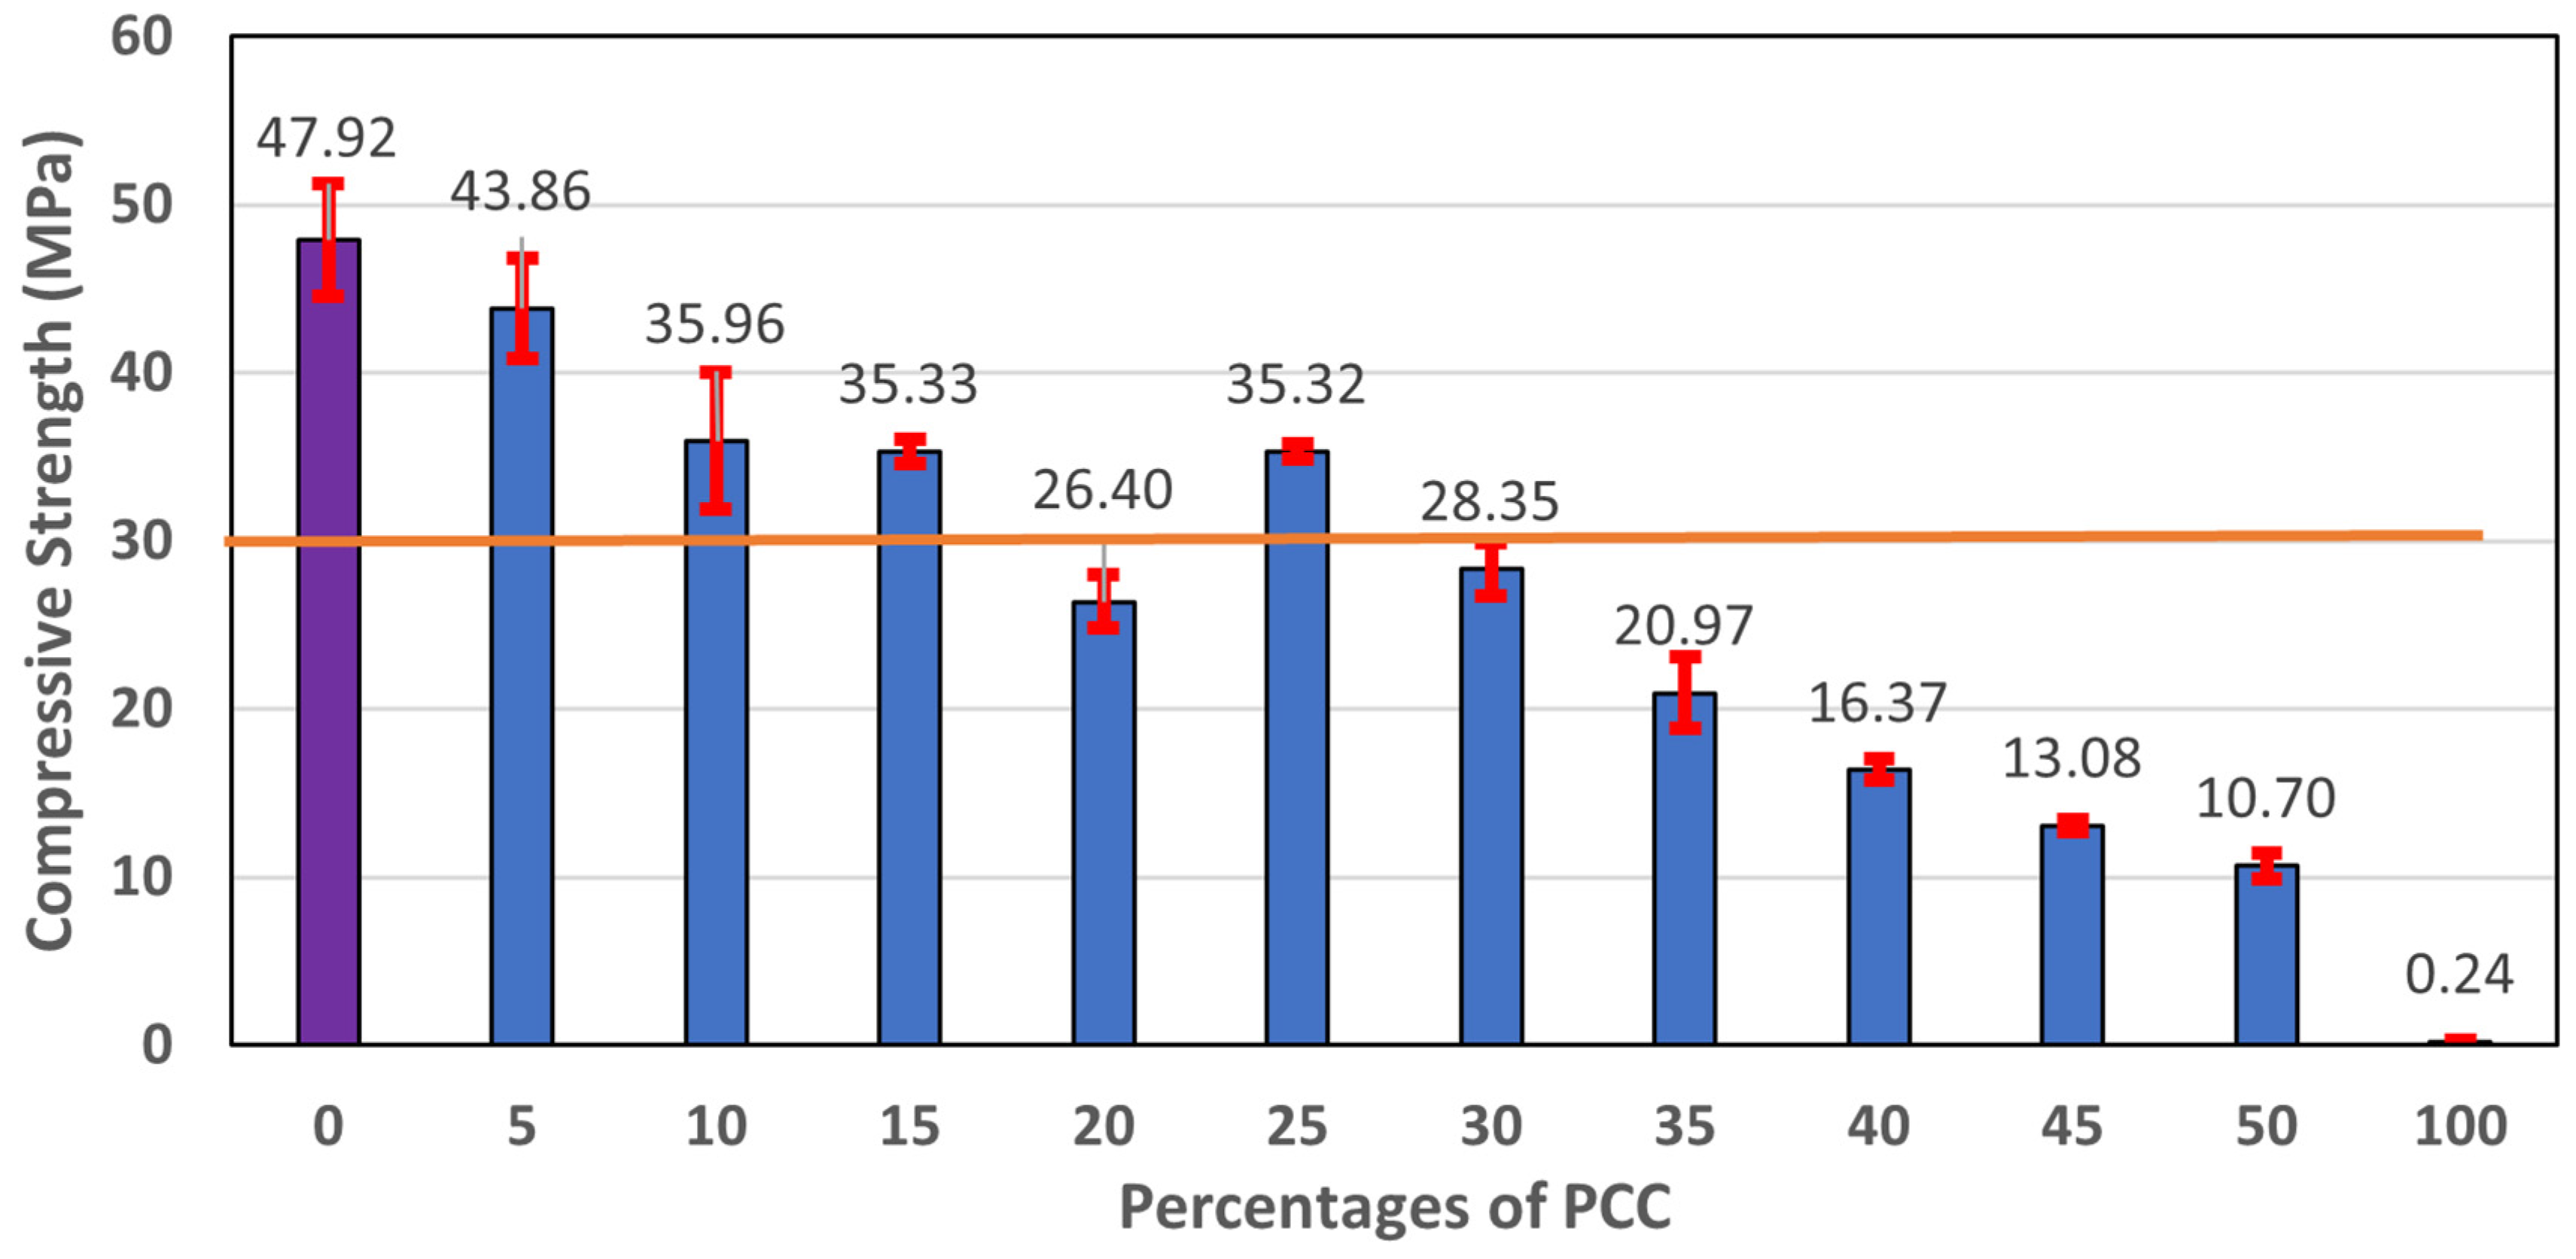
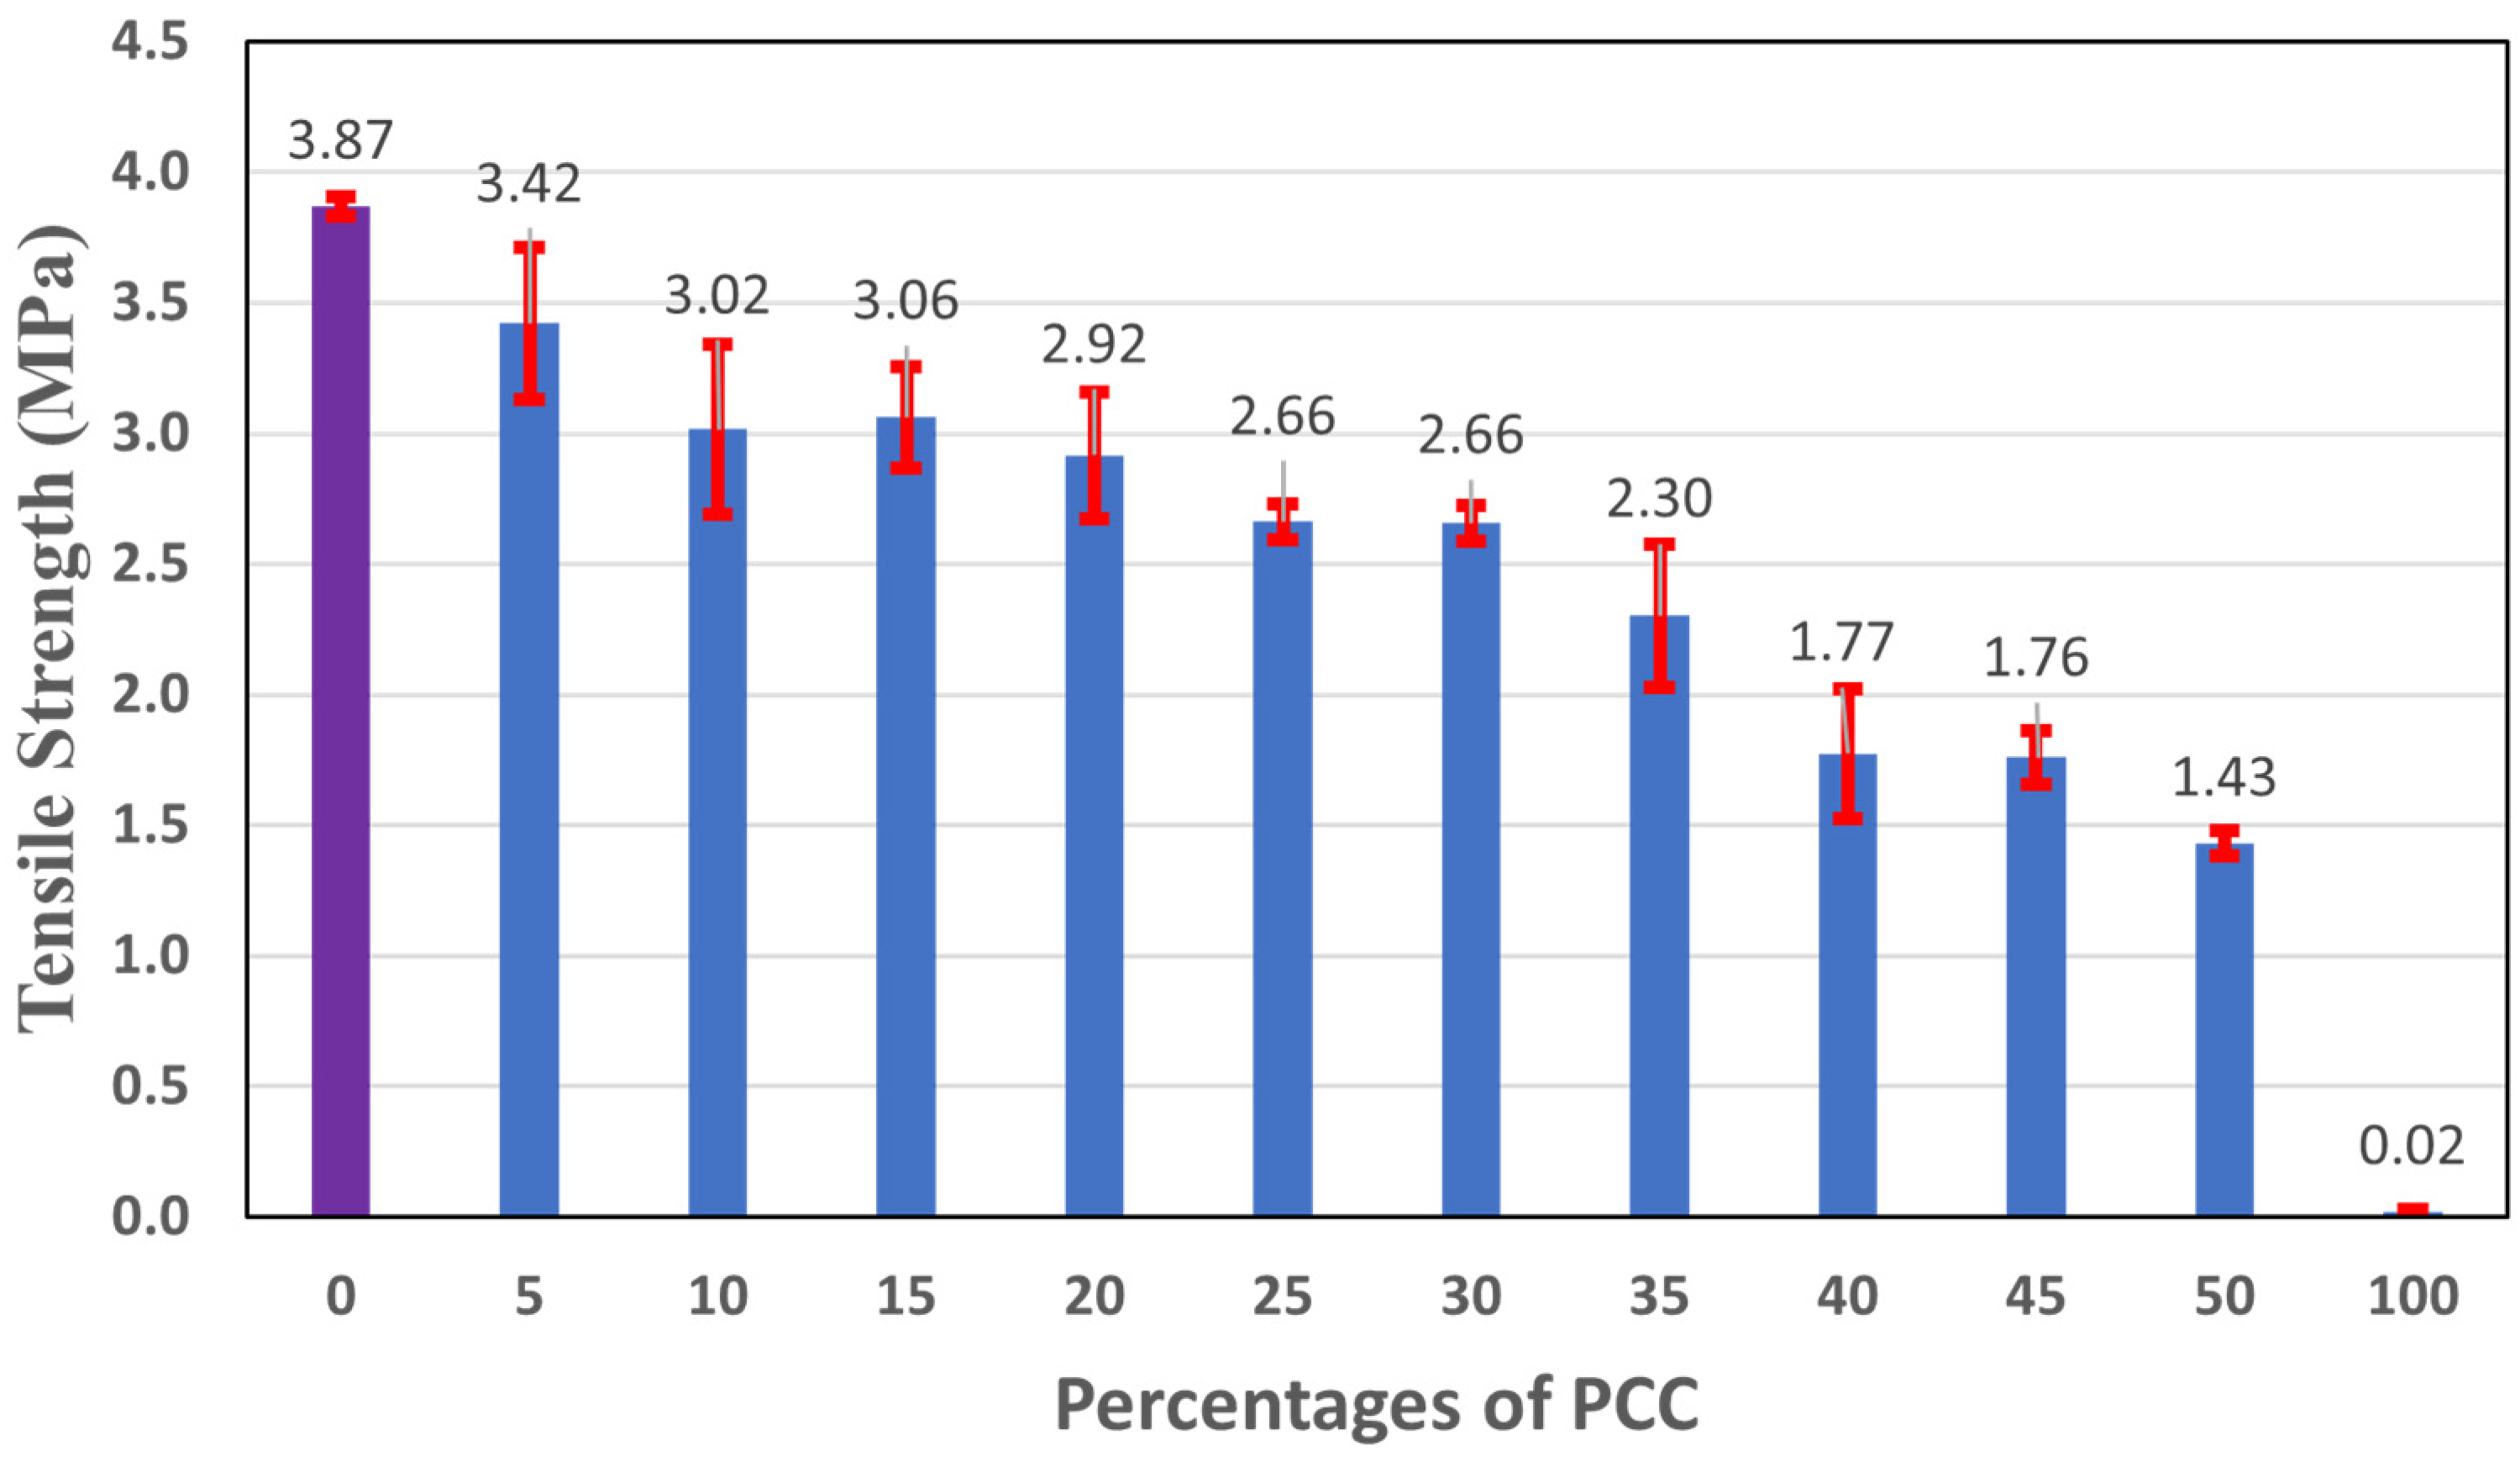
3.2.1. Cement Replaced with PCC
3.2.2. Aggregates Replaced with UCA
3.2.3. Cement Replaced with PCC and Aggregates Replaced with UCA
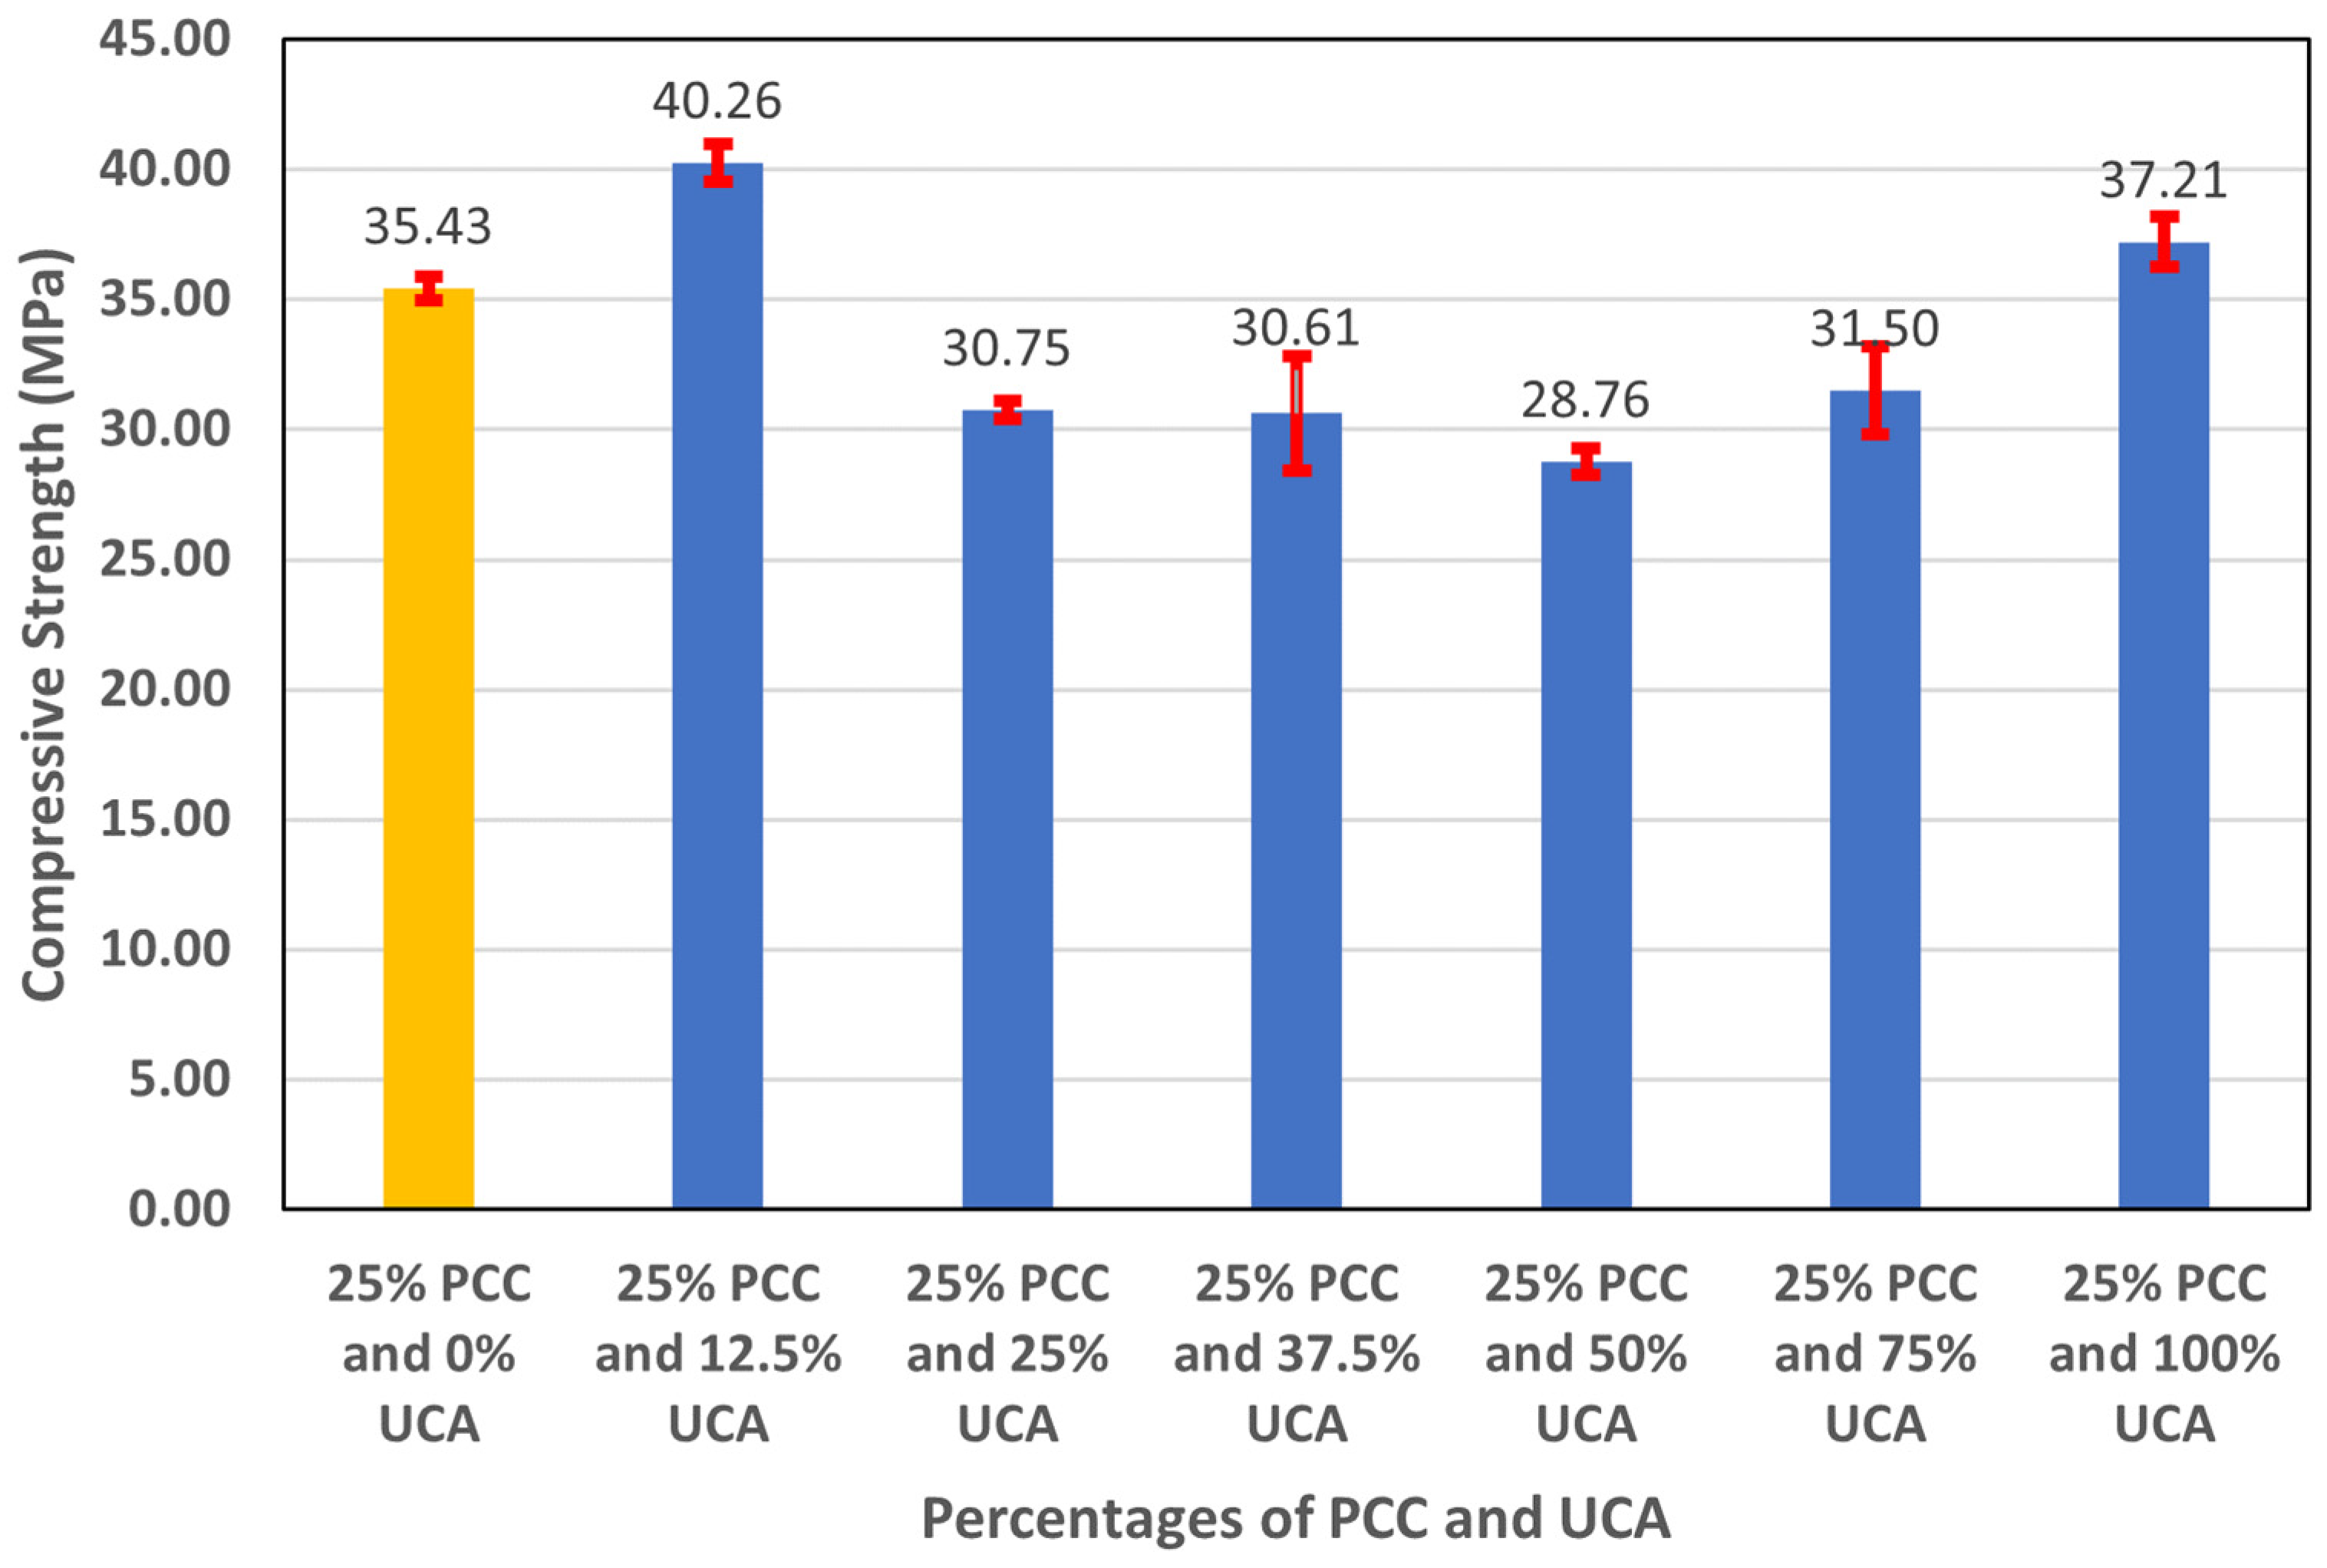
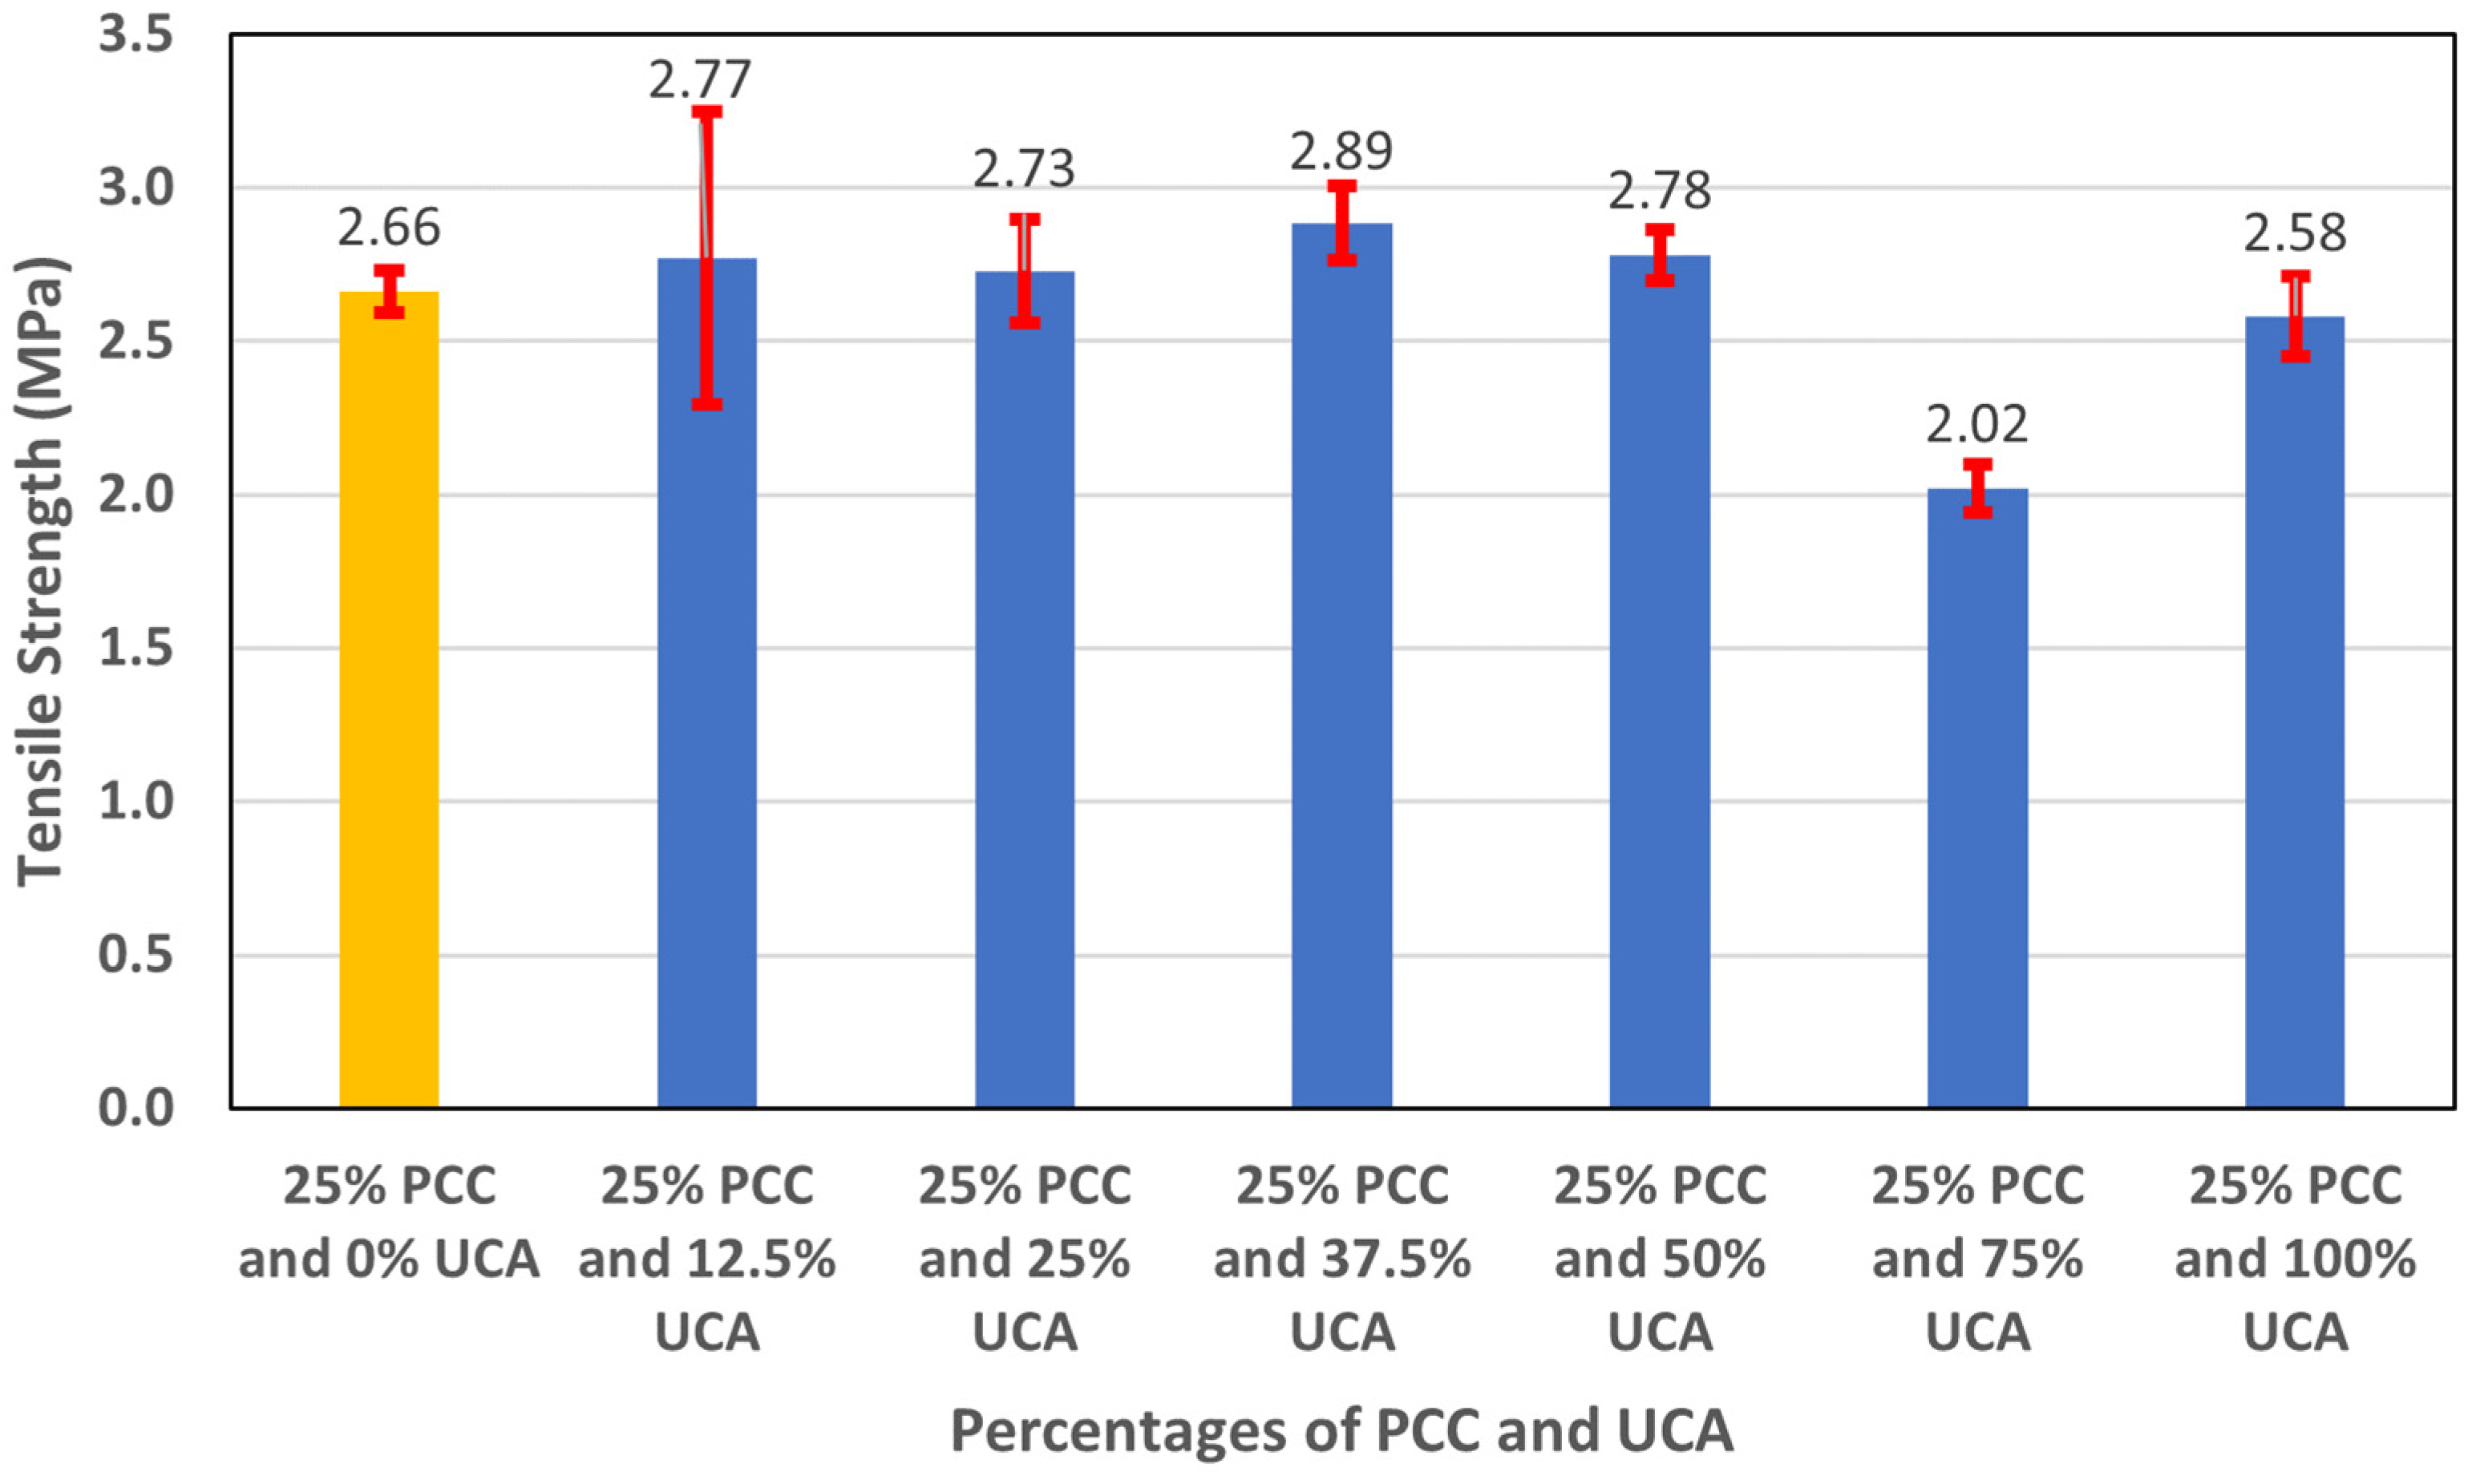
3.2.4. 25% Cement Replacement with PCC and Various Amounts of Aggregates Replaced with UCA
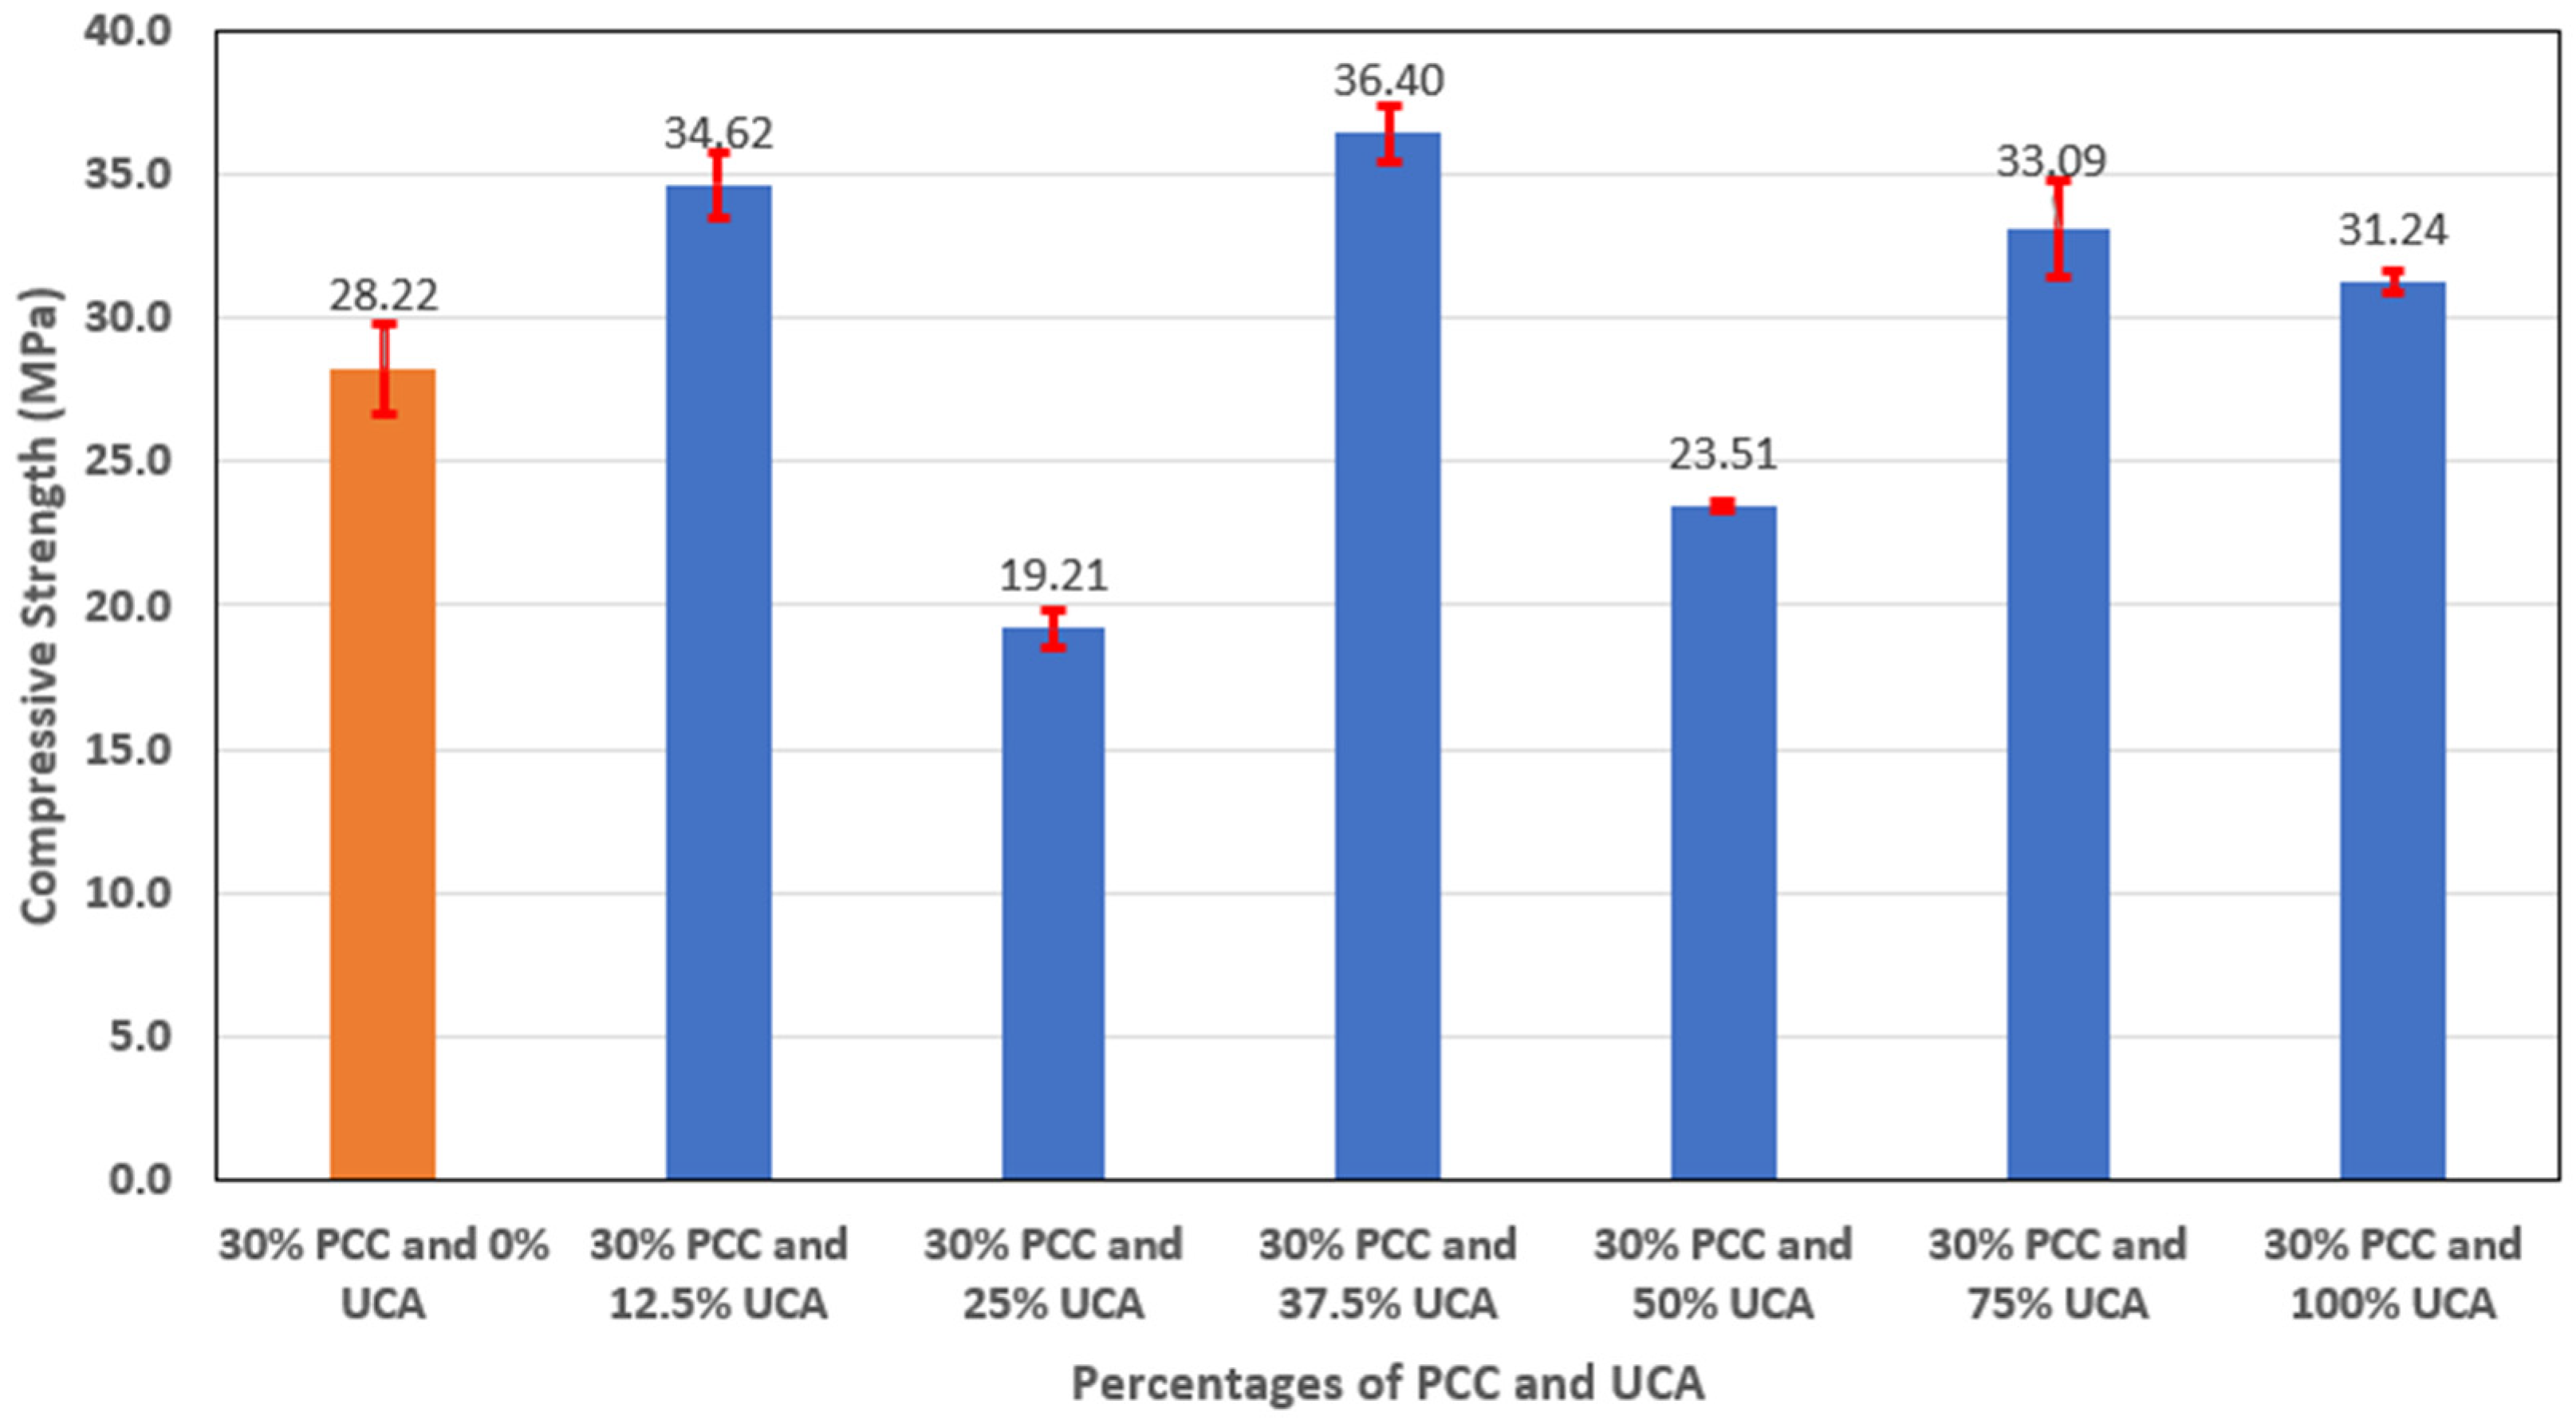
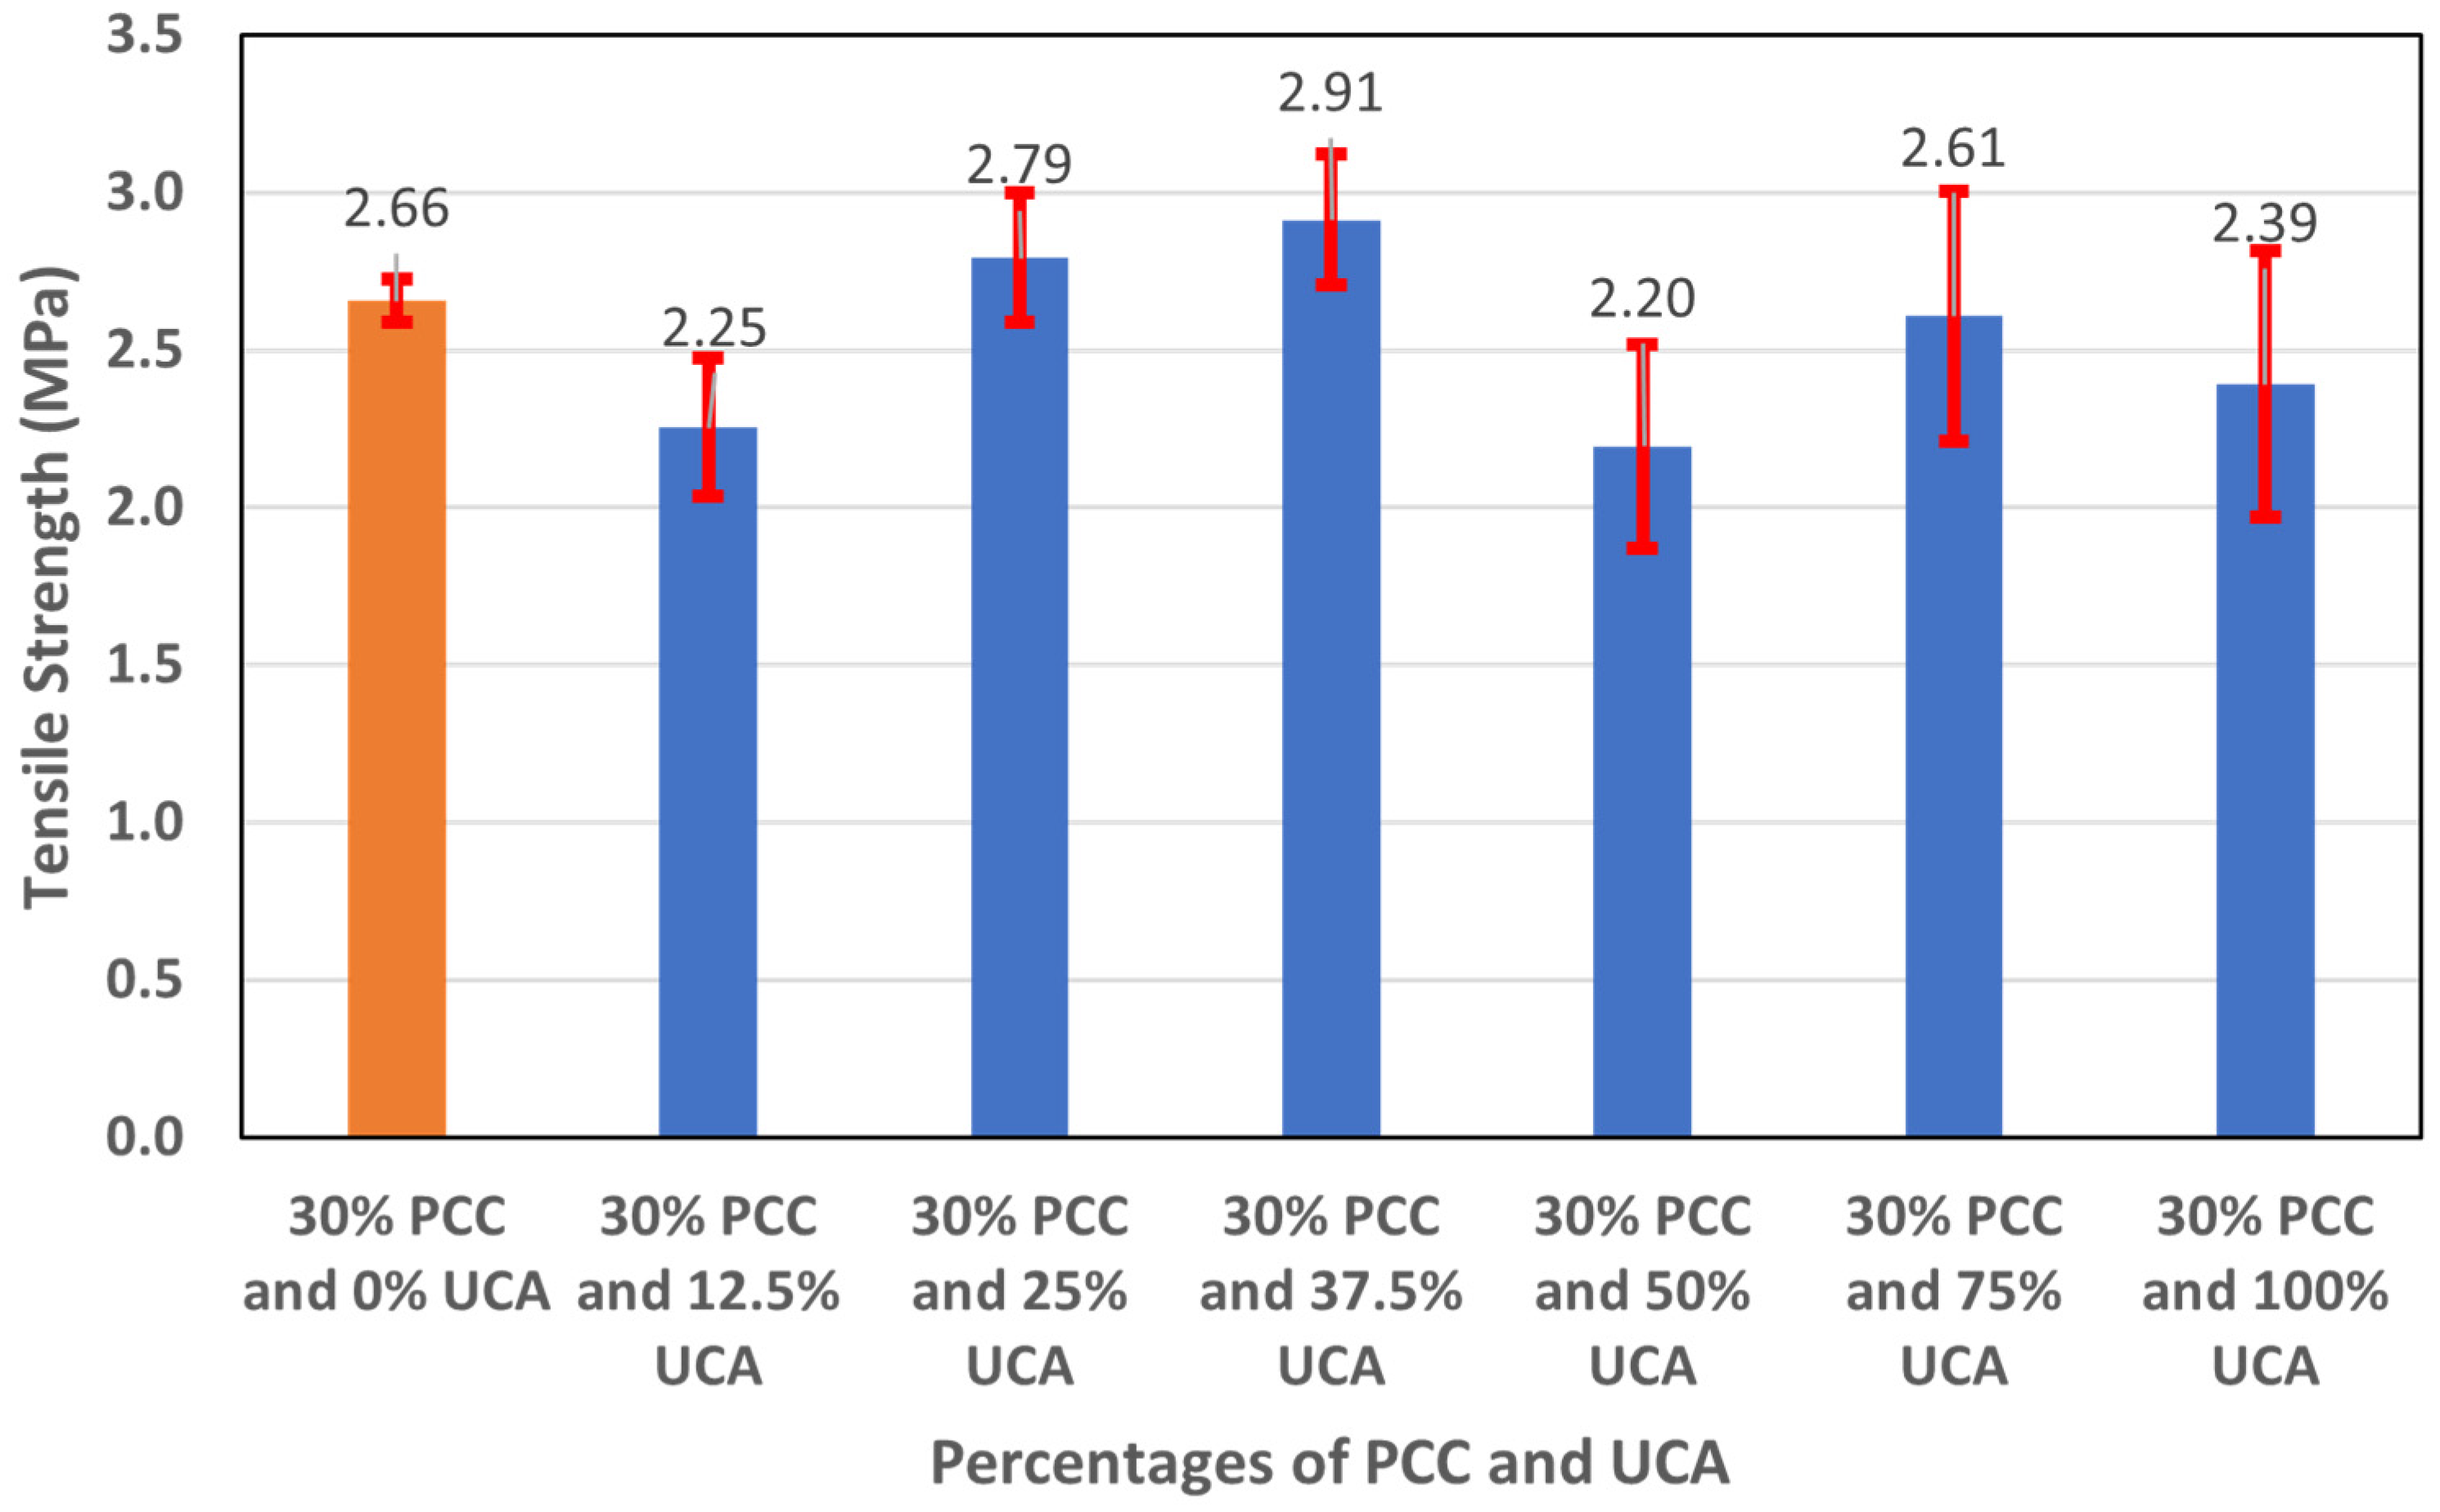
3.2.5. 30% Cement Replacement with PCC and Various Amounts of Aggregates Replaced with UCA
3.2.6. Concrete with Various Percentages of Cement
3.2.7. Concrete with Reduced Cement and Reduced Water
3.2.8. Concrete with Cement Replaced with 25% and 30% Fly Ash
3.3. Flexural Test and Deflection
4. Discussions
4.1. Environmental Considerations of Study and Reduction in Carbon Emissions
4.2. Use of PCC in Concrete
4.3. Use of UCA in Concrete
4.4. Use of PCC and UCA in Concrete
4.5. Comparison between Concrete with PCC and Reduced Cement or Fly Ash in a Concrete
5. Conclusions
Author Contributions
Funding
Institutional Review Board Statement
Informed Consent Statement
Data Availability Statement
Acknowledgments
Conflicts of Interest
References
- Manzi, S.; Bignozzi, M.C. Self-compacting concrete with recycled aggregates. In Advances in Construction and Demolition Waste Recycling; Elsevier: Amsterdam, The Netherlands, 2020; pp. 229–252. [Google Scholar] [CrossRef]
- How Cement is Made. (n.d.). Available online: https://www.cement.org/cement-concrete/how-cement-is-made (accessed on 30 August 2023).
- Skinner, B. Concrete: 8% of Global Emissions and Rising. Which Innovations Can Achieve Net Zero by 2050?—Energy Post. Energy Post. Available online: https://energypost.eu/concrete-8-of-global-emissions-and-rising-which-innovations-can-achieve-net-zero-by-2050/#:~:text=Concrete%3A%208%25%20of%20global%20carbon,strength%2Dcontributing%20ingredient%20of%20concrete (accessed on 24 January 2023).
- Malsang, I. Concrete: The World’s 3rd Largest CO2 Emitter. 2021. Available online: https://phys.org/news/2021-10-concrete-world-3rd-largest-co2.html (accessed on 30 August 2023).
- Functional Façades Help Tackle Building Emissions. (n.d.). Available online: https://nickelinstitute.org/en/blog/2020/april/functional-facades-help-tackle-building-emissions/ (accessed on 30 August 2023).
- Mason, S. UCLA Scientists Confirm That: New Techniques Could Make Cement Manufacturing Carbon Neutral. UCLA. Available online: https://newsroom.ucla.edu/releases/ucla-scientists-confirm:-new-technique-could-make-cement-manufacturing-carbon-neutral (accessed on 2 October 2015).
- Bun, P.; Cyr, M.; Laniesse, P.; Bun, K.N.; Idir, R. Concrete made of 100% recycled materials—Feasibility study. Resour. Conserv. Recycl. 2022, 180, 106199. [Google Scholar] [CrossRef]
- Cementitious Materials|National Concrete Pavement Technology Center. (n.d.). National Concrete Pavement Technology Center. Available online: https://cptechcenter.org/cementitious-materials/#:~:text=Supplementary%20cementitious%20materials%20(SCMs)%20contribute,of%20the%20concrete's%20hydration%20products (accessed on 30 August 2023).
- Marceau, M.L.; Gajda, J.; VanGeem, M.G. Use of Fly Ash in Concrete: Normal and High-Volume Ranges; PCA R&D Serial No. 2604; Portland Cement Association: Skokie, IL, USA, 2002. [Google Scholar]
- Tak, S.; Gupta, P.; Kumar, A.; Sofi, A.; Yun, C.M. Effect of using silica fume as a partial replacement of cement in concrete. Mater. Today Proc. 2023. [Google Scholar] [CrossRef]
- Benefits of Using Slag Cement. (n.d.). Available online: https://www.concrete.org/tools/frequentlyaskedquestions.aspx?faqid=687 (accessed on 30 August 2023).
- Shaikh, F. What Is PORTLAND SLAG CEMENT? Know the Advantages and Disadvantages of It!—Civil Giant. Civil Giant. 2023. Available online: https://www.civilgiant.com/portland-slag-cement/ (accessed on 30 August 2023).
- Kaur, H. Effect of Replacement of Coarse Aggregate with Steel Fibers in Concrete. Int. J. Sci. Res. 2017, 7, ART20181307. [Google Scholar]
- Mahat, M.; Acharya, M.; Acharya, M.; Mashal, M. Use of waste tires as transverse reinforcement and external confinement in concrete columns subjected to axial loads. Sustainability 2023, 15, 11620. [Google Scholar] [CrossRef]
- Ahmad, J.; Zhou, Z.; Majdi, A.; Alqurashi, M.; Deifalla, A.F. Overview of Concrete Performance Made with Waste Rubber Tires: A Step toward Sustainable Concrete. Materials 2022, 15, 5518. [Google Scholar] [CrossRef] [PubMed]
- Sau, D.; Shiuly, A.; Hazra, T. Utilization of plastic waste as replacement of natural aggregates in sustainable concrete: Effects on mechanical and durability properties. Int. J. Environ. Sci. Technol. 2023, 20. [Google Scholar] [CrossRef] [PubMed]
- Rashid, M.A.; Salam, M.A.; Shill, S.K.; Hasan, M.K. Effect of Replacing Natural Coarse Aggregate with Brick Aggregate on the Properties of Concrete. ResearchGate. 2012. Available online: https://www.researchgate.net/publication/266798233_Effect_of_Replacing_Natural_Coarse_Aggregate_by_Brick_Aggregate_on_the_Properties_of_Concrete#:~:text=The%20use%20of%20brick%20aggregate,%25%2C%20and%2028%25%20respectively (accessed on 30 August 2023).
- Reddy, G.S.; Harshini, G.; Haripriya, D.; Saritha, T. Partial Replacement of Aggregates with Glass. Int. J. Technol. Res. Eng. 2018, 5. [Google Scholar]
- What Is Net Zero and What Does It Mean? (A Complete Guide). (n.d.). Available online: https://www.twi-global.com/technical-knowledge/faqs/what-is-net-zero (accessed on 30 August 2023).
- Global Sugar Consumption 2023/24|Statista. Statista. 1 June 2023. Available online: https://www.statista.com/statistics/249681/total-consumption-of-sugar-worldwide/ (accessed on 30 August 2023).
- Kuska, M.T.; Von Tiedemann, S.; Mahlein, A. How table sugar is produced from sugar beets. Front. Young Minds 2020, 8, 108. [Google Scholar] [CrossRef]
- Gharieb, M.; Rashad, A.M. An initial study of using sugar-beet waste as a cementitious material. Constr. Build. Mater. 2020, 250, 118843. [Google Scholar] [CrossRef]
- World Population Review. (n.d.-c). Sugar Consumption by Country 2023. Available online: https://worldpopulationreview.com/country-rankings/sugar-consumption-by-country (accessed on 30 August 2023).
- “Disposal of Wastes from the Beet Sugar Industry” by Edward Bartow. (n.d.). Available online: https://scholarworks.uni.edu/pias/vol39/iss1/31/ (accessed on 30 August 2023).
- CORDIS. Beets and Carrots Could Lead to Stronger and Greener Buildings. Physorg. 20 July 2018. Available online: https://phys.org/news/2018-07-beets-carrots-stronger-greener.html (accessed on 19 July 2023).
- Ali, S.; Kumar, A.; Rizvi, S.H.; Ali, M.; Ahmed, I. Effect of sugarcane bagasse ash as partial cement replacement on the compressive strength of concrete. Quaid-E-Awam Univ. Res. J. Eng. Sci. Technol. 2020, 18, 44–49. [Google Scholar] [CrossRef]
- Application Description—Portland Cement Concrete—User Guidelines for Waste and Byproduct Materials in Pavement Construction—FHWA-RD-97-148. (n.d.). Available online: https://www.fhwa.dot.gov/publications/research/infrastructure/structures/97148/app2.cfm#:~:text=The%20specific%20gravity%20of%20Portland%20cement%20is%20approximately%203.15 (accessed on 30 August 2023).
- Šárka, E.; Bubnik, Z.; Kadlec, P.; Veselá-Trilčová, A. The particle size of carbonation mud, and possibilities for influencing it. J. Food Eng. 2008, 87, 45–50. [Google Scholar] [CrossRef]
- Mushtaq, M.; Zaman, G.; SA, J. Production of Acetic Acid by Fermentation Using Sugar Beet Molasses. Biog. Sci. Res. 2021, 9. [Google Scholar] [CrossRef]
- Mioduszewska, N.; Adamski, M.; Smurzyńska, A.; Przybył, J.L.; Pilarski, K. The usefulness of sugar beets for biogas production in relations of the storage time and sugar content. E3S Web Conf. 2018, 44, 00114. [Google Scholar] [CrossRef]
- Construction and Demolition Debris: Material-Specific Data|US EPA. US EPA. 3 December 2022. Available online: https://www.epa.gov/facts-and-figures-about-materials-waste-and-recycling/construction-and-demolition-debris-material (accessed on 30 August 2023).
- Ibrahim, M.; Alimi, W.; Assaggaf, R.A.; Salami, B.A.; Oladapo, E.A. An overview of factors influencing the properties of concrete incorporating construction and demolition wastes. Constr. Build. Mater. 2023, 367, 130307. [Google Scholar] [CrossRef]
- EPA. Construction and Demolition Debris Management in the United States in 2015; U.S. Environmental Protection Agency, Office of Resource Conservation and Recovery: Washington, DC, USA, 2020.
- Adams, M.P.; Jayasuriya, A. ACI CRC 18.517: Guideline Development for Use of Recycled Concrete Aggregates in New Concrete; ACI Foundation: Farmington Hills, MI, USA, 2019. [Google Scholar]
- Shatarat, N.; Katkhuda, H.; Ayyoub, M.; Al-Hunaiti, Y.; Jaber MS, A. Improving bond strength of recycled coarse aggregate concrete using chopped basalt fibers. Case Stud. Constr. Mater. 2022, 17, e01449. [Google Scholar] [CrossRef]
- McNeil, K.; Kang, T.H. Recycled Concrete Aggregates: A review. Int. J. Concr. Struct. Mater. 2013, 7, 61–69. [Google Scholar] [CrossRef]
- Kwan, W.H.; Ramli, M.; Kam, K.J.; Sulieman, M.Z. Influence of the amount of recycled coarse aggregate in concrete design and durability properties. Constr. Build. Mater. 2012, 26, 565–573. [Google Scholar] [CrossRef]
- Limbachiya, M.; Meddah, M.S.; Ouchagour, Y. Use of recycled concrete aggregate in fly-ash concrete. Constr. Build. Mater. 2012, 27, 439–449. [Google Scholar] [CrossRef]
- The Global CCS Institute. CCS Tech Talks—Rodney Schmidt, VP, Blue Planet LTD & CEO Canada, Blue Planet [Video]. YouTube. 20 April 2020. Available online: https://www.youtube.com/watch?v=XlOHgJZfDzI (accessed on 30 August 2023).
- Carbon Negative Aggregate|Concrete|Pittsburg|SF Bay Aggregates. (n.d.). SF Bay Aggregates. Available online: https://www.sfbayaggregates.com/ (accessed on 30 August 2023).
- PRODUCTS|Blue Planet Systems. (n.d.-b). Blue Planet Systems. Available online: https://www.blueplanetsystems.com/products (accessed on 30 August 2023).
- ASTM D6913/D6913M-17; Standard Test Methods for Particle-Size Distribution (Gradation) of Soils Using Sieve Analysis. ASTM: West Conshohocken, PA, USA, 2021. Available online: https://www.astm.org/d6913-04r09e01.html (accessed on 30 August 2023).
- ASTM C136 C136M 14; Standard Test Method for Sieve Analysis of Fine and Coarse Aggregates. ASTM: West Conshohocken, PA, USA, 2015. Available online: https://www.astm.org/c0136-06.html (accessed on 30 August 2023).
- Dale, T. What is Fly Ash and How Is It Used in Concrete? The Spruce. 2023. Available online: https://www.thespruce.com/fly-ash-applications-844761 (accessed on 6 August 2023).
- Chapter 3—Fly Ash in Portland Cement Concrete—Fly Ash Facts for Highway Engineers—Recycling—Sustainability—Pavements—Federal Highway Administration. (n.d.). Available online: https://www.fhwa.dot.gov/pavement/recycling/fach03.cfm (accessed on 30 August 2023).
- Mamlouk, M.S.; Zaniewski, J.P. Materials for Civil and Construction Engineers; Pearson Prentice Hall: Hoboken, NJ, USA, 2006; Available online: http://ci.nii.ac.jp/ncid/BB00752379 (accessed on 30 August 2023).
- C143/C143M; Standard Test Method for Slump of Hydraulic-Cement Concrete. ASTM: West Conshohocken, PA, USA, 2015. Available online: https://www.astm.org/c0143_c0143m-20.html (accessed on 30 August 2023).
- ASTM C39; Standard Test Method for Compressive Strength of Cylindrical Concrete Specimens. ASTM: West Conshohocken, PA, USA, 2021. Available online: https://www.astm.org/c0039_c0039m-21.html (accessed on 30 August 2023).
- ASTM C496-96; Standard Test Method for Splitting Tensile Strength of Cylindrical Concrete Specimens. ASTM: West Conshohocken, PA, USA, 2009. Available online: https://www.astm.org/standards/c496 (accessed on 30 August 2023).
- Three Point and Four-Point Bending | Penn Center for Musculoskeletal Disorders|Perelman School of Medicine at the University of Pennsylvania. (n.d.). Available online: https://www.med.upenn.edu/pcmd/3pt-4pt-bending.html (accessed on 30 August 2023).
- ASTM C78/C78M-22; Standard Test Method for Flexural Strength of Concrete (Using Simple Beam with Third-Point Loading). ASTM: West Conshohocken, PA, USA, 2022. Available online: https://www.astm.org/standards/c78 (accessed on 30 August 2023).
- Deflection in a Concrete Topic. (n.d.). Available online: https://www.concrete.org/topicsinconcrete/topicdetail/Deflection%20in%20Concrete?search=Deflection%20in%20Concrete (accessed on 30 August 2023).
- Modulus of Elasticity of Concrete. (n.d.). Civil Engineering. Available online: https://civiltoday.com/civil-engineering-materials/concrete/84-modulus-of-elasticity-of-concrete (accessed on 30 August 2023).
- McCormac, J.C.; Brown, R.H. Design of Reinforced Concrete; Wiley: Hoboken, NJ, USA, 2016. [Google Scholar]


| Material Type in C&D Debris | Landfill | Next Use | Total Next Use | ||||
|---|---|---|---|---|---|---|---|
| Compost and Mulch | Manufactured Products | Aggregate, Other | Fuel | Soil Amendment | |||
| Concrete | 66,535,034 | 0 | 30,962,635 | 284,260,331 | 0 | 0 | 315,222,966 |
| Wood | 27,053,922 | 2,611,131 | 1,296,159 | 0 | 7,988,787 | 0 | 11,896,077 |
| Gypsum drywall | 10,803,717 | 0 | 234,675 | 0 | 0 | 2,003,608 | 2,238,283 |
| Metal | 670,495 | 0 | 3,784,505 | 0 | 0 | 0 | 3,784,505 |
| Brick and clay tile | 10,587,745 | 0 | 0 | 1,559,255 | 0 | 0 | 1,559,255 |
| Asphalt shingles | 11,491,724 | 0 | 1,931,000 | 80,045 | 22,231 | 0 | 2,033,276 |
| Asphalt pavement | 5,042,361 | 0 | 70,347,585 | 7,769,079 | 0 | 0 | 78,116,664 |
| TOTAL | 132,184,998 | 2,611,131 | 108,556,559 | 293,668,710 | 8,011,018 | 2,003,608 | 414,851,026 |
| Impurities | Lime Plaster | Soil | Wood | Hydrated Gypsum | Asphalt | Paint-Made Vinyl Acetated |
|---|---|---|---|---|---|---|
| Percentage of aggregate by volume | 7% | 5% | 4% | 3% | 2% | 0.20% |
| Materials | Weight (kg) |
|---|---|
| Water | 5.82 (12.82 lb) |
| Cement | 13.32 (29.36 lb) |
| Fine aggregate | 15.53 (34.24 lb) |
| Coarse aggregate | 31.38 (69.19 lb) |
| Total weight | 66.05 (145.61 lb) |
| Percentage of Cement in a Concrete Mix | Water-to-Cement Ratio (w:c) | Compressive Strength (MPa) | Average Compressive Strength (MPa) | Standard Deviation (MPa) | ||
|---|---|---|---|---|---|---|
| Sample 1 | Sample 2 | Sample 3 | ||||
| 75 | 0.58 | 21.96 | 21.48 | 23.13 | 22.19 | 0.69 |
| 70 | 0.62 | 19.56 | 20.75 | 22.74 | 21.01 | 1.31 |
| 75 | 0.44 | 52.81 | 51.87 | 45.70 | 50.13 | 3.15 |
| 70 | 0.44 | 25.73 | 24.84 | 27.88 | 26.15 | 1.28 |
| Percentage of PCC | Percentage of Fly Ash | Compressive Strength (MPa) | Average Compressive Strength (MPa) | Standard Deviation (MPa) | ||
|---|---|---|---|---|---|---|
| Sample 1 | Sample 2 | Sample 3 | ||||
| 25 | 0 | 35.71 | 34.81 | 35.43 | 35.32 | 0.46 |
| 30 | 0 | 26.83 | 29.99 | 28.22 | 28.35 | 1.58 |
| 0 | 25 | 43.71 | 44.74 | 33.41 | 40.62 | 6.27 |
| 0 | 30 | 38.69 | 40.36 | 40.54 | 39.86 | 1.02 |
| Percentage of Cement in a Concrete Mix | Water-to-Cement Ratio (w:c) | Split Tensile Test Results (MPa) | Average Split Tensile Test Results (MPa) | Standard Deviation (MPa) | ||
|---|---|---|---|---|---|---|
| Sample 1 | Sample 2 | Sample 3 | ||||
| 75 | 0.58 | 2.08 | 2.49 | 2.26 | 2.28 | 0.21 |
| 70 | 0.62 | 1.86 | 2.63 | 1.95 | 2.15 | 0.42 |
| 75 | 0.44 | 2.85 | 2.63 | 2.81 | 2.76 | 0.12 |
| 70 | 0.44 | 2.75 | 1.72 | 2.81 | 2.43 | 0.62 |
| Percentage of Cement Replaced by PCC | Percentage of Fly Ash | Split Tensile Test Results (MPa) | Average Split Tensile Test Results (MPa) | Standard Deviation (MPa) | ||
|---|---|---|---|---|---|---|
| Sample 1 | Sample 2 | Sample 3 | ||||
| 25 | 0 | 2.59 | 2.73 | 2.67 | 2.66 | 0.07 |
| 30 | 0 | 2.59 | 2.73 | 2.65 | 2.66 | 0.07 |
| 0 | 25 | 3.18 | 2.51 | 2.41 | 2.70 | 0.42 |
| 0 | 30 | 2.45 | 2.84 | 2.78 | 2.69 | 0.21 |
| PCC (%) | UCA (%) | Specimens Number | Average Length (m) | Average Width (m) | Average Height (m) | Moment of Inertia (m4) | Maximum Point Load before Failure (F) | Flexural Strength (MPa) | Modulus of Elasticity (MPa) | Deflection (m) |
|---|---|---|---|---|---|---|---|---|---|---|
| (×10−5) | (×10−5) | |||||||||
| 0 | 0 | 1 | 0.54 | 0.16 | 0.16 | 5.24 | 10,100.00 | 5.21 | 33,328.66 | 4.32 |
| 2 | 0.53 | 0.16 | 0.16 | 5.27 | 10,900.00 | 5.60 | 33,328.66 | 4.57 | ||
| 25 | 0 | 1 | 0.53 | 0.16 | 0.16 | 5.41 | 8200.00 | 4.09 | 28,612.81 | 4.06 |
| 2 | 0.51 | 0.16 | 0.16 | 5.45 | 8200.00 | 4.10 | 28,612.81 | 4.06 | ||
| 25 | 12.5 | 1 | 0.53 | 0.16 | 0.16 | 5.34 | 5620.00 | 2.86 | 30,604.64 | 2.54 |
| 2 | 0.53 | 0.16 | 0.16 | 5.38 | 5220.00 | 2.65 | 30,604.64 | 2.29 | ||
| 25 | 25 | 1 | 0.54 | 0.16 | 0.16 | 5.03 | 7230.00 | 3.83 | 26,877.78 | 4.06 |
| 2 | 0.54 | 0.16 | 0.16 | 4.95 | 5040.00 | 2.69 | 26,877.78 | 2.79 | ||
| 25 | 37.5 | 1 | 0.53 | 0.16 | 0.16 | 5.28 | 4840.00 | 2.48 | 26,094.57 | 2.54 |
| 2 | 0.54 | 0.16 | 0.16 | 5.16 | 5980.00 | 3.11 | 26,094.57 | 3.30 | ||
| 25 | 50 | 1 | 0.53 | 0.16 | 0.16 | 5.24 | 3640.00 | 1.87 | 25,707.24 | 2.03 |
| 2 | 0.54 | 0.16 | 0.17 | 5.95 | 5150.00 | 2.44 | 25,707.24 | 2.54 | ||
| 25 | 75 | 1 | 0.54 | 0.16 | 0.16 | 5.26 | 5030.00 | 2.59 | 25,707.24 | 2.79 |
| 2 | 0.53 | 0.16 | 0.16 | 5.27 | 5700.00 | 2.93 | 25,707.24 | 3.30 | ||
| 25 | 100 | 1 | 0.53 | 0.16 | 0.16 | 5.33 | 6920.00 | 3.52 | 29,190.38 | 3.30 |
| 2 | 0.54 | 0.16 | 0.16 | 5.51 | 5790.00 | 2.87 | 29,190.38 | 2.79 |
| PCC (%) | UCA (%) | Specimens Number | Average Length (m) | Average Width (m) | Average Height (m) | Moment of Inertia (m4) | Maximum Point Load before Failure (F) | Flexural Strength (MPa) | Modulus of Elasticity (MPa) | Deflection (m) |
|---|---|---|---|---|---|---|---|---|---|---|
| (×10−5) | (×10−5) | |||||||||
| 0 | 0 | 1 | 0.54 | 0.16 | 0.16 | 5.24 | 10,100.00 | 5.21 | 33,328.66 | 4.32 |
| 2 | 0.53 | 0.16 | 0.16 | 5.27 | 10,900.00 | 5.60 | 33,328.66 | 4.57 | ||
| 30 | 0 | 1 | 0.54 | 0.16 | 0.16 | 5.52 | 7260.00 | 3.60 | 25,634.84 | 3.81 |
| 2 | 0.54 | 0.16 | 0.16 | 5.67 | 7960.00 | 3.87 | 25,634.84 | 4.06 | ||
| 30 | 12.5 | 1 | 0.53 | 0.16 | 0.16 | 5.39 | 5530.00 | 2.79 | 28,781.11 | 2.79 |
| 2 | 0.54 | 0.16 | 0.16 | 5.46 | 6730.00 | 3.35 | 28,781.11 | 3.30 | ||
| 30 | 25 | 1 | 0.53 | 0.16 | 0.16 | 5.38 | 5340.00 | 2.71 | 21,433.15 | 3.56 |
| 2 | 0.53 | 0.16 | 0.16 | 5.14 | 4810.00 | 2.51 | 21,433.15 | 3.30 | ||
| 30 | 37.5 | 1 | 0.54 | 0.15 | 0.16 | 5.15 | 4820.00 | 2.52 | 29,184.82 | 2.54 |
| 2 | 0.53 | 0.16 | 0.16 | 5.08 | 4580.00 | 2.41 | 29,184.82 | 2.29 | ||
| 30 | 50 | 1 | 0.53 | 0.15 | 0.16 | 5.63 | 6330.00 | 3.12 | 23,337.40 | 3.56 |
| 2 | 0.54 | 0.15 | 0.16 | 5.26 | 6330.00 | 3.27 | 23,337.40 | 3.81 | ||
| 30 | 75 | 1 | 0.53 | 0.15 | 0.16 | 4.98 | 5750.00 | 3.07 | 27,885.64 | 3.05 |
| 2 | 0.54 | 0.16 | 0.16 | 5.13 | 5220.00 | 2.73 | 27,885.64 | 2.79 | ||
| 30 | 100 | 1 | 0.53 | 0.15 | 0.16 | 5.08 | 6170.00 | 3.26 | 26,772.39 | 3.30 |
| 2 | 0.53 | 0.16 | 0.16 | 5.23 | 5650.00 | 2.91 | 26,772.39 | 3.05 |
Disclaimer/Publisher’s Note: The statements, opinions and data contained in all publications are solely those of the individual author(s) and contributor(s) and not of MDPI and/or the editor(s). MDPI and/or the editor(s) disclaim responsibility for any injury to people or property resulting from any ideas, methods, instructions or products referred to in the content. |
© 2023 by the authors. Licensee MDPI, Basel, Switzerland. This article is an open access article distributed under the terms and conditions of the Creative Commons Attribution (CC BY) license (https://creativecommons.org/licenses/by/4.0/).
Share and Cite
Phuyal, K.; Sharma, U.; Mahar, J.; Mondal, K.; Mashal, M. A Sustainable and Environmentally Friendly Concrete for Structural Applications. Sustainability 2023, 15, 14694. https://doi.org/10.3390/su152014694
Phuyal K, Sharma U, Mahar J, Mondal K, Mashal M. A Sustainable and Environmentally Friendly Concrete for Structural Applications. Sustainability. 2023; 15(20):14694. https://doi.org/10.3390/su152014694
Chicago/Turabian StylePhuyal, Kabiraj, Ujwal Sharma, James Mahar, Kunal Mondal, and Mustafa Mashal. 2023. "A Sustainable and Environmentally Friendly Concrete for Structural Applications" Sustainability 15, no. 20: 14694. https://doi.org/10.3390/su152014694
APA StylePhuyal, K., Sharma, U., Mahar, J., Mondal, K., & Mashal, M. (2023). A Sustainable and Environmentally Friendly Concrete for Structural Applications. Sustainability, 15(20), 14694. https://doi.org/10.3390/su152014694