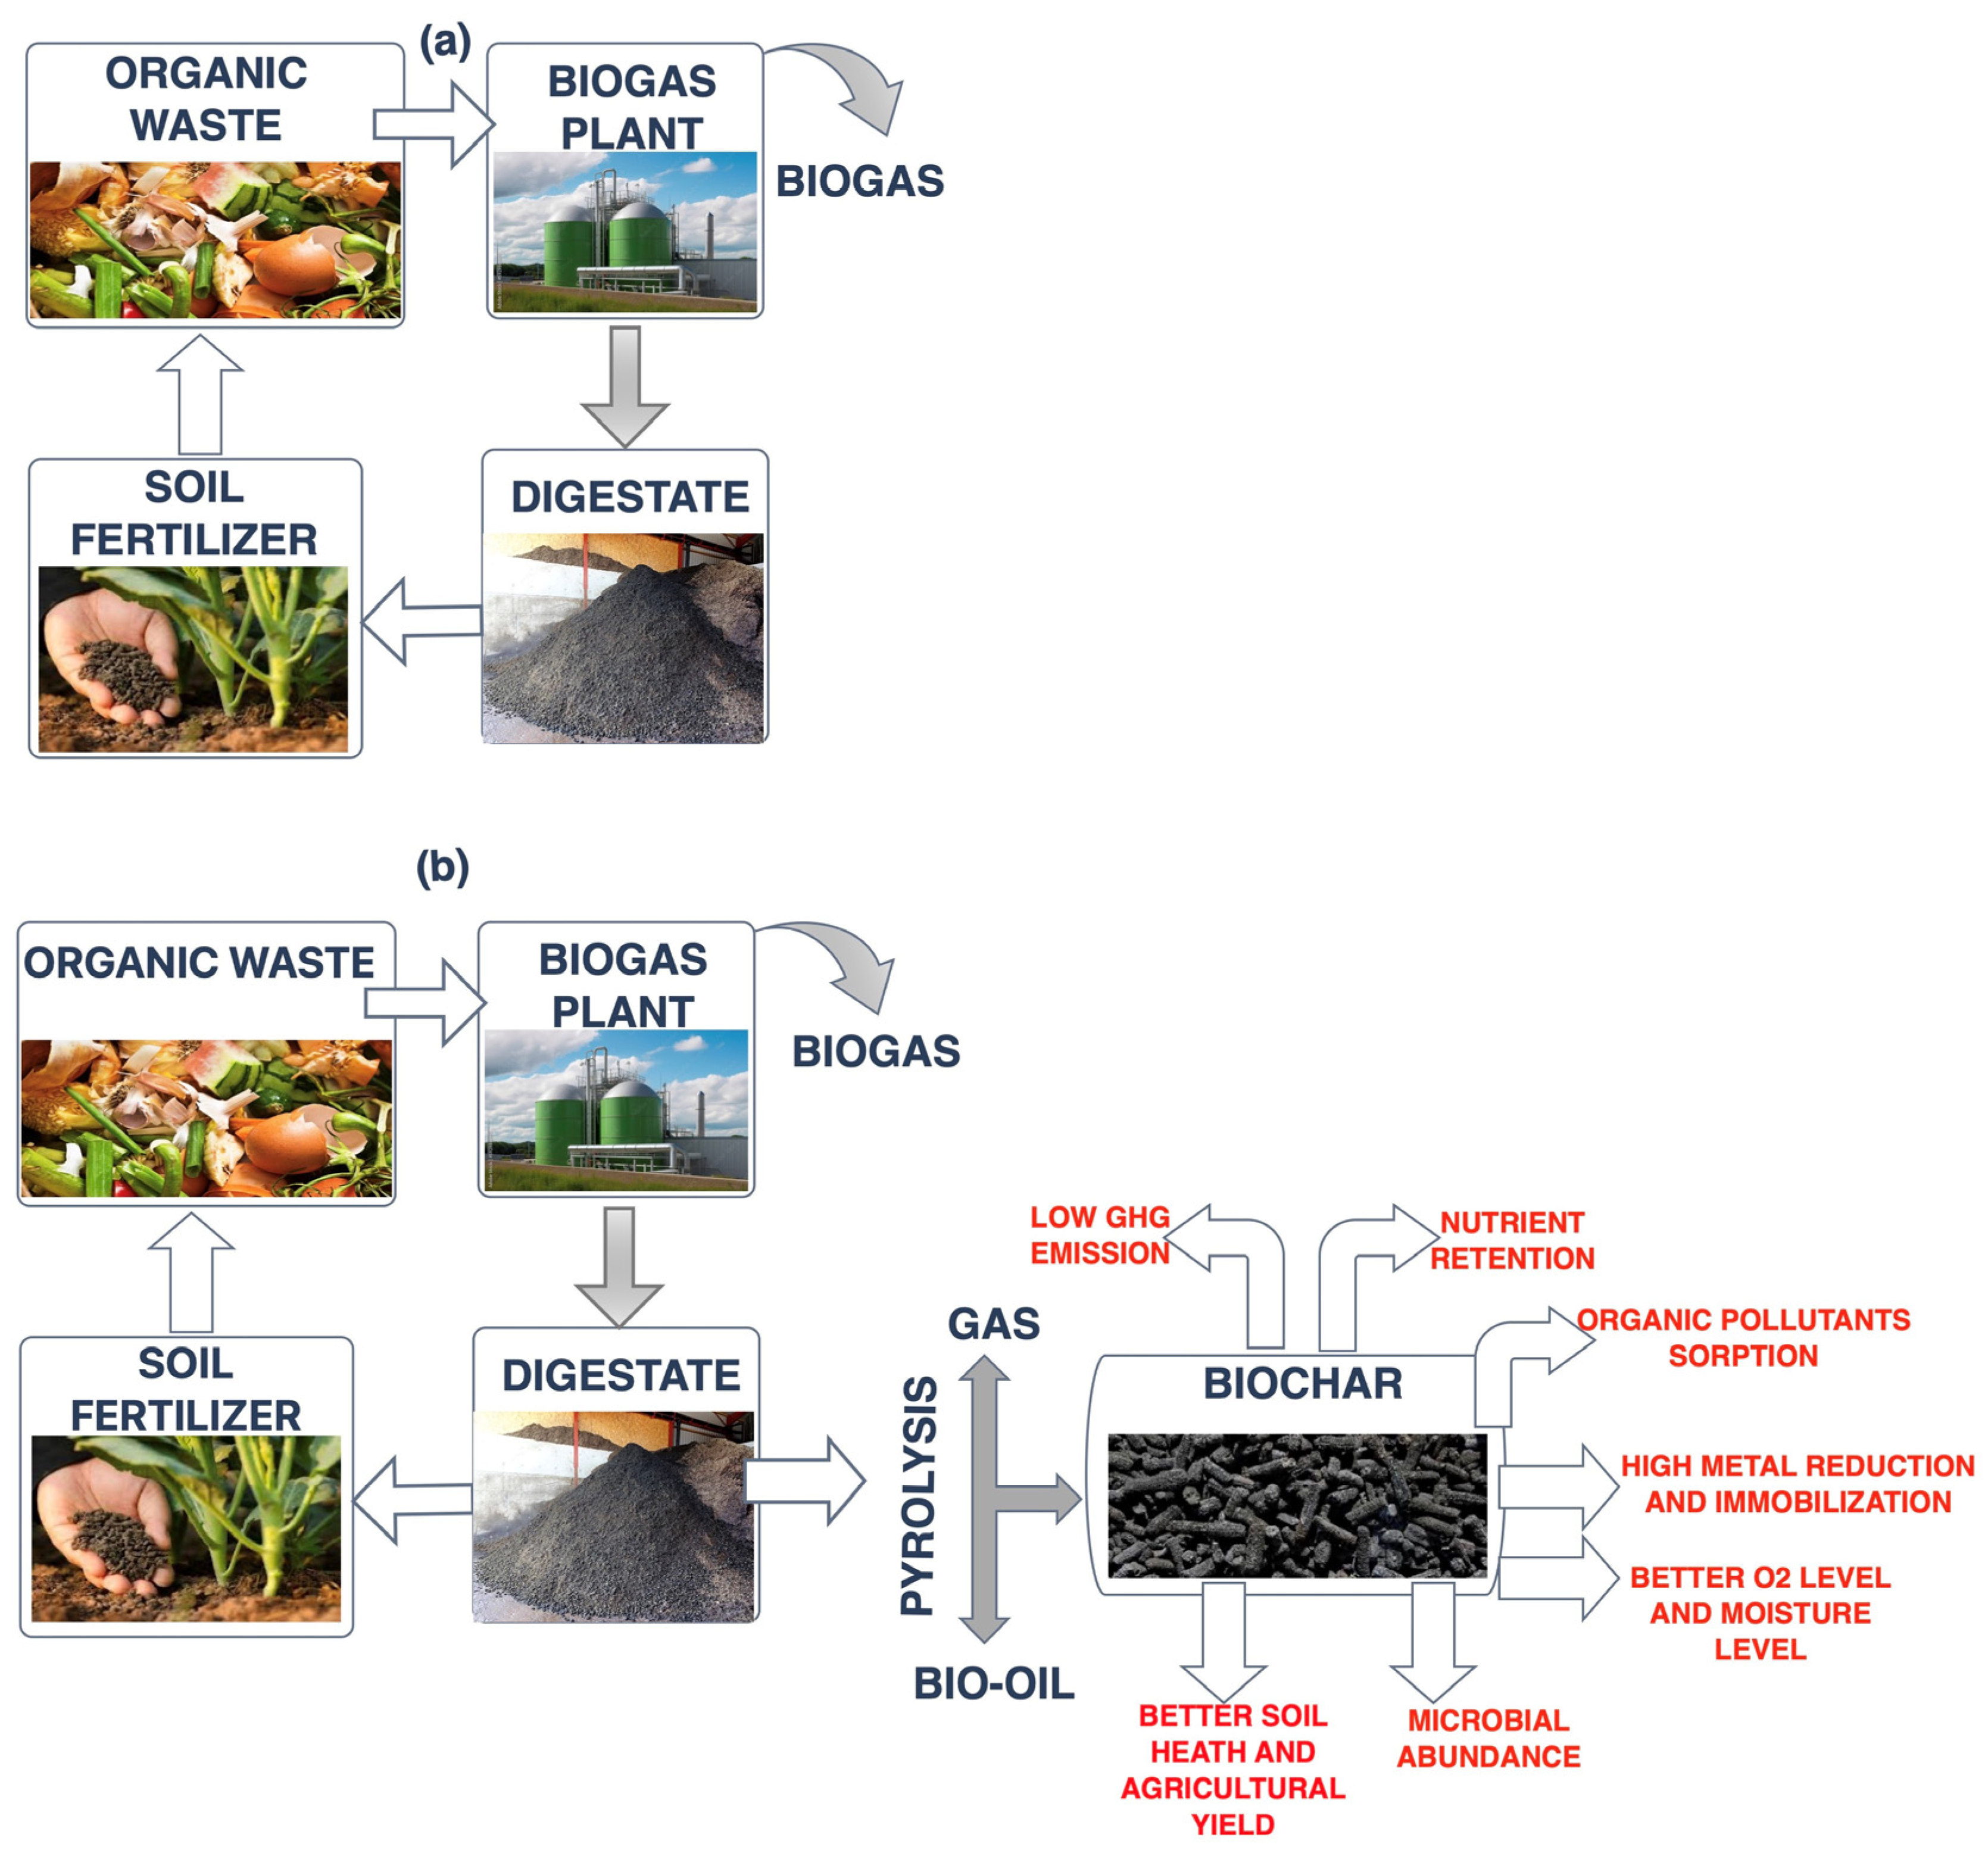
3.2. Physicochemical Characteristics of the Produced Biochar
The results of the physicochemical analysis of the substrates are shown in
Table 3.
The produced biochar had an alkaline pH between 11.40 ± 0.56 and 12.69 ± 0.18. Stefaniuk and Oleszczuk (2015) described a similar pH range for biochar made from digestate [
17]. The pH values of BSD biochar are significantly higher than those indicated for biochar produced at similar temperatures from other substrates [
84]. For example, the pH of biochar produced by [
72] from poultry litter at 560 °C was equal to 8, and had a significantly lower value than the pH of BSD
550. Similarly, in the case of biochar produced at 500 °C from poultry manure tested by [
83], the pH value was 10.5. When analyzing the pH value of BSD biochar, a trend was observed of an increase in this value with the increase in temperature of the pyrolysis process, also observed by other researchers [
83]. This trend is due, among other things, to an increase in ash content and carbonate formation.
The moisture content of the analyzed biochar did not exceed 1%, except in one case for which the moisture content was equal to 2.52%. This was probably due to a leak in the container where the biochar samples were stored.
The ash content of biochar ranged from 39.74 ± 1.20 to 57.43 ± 6.94%. The highest value was determined for BSD
900. A slightly lower ash content in the range of 14.12–43.56% was obtained in the study of biochar from digestate by [
17]. The ash content of BSD biochar was lower than that of biochar produced from sewage sludge [
82], but higher than in the case of biochar made from substrates of plant origin, which had a lower ash content [
39,
85]. In their research, Zielińska et al. (2015) determined the maximum ash content of biochar from sewage sludge at 79% [
82]. However, in biochar from poultry manure (i.e., also of fecal origin) produced at 600 °C, [
86] determined the ash content at a lower level of about 49.90%. Similar ash content was determined for biochar BSD
600 (49.74%). As indicated by [
86], the ash content of biochar can affect its sorption of organic impurities. That has been confirmed by the research of [
39]. Analysis of the ash content of BSD biochar has generally shown an upward trend with the increasing pyrolysis temperature. This effect is probably triggered by the increasing number of inorganic components and the residues of the combustion of organic matter [
84].
The results of the elementary analysis of biochar showed an N content between 1.01 ± 0.01% and 2.14 ± 0.03%. Pyrolysis carried out at a higher temperature resulted in a reduction in the nitrogen content in biochars, as observed by other researchers [
17,
48,
82,
85]. The decrease in N content was probably due to the loss of nitrogen compounds with an easily degradable structure. The hydrogen content of the analyzed biochar ranged from 0.68 ± 0.04% to 3.13 ± 0.02%. As the pyrolysis temperature increased, a decrease in the hydrogen content in biochars was also observed, probably caused by dehydration and loss of H atoms. A similar phenomenon was also observed by [
17,
48,
82]. The determined C content of biochar ranged from 42.39 ± 0.52%to 52.19 ± 1.16%. No clear downward or upward trend was observed when analyzing the C content of individual biochar variants. Similarly, it was observed in studies by [
57] in which the C content of biochar produced from biosolids (at temperatures of 450, 600, and 750 °C) did not differ significantly. The results presented by [
31] indicate an increase in C content as the temperature of the biochar production process increases. In studies, the C content of biochar produced at the highest temperature was determined at the lowest level. As Srinivasan et al. (2015) demonstrated by studying biochar of different origins produced at 680 °C, the C content of plant biochar was significantly higher than in biochar based on excrement [
63]. Similar observations were made by [
85]. The C content of BSD
650 was determined at approximately 52%, which is significantly lower than the results presented by [
63]. The sulfur content of the produced biochar varied greatly. The smallest content (0.45 ± 0.04%) was determined in biochar produced at 400 °C, while the highest (1.65 ± 0.27%) was in BSD
900 biochar
. However, there were no clear upward or downward trends between these extreme values.
The TOC content of all biochar variants, except BSD
900, exceeded 40%. The highest TOC content (48.5 ± 9.40%) was determined for BSD
650 and the lowest (35.9 ± 9.3%) for BSD
900. In comparison, the TOC content for hardwood biochar (pyrolysis temperature 580 °C) in studies by [
87] was at the level of 52.3% and for BSD
550 the content was set at 44.1 ± 11.5%. However, taking into consideration the requirements of the European Biochar Certificate [
88] for the organic carbon content of biochar used in agriculture, the organic carbon content should be >50% d.m. The low organic carbon content in analyzed biochar variants does not, however, exclude their other applications.
The value of the calculated H/C molar ratio of biochar showed a pronounced downward trend with the increase in temperature, as in the studies by Li and Chen (2018). The reduction of H/C indicates the increasing aromaticity of biochar [
86,
89]. Changes in the C and H content of biochar produced at different temperatures determine the value of the H/C ratio, which should not be greater than 0.7 as required by the [
88]. This value has been exceeded only for BSD
400 biochar
. However, for BSD
800 and BSD
900, the H/C ratio was close to 0.2, which may point to the transformation of aromatic structures into graphite structures [
48]. Biochar produced at 800 and 900 °C can show the potential for long-term carbon sequestration when added to the soil [
48].
The analysis of BET-specific surface values did not show a strongly developed specific surface area. The BET values were between 4.62 ± 0.19% and 47.90 ± 0.35%. For BSD
400, BSD
500, BSD
600, and BSD
700 biochar, the BET value did not exceed 10 m
2·g
−1 and varied for individual biochar variants, without the clear upward trends presented in other studies [
24,
69,
70]. The increase of the BET-specific surface values from 11.68 ± 0.38 m
2·g
−1 to 21.09 ± 0.43 m
2·g
−1 happened with an increase in the temperature of biochar production from 750 °C to 800 °C. This increase in BET surface was made even more apparent for BSD
850—the value of BET was then 47.90 ± 0.35 m
2·g
−1. With a further increase in the biochar production temperature to 900 °C, the BET value decreased to 20.39 ± 0.12 m
2·g
−1. Hung et al. (2017) [
14] and [
89,
90] observed similar dependencies. Biochar studied by these authors, obtained at 800 °C, had a significantly increased BET area (approx. 101.9 m
2/g) compared to biochar produced at 700 °C (6 m
2/g), which the authors explain by a combination of high aromaticity and mineral calcination, and mesoporous structure [
14]. As the pyrolysis temperature increased, the specific area of biochar increased, probably due to the decomposition of cellulose and hemicellulose and the formation of a channel structure [
39]. Raw material with a high lignin content has the potential to produce biochar with a large surface area and porosity [
31]. Therefore, high values of the specific surface are usually characteristic of biochars from plant biomass, while biochars from manure usually have smaller specific areas [
86]. However, a higher ash content can block the growth of the specific surface area and total porosity due to inhibition of the development of micropores when creating mesopores [
86]. These factors may have influenced the development of the specific surface area of BSD biochar.
Figure 2 shows the microstructure of the selected BSD biochar variants. The most porous structure is that of BSD
850, which confirms the determined value of the specific area.
The potential for the use of biochar in the process of sorption of various pollutants from the environment is determined by, among other things, the type of functional groups present on its surface [
91]. Therefore, biochar produced from SD was subjected to ATR–FTIR (Attenuated Total Reflectance Fourier Transform Infrared Spectroscopy) analysis to observe differences between products produced at different temperatures. The biochar selected for analysis included BSD
400, BSD
500, BSD
600, BSD
700, BSD
800, and BSD
900. The results of the analysis are shown in
Figure 3. Biochar produced at higher temperatures was characterized by fewer surface functional groups.
The FITR analysis of the studied biochar showed the presence of vibrations stretching the O–H bonds in BSD400 and BSD500 biochar, in the area ~3351–3173 cm−1. For biochar BSD600, BSD700, BSD800, BSD900 such vibrations were not found, which indicates the breakdown of volatile OH groups, loss of volatile substances and water, at temperatures of 600, 700, 800, 900 °C.
A signal assigned to the deformation modes of C–H groups, occurring in the area of 1470–1397 cm
−1, was observed by the FTIR spectra analysis of all tested biochar variants (in the area 1408–1400 cm
−1). The intensity of the peaks corresponding to these vibrations decreased with the increase in the temperature of biochar production, which may indicate the transformation of organic matter (lignin, cellulose, hemicellulose) and the release of volatile substances [
83].
Only in the case of BSD
400 biochar, the analysis revealed the presence of a group of bands assigned to the C–H bond stretching modes (in the area ~2929 cm
−1), present in aliphatic compounds. The absence of such vibrations in the FTIR spectra of other biochar variants may indicate the transformation of the groups in question into aromatic structures [
48] and a reduction in the biochar capacity for sorption of nutrients resulting from the presence of acidic functional groups [
50].
In the FTIR spectra of biochar BSD
400 and BSD
500, for wavelengths of 1575 cm
−1 and 1572 cm
−1, respectively, vibrations stretching the C=C bonds were determined. The absence of clear signals corresponding to these vibrations in the spectra of other biochar variations may be caused by the breakdown of multiple double C=C bonds at ≥600 °C and a decrease in the number of structures with C=C bonds in the biochar [
48].
C–O bonds stretching vibrations were observed on the FTIR spectra of all tested biochar variants in the range ~1104–1010 cm
−1. The presence of such signals may indicate the formation of aromatic ethers as a result of the inclusion of oxygen atoms in cyclic carbon structures [
92]. The presence of C–O groups can compensate for the low specific surface area of biochar and positively affect its sorption properties [
63]. The presence of oxygen-containing functional groups on the surface of the biochar is very desirable, mainly in terms of the use of biochar for metal immobilization. These groups are important in the creation of organometallic compounds that immobilize heavy metals in the soil (Pb (II), Cu (II), Ni (II), and Cd (II)) [
92,
93,
94].
An analysis of the FTIR spectra of all tested biochar variants showed the presence of vibrations bending the =C–H bonds, in the range ~874–817 cm
−1, which may indicate the presence of polycyclic aromatic structures [
29].
3.3. Methylene Blue Sorption Studies
The biochar dose used helped to achieve the level of removal of MB from the solution for all biochar variants above 80% (
Figure 4). Franciski et al. (2018), in their studies using activated biochar (with a specific surface area of 80 m
2g
−1) at a dose of 1 gL
−1, achieved an MB removal level of 70% [
40]. Hasnan et al. (2018), by studying the sorption capacity of biochar, obtained a percentage of MB removal from the solution equal to 99.45% [
95]. They used unmodified biochar, having a large specific surface area equal to approximately 200 m
2 g
−1 at a dose of 10 gL
−1, but with a lower concentration of MB in a solution of 10 ppm. By using the BSD
400 and BSD
450 biochar, approximately 97% of MB removal from the 50 mgL
−1 solution was achieved. For higher concentrations of 100 mgL
−1 and 200 mgL
−1, the effects achieved by using the biochar variants listed were poorer. Tang et al. (2019) showed that biochar produced at 450 °C from fermented sewage sludge is a promising adsorbent and can be used to remove ammonium from urban wastewater. The sorption potential of this biochar was probably due not only to the specific surface, but also to the presence of specific functional groups [
23].
The poorest effects in removing MB from all three solutions were achieved using biochar BSD
500, BSD
550, and BSD
600. The effect of removing MB from a solution with a concentration of 200 mgL
−1) for BSD
400, BSD
450, BSD
500, BSD
550, and BSD
600, was at <91%. Using biochar BSD
650, BSD
700, BSD
750, BSD
800, BSD
850, and BSD
900 demonstrated significantly better MB removal. This is confirmed by studies of [
81], who established the usefulness of biochar produced at temperatures of 600–900 °C in the adsorption of heavy metals. MB as a cationic dye is a good indicator of the ability to remove heavy metal cations [
55]. In addition, by analyzing the results obtained for BSD
650, BSD
700, BSD
750, BSD
800, BSD
850, and BSD
900, there was a trend of an increase in the percentage of MB removal from solutions using biochar produced at increasingly higher temperatures. A maximum removal value of MB of 99% was obtained for the BSD
900 biochar.
As demonstrated by [
60] in the mechanism of MB sorption on biochar, an important role is performed by the complexing of the surface in which functional groups -OH, -COOH, -CO, and -CH participate. In our experiment, the presence of -OH groups found in BSD
400 and BSD
500 may have had a positive effect on MB sorption. The absence of vibrations stretching the -CH bonds found for biochar produced at ≥ 500 °C may result in a decrease in the sorption capacity of biochar produced at these temperatures. The increase in sorption capacity for BSD
800, BSD
850, and BSD
900 may be due to a larger specific surface area determined for the biochar variants listed compared to the others. The highest specific surface value determined for BSD
850 did not translate into a maximum removal value of MB from the solution for this biochar. The relatively high percentage of MB removal for all biochar variants with a relatively low specific surface area may be due to the behavior of C–O groups, which compensate for the low specific surface area of biochar and positively affect its sorption properties.
In the initial stage of the statistical analysis, the distributions of the quantitative variable of the percentage of methylene blue removal were checked. For this purpose, basic descriptive statistics were calculated together with the Shapiro–Wilk test, which examines the normality of the distribution. The Shapiro–Wilk test was statistically significant (
Table 4). This means that the distribution of the test variable differs significantly from the normal distribution. It should be noted, however, that the skewness does not exceed the conventional absolute value of 2, so the distribution is asymmetric to a negligible extent [
96]. Therefore, if the other assumptions were met, parametric tests were performed.
An analysis of the Spearman’s rank correlation was carried out to investigate the relationship between the temperature of biochar production and the percentage of methylene blue removal. The calculations were carried out on the basis of individual concentration values as well as for all the samples tested together. Analysis of the Spearman’s rank correlation, without division based on the concentrations of solutions, between temperature and percentage of methylene blue removal, was statistically significant, positive, and strong. This means that a higher biochar production temperature coexists with a higher percentage of methylene blue removal from the solution. Spearman’s rank correlation analysis, taking into consideration the types of concentrations of solutions, revealed statistically significant positive and very strong relationships between temperature and methylene blue removal percentages from solutions with concentrations of 100 mgL
−1 and 200 mgL
−1. The analysis did not reveal a relationship between the variables in the case of a solution with a concentration of 50 mgL
−1. This result means that a higher biochar production temperature is coexisting with a higher percentage of methyl blue removal in the group of solutions with the concentrations of 100 and 200 mgL
−1, but this relationship does not occur for a group of solutions with a concentration of 50 mgL
−1. The results of the analyses carried out are presented in
Table 5.
Using a single-factor variance analysis, it was verified whether the percentage of methylene blue removal was statistically significantly differentiated in terms of solution concentrations. The result of the ANOVA was statistically significant, and the force of the effect was revealed as weak (
Table 6). The post hoc test was statistically significant in two pairs of variables, between 100 mgL
−1 and 50 mgL
−1 and 100 mgL
−1 and 200 mgL
−1; the analysis did not show a statistically significant difference between 50 mgL
−1 and 200 mgL
−1. The percentage of removal of methylene blue from the solution was higher at 50 mgL
−1 and 200 mgL
−1 compared to the concentration of 100 mgL
−1 (
Figure 5). However, no differences were observed between 50 mgL
−1 and 200 mgL
−1.


