Abstract
Rapid market change is one of the reasons for accelerating a technology lifecycle. Enterprises have socialized, externalized, combined, and internalized knowledge for their survival. However, the current era requires ambidextrous innovation through the diffusion of knowledge from enterprises. Accordingly, enterprises have discovered sustainable resources and increased market value through collaborations with research institutions and universities. Such collaborative activities effectively improve enterprise innovation, economic growth, and national competence. However, as such collaborations are conducted continuously and iteratively, their effect has gradually weakened. Therefore, we focus on exploring potential R&D collaboration partners through patents co-owned by enterprises, research institutions, and universities. The business pattern of co-applicants is extracted through a patent graph, and potential R&D collaboration partners are unearthed. In this paper, we propose a method of converting a co-applicant-based graph into a vector using representation learning. Our purpose is to explore potential R&D collaboration partners from the similarity between vectors. Compared to other methods, the proposed method contributes to discovering potential R&D collaboration partners based on organizational features. The following questions are considered in order to discover potential R&D partners in collaborative activities: Can information about co-applicants of patents satisfactorily explain R&D collaboration? Conversely, can potential R&D collaboration partners be discovered from co-applicants? To answer these questions, we conducted experiments using autonomous-driving-related patents. We verified that our proposed method can explore potential R&D collaboration partners with high accuracy through experiments.
1. Introduction
In the increasingly complicated global technology market, enterprises need to consider research and development (R&D) strategies for ambidextrous innovation to survive. Burnett and Williams (2014) insisted that enterprises should be prepared for innovation acceleration owing to rapid technological change [1]. Similarly, Danneels (2007), Hung and Chou (2013), and Obradović et al. (2021) stressed the need for strategies to rapidly discover novel collaboration opportunities as technology lifecycles are becoming shorter [2,3,4].
Nonaka (1994) mentioned that knowledge conversion occurred through a continuous dialog between explicit and implicit aspects of knowledge owned by enterprises [5]. He especially stressed that the knowledge of an enterprise is combined, transferred, and created through socialization, externalization, combination, and internalization. Accordingly, enterprises need to determine how to diffuse their tacit knowledge to external entities in the current era.
Brown and Eisenhardt (1997) emphasized that a cornerstone change, such as in the culture of the enterprise, was needed for a successful business [6]. Dyer and Singh (1998) mentioned that inter-organizational combinations such as enterprises, research institutions, and universities played an important role in diffusing knowledge [7]. Thus, enterprises are expected to input sustainable resources for collaborative R&D and acquire larger market value through cooperation [8,9,10]. Thus, the discovery of potential R&D collaboration partners is directly related to the survival of various organizations.
Chen and Kenney (2007), Yang et al. (2010), Gao et al. (2011), and Temel and Glassman (2013) agreed with the opinion that R&D collaborations were effective at achieving efficient innovation and improving the innovation competence of nations by promoting economic growth [11,12,13,14]. Many organizations also agree with their opinions and exchange human, financial, and technical activities to promote a win–win idea. Organizations are promoting proactive university–industry collaboration (UIC) and academia–industry collaboration (AIC) for their survival. They exchange material and technical resources consumed in R&D through UIC and AIC, saving time and cost. However, Gulati (1995) and Capaldo (2007) pointed out that although long-term collaboration between the same partners may reduce the cost of development of innovation, an excessively iterative frequency may cause negative effects [15,16].
Durmuşoğlu and Durmuşoğlu (2022) argued that patents can be used to discover opportunities for technological innovation in various fields, from traffic systems to healthcare [17,18]. Zhang et al. (2017) defined a patent as a concept that implies evidence of technological innovation [19]. Conventional studies use co-patents to discover potential R&D collaboration partners. This is because co-patents, which are jointly owned by two or more organizations, are collaborative outcomes [20,21]. In particular, co-applicants who share the ownership of co-patents may exercise technological potential in the market through R&D collaboration. Furthermore, Briggs (2015) discovered that patents whose co-applicant was an AIC had larger influence in exercising the potential than other patents [22].
Researchers have considered the diffusion of implicit knowledge for knowledge transfer, combination, and creation in the accelerating global market. The discovery of potential R&D collaboration partners through collaboration between organizations is the solution that researchers found. However, the effect has been gradually weakened because of continuous and iterative behaviors. Consequently, a novel approach is now needed to discover potential R&D collaboration partners. We focus on discovering potential R&D collaboration partners with patents owned by co-applicants such as enterprises, research institutions, and universities. The purpose of this study is to view co-applicants from the knowledge graph viewpoint and discover potential R&D collaboration partners from the pattern. To this end, we will (i) extract co-applicants from patents, (ii) convert them into knowledge graphs, (iii) embed co-applicants into a vector space, and (iv) identify potential R&D collaboration partners through similarity-based relevance algorithms.
Our contributions are as follows:
- A patent owned by co-applicants is a piece of work by collaboration. Thus, co-applicants are organizations that actively use the current business opportunities. Accordingly, this paper aims to explore the future of collaborative R&D by finding a pattern between co-applicants from a knowledge graph.
- A knowledge graph is an excellent tool that can express a complex relationship between numerous objects. Therefore, a knowledge graph is well-suited to identifying the collaboration history of co-applicants such as enterprises, research institutions, and universities. Furthermore, we aim to identify potential R&D collaboration partners by converting the co-applicants in the graph to a vector and measuring the collaborative similarity.
- In this study, the relevance algorithm that measures the collaborative similarity of co-applicants is free from specific assumptions. Therefore, the proposed method can be used regardless of the technical field and organization type.
Therefore, we ask the following questions to discover potential R&D collaboration partners in collaborative R&D: Can information about co-applicants of patents explain business opportunities? If so, can potential R&D collaboration partners be discovered from co-applicants? In order to answer these research questions, the rest of the paper is structured as follows. Section 2 reviews previous studies to discover business opportunities. Section 3 explains the preliminary theory and the methodology in detail. Section 4 presents the empirical evidence for the research question. Finally, Section 5 discusses the implications of the proposed methodology, its limitations, and future research directions to overcome them.
2. Literature Review
Internal and external collaboration R&D supports various business activities of organizations. Therefore, a novel methodology for the discovery of potential R&D collaboration partners should efficiently manage and analyze the information of organizations. In this section, previous studies on the discovery of business opportunities and measures to alleviate the limitations are reviewed.
2.1. Related Works
Kim and Inkpen (2005) and Santamaría et al. (2021) stressed the need to consider the organization’s nationality for future collaboration [23,24]. A patent map is effective in discovering business opportunities by visualizing various features of technologies. Yoon et al. (2002) and Kim et al. (2008) provided effective patent maps by clustering patents to explore business partners [25,26]. Furthermore, Lee et al. (2009) and Yoon et al. (2013) extracted various variables of patents by reducing the patent data dimension to increase the effect of the patent map [27,28]. Lee and Lee (2019) proposed a patent map that can visualize a trend of technology to identify business opportunities [29].
Yoon et al. (2015) proposed a functional framework that can discover novel opportunities from developed technologies [30]. They asserted that technology and collaborative R&D modeling were effective when discovering business opportunities. Faccin and Balestrin (2018) mentioned that as collaborative R&D changed and began depending on strategy, stock, and type of knowledge creation, a model that can explain this was needed [31]. Messeni Petruzzelli and Murgia (2020) explored the factors that can explain knowledge transfer according to the stock and type of organization [32]. Furthermore, Murgia (2021) proved that collaboration heterogeneity was affected by nationality and institutional diversity [33].
Existing studies considered the geographical distance of organizations to discover business opportunities. Maggioni and Uberti (2009), Burhop and Wolf (2013), and Drivas and Economidou (2015) analyzed the influence of geographical distance on knowledge innovation [34,35,36]. They discovered that specific organizations contributed to the diffusion of knowledge, and their influence was considerable. Capaldo and Petruzzelli (2014) mentioned that the closer the geographical distance, the larger the positive effect on collaborative R&D when selecting a business partner [37].
Golosovsky and Solomon (2017) and Ardito et al. (2018) emphasized that a knowledge graph was a suitable tool to not only explore the internal structure beyond co-patents but also measure the importance of collaborative innovation [38,39]. Centrality is a simple and effective approach for discovering potential R&D collaboration partners from knowledge graphs. Goetze (2010) attempted the extraction of major organizations from knowledge graphs for human resource management in R&D [40]. In addition, knowledge graphs using patents are also used to discover major nations and inventors in a specific technology field [41].
In recent years, studies on the use of patent texts or technology classification codes have been conducted to discover business opportunities. Lee et al. (2022) discovered novel technology-based enterprises and opportunities with technologies classified through text mining [42]. Seo (2022) developed a method using topic-based knowledge graphs and association rule mining by analyzing patent texts to explore business opportunities [43]. In addition, Wu et al. (2023) designed a multilayer network based on the international patent classification (IPC) code [44].
We reviewed previous studies and found that patent-based knowledge graphs were effective in discovering business opportunities beyond technologies. However, previous studies have some limitations. First, they could be used to visualize a relationship between technology and organization using patent maps, but the discovery of business opportunities could not properly reflect the features of organizations. Second, the functional-based framework could be used to explore factors from existing business opportunities, but it has many difficulties in discovering potential opportunities. Third, geographical distance-based approaches may be unsuitable in a worldwide pandemic situation. This was because organizations conducted collaborative R&D in this era regardless of their environment or location. Finally, knowledge graphs using patent topics or IPC codes are dependent on the main keywords of technology. Thus, this study proposes a method that uses embedding of the co-applicant graph and similarity-based relevance algorithms to improve the limitations of previous studies.
2.2. Node Embedding
This paper proposes a representation-learning-based methodology to extract features of nodes (or vertices) and links (or edges) that make up a knowledge graph. A graph is suitable for expressing ever-increasing data and a complex relationship that connects data. The graph is defined as , where denotes the set of nodes and denotes the edge set.
The graph is a method to express data using nodes and links. Graphs in existing studies have been analyzed through approaches such as the number of edges connected to a node. In recent years, representation learning of unstructured data such as images or texts has advanced. Following this trend, several studies have proposed representation learning that can be applied to graphs. Perozzi et al. (2014) argued that a graph connected by nodes was similar to the pattern of words that make up a sentence [45]. They applied a sequence of nodes extracted from a graph to SkipGram. SkipGram, which is one of the typical language models, embeds natural language into a vector space by maintaining the co-occurrence probability of words [46,47,48].
Let us assume a sequence of words having length as . SkipGram learns to have the maximum co-occurrence probability with neighboring words to obtain features of the center word . The objective function of SkipGram is presented in Equation (1).
where is the size of the context.
DeepWalk searches for a pattern from a sequence of nodes through SkipGram [45]. First, DeepWalk uses a transition probability based on a random walk to extract a sequence of nodes from the graph . When a random walk whose length is is extracted from the source node , the selection probability of the -th node can be calculated using the following equation.
where and refer to the -th and -th selected nodes, and . refers to the unnormalized probability when , and , the sum of , refers to the normalizing constant.
Grover and Leskovec (2016) proposed the second-order random walk that can extract local and global information from graphs through the search bias [49]. Their proposed approach, Node2Vec, employed a weighted transition probability. The transition probability weight used in Node2Vec is presented in Equation (3):
where and refer to the return parameter of the likelihood of immediately revisiting a node in the walk and the in–out parameter of differentiating between inward and outward nodes, respectively. denotes the length of the shortest path between and .
DeepWalk and Node2Vec embed node in the dimension through SkipGram. The vectorized graph node is used in various application fields such as technology forecasting, financial fraud detection, and analysis of user behavior in addition to document clustering and community detection [50,51,52,53,54].
2.3. Link Prediction
A link in a knowledge graph explains the relationship between nodes. A graph is classified into unweighted and weighted graphs according to the feature of the link. An unweighted graph refers to a graph expressed as 1 when a link connecting two nodes exists and 0 otherwise. A distance matrix is a typical example of a weighted graph. That is, the distance between two nodes is expressed by the weight of the link.
Let us assume that is in graph and the label of the edge between two nodes is . For example, in an unweighted graph, it is . Link prediction can be used to forecast a relationship between future nodes. Conventionally, a heuristic score was used to predict a link between nodes and .
Let be the neighborhood of node . Common neighbors predict a link based on the number of neighborhood intersections between two nodes. Jaccard’s coefficient uses the intersection and union of the neighborhood of two nodes [55]. Jaccard’s coefficient is presented in the following equation.
where denotes the union of the neighborhood of and .
The Adamic–Adar score employs a subset of the intersection of the neighborhood of two nodes [56]. The Adamic–Adar score is presented in the following equation.
where refers to the element in the subset of the neighborhood of and .
Let be the function that maps edge to dimension . Then, the predictive model for link prediction is presented in the following equation.
where denotes the loss function of predictive model .
3. Discovering Collaboration Partners
This study aims to explore potential co-applicants to discover new business opportunities. The proposed method employs a knowledge graph that reflects the information of the patent’s co-applicants. Now, let be the set of applicants of the -th patent . The knowledge graph of the co-applicant is defined as , where denotes the set of and denotes the applicant–applicant edge set. In graph , and are the number of nodes and edges, respectively. We introduce a methodology that embeds applicants and co-applicants through .
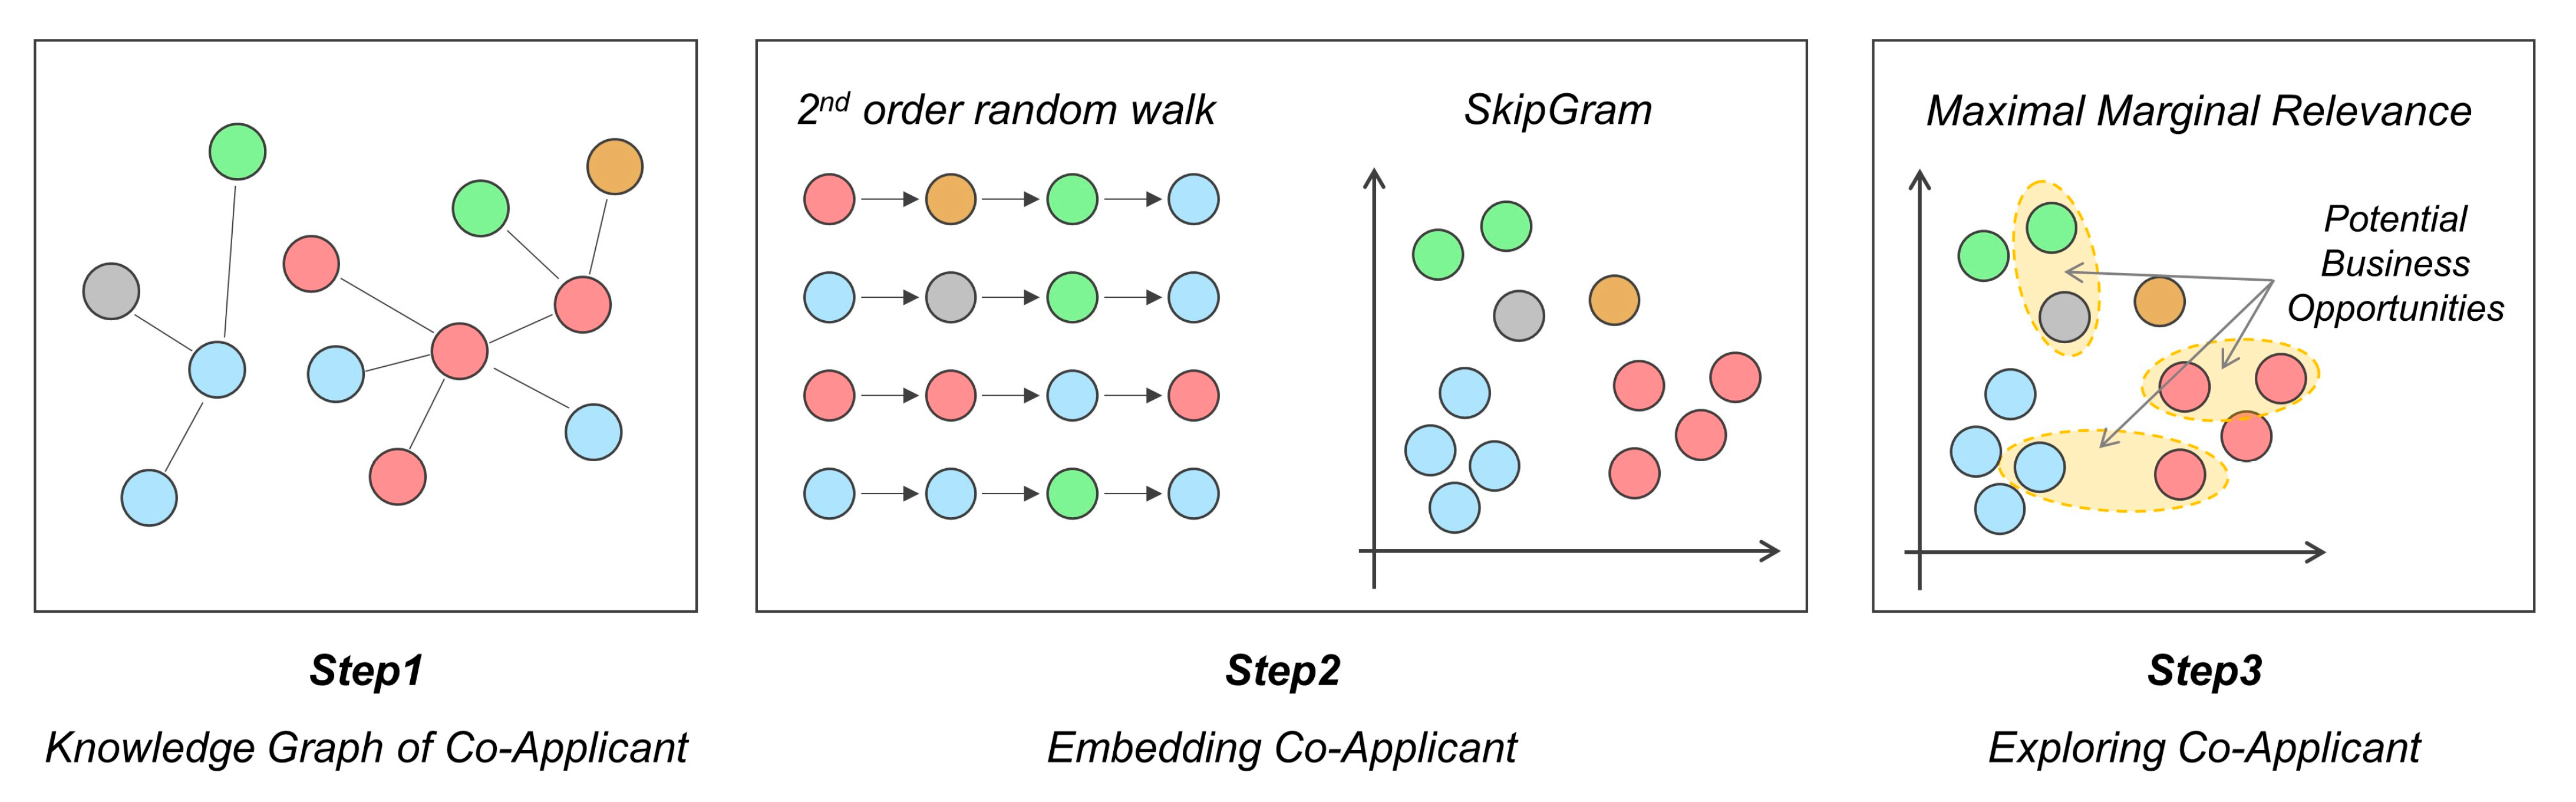
Figure 1 shows a flowchart of the methodology for discovering business opportunities. First of all, the co-applicant is extracted from a patent, which is a scientific document. The co-applicant transforms into a knowledge graph . Next, a sequence of applicants is extracted from the knowledge graph of co-applicants. SkipGram learns the relationship between nodes from the sequence of applicants and converts them into vectors. Finally, MMR discovers potential R&D collaboration partners in the vector space. The remaining subsections describe the proposed method in detail.

Figure 1.
Flowchart of proposed method.
3.1. Preliminary Theory
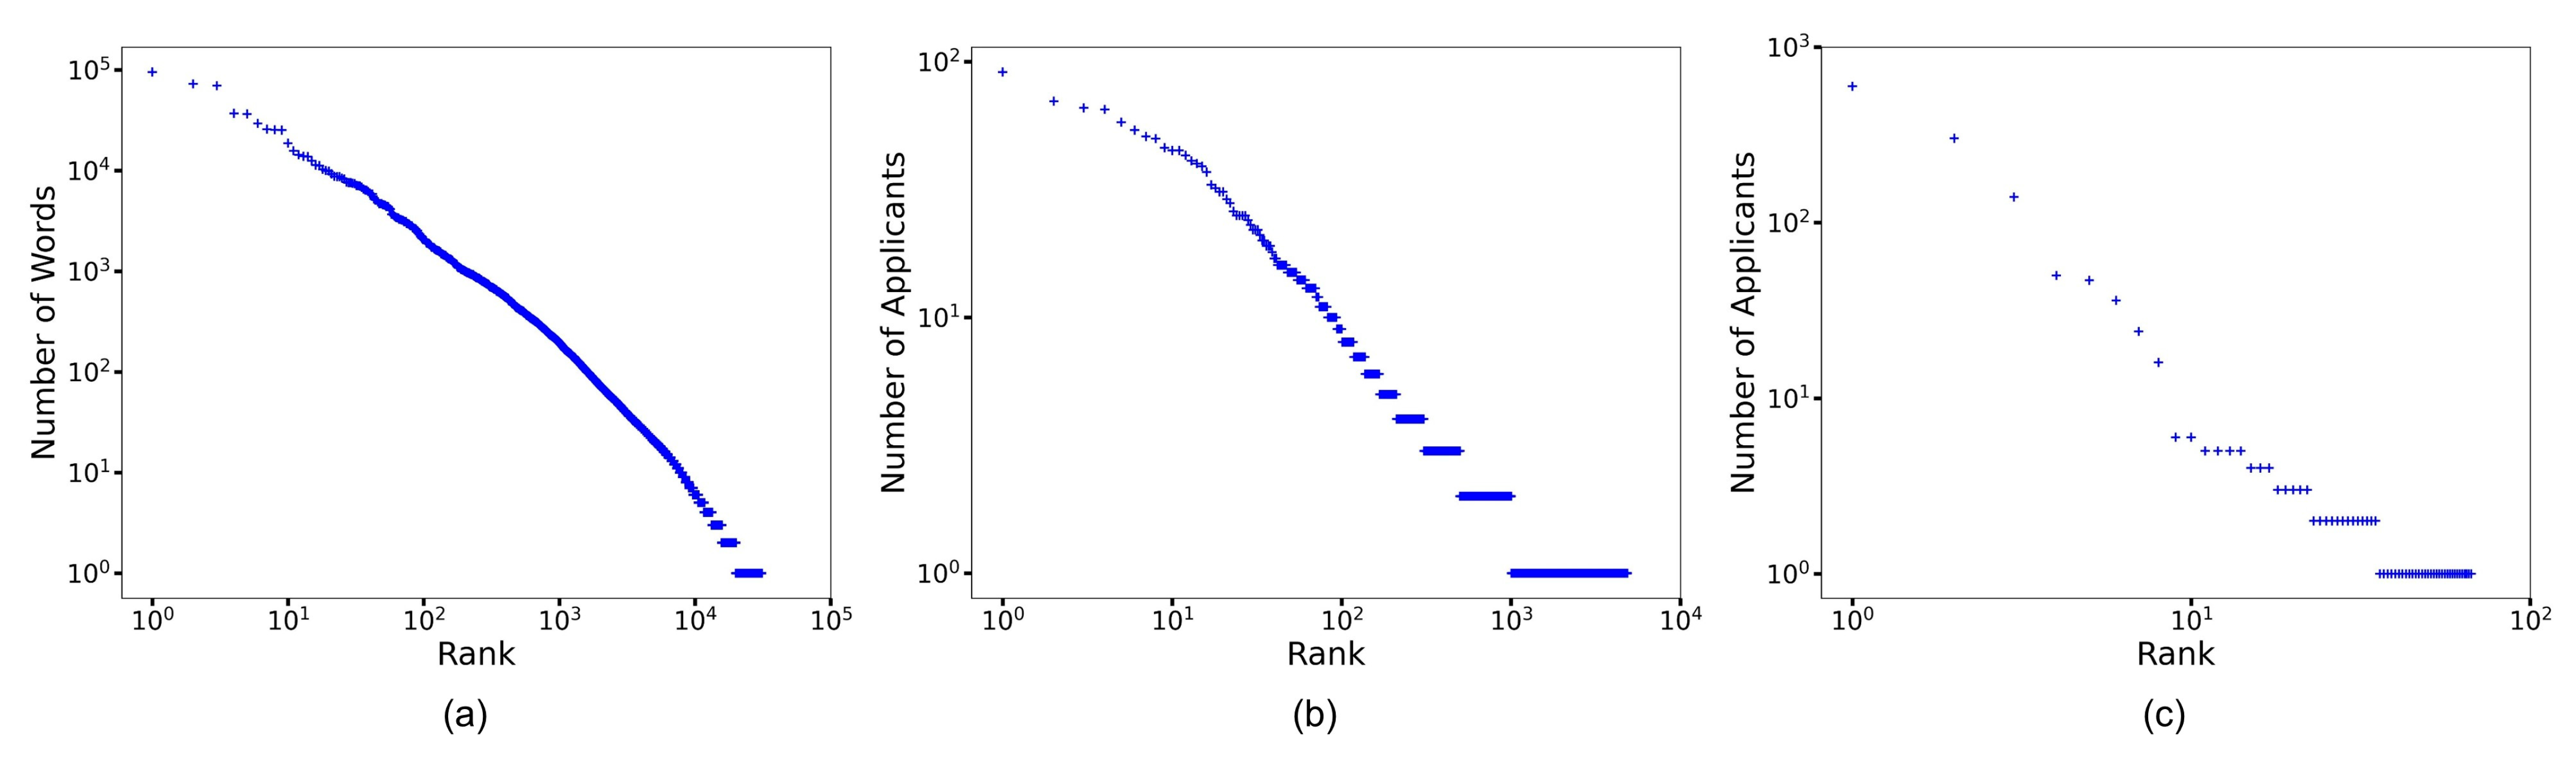
Let , like SkipGram or Node2Vec, be a function that maps words in a sentence or nodes in a network to the -dimension, where . Perozzi et al. (2014) discovered that nodes in a network followed a power-law distribution (or Zipf’s law) like natural language [45]. Figure 2a shows the power-law distribution of the Reuters newswire dataset. Thus, we determined whether patent applicants follow a power-law distribution for the embedding of applicants.

Figure 2.
Power-law distribution of natural language and patent applicant. (a) Power law distribution of the Reuters Newswire dataset. (b) Power law distribution of patent applicants filed with the U.S. Patent and Trademark Office from March 15, 2001, to December 8, 2022. (c) Power law distribution of applicants for the 873 patents used in the experiment. And the blue "+" shaped point represents each data object.
Figure 2b shows the power-law distribution of applicants of patents that were filed from 15 March 2001 to 8 December 2022, in the United States Patent and Trademark Office [57]. The distribution of the applicants was similar to that of natural language. Therefore, we approach the embedding of co-applicants based on this empirical evidence. Figure 2c is the power-law distribution of applicants for 873 patents in relation to autonomous driving used in the experiment in this paper. It can be seen that the data we collected are similar to the distributions in Figure 2a,b. In Section 4, Figure 2c will be explained in detail.
3.2. Embedding Collaboration Partners
This paper proposes a methodology based on co-applicants to discover new business opportunities. The co-applicants of patents can be divided into academia (university, institution) and industry (enterprise). The purposes of the proposed method are: (i) extracting latent features of co-applicants and (ii) exploring new business partners. The proposed method broadly involves three steps.
A graph can express co-applicants of patents. In the co-applicant graph , the neighborhoods of node are likely to be co-applicants. Thus, our approach samples and ‘s neighbors, , to maintain relationships with co-applicants. Mapping function is also learned to make and sampled neighborhood of closer in the low dimension. Equation (7) is the objective function of co-applicant embedding.
The mapping function returns the vector of the applicant. However, we need the co-applicant vector to discover potential business partners. Now, let and be the co-applicants of . That is, for and satisfying , and are -dimensional vectors. The vector of the co-applicant for node (applicant) and is presented in Equation (8).
where .
Table 1 presents Average, Hadamard, Weighted-L1, and Weighted-L2, which are typical operators of [49]. In operator, refers to the -th element of -dimension vector . Average and Hadamard operators return the element-wise addition and production of two vectors, respectively. Furthermore, Weighted-L1 and L2 operators return element-wise L1-norm and L2-norm.

Table 1.
List of operators for embedding collaboration partners.
3.3. Exploring Collaboration Partners
The first step of the proposed method is to build a knowledge graph using co-applicants. The second step is to convert the co-applicant in the knowledge graph to a vector. Finally, the third step is to discover potential R&D collaboration partners from the co-applicant, which is converted from the vector. To achieve the goal of the third step, we use similarity-based relevance algorithms.
Carbonell and Goldstein (1998) and Bennani-Smires et al. (2018) proposed maximal marginal relevance (MMR) to prevent the combination of duplicate keywords in information retrieval [58,59]. MMR has been used in various domains because it can select keywords by reflecting semantic similarity. MMR, which is applied in this study to discover novel co-applicants, is presented in Equation (9).
For the edge set in the graph , refers to a subset of candidate co-applicants. Then, MMR returns , which is similar to that of and different from that of already selected . In the equation, , which has a value from 0 to 1, is a parameter that controls selection diversity. The closer the gamma is to 1, the better MMR helps select diverse co-applicants. is a function to measure the similarity of two vectors. When cosine similarity is used, of and is as presented in Equation (10).
where refers to the -th element of .
The reasons for the suitability of the MMR-based search to achieve the goal of the proposed method are as follows: First, MMR does not require statistical assumptions. This is because MMR is run with simple operations in the vector space. Second, the maximum value of similar objects that can be selected by MMR is , which is very large. Thus, researchers can determine the number of objects that can be searched depending on the purpose of the analysis. Finally, MMR can discover new co-applicants, which are different from existing patterns. Simply put, if objects are selected in the most similar order, expected co-applicants can be extracted.
We define the novel links (co-applicants) selected by MMR as potential R&D collaboration partners. The reasons for this are as follows: First, it is highly likely that the co-applicant selected by MMR is not an existing business partner. Second, the vector of the co-applicant is selected from the node embedding. That is, the vector of co-applicants reflects the collaborative business relationship between patent applicants. Finally, we discovered empirical evidence that patent applicants follow a power-law distribution, which was the same as words in a sentence and nodes in a graph. This is an answer that clearly demonstrates the complex principles required for the applicant to show suitability for node embedding and link prediction.
4. Experimental Results
The purpose of this study is to explore latent co-applicants to discover potential R&D collaboration partners. To do this, we proposed a method where node embedding and MMR were applied to the co-applicant graph. Our experiment was conducted in the following order: data collection, co-applicant embedding, and exploring potential co-applicants. All visualizations of the graphs in the experiment are the results processed by Gephi software (version 0.9.7, accessed on 15 May 2023: https://gephi.org).
4.1. Experimental Setup
For this experiment, we collected 873 patents in relation to autonomous driving. Autonomous driving is one of the technologies that have attracted considerable attention from many nations and enterprises. Thus, we collected patents about autonomous driving technology, which were filed in China, Europe, Japan, South Korea, and the United States of America. Figure 2c shows the distribution of autonomous-driving-related patents. We determined that because applicants of autonomous driving technology followed a power-law distribution, applying the proposed method was suitable.
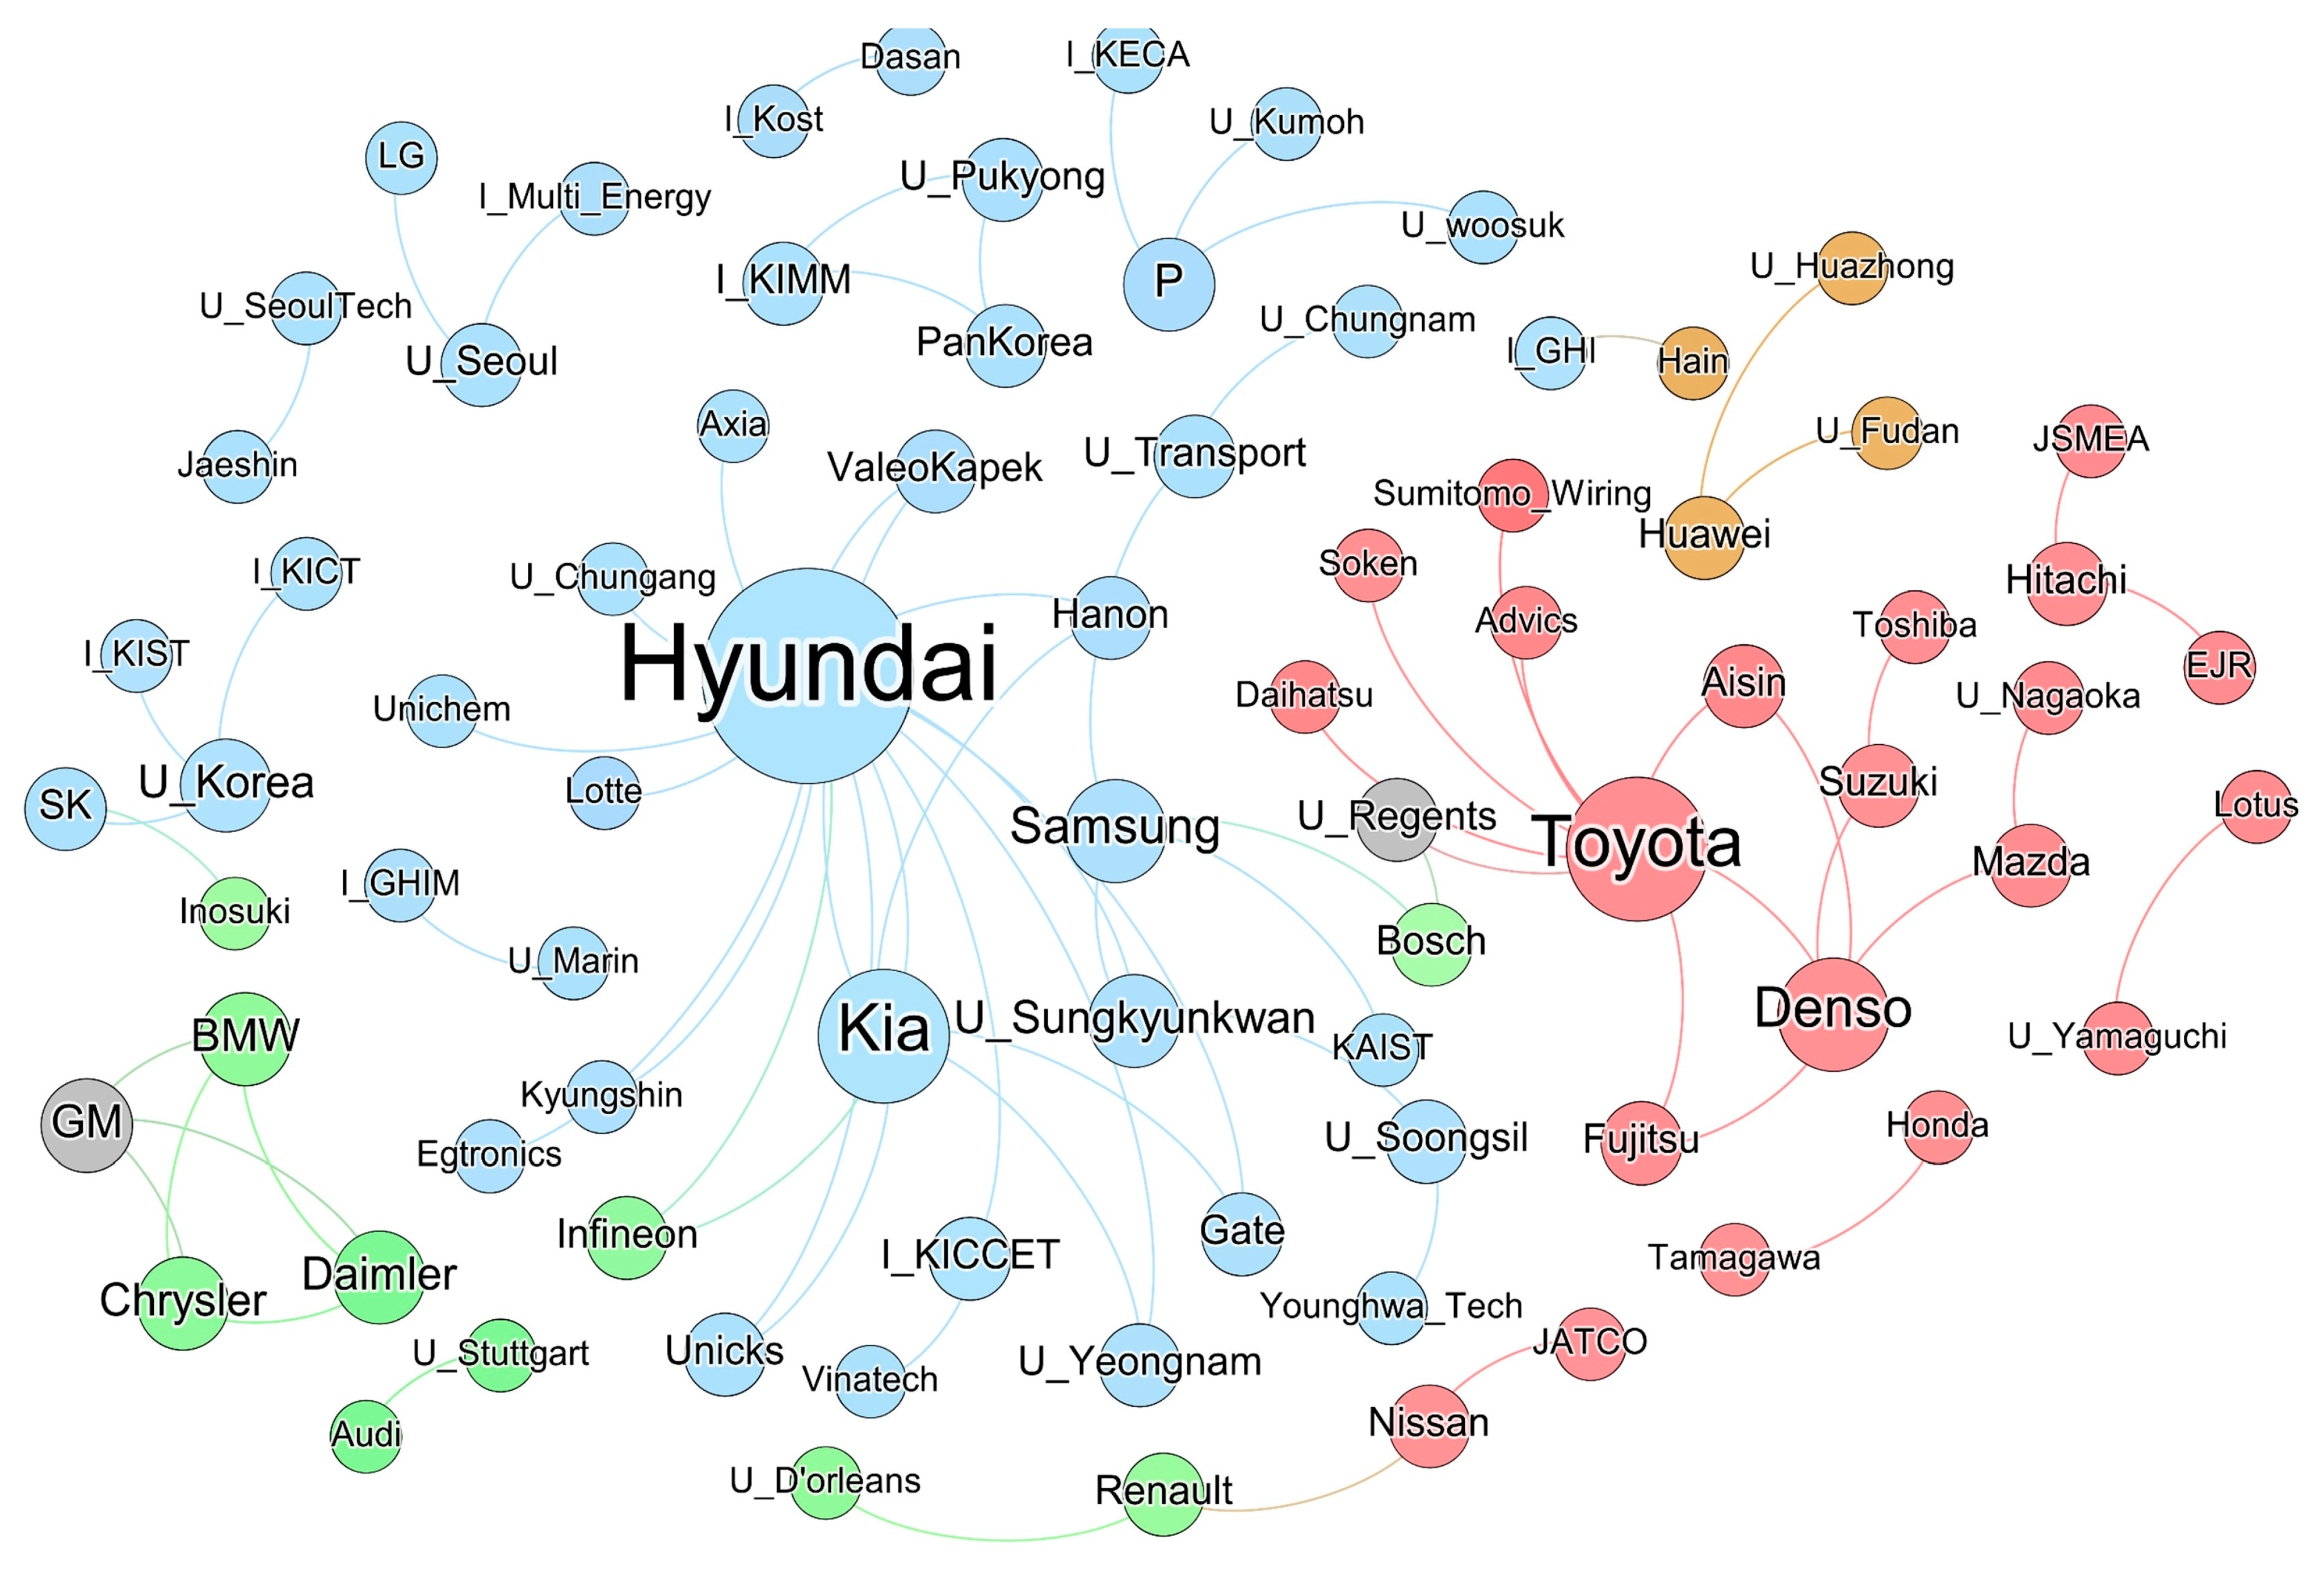
Figure 3 shows the co-applicant graph of the collected dataset. The size of the node denotes the number of connected links. The color of the node indicates the country in which the paper was filed. Orange represents China, green represents Europe, red represents Japan, blue represents South Korea, and gray represents the United States of America. The original names of the applicants indicated in the nodes are summarized in Table A1 in Appendix A. In the applicant abbreviation, “I_” and “U_” are prefixes referring to the research institution and university, respectively.

Figure 3.
Applicant graph of autonomous-driving-related patents. The color of the node indicates the country in which the paper was filed. Orange represents China, green represents Europe, red represents Japan, blue represents South Korea, and gray represents the United States of America.
4.2. Embedding Collaboration Partners
Co-applicant embedding was conducted using Node2Vec in the experiment. Table 2 summarizes the detailed hyperparameter values. We converted applicants into a 16-dimension vector through node embedding. Furthermore, 0.5 and 2 were used as the return parameter and in–out parameter in Node2Vec. The length of the walk and the number of walks per node, which were extracted from the applicant, were 5 and 30, respectively.
Table 2.
List of hyperparameters used in the experiment.
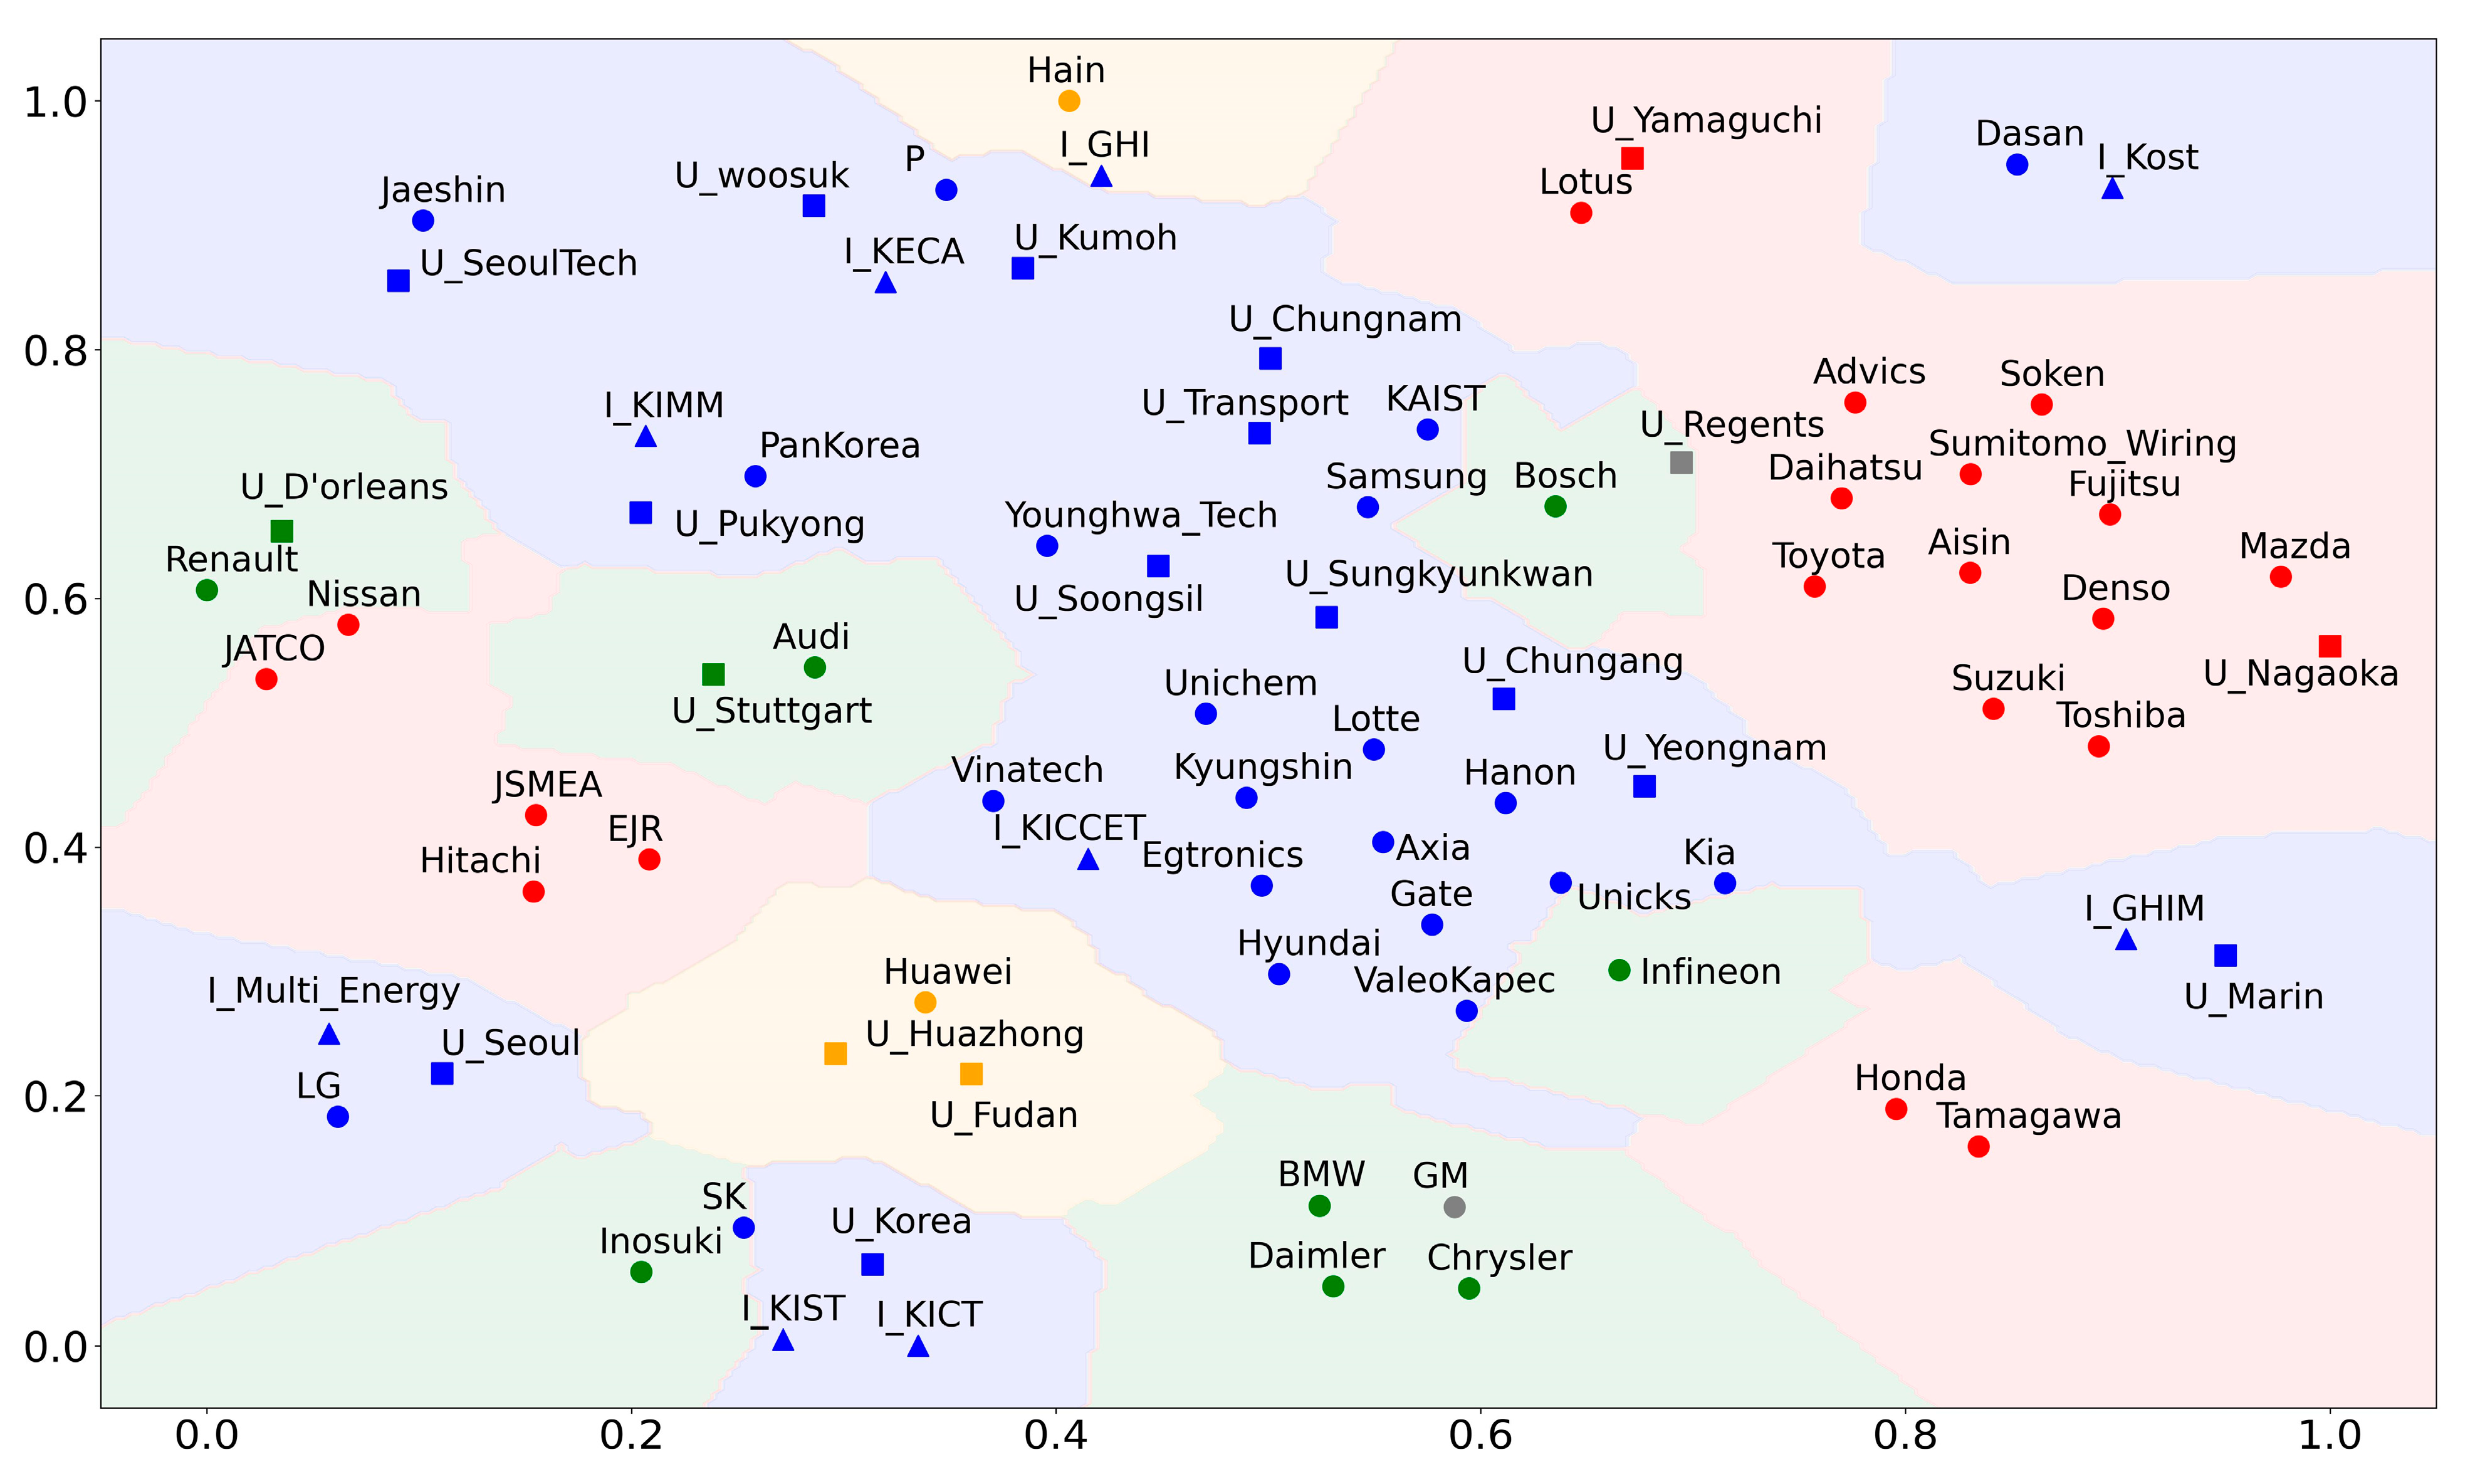
Figure 4 shows the reduced result of the 16-dimension applicant embedded into two dimensions [60]. The shape of the node represents the type of applicant. A circle represents an enterprise, a triangle represents a research institution, and a square represents a university. In the figure, the shade of the node’s background refers to the decision boundary of the k-nearest neighbor algorithm, which is classified according to the applicant’s nationality. The experimental results show that the nationality of the applicant and the neighborhood relationship of the applicant is well maintained (See Figure 3).

Figure 4.
Visualization of the applicant vector. The color of the node indicates the country in which the paper was filed. Orange represents China, green represents Europe, red represents Japan, blue represents South Korea, and gray represents the United States of America.
The proposed method explores potential R&D collaboration partners through MMR from embedded co-applicants. However, we needed to quantitatively verify whether the proposed method satisfactorily maintains the information of co-applicants. Thus, link prediction was conducted to predict actual co-applicants. The applicants that are embedded in 16 dimensions are connected through 3160 links. Of these, only 77 links exist, while the remaining 3083 do not. In the experiment, the performance of link prediction according to link embedding and predictive model was compared. The link prediction performance was measured using accuracy, precision, recall, F1-score, geometric mean (GM), and area under the receiver operating characteristic curve (AUC). The predictive models used in the experiment are the adaptive boosting (AB), decision tree (DT), k-nearest neighbor (KNN), and random forest (RF) models.
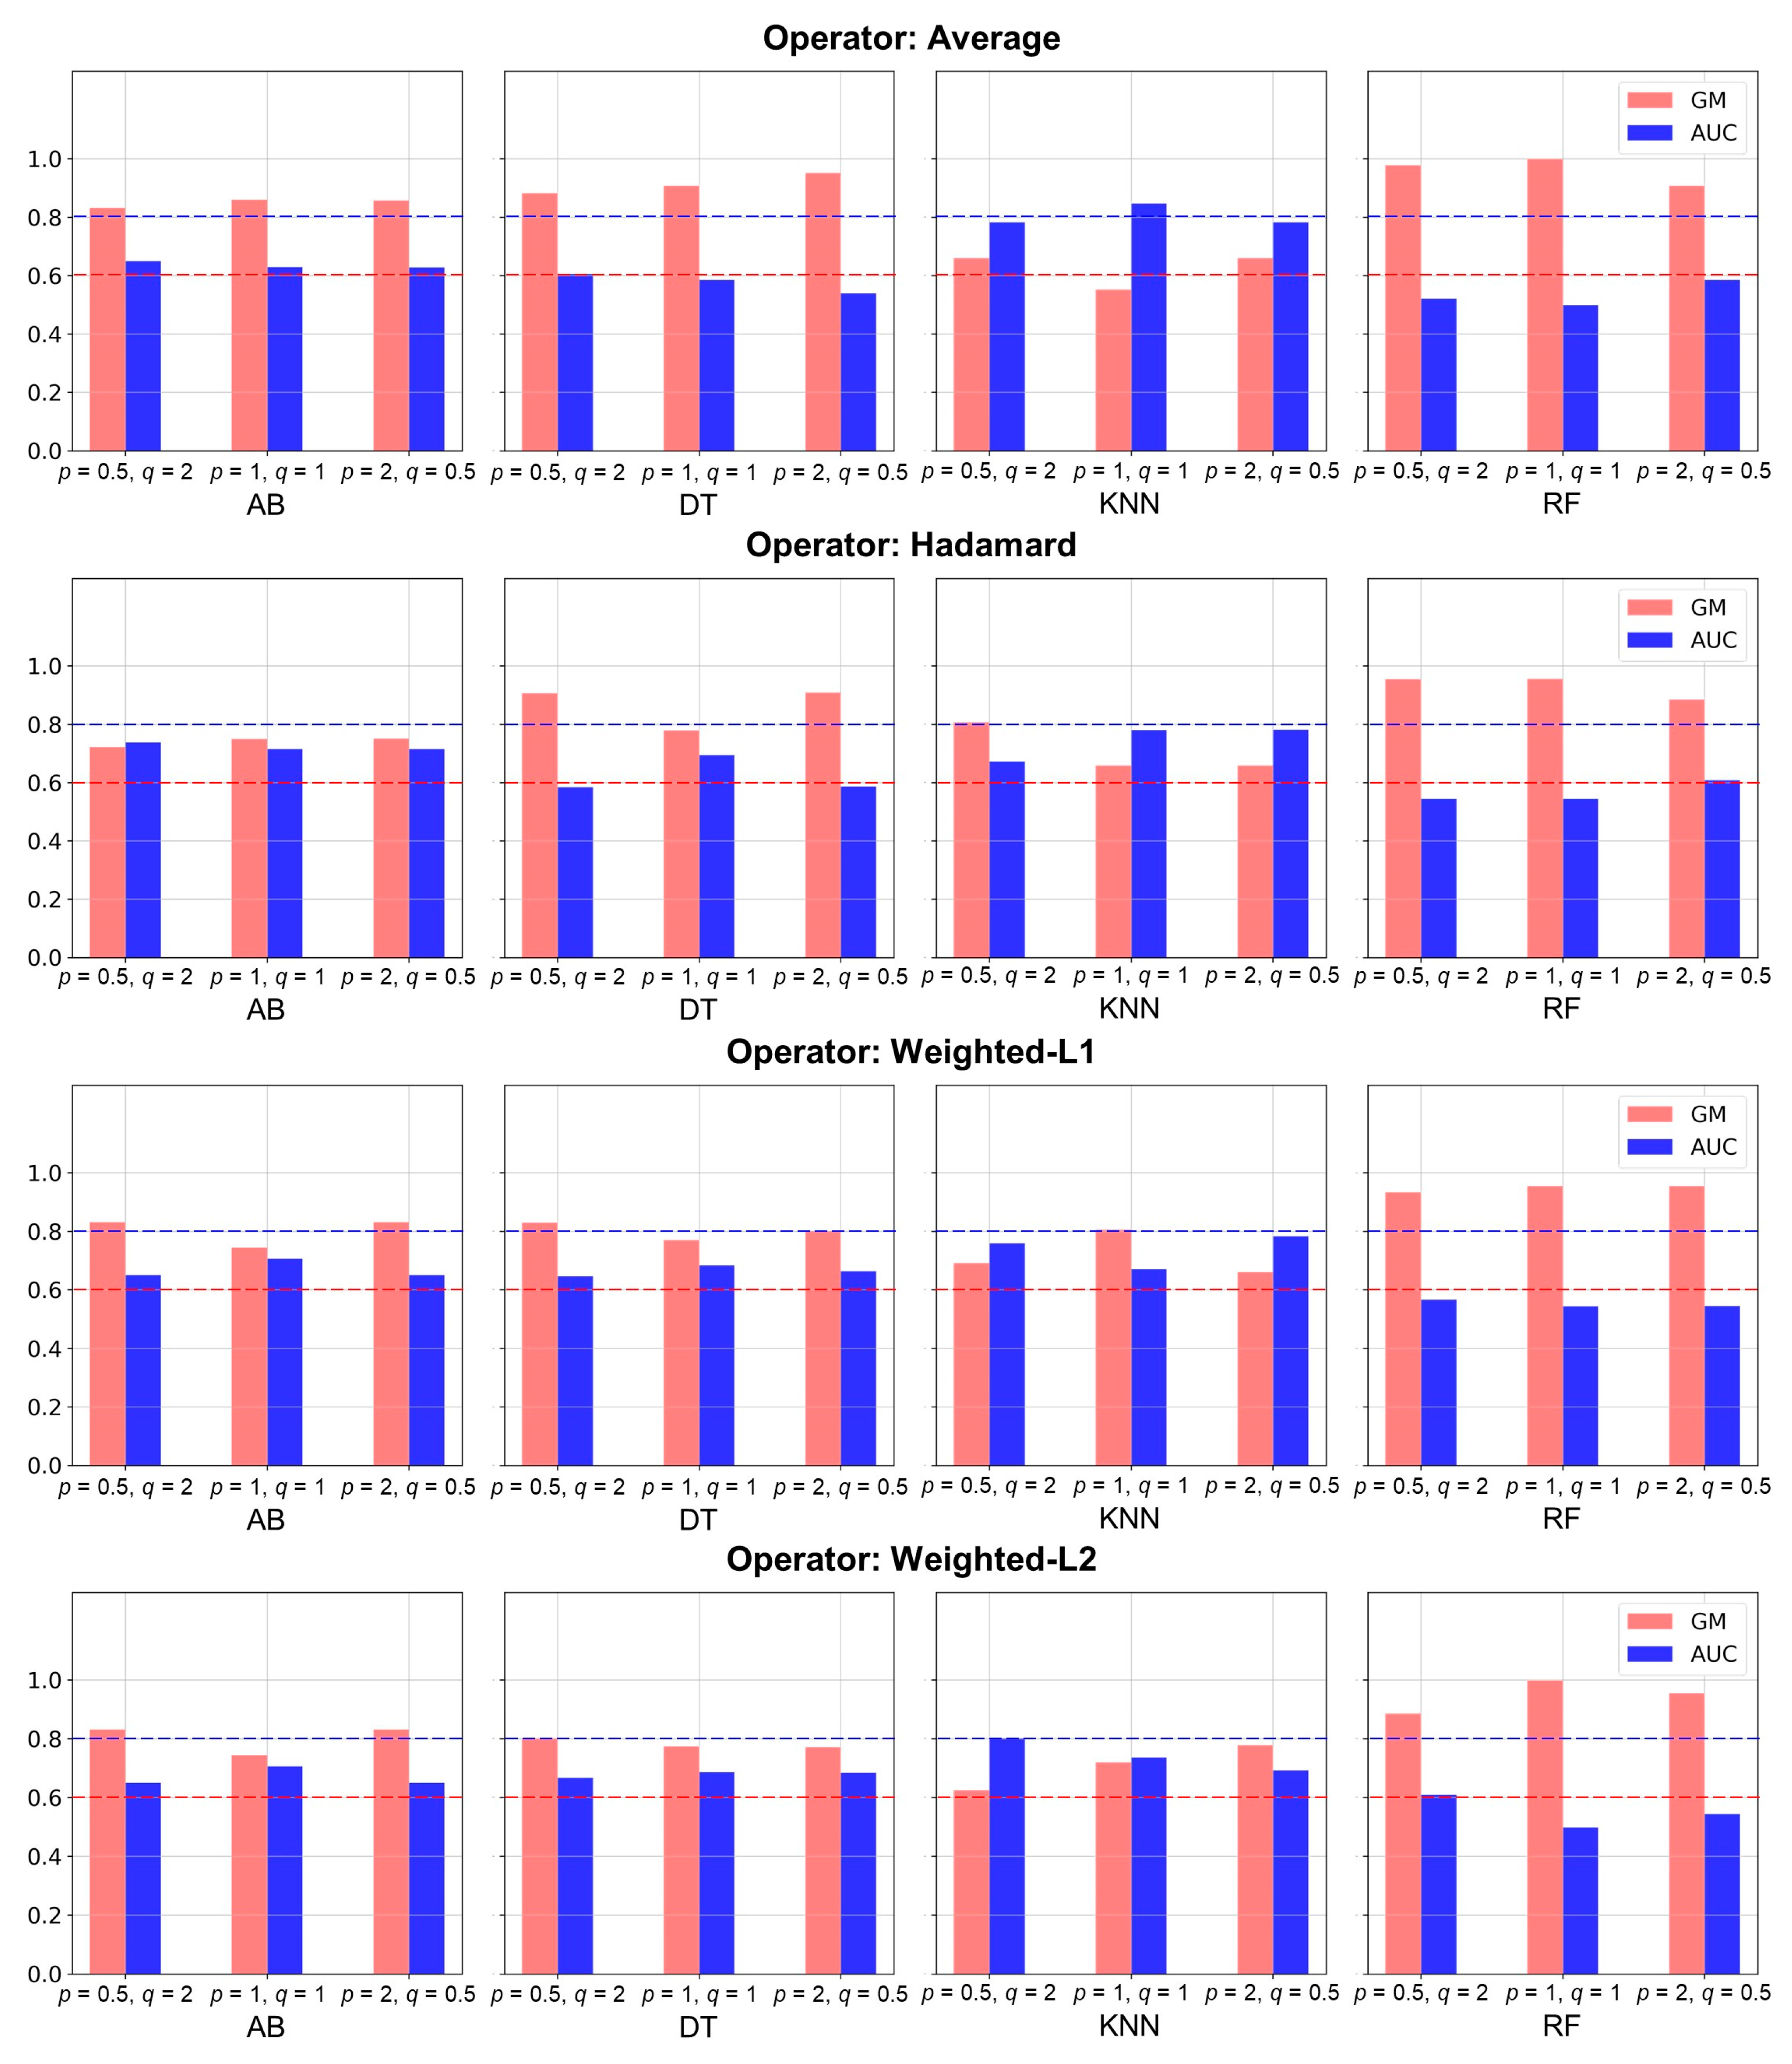
The process to select optimal link embedding and the predictive model to discover potential R&D collaboration partners is as follows: First, the performance according to the hyperparameters of Node2Vec was compared. In Appendix A, Figure A1 shows the comparison results of GM and AUC according to the hyperparameter of Node2Vec. The link that connects co-applicants is highly imbalanced. Therefore, we selected the optimal combination as the case where GM and AUC were 0.6 and 0.8 or larger. As a result, we determined that the performance was the best when the return parameter and in–out parameter were 0.5 and 2, and and were weighted-L2 and KNN, respectively.
Table 3 presents the performance of link prediction measured using optimal hyperparameters. The comparison results exhibited that the performances of DT, RF, and AB were comparable regardless of the operators. Therefore, we decided the final operator and predictive model based on GM and AUC. This is because GM and AUC help measure robust performance on data with imbalanced labels. Therefore, we chose wideghted-L2-based KNN as the final model, with GM and AUC greater than 0.6 and 0.8, respectively.
Table 3.
Performance of link prediction.
4.3. Embedding Collaboration Partners
Now, we know that the information of the co-applicant in the proposed method is well-preserved. Therefore, we extracted co-applicant candidates from the optimal model to discover potential R&D collaboration partners. The co-applicant candidate is a sample that (i) has no link to connect the actual co-applicant but (ii) is likely to be connected by the optimal model.
Table 4 presents the list of candidate co-applicants extracted from the optimal model. The extracted 16 co-applicants are expected to have potential collaboration. “Fujitsu”, which emerged most frequently in the list, develops automotive network solutions based on fifth-generation mobile communications, so it is expected that the company will develop autonomous driving technology continuously [61].
Table 4.
List of candidate collaboration partners discovered by the method.
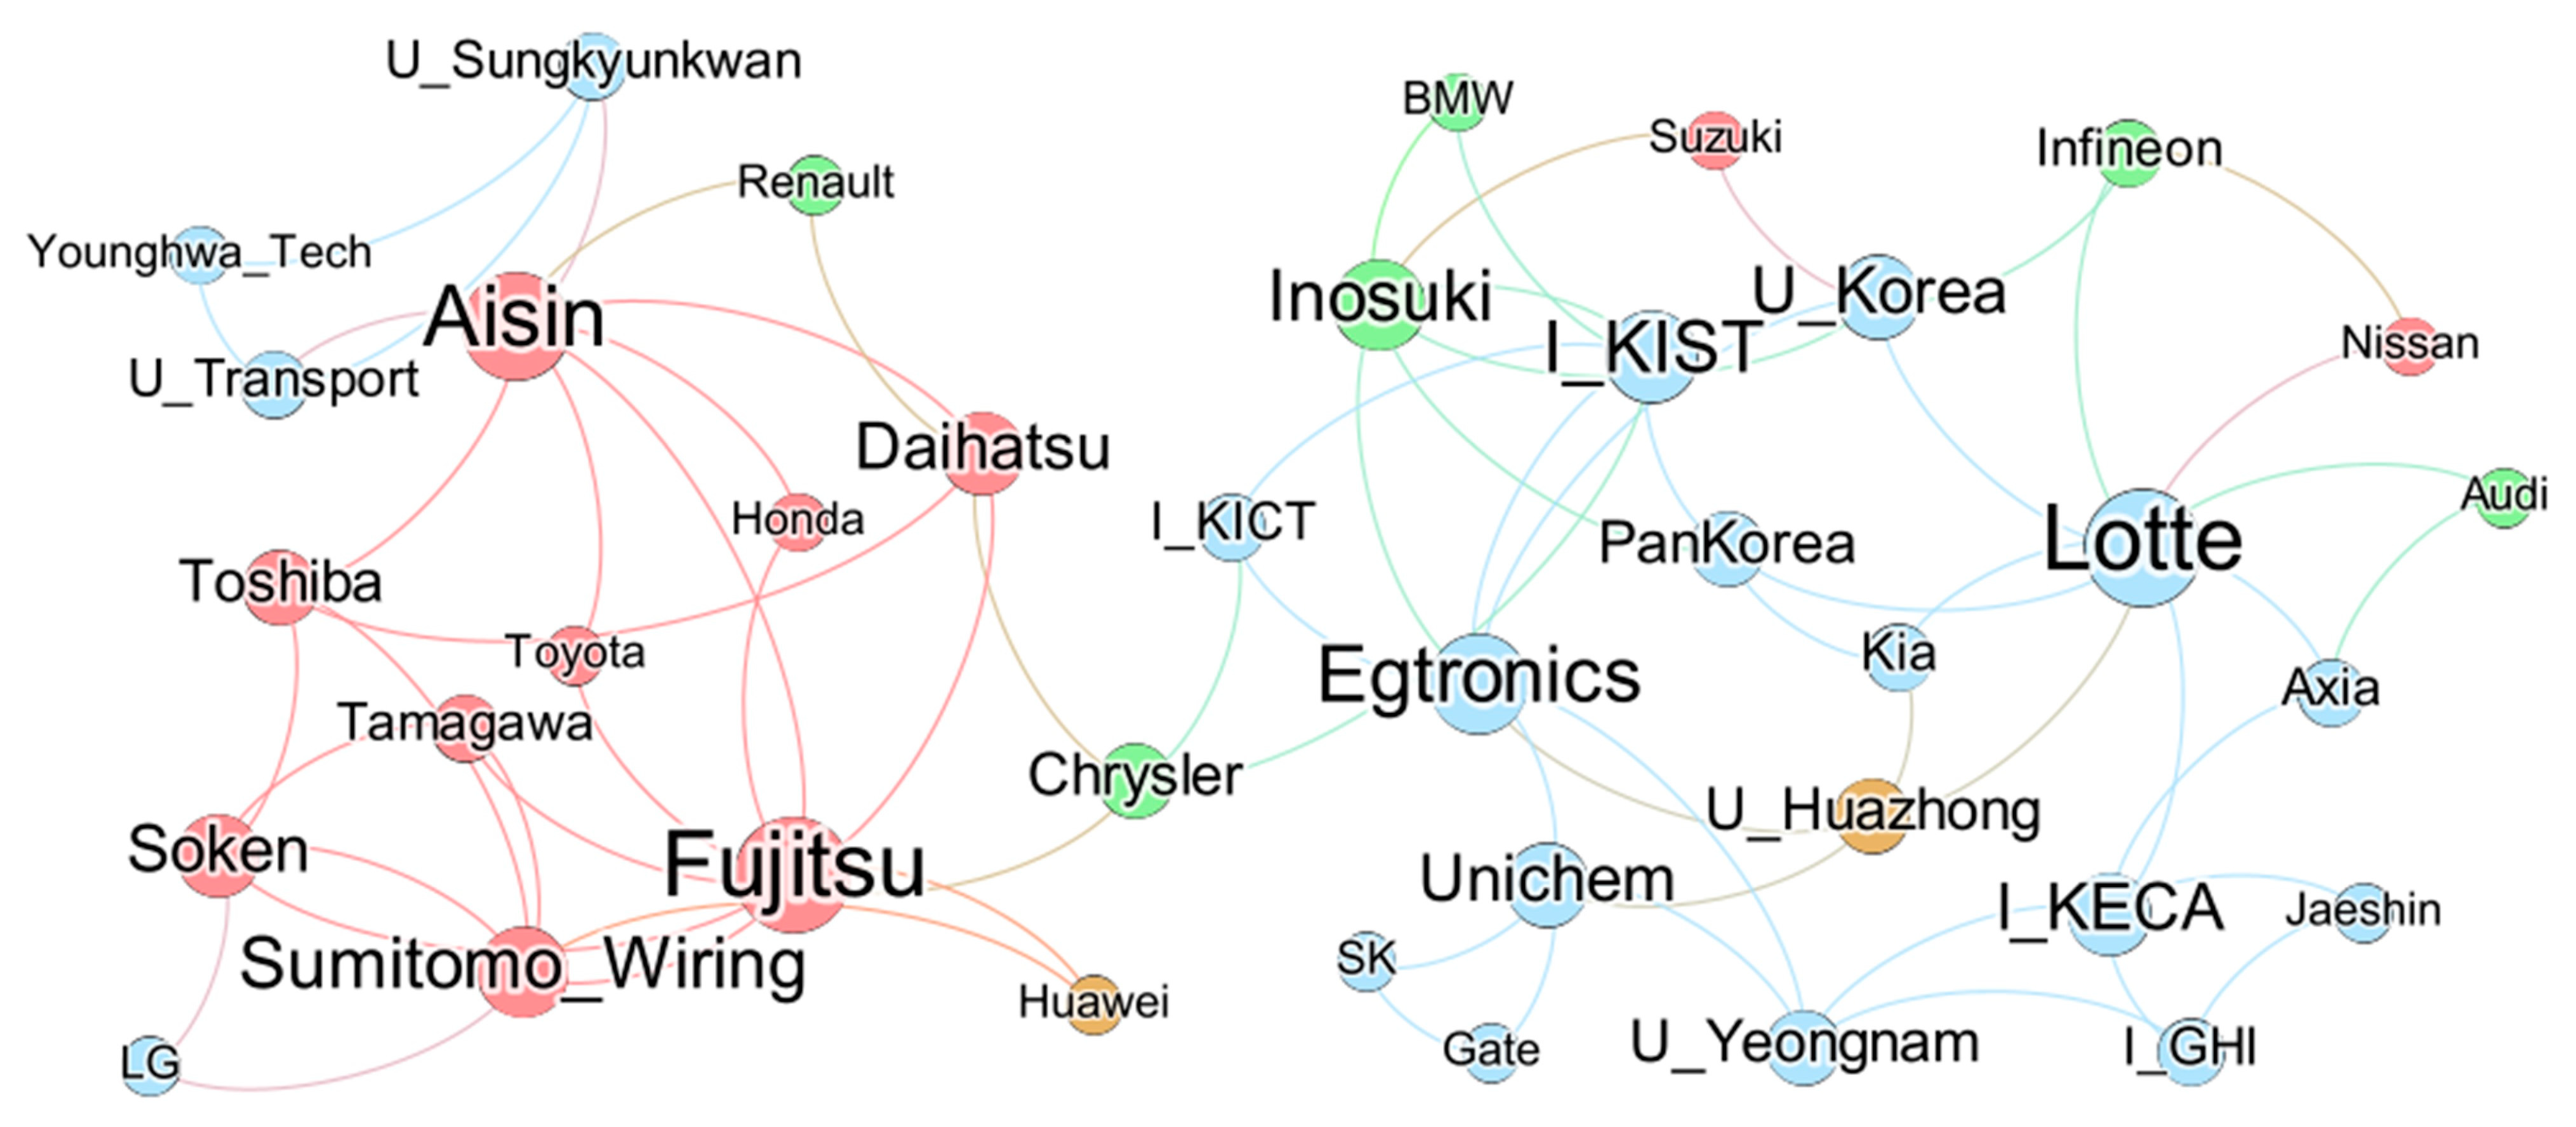
Figure 5 shows the visualization of the candidate co-applicant graph. It is expected that several business opportunities will be discovered centered around “Fujitsu” in Japan. South Korea is projected to have continuous collaboration around institutions or universities.

Figure 5.
Visualization of candidate collaboration partners. The color of the node indicates the country in which the paper was filed. Green represents Europe, red represents Japan, and blue represents South Korea.
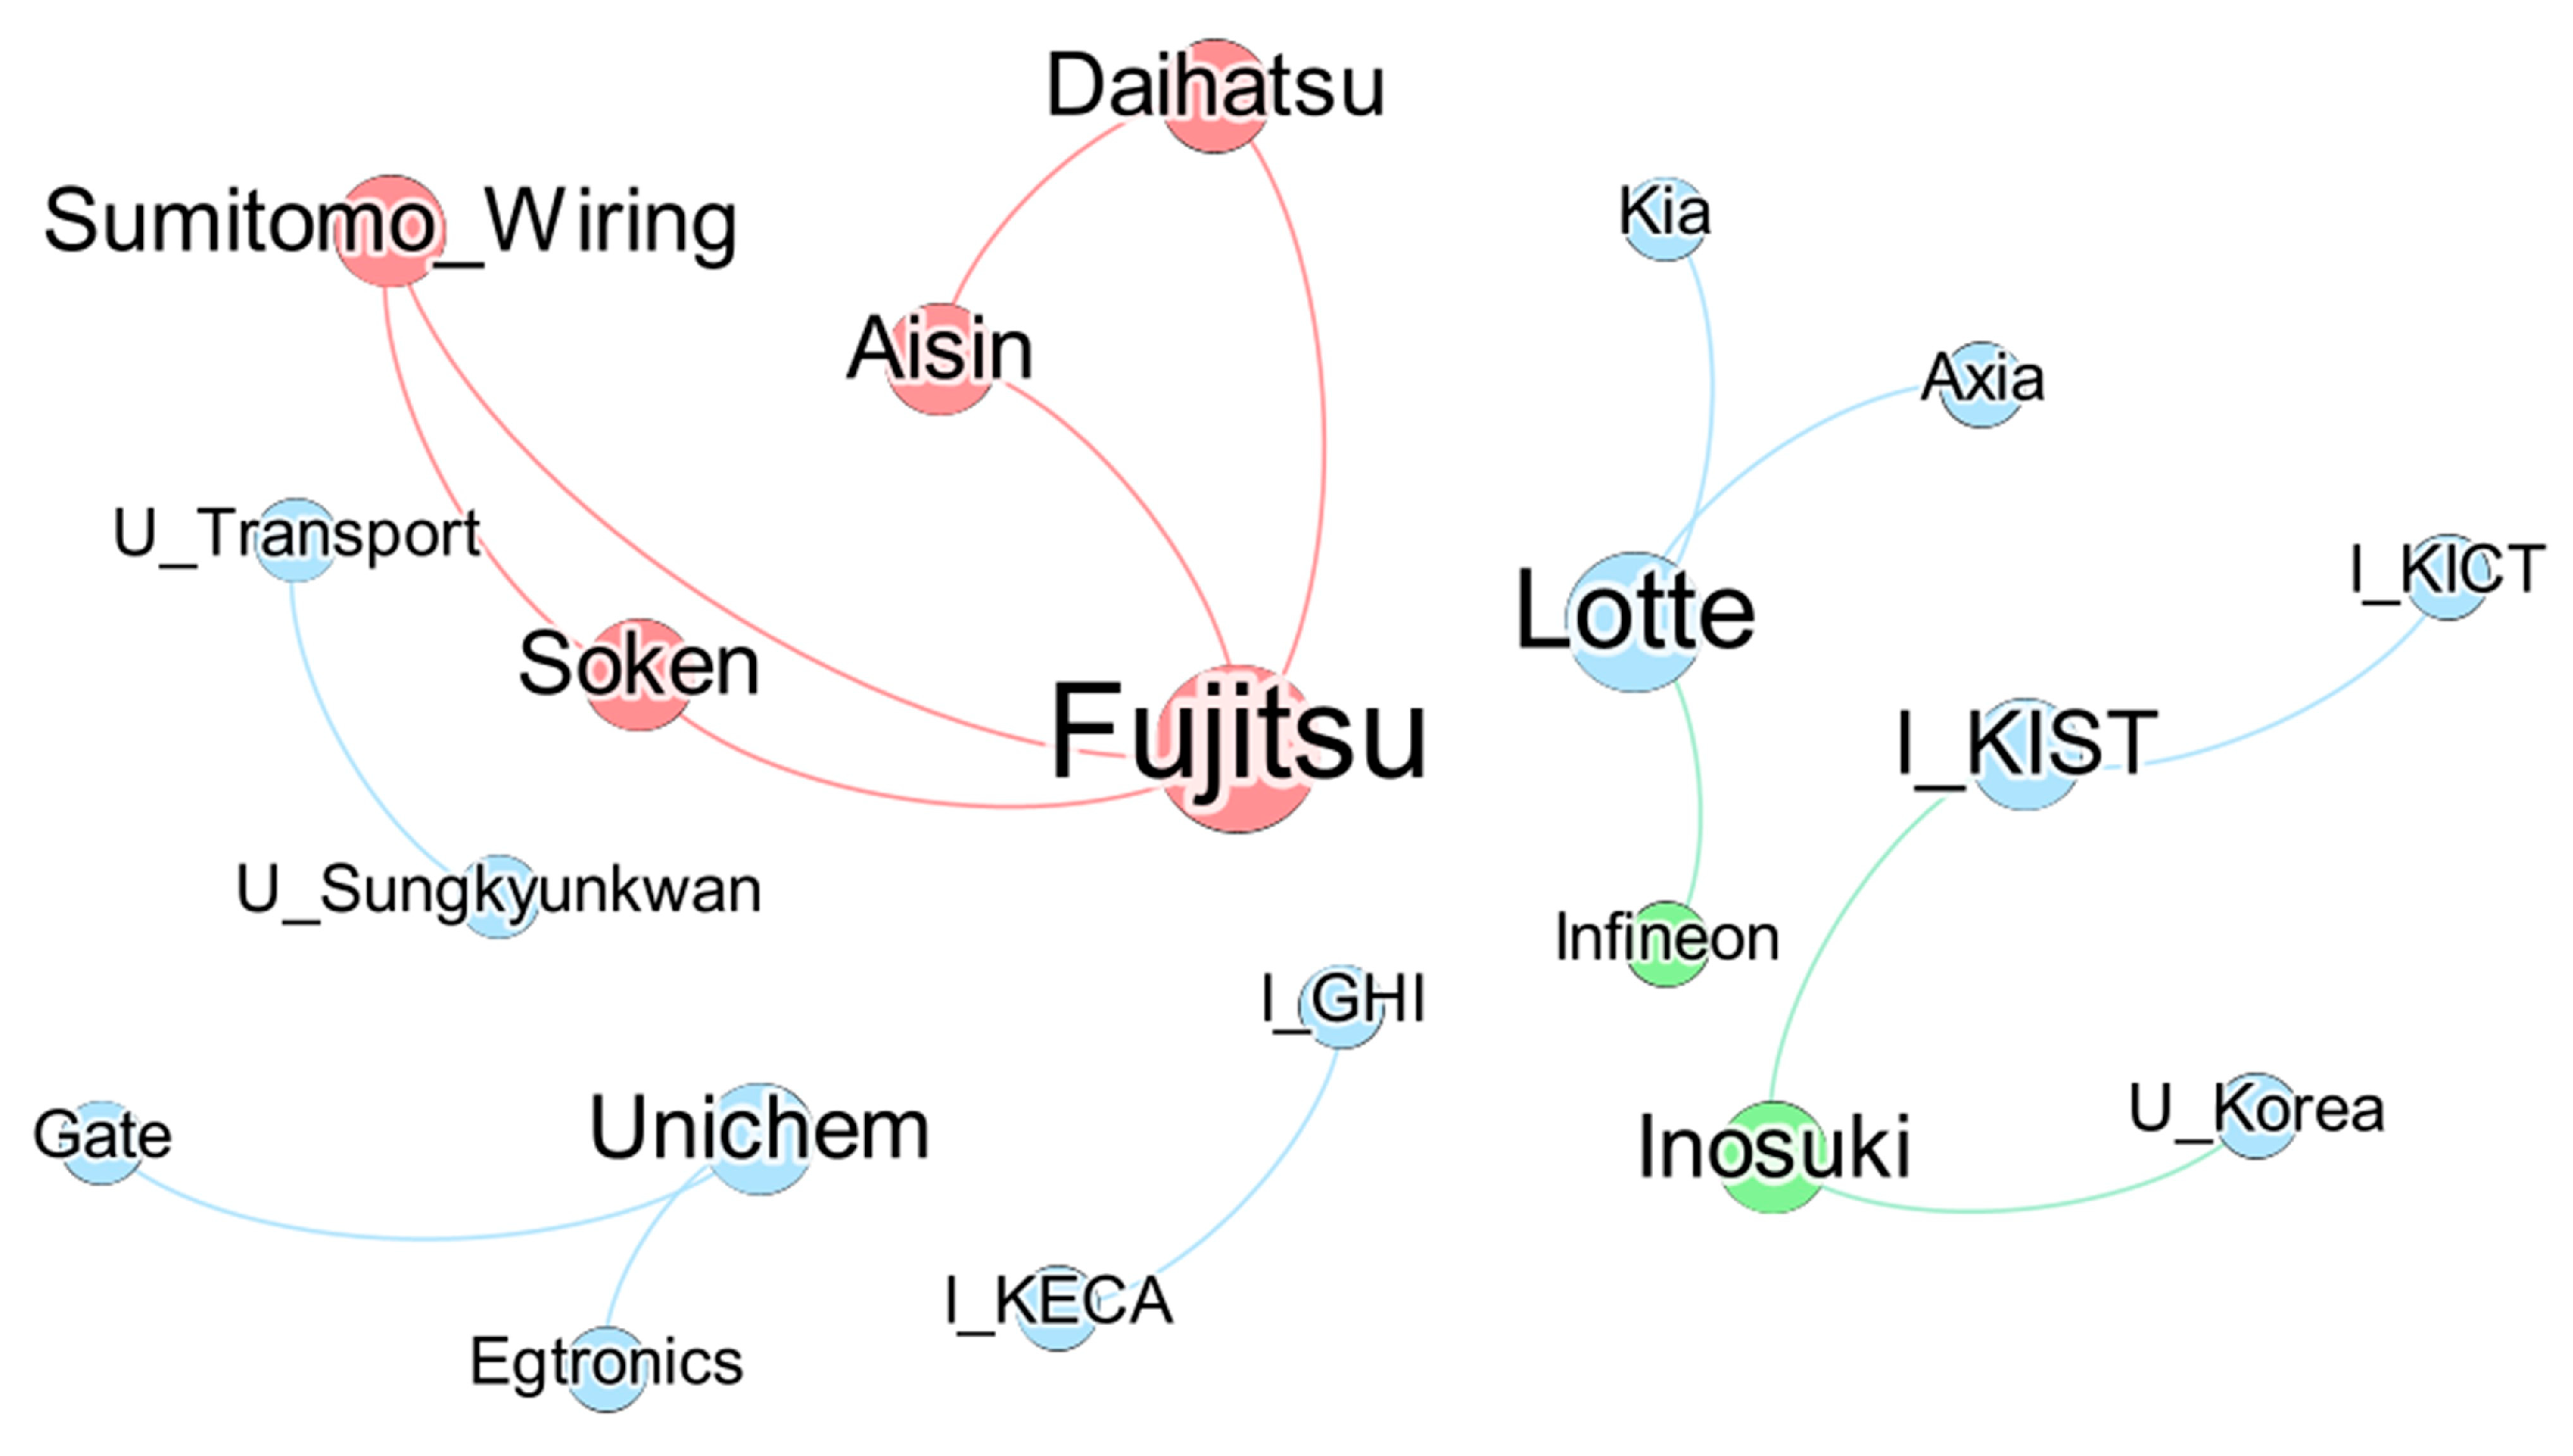
In the experiment, potential R&D collaboration partners among candidate co-applicants were explored using the proposed method. The selection diversity , which was the hyperparameter of MMR, was set to 0.8 in the experiment. In addition, a link that has the maximum of Equation (9) was searched to discover the highest possible co-applicant. Table 5 presents the list of potential co-applicants derived through the proposed method. Most co-applicants were derived to have potential collaboration with applicants that had the same nationality.
Table 5.
List of potential R&D collaboration partners.
Figure 6 shows the graph of potential co-applicants derived through the proposed method. The analysis results revealed that most co-applicants were discovered in the same nation. In Japan, possible sustainable collaboration is expected around “Fujitsu” and “Aisin” [62,63]. Furthermore, in South Korea, business opportunities were potentially high with institutions such as “I_KIST” and “U_Korea” in addition to promising electric vehicle battery-related enterprises such as “Egtronics” [64,65]. Furthermore, “Chrysler” is expected to collaborate with enterprises and institutions in various nations.

Figure 6.
Visualization of the discovered potential collaboration partners. The color of the node indicates the country in which the paper was filed. Orange represents China, green represents Europe, red represents Japan, and blue represents South Korea.
5. Conclusions
5.1. Discussion and Implications
In the rapidly evolving global market, enterprises are reinforcing proactive human, financial, and technological collaboration with research institutions and universities for their survival. In particular, the collaboration of organizations has reduced the time and cost that are consumed in R&D. Thus, organizations continue to maintain and manage their collaboration systems. However, it has been pointed out that this practice may have a negative impact on the development of organizations [66].
At present, organizations including enterprises have to answer the question of “where, how, and to whom to spread their knowledge” beyond socialization, externalization, combination, and internalization of their knowledge. Previous studies have answered the question through patent maps, functional-based frameworks, geographical distance-based approaches, and knowledge graphs. However, they have the following limitations: (i) they did not properly reflect the features of organizations [25,26,27,28,29], (ii) it was difficult to discover potential R&D collaboration partners using them [30,31,32,33], (iii) they needed to be adjusted according to the rapidly changing global pandemic environment [34,35,36,37], and (iv) they were dependent on specific topic or technology classification codes [43,44].
In response, we proposed a method that can discover potential R&D collaboration partners for the sustainable development of organizations. This paper represents applicants who own the patent and their relationships in a knowledge graph. Applicants, who are nodes in a knowledge graph, are embedded in a vector space through node embedding. Finally, potential R&D collaboration partners are discovered through the MMR algorithm.
We ask the following research questions:
- Can the information about co-applicants of patents clearly explain business opportunities?
- Can potential R&D collaboration partners be discovered from co-applicants?
In order to answer the research questions, we attempted to discover potential R&D collaboration partners from 873 patents. Potential R&D collaboration partners were discovered by extracting organizations that were similar to candidate co-applicants.
5.2. Limitations and Further Research
The present study has several limitations. First, the proposed method did not consider the timing of collaborative R&D. This is because collaborative R&D is conducted at the right time and right place. Second, our method did not consider the relationship with organizations when discovering potential R&D collaboration partners. The collaboration with organizations is conducted considering the relationship between nations or competitors. Consequently, advanced methodologies should consider this to discover potential R&D collaboration partners. Third, we did not present a method to determine hyperparameters such as the dimensionality of the node. Finally, the proposed methodology needs to be compared with other approaches. However, to the best of our knowledge, our study is the first work to explore R&D partners based on collaboration graphs. In the future, there is a need to compare the proposed method with a model that improves several limitations.
The plans for future research are as follows:
- Collaborative R&D will be conducted according to the plan of the human and financial scale. Thus, it is necessary to discover business opportunities that can maximize the value of a limited resource in the future.
- The potential of the discovered business opportunities will be determined by the management plan and strategy of the organization. Accordingly, advanced methodologies should consider the business feasibility of the discovered opportunities.
- Methodologies will be proposed that can be applied to various technological fields concurrently. This is because multidisciplinary business opportunities are a global trend.
This paper proposes a methodology based on a knowledge graph to discover potential R&D collaboration partners. Although our methodology has several limitations, it can answer the questions we raised. Thus, we expect organizations to discover business opportunities that can result in sustainable market value through the proposed method.
Author Contributions
J.L. (Juhyun Lee) designed this research and conducted the experiment as described. S.P. collected the dataset for the experiment. J.L. (Junseok Lee) analyzed the data to show the validity of this paper. In addition, all authors cooperated with each other in revising the paper. All authors have read and agreed to the published version of the manuscripts.
Funding
This research was supported by the Basic Science Research Program through the National Research Foundation of Korea (NRF) funded by the Ministry of Education (No. NRF-2022R1I1A1A01069422). This work was supported by the National Research Foundation of Korea (NRF) grant funded by the Korea government (MSIT) (No. RS-2023-00247410).
Institutional Review Board Statement
Not applicable.
Informed Consent Statement
Not applicable.
Data Availability Statement
Not applicable.
Conflicts of Interest
The authors declare no conflict of interest.
Appendix A
Table A1.
List of applicant abbreviations.
Table A1.
List of applicant abbreviations.
| Abbreviation | Applicant | Abbreviation | Applicant |
|---|---|---|---|
| Advics | Advics Co., Ltd. | LG | LG Electronics, Inc. |
| Aisin | Aisin Seiki Kabushiki Kaisha | Lotte | Lotte Corporation |
| Audi | Audi AG | Lotus | Lotus Thermal Solution, Inc. |
| Axia | Axia Materials Co., Ltd. | Mazda | Mazda Motor Corp. |
| BMW | Bayerische Motoren Werke Aktiengesellschaft | Mitsubishi | Mitsubishi Motors |
| Bosch | Robert Bosch GmbH | Nissan | Nissan Motor Co., Ltd. |
| Chrysler | Chrysler Group LLC | P | Patents filed by individuals |
| Continental | Continental Automotive GmbH | PanKorea | PanKorea |
| Daihatsu | Daihatsu Motor Co., Ltd. | Renault | Renault SAS |
| Daimler | Daimler AG | Samsung | Samsung SDI Co., Ltd. |
| Dasan | Dasan | SK | SK Hynix, Inc. |
| Denso | Denso Corporation | Soken | Soken, Inc. |
| Doowon | Doowon | Sumitomo_Wiring | Sumitomo Wiring Systems, Ltd. |
| Egtronics | Egtronics Co., Ltd. | Suzuki | Suzuki Motor Corp. |
| EJR | East Japan Railway Co. | Tamagawa | Tamagawa Seiki Co., Ltd. |
| Fujitsu | Fujitsu Limited | Toshiba | Toshiba Corp. |
| Gate | Gates Korea Co., Ltd. | Toyota | Toyota Motor Corp. |
| Geely | Geely Co., Ltd. | U_Chungang | Chung-Ang University |
| GM | GM Global Technology Operations LLC | U_Chungnam | Chungnam National University |
| Hain | The Hain Celestial Group, Inc. | U_D’orleans | Université d’Orléans |
| Hanon | Hanon Systems | U_Fudan | Fudan University |
| Hawei | Huawei Technologies Co., Ltd. | U_Huazhong | Huazhong University |
| Hitachi | Hitachi, Ltd. | U_Korea | Korea University |
| Honda | Honda Motor Co., Ltd. | U_Kumoh | Kumoh National Institute of Technology |
| Hyundai | Hyundai Motor Company Co., Ltd. | U_Marin | Korea Maritime & Ocean University |
| I_GHI | Gyeongbuk Hybrid Technology Institute | U_Nagaoka | Nagaoka Univ of Technology |
| I_GHIM | Global Frontier Hybrid Interface Materials | U_Pukyong | Pukyong National University |
| I_KECA | Korea Electrical Contractors Association | U_Regents | Regents of the University |
| I_KICCET | Korea Institute of Ceramic Engineering and Technology | U_Seoul | Seoul National University |
| I_KICT | Korea Institute of Civil Engineering & Building Technology | U_SeoulTech | Seoul National University |
| I_KIMM | Korea Institute of Machinery & Materials | U_Soongsil | Soongsil University |
| I_KIST | Korea Institute of Science and Technology | U_Stuttgart | UNIVERSITÄT Stuttgart |
| I_Kost | Korea Transportation Safety Authority | U_Sungkyunkwan | Sungkyunkwan University |
| I_MultiEnergy | Global Frontier Center for Multiscale Energy System | U_Transport | Korea National University of Transportation |
| Infineon | Infineon Technologies AG | U_woosuk | Woosuk University |
| Inosuki | Inosuki | U_Yamaguchi | Tokyo Univ of Science Yamaguchi |
| Jaeshin | Jaeshin PowerTech | U_Yeongnam | Yeungnam University |
| JATCO | JATCO Ltd. | Unichem | Unichem Co., Ltd. |
| JSMEA | Japan Ship Machinery & Equipment Association | Unicks | Unick Corporation |
| KAIST | Korea Advanced Institute of Science and Technology | ValeoKapec | Valeo Kapec Co., Ltd. |
| Kia | Kia Motors Corp. | Vinatech | VINATech Co., Ltd. |
| Kyungshin | Kyungshin Corp. | Younghwa_Tech | YounghwaTech Co., Ltd. |
Figure A1 in Appendix A shows the comparison results of GM and AUC. The links connecting co-applicants are very imbalanced. Therefore, cases where GM and AUC were greater than 0.6 and 0.8 were selected as the optimal combination. As a result, it was determined that the performance was best when the return and in–out parameters were 0.5 and 2, and operator and predictive model were weighted-L2 and KNN, respectively.

Figure A1.
Comparison results of link prediction.
Figure A1.
Comparison results of link prediction.
References
- Burnett, S.; Williams, D. The role of knowledge transfer in technological innovation: An oil and gas industry perspective. Knowl. Manag. Res. Pract. 2014, 12, 133–144. [Google Scholar] [CrossRef]
- Danneels, E. The process of technological competence leveraging. Strateg. Manag. J. 2007, 28, 511–533. [Google Scholar] [CrossRef]
- Hung, K.P.; Chou, C. The impact of open innovation on firm performance: The moderating effects of internal R&D and environmental turbulence. Technovation 2013, 33, 10–11. [Google Scholar] [CrossRef]
- Obradović, T.; Vlačić, B.; Dabić, M. Open innovation in the manufacturing industry: A review and research agenda. Technovation 2021, 102, 102221. [Google Scholar] [CrossRef]
- Nonaka, I. A dynamic theory of organizational knowledge creation. Organ. Sci. 1994, 5, 14–37. [Google Scholar] [CrossRef]
- Brown, S.L.; Eisenhardt, K.M. The art of continuous change: Linking complexity theory and time-paced evolution in relentlessly shifting organizations. Adm. Sci. Q. 1997, 42, 1–34. [Google Scholar] [CrossRef]
- Dyer, J.H.; Singh, H. The relational view: Cooperative strategy and sources of interorganizational competitive advantage. Acad. Manag. Rev. 1998, 23, 660–679. [Google Scholar] [CrossRef]
- Berends, H.; Vanhaverbeke, W.; Kirschbaum, R. Knowledge management challenges in new business development: Case study observations. J. Eng. Technol. Manag. 2007, 24, 314–328. [Google Scholar] [CrossRef]
- Wang, J.; Wang, C.Y.; Wu, C.Y. A real options framework for R&D planning in technology-based firms. J. Eng. Technol. Manag. 2015, 35, 93–114. [Google Scholar] [CrossRef]
- Pinto, E.B.; Fernandes, G. Collaborative R&D the key cooperation domain for university-industry partnerships sustainability-Position paper. Procedia Comput. Sci. 2021, 181, 102–109. [Google Scholar] [CrossRef]
- Chen, K.; Kenney, M. Universities/Research Institutes and Regional Innovation Systems: The Cases of Beijing and Shenzhen. World Dev. 2007, 35, 1056–1074. [Google Scholar] [CrossRef]
- Yang, H.X.; Wu, Z.X.; Wang, B.H. Role of aspiration-induced migration in cooperation. Phys. Rev. E Stat. Nonlinear Soft Matter Phys. 2010, 81, 065101. [Google Scholar] [CrossRef] [PubMed]
- Gao, X.; Guan, J.; Rousseau, R. Mapping collaborative knowledge production in China using patent co-inventorships. Scientometrics 2011, 88, 313–331. [Google Scholar] [CrossRef]
- Temel, S.; Glassman, B. Examining university-industry collaboration as a source of innovation in the emerging economy of Turkey. Int. J. Innov. Sci. 2013, 5, 81–88. [Google Scholar] [CrossRef]
- Gulati, R. Social Structure and Alliance Formation Patterns: A Longitudinal Analysis. Adm. Sci. Q. 1995, 40, 619. [Google Scholar] [CrossRef]
- Capaldo, A. Network structure and innovation: The leveraging of a dual network as a distinctive relational capability. Strateg. Manag. J. 2007, 28, 585–608. [Google Scholar] [CrossRef]
- Durmuşoğlu, A.; Durmuşoğlu, Z.D.U. Remembering Medical Ventilators and Masks in the Days of COVID-19: Patenting in the Last Decade in Respiratory Technologies. IEEE Trans. Eng. Manag. 2022, 1–15. [Google Scholar] [CrossRef]
- Durmusoglu, A.; Durmusoglu, Z.D.U. Traffic control system technologies for road vehicles: A patent analysis. IEEE Intell. Transp. Syst. Mag. 2020, 13, 31–41. [Google Scholar] [CrossRef]
- Zhang, Y.; Qian, Y.; Huang, Y.; Guo, Y.; Zhang, G.; Lu, J. An entropy-based indicator system for measuring the potential of patents in technological innovation: Rejecting moderation. Scientometrics 2017, 111, 1925–1946. [Google Scholar] [CrossRef]
- Belderbos, R.; Cassiman, B.; Faems, D.; Leten, B.; Van Looy, B. Co-ownership of intellectual property: Exploring the value-appropriation and value-creation implications of co-patenting with different partners. Res. Policy 2014, 43, 841–852. [Google Scholar] [CrossRef]
- Lv, D.D.; Zeng, P.; Lan, H. Co-patent, financing constraints, and innovation in SMEs: An empirical analysis using market value panel data of listed firms. J. Eng. Technol. Manag. 2018, 48, 15–27. [Google Scholar] [CrossRef]
- Briggs, K. Co-owner relationships conducive to high quality joint patents. Res. Policy 2015, 44, 1566–1573. [Google Scholar] [CrossRef]
- Kim, C.S.; Inkpen, A.C. Cross-border R&D alliances, absorptive capacity and technology learning. J. Int. Manag. 2005, 11, 313–329. [Google Scholar] [CrossRef]
- Santamaría, L.; Nieto, M.J.; Rodríguez, A. Failed and successful innovations: The role of geographic proximity and international diversity of partners in technological collaboration. Technol. Forecast. Soc. Chang. 2021, 166, 120575. [Google Scholar] [CrossRef]
- Yoon, B.U.; Yoon, C.B.; Park, Y.T. On the development and application of a self-organizing feature map-based patent map. R D Manag. 2002, 32, 291–300. [Google Scholar] [CrossRef]
- Kim, Y.G.; Suh, J.H.; Park, S.C. Visualization of patent analysis for emerging technology. Expert Syst. Appl. 2008, 34, 1804–1812. [Google Scholar] [CrossRef]
- Lee, S.; Yoon, B.; Park, Y. An approach to discovering new technology opportunities: Keyword-based patent map approach. Technovation 2009, 29, 481–497. [Google Scholar] [CrossRef]
- Yoon, J.; Park, H.; Kim, K. Identifying technological competition trends for R&D planning using dynamic patent maps: SAO-based content analysis. Scientometrics 2013, 94, 313–331. [Google Scholar] [CrossRef]
- Lee, C.; Lee, G. Technology opportunity analysis based on recombinant search: Patent landscape analysis for idea generation. Scientometrics 2019, 121, 313–331. [Google Scholar] [CrossRef]
- Yoon, J.; Park, H.; Seo, W.; Lee, J.M.; Coh, B.; Kim, J. Technology opportunity discovery (TOD) from existing technologies and products: A function-based TOD framework. Technol. Forecast. Soc. Chang. 2015, 100, 153–167. [Google Scholar] [CrossRef]
- Faccin, K.; Balestrin, A. The dynamics of collaborative practices for knowledge creation in joint R&D projects. J. Eng. Technol. Manag. JET-M 2018, 48, 28–43. [Google Scholar] [CrossRef]
- Messeni Petruzzelli, A.; Murgia, G. University–Industry collaborations and international knowledge spillovers: A joint-patent investigation. J. Technol. Transf. 2020, 45, 958–983. [Google Scholar] [CrossRef]
- Murgia, G. The impact of collaboration diversity and joint experience on the reiteration of university co-patents. J. Technol. Transf. 2021, 46, 1108–1143. [Google Scholar] [CrossRef]
- Maggioni, M.A.; Uberti, T.E. Knowledge networks across Europe: Which distance matters? Ann. Reg. Sci. 2009, 43, 691–720. [Google Scholar] [CrossRef]
- Burhop, C.; Wolf, N. The German market for patents during the second industrialization, 1884-1913: A gravity approach. Bus. Hist. Rev. 2013, 87, 69–93. [Google Scholar] [CrossRef]
- Drivas, K.; Economidou, C. Is geographic nearness important for trading ideas? Evidence from the US. J. Technol. Transf. 2015, 40, 629–662. [Google Scholar] [CrossRef]
- Capaldo, A.; Petruzzelli, A.M. Partner geographic and organizational proximity and the innovative performance of knowledge-creating alliances. Eur. Manag. Rev. 2014, 11, 63–84. [Google Scholar] [CrossRef]
- Golosovsky, M.; Solomon, S. Growing complex network of citations of scientific papers: Modeling and measurements. Phys. Rev. E 2017, 95, 012324. [Google Scholar] [CrossRef]
- Ardito, L.; D’Adda, D.; Messeni Petruzzelli, A. Mapping innovation dynamics in the Internet of Things domain: Evidence from patent analysis. Technol. Forecast. Soc. Chang. 2018, 136, 317–330. [Google Scholar] [CrossRef]
- Goetze, C. An empirical enquiry into co-patent networks and their stars: The case of cardiac pacemaker technology. Technovation 2010, 30, 7–8. [Google Scholar] [CrossRef]
- Liu, W.; Li, F.; Bi, K. Exploring and visualizing co-patent networks in bioenergy field: A perspective from inventor, transnational inventor, and country. Int. J. Green Energy 2022, 19, 562–575. [Google Scholar] [CrossRef]
- Lee, M.; Kim, S.; Kim, H.; Lee, J. Technology Opportunity Discovery using Deep Learning-based Text Mining and a Knowledge Graph. Technol. Forecast. Soc. Chang. 2022, 180, 121718. [Google Scholar] [CrossRef]
- Seo, W. A patent-based approach to identifying potential technology opportunities realizable from a firm’s internal capabilities. Comput. Ind. Eng. 2022, 171, 108395. [Google Scholar] [CrossRef]
- Wu, Y.; Ji, Y.; Gu, F. Identifying firm-specific technology opportunities in a supply chain: Link prediction analysis in multilayer networks. Expert Syst. Appl. 2023, 213, 119053. [Google Scholar] [CrossRef]
- Perozzi, B.; Al-Rfou, R.; Skiena, S. DeepWalk: Online learning of social representations. In Proceedings of the ACM SIGKDD International Conference on Knowledge Discovery and Data Mining, New York, NY, USA, 24–27 August 2014; pp. 701–710. [Google Scholar] [CrossRef]
- Mikolov, T.; Chen, K.; Corrado, G.; Dean, J. Efficient estimation of word representations in vector space. arXiv 2013, arXiv:1301.3781. [Google Scholar]
- Mikolov, T.; Sutskever, I.; Chen, K.; Corrado, G.S.; Dean, J. Distributed Representations of Words and Phrases and their Compositionality. arXiv 2013. [Google Scholar] [CrossRef]
- Le, Q.; Mikolov, T. Distributed representations of sentences and documents. In Proceedings of the 31st International Conference on Machine Learning, ICML, Beijing, China, 21–26 June 2014; Volume 4. [Google Scholar]
- Grover, A.; Leskovec, J. Node2vec: Scalable Feature Learning for Networks. In Proceedings of the 22nd ACM SIGKDD International Conference on Knowledge Discovery and Data Mining, New York, NY, USA, 24–27 August 2016; pp. 855–864. [Google Scholar] [CrossRef]
- Hu, F.; Liu, J.; Li, L.; Liang, J. Community detection in complex networks using Node2vec with spectral clustering. Phys. A Stat. Mech. Its Appl. 2020, 545, 123633. [Google Scholar] [CrossRef]
- Han, S.; Huang, H.; Huang, X.; Li, Y.; Yu, R.; Zhang, J. Core patent forecasting based on graph neural networks with an application in stock markets. Technol. Anal. Strateg. Manag. 2022, 1–15. [Google Scholar] [CrossRef]
- Zhou, H.; Sun, G.; Fu, S.; Wang, L.; Hu, J.; Gao, Y. Internet Financial Fraud Detection Based on a Distributed Big Data Approach with Node2vec. IEEE Access 2021, 9, 43378–43386. [Google Scholar] [CrossRef]
- Shen, Z.; Chen, F.; Yang, L.; Wu, J. Node2vec Representation for Clustering Journals and as A Possible Measure of Diversity. J. Data Inf. Sci. 2019, 4, 79–92. [Google Scholar] [CrossRef]
- Kim, S.; Suh, Y.; Lee, H. What IoT devices and applications should be connected? Predicting user behaviors of IoT services with node2vec embedding. Inf. Process. Manag. 2022, 59, 102869. [Google Scholar] [CrossRef]
- Jaccard, P. The Distribution of the Flora in the Alpine Zone. New Phytol. 1912, 11, 37–50. [Google Scholar] [CrossRef]
- Zhou, T.; Lü, L.; Zhang, Y.C. Predicting missing links via local information. Eur. Phys. J. B 2009, 71, 623–630. [Google Scholar] [CrossRef]
- Open Data Portal. “Patent Application Bibliographic Data”, United States Patent and Trademark Office. 2022. Available online: https://developer.uspto.gov/product/patent-application-bibliographic-dataxml (accessed on 26 December 2022).
- Carbonell, J.; Goldstein, J. Use of MMR, diversity-based reranking for reordering documents and producing summaries. In Proceedings of the 21st Annual International ACM SIGIR Conference on Research and Development in Information Retrieval, New York, NY, USA, 24–28 August 1998; pp. 335–336. [Google Scholar] [CrossRef]
- Bennani-Smires, K.; Musat, C.; Hossmann, A.; Baeriswyl, M.; Jaggi, M. Simple unsupervised keyphrase extraction using sentence embeddings. arXiv 2018, arXiv:1801.04470. [Google Scholar]
- Van Der Maaten, L.; Hinton, G. Visualizing data using t-SNE. J. Mach. Learn. Res. 2008, 9, 11. [Google Scholar]
- Oda, S.; Saito, T.; Nishimura, K.; Hayakawa, A. Optical network technologies for enabling 5G services. Fujitsu Sci. Tech. J. 2019, 55, 38–45. [Google Scholar]
- Lai, K.K.; Chang, Y.H.; Kumar, V.; Wei, T.Y.; Su, F.P.; Mittal, A. The position and role on patent citation network of the parking lot guidance system. Technol. Anal. Strateg. Manag. 2021, 35, 1161–1177. [Google Scholar] [CrossRef]
- Lee, S.; Alsoubie, F.; Daim, T.U. Technology Intelligence Map: Autonomous Car. In Roadmapping Future. Applied Innovation and Technology Management; Springer: Berlin/Heidelberg, Germany, 2021. [Google Scholar] [CrossRef]
- Patterson, G.; Roberts, J. Gallium nitride-Delivering its promise in automotive applications. In Proceedings of the 6th Hybrid and Electric Vehicles Conference (HEVC 2016), London, UK, 2–3 November 2016; Volume 2016, pp. 1–6. [Google Scholar] [CrossRef]
- Tran, D.D.; Tran, M.T.; Deepak, K.; Ferreri, M.; El Baghdadi, M.; Hegazy, O. 48V 25 kW GaN Inverter Design Consideration for Urban-Sized Electric Utility Vehicles. In Proceedings of the 2022 International Symposium on Power Electronics, Electrical Drives, Automation and Motion, SPEEDAM 2022, Sorrento, Italy, 22–24 June 2022; pp. 826–831. [Google Scholar] [CrossRef]
- Puliga, G.; Urbinati, A.; Franchin, E.M.; Castegnaro, S. Investigating the drivers of failure of research-industry collaborations in open innovation contexts. Technovation 2023, 119, 102543. [Google Scholar] [CrossRef]
Disclaimer/Publisher’s Note: The statements, opinions and data contained in all publications are solely those of the individual author(s) and contributor(s) and not of MDPI and/or the editor(s). MDPI and/or the editor(s) disclaim responsibility for any injury to people or property resulting from any ideas, methods, instructions or products referred to in the content. |
© 2023 by the authors. Licensee MDPI, Basel, Switzerland. This article is an open access article distributed under the terms and conditions of the Creative Commons Attribution (CC BY) license (https://creativecommons.org/licenses/by/4.0/).