Abstract
The increase of extreme precipitation (EP) frequency and the aggravation of disasters have seriously disrupted the normal economic and social development of human beings. The complex topography of the Yunnan-Guizhou Plateau region (YGPR) and the fact that moisture originates from two different directions, the Pacific Ocean and the Indian Ocean, make the mechanism of EP more complicated. Exploring the variation characteristics and influencing factors of EP in YGPR is of great significance for regional disaster prevention and mitigation and water resources management. In this study, 11 extreme precipitation indices (EPIs) defined by the Expert Team on Climate Change Detection and Indices (ETCCDI) were calculated based on daily precipitation data of 1960–2020 from 83 national meteorological stations in the study area. The Mann–Kendall test and Wavelet analysis were used to analyze the variation characteristics of EP and explore the influence mechanisms of geographical factors and atmospheric circulation on EP in the spatial and temporal perspective. The conclusions are as follows: (1) The EP of the study area has an overall increasing trend in the research period, with the increase of persistent dry days, the precipitation concentration, intensity, and extreme heavy precipitation (EHP); (2) It shows the obvious spatial difference in the study area, with the high-value areas of extreme drought (ED) in the northwestern region and the total annual precipitation, EHP, and intensity in the southeastern region. In addition, ED and EHP tends to increase in the western region of the study area as well as in the middle east and southeast; (3) EHP is significantly positively correlated with longitude and highly negatively with latitude. Meanwhile, EHP shows a correlation with altitude (negative at low altitude and positive at high altitude); (4) The degree of drought change is greatly affected by North Atlantic Oscillation/El Niño-Southern Oscillation (ENSO) events. The variation of extreme heavy precipitation is greatly influenced by the summer monsoon of South Asian, East Asian, and South China Sea; (5) All the EPIs show persistence. The study results can contribute to the understanding of EP variation in the study area and provide some scientific references for regional water resource management, meteorological warning, and agricultural production safeguard.
1. Introduction
In recent years, global warming has become the social consensus and the research hotspot of scientists. Especially since the 21st century, under the influence of intensified human activities, extreme climate disasters have occurred frequently, which has brought serious damage to our normal economic and social development order. The Sixth Assessment Report (AR6) of the United Nations Intergovernmental Panel on Climate Change (IPCC) [1] shows that the global average surface temperature increased by 1.09 (0.95–1.20) °C in 2011–2020 compared to 1850–1900, meanwhile, with global warming accelerating and extreme climate increasing, and that the global average surface temperature will exceed 1.5 °C in the next 20 years or less [1,2,3]. Climate warming is an indisputable fact, and the response to extreme global climate change is particularly obvious, mainly in the form of intensified global hydrological cycle processes and permafrost degradation. As the hydrological cycle intensifies, extreme precipitation (EP) events’ frequency, intensity, and duration continue to be severely impacted [4]. Studies have shown that EP can trigger a series of natural disasters, such as floods, droughts, and mudslides, that pose significant threats to global societies, economies, ecosystems, and human health [5]. Based on this, extreme climate events, especially EP, have received widespread attention from governments and scholars.
At the global scale, Alexander et al. [4] found that annual EP showed an increasing trend during 1951–2003, with most areas becoming wet, especially in the mid-latitudes of the Northern Hemisphere, as confirmed by Kiktev et al. [6]. Many scholars have conducted studies on EP at continental scales, national scales, and even for specific basins. Liu et al. [7], van den Besselaar et al. [8], and Fan et al. [9] found an increasing EP trend in Central Asia, Europe, and Southeast Asia, respectively; Jakob et al. [10], Ezaz et al. [11], and Quan et al. [12] found that EP in the regions of Australia, Bangladesh in South Asia, and Vietnam showed the complex spatial distribution differences influenced by factors such as the topography and atmospheric circulation, respectively. With the vast territory and diverse climate types in China, the study of the variation characteristics of EP and the influencing mechanisms has become a major focus of in-depth research by scholars. Consistent with the global distribution of EP, the overall trend of EP in China is on the rise but exhibits more complex spatial variability [13]. Some scholars, based on different regional analyses, found that EP tends to decrease in North China and Northeast China [14]. In contrast, EP is generally increasing in the Northwest [14], South China [15,16], Southeast [17], Southwest [18,19,20,21], and the Tibetan Plateau [22], but they have obvious regional differences and are affected by topography, ENSO, and other factors. In addition, many scholars have carried out analyses based on different basins, provinces, and other scales, such as in the Yellow River basin [23], the Pearl River basin [23], the Han River basin [24], the Lancang River basin [25], the Huaihai River basin [26], the Yarlung Tsangpo river basin [27], Inner Mongolia [28,29], Sichuan province [30], and Yunnan province [31], and have made breakthroughs, enriching the study of EP and providing a basis for a wide range of research in hydrology and water resources and climate change. Meanwhile, different research methods are adopted to comprehensively study the distribution, causes, and impacts of EP at different spatial and temporal scales, among which the Mann–Kendall test and wavelet analyses can better reflect the trend of EP and have been used in many studies [32,33,34,35].
Due to the large differences in climatic conditions and topography in different regions, which cause EP to vary greatly, it is particularly urgent to select a region with practical representative significance to study the distribution characteristics of EP. The Yunnan-Guizhou plateau region (YGPR) is located in southwestern China and belongs to the low-latitude plateau, with a complex topography, significant karst landscapes, rich ecological diversity, and fragile ecological system [36]. In recent years, abnormal climate change and frequent EP have led to a series of natural disasters such as drought, landslides, floods, and mudslides [37], which brought about a huge impact on the local ecological environment, agricultural production, and the production and livelihood of local people. It is important to research the characteristics of the spatial and temporal distribution of EP and the influencing factors in the study area. However, the prior research results for EP in the study area are less available and different from the other regions. Wang et al. [38] and Yan et al. [37] found that EP in the study area shows a significant increasing trend, that the mutation characteristics and the overall distribution pattern are marked by more in the South and less in the North, and that EP is affected by altitude and the South Asian summer winds. The region is a sensitive area for climate change due to its complex topography and ecological environment, so further research on the characteristics and attribution of EP distribution using the latest information and multiple extreme precipitation index (EPI) systems is very necessary.
Therefore, we chose the YGPR as the study area and adopted 11 EPIs to analyze the spatial and temporal variation characteristics of EP and explore the influences of topographic factors and atmospheric circulation factors on EP, based on the daily precipitation data from 1960–2020 at 83 stations. This study can provide a scientific basis for the protection of ecological resources, the prevention of meteorological disasters, and the guidance of agricultural production in study area, as well as a certain reference for the response study of EP events to global warming.
2. Study Area
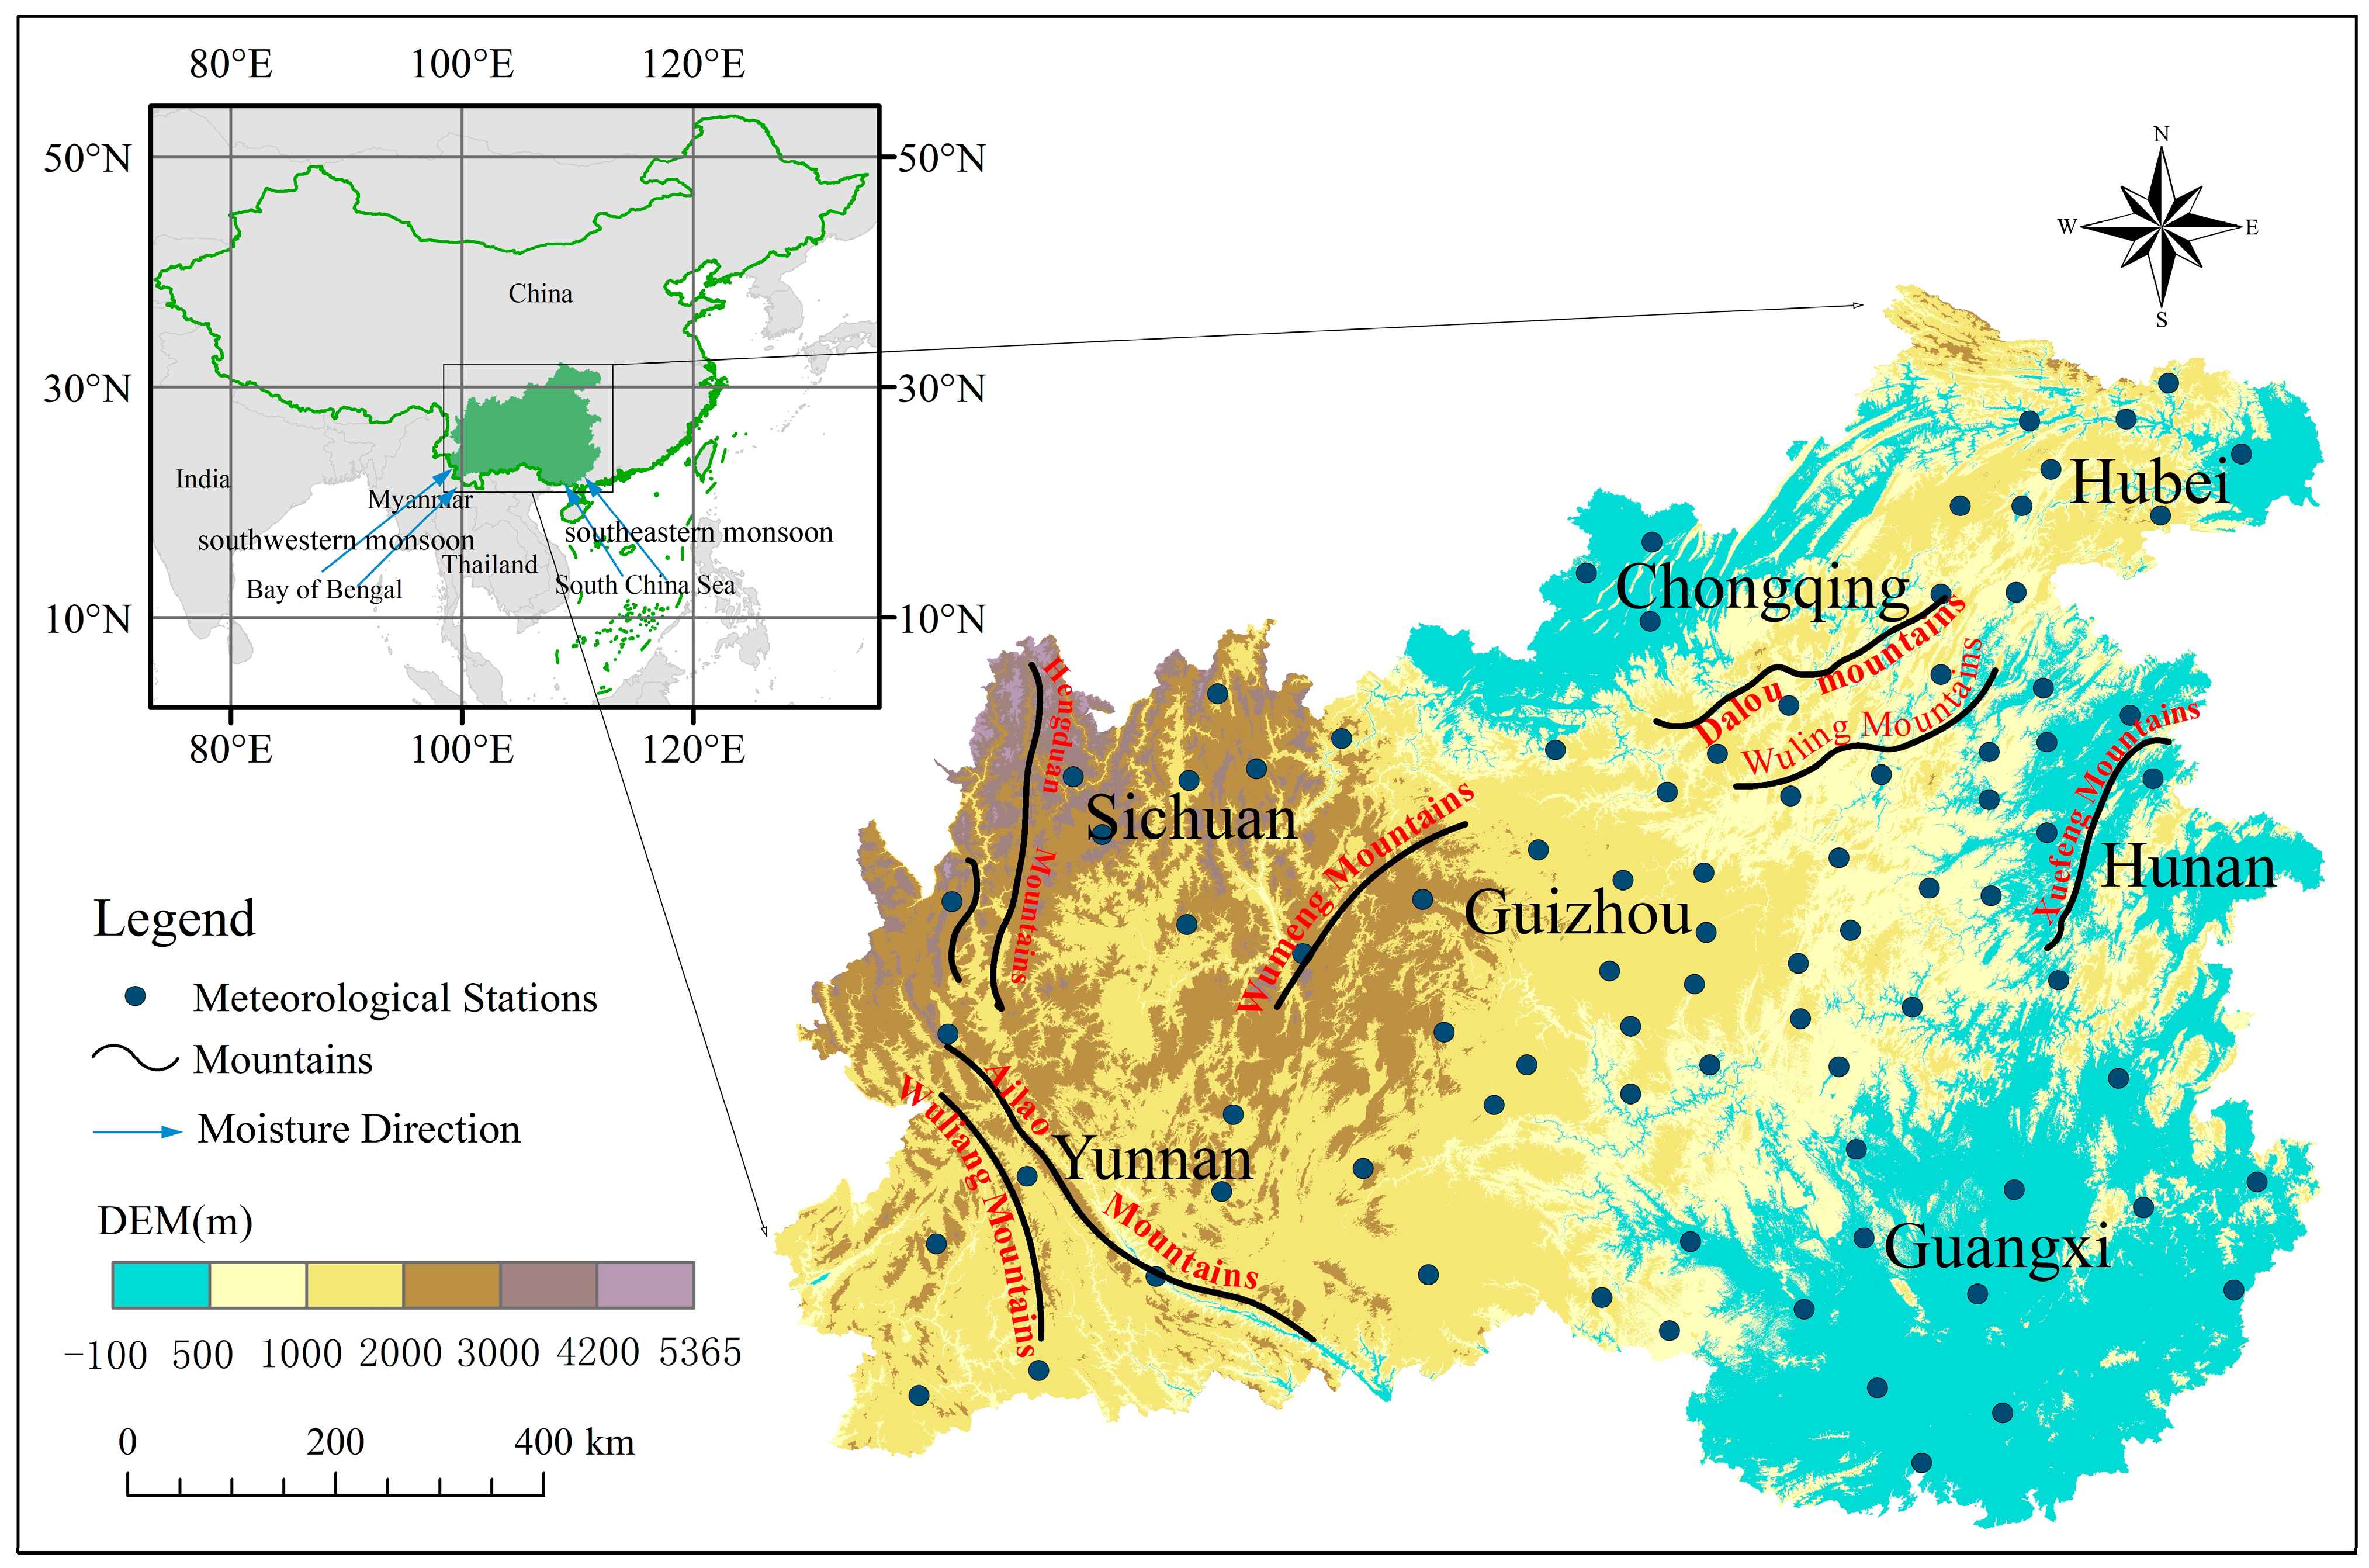
The YGPR ranges between 100°~111° E and 22°~30° N (Figure 1) and is located at the intersection of two groups of mountain ranges running north-south and northeast-southwest in southwest China, bordering the Qinghai-Tibet Plateau to the west, the South China Peninsula and the South China Sea to the south, the Sichuan Basin to the north, and the Central and South China regions to the east. The study area has different landforms, such as plateaus, mountains, and hills, and the terrain is very complex. It is one of the most developed typical areas of karst landforms in the world, and one of the most complex areas of terrain and landforms in China, with high terrain in the northwest and low terrain in the southeast, at an altitude of about 400–3500 m. Located in the upper reaches of the Yangtze River, the YGPR is situated on a low-latitude plateau and belongs to the humid subtropical zone, a climate change-sensitive area dominated by the subtropical monsoon climate, with obvious dry and wet seasonal characteristics. Under the combined influence of two major monsoonal circulations in East Asia and South Asia, moisture in the YGPR is mainly transported by southwesterly moisture from the Bay of Bengal and southeasterly moisture from the South China Sea [39], making the uneven spatial and temporal distribution of precipitation in the region. Coupled with the effect of atmospheric circulation such as subtropical high pressure in the western Pacific, the distribution pattern of EP in the region is very complex [21]. Due to the complex topography and atmospheric circulation, the climate in the region varies greatly, with concentrated rainfall during the flood season and frequent weather extremes, making the region prone to natural disasters such as floods, landslides, and mudslides. The frequent occurrence of natural disasters poses the greatest threat to the local ecological environment, agricultural production, and the productive lives of local people.
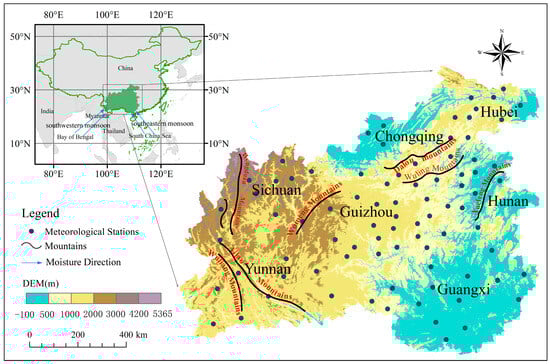
Figure 1.
Spatial distribution of meteorological stations in the study area.
3. Data and Methods
3.1. Data
The data used in this study are derived from the daily precipitation data from ground-based meteorological stations in the YGPR provided by the National Meteorological Information Centre of the China Meteorological Data Network (https://date.cma.cn/, (accessed on 8 September 2023)), with data series from 1960 to 2020. Some of the station data are missing due to historical or other reasons. To ensure the integrity and consistency of the data, it is necessary to screen the stations. The screening criteria are: stations with discontinuous data due to station relocation were removed; stations with more than three consecutive days of missing measurements were removed; and stations with no more than three consecutive days of missing measurements were made up using equal interpolation of the adjacent station [38]. Based on the above criteria, 61 years of data for 83 ground-based meteorological stations in the YGPR were selected. These stations can represent the local climate characteristics of study area, with the relatively uniform distribution and the sufficient operating time. The distribution of stations in the study area is shown in Figure 1. After checking the availability of the data, the Rclimdex model was used to quality control the data to ensure its reliability.
This study selects 11 representative atmospheric circulation indices to explore the relationship between atmospheric circulation and EPIs. The selected atmospheric circulation indices include Arctic Oscillation (AO: https://www.cpc.ncep.noaa.gov/, (accessed on 8 September 2023)), North Atlantic Oscillation (NAO: http://lijianping.cn/dct/page/1, (accessed on 8 September 2023)), Pacific Decadal Oscillation (PDO: https://psl.noaa.gov/data/correlation/pdo.data, (accessed on 8 September 2023)), Multivariate ENSO Index (MEI: https://psl.noaa.gov/enso/mei/, (accessed on 8 September 2023)), Southern Oscillation Index (SOI: https://psl.noaa.gov/gcos_wgsp/Timeseries/SOI/, (accessed on 8 September 2023)), Indian Sub-High Area Intensity Index (ISHII: http://cmdp.ncc-cma.net/cn/index.htm, (accessed on 8 September 2023)), South China Sea Sub-High Intensity Index (SCSSHII: http://cmdp.ncc-cma.net/cn/index.htm, (accessed on 8 September 2023)), West Pacific Sub-High Intensity Index (WPSHII: http://cmdp.ncc-cma.net/cn/index.htm, (accessed on 8 September 2023)), East Asian Summer Monsoon Index (EASMI: http://lijianping.cn/dct/page/1, (accessed on 8 September 2023)), South Asian Summer Monsoon Index (SASMI: http://lijianping.cn/dct/page/1, (accessed on 8 September 2023)), and South China Sea Summer Monsoon Index (SCSSMI: http://lijianping.cn/dct/page/1, (accessed on 8 September 2023)).
3.2. Methods
3.2.1. Definition and Calculation of EPIs
In this study, 11 EPIs defined by the World Climate Research Program (WCRP) Climate Variability and Predictability and Climate Risks (CLIVAR) Expert Team on Climate Change Detection and Indices (ETCCDI) were used to study the EP characteristics of the study area, as shown in Table 1. These indicators are widely used in the study of extreme climate change characteristics as they can reflect changes in the intensity, frequency, and duration of extreme climate events, as well as reflecting weak extremes, low noise, and high salience [40,41]. The EPIs for each site were calculated using the Rclimdex model based on the R language [42]. Of the 11 indices, R95P, R99P, RX1, RX5, and SDII focus on extreme heavy precipitation (EHP) characteristics, CDD mainly reflects extreme drought (ED) situations, CWD and R10 also characterize a certain degree of drought, and R20, R25, and PRCPTOT mainly reflect total annual precipitation.

Table 1.
Definition of EPIs.
3.2.2. Mann–Kendall Trend Test and Sen’s Slope
The trend test is usually used to detect whether the changes of meteorological elements show upward or downward trends over a long period of time. It mainly includes parametric and non-parametric tests, of which the non-parametric test can more easily identify the trend presented by the time series. The commonly used non-parametric tests are the Mann–Kendall test [43,44], Spearman’s rho test [45], and Onyutha test [46]. The Mann–Kendall test is the most commonly used method recommended by WMO to study the monotonic trend of hydrological series. This study employed Mann–Kendall test for trend analysis of EPI and Sen’s slope estimation method [47] for the slope estimation of EPI in the study area. The specific methods are as follows:
Given a set of time series x = (x1, x2, ......, xn), Sen’s slope is calculated as:
where 1 < j < I < n, xi, and xj are the elemental values (EPI) corresponding to moments i and j. sen > 0 indicates an upward trend in the series and vice versa.
The Mann–Kendall trend test requires a constructor statistic of:
xi and xj are sample data values, respectively, and n is the sample length. The statistic Z > 0 indicates that the sequence has an upward trend, and Z < 0 a downward trend. The larger |Z| means the more obvious trend. Given the significance level α, if |Z| > Z1−α/2, it means that the sequence passed the significance level test, and the trend is significant. This study chose the significance level of α = 0.05, and the corresponding Z1−α/2 is 1.96.
3.2.3. Mann–Kendall Mutation Test
Climate variability is a discontinuity in the variability of meteorological elements, and the Mann–Kendall variability test [43,44] is a commonly used method recommended by the WMO for analyzing trends in meteorological elements and points of variability [22]. In this study, a non-parametric statistical test, the Mann–Kendall mutation test (M-K), is used to test for sudden changes in EP. The M–K mutation test is calculated as follows:
For a time series with n sample sizes x1, x2, ..., xn, an order series are constructed:
where xi and xj are the element values (EPI) at moments i and j, respectively; ri is the number of element values greater than the element value at moment i; and the order column Sk is the cumulative number of element values greater than the element value at moment i.
Under the assumption of random independence of the time series, the statistic is defined:
where UF1 = 0, E(Sk) and Var(Sk) are the mean and variance of the cumulative count Sk, respectively. When x1, x2, ..., xn are independent of each other and have the same continuous distribution, they can be calculated by the following equation:
UFk is a series of statistics calculated by time series x1, x2, ..., xn, and the UFk sequence is reversed to obtain UBk. The UFk and UBk are plotted as curves, generally taking a significance level of α = 0.05 and a critical value of U0.05 = ±1.96. If UFk (UBk) > 0, it means that the sequence is on an upward trend and vice versa. The extent to which the curve exceeds the critical line is determined as the time region where the mutation occurs. If the UFk and UB curves intersect between the critical lines then the moment corresponding to the intersection is the time at which the mutation begins [22].
3.2.4. Continuous Wavelet Analysis
Wavelet analysis has multi-resolution analysis features and the ability to characterize signals in time and frequency. Continuous wavelet analysis has great merit in signal extraction, revealing the periodic features in the signal [48]. In this study, continuous wavelet analysis is used for the EPI periodic analysis, in which the mother wavelet function is the Morlet wavelet commonly used in the field of hydrometeorology [49].
The continuous wavelet variation of the time series X = (x1, x2, …, xn) is.
where s is the systolic scale, “*” denotes the complex conjugate, δt is the time step, N is the number of wavelet calculations, n′ is the time step corresponding to the number of calculations, and is the wavelet power spectrum.
3.2.5. Kriging Interpolation
The Kriging interpolation method, also known as spatial location interpolation, is one of the most commonly used statistical interpolation methods for unbiased optimal estimation within a limited area based on the variational function and structural analysis. It is able to respond to the accurate spatial distribution characteristics and has been widely used in spatial analysis in various industries [37]. This paper adopts the Kriging interpolation method based on the ArcGIS10.6 platform to spatially interpolate the multi-year average of EPIs for each station in the study area to analyze the spatial distribution characteristics of EP.
3.2.6. Cross Wavelet Transform (XWT) and Wavelet Coherence (WTC)
The crossed wavelet transform is a new signal analysis technique that combines wavelet transform and crossed spectral analysis to investigate the stronger interrelationship between two-time series in the time and frequency domains [48,50]. For two time series, Xn and Yn, the cross wavelet transform (XWT) between them is.
WnX(s) and WnY(s) are wavelet transforms of the time series X and Y, respectively; is the complex conjugate of WnY(s), and is the power spectrum of the cross wavelet transform.
Wavelet coherence (WTC) characterizes the degree of coherence between the wavelet transforms of two-time series in the time and frequency domains [51], and can be considered as the degree of correlation between two-time series in the time and frequency domains, as defined below:
S is the smoothing operator and Rn2 is between 0 and 1. The closer Rn is to 1, the stronger the correlation between the two sequences.
This study uses XWT and WTC to analyze the shared periodic characteristics and interrelationships of EPIs in the study area in response to atmospheric circulation mechanisms, respectively.
3.2.7. R/S Analysis
R/S analysis is a method proposed by the British hydrologist H.E. Hurst [52] in his solution to the Nile dam problem and is commonly used to analyze the fractal characteristics of time series and long-term memory processes. The method is as follows:
Given a time series {x(t)}, t = 1, 2, ..., n, for any positive integer , a mean series is constructed:
Cumulative deviation series:
Extreme difference R(τ) series:
Standard deviation S(τ) series:
For , if there exists , then the Hurst phenomenon exists for the time series {x(t)}; H is the Hurst index and the fractal dimension D = 2 − H. The persistence and inverse persistence of the trend of the time series is judged according to H and D. If 0 < H < 0.5 and D > 1.5, it means that the trend of the time series is anti-continuous, and the smaller the value of H, the stronger the anti-continuity; if H = 0.5 and D = 0.5, it means that the time series are independent of each other; if 0.5 < H < 1 and D > 1.5, it means that the trend of the time series has continuity, and the larger the value of H, the stronger the continuity; if H = 1 and D = 1, it means that the time series is a perfectly correlated series [53].
4. Results and Analysis
4.1. Temporal Variability of EP Characteristics
4.1.1. Trend Analysis of EP
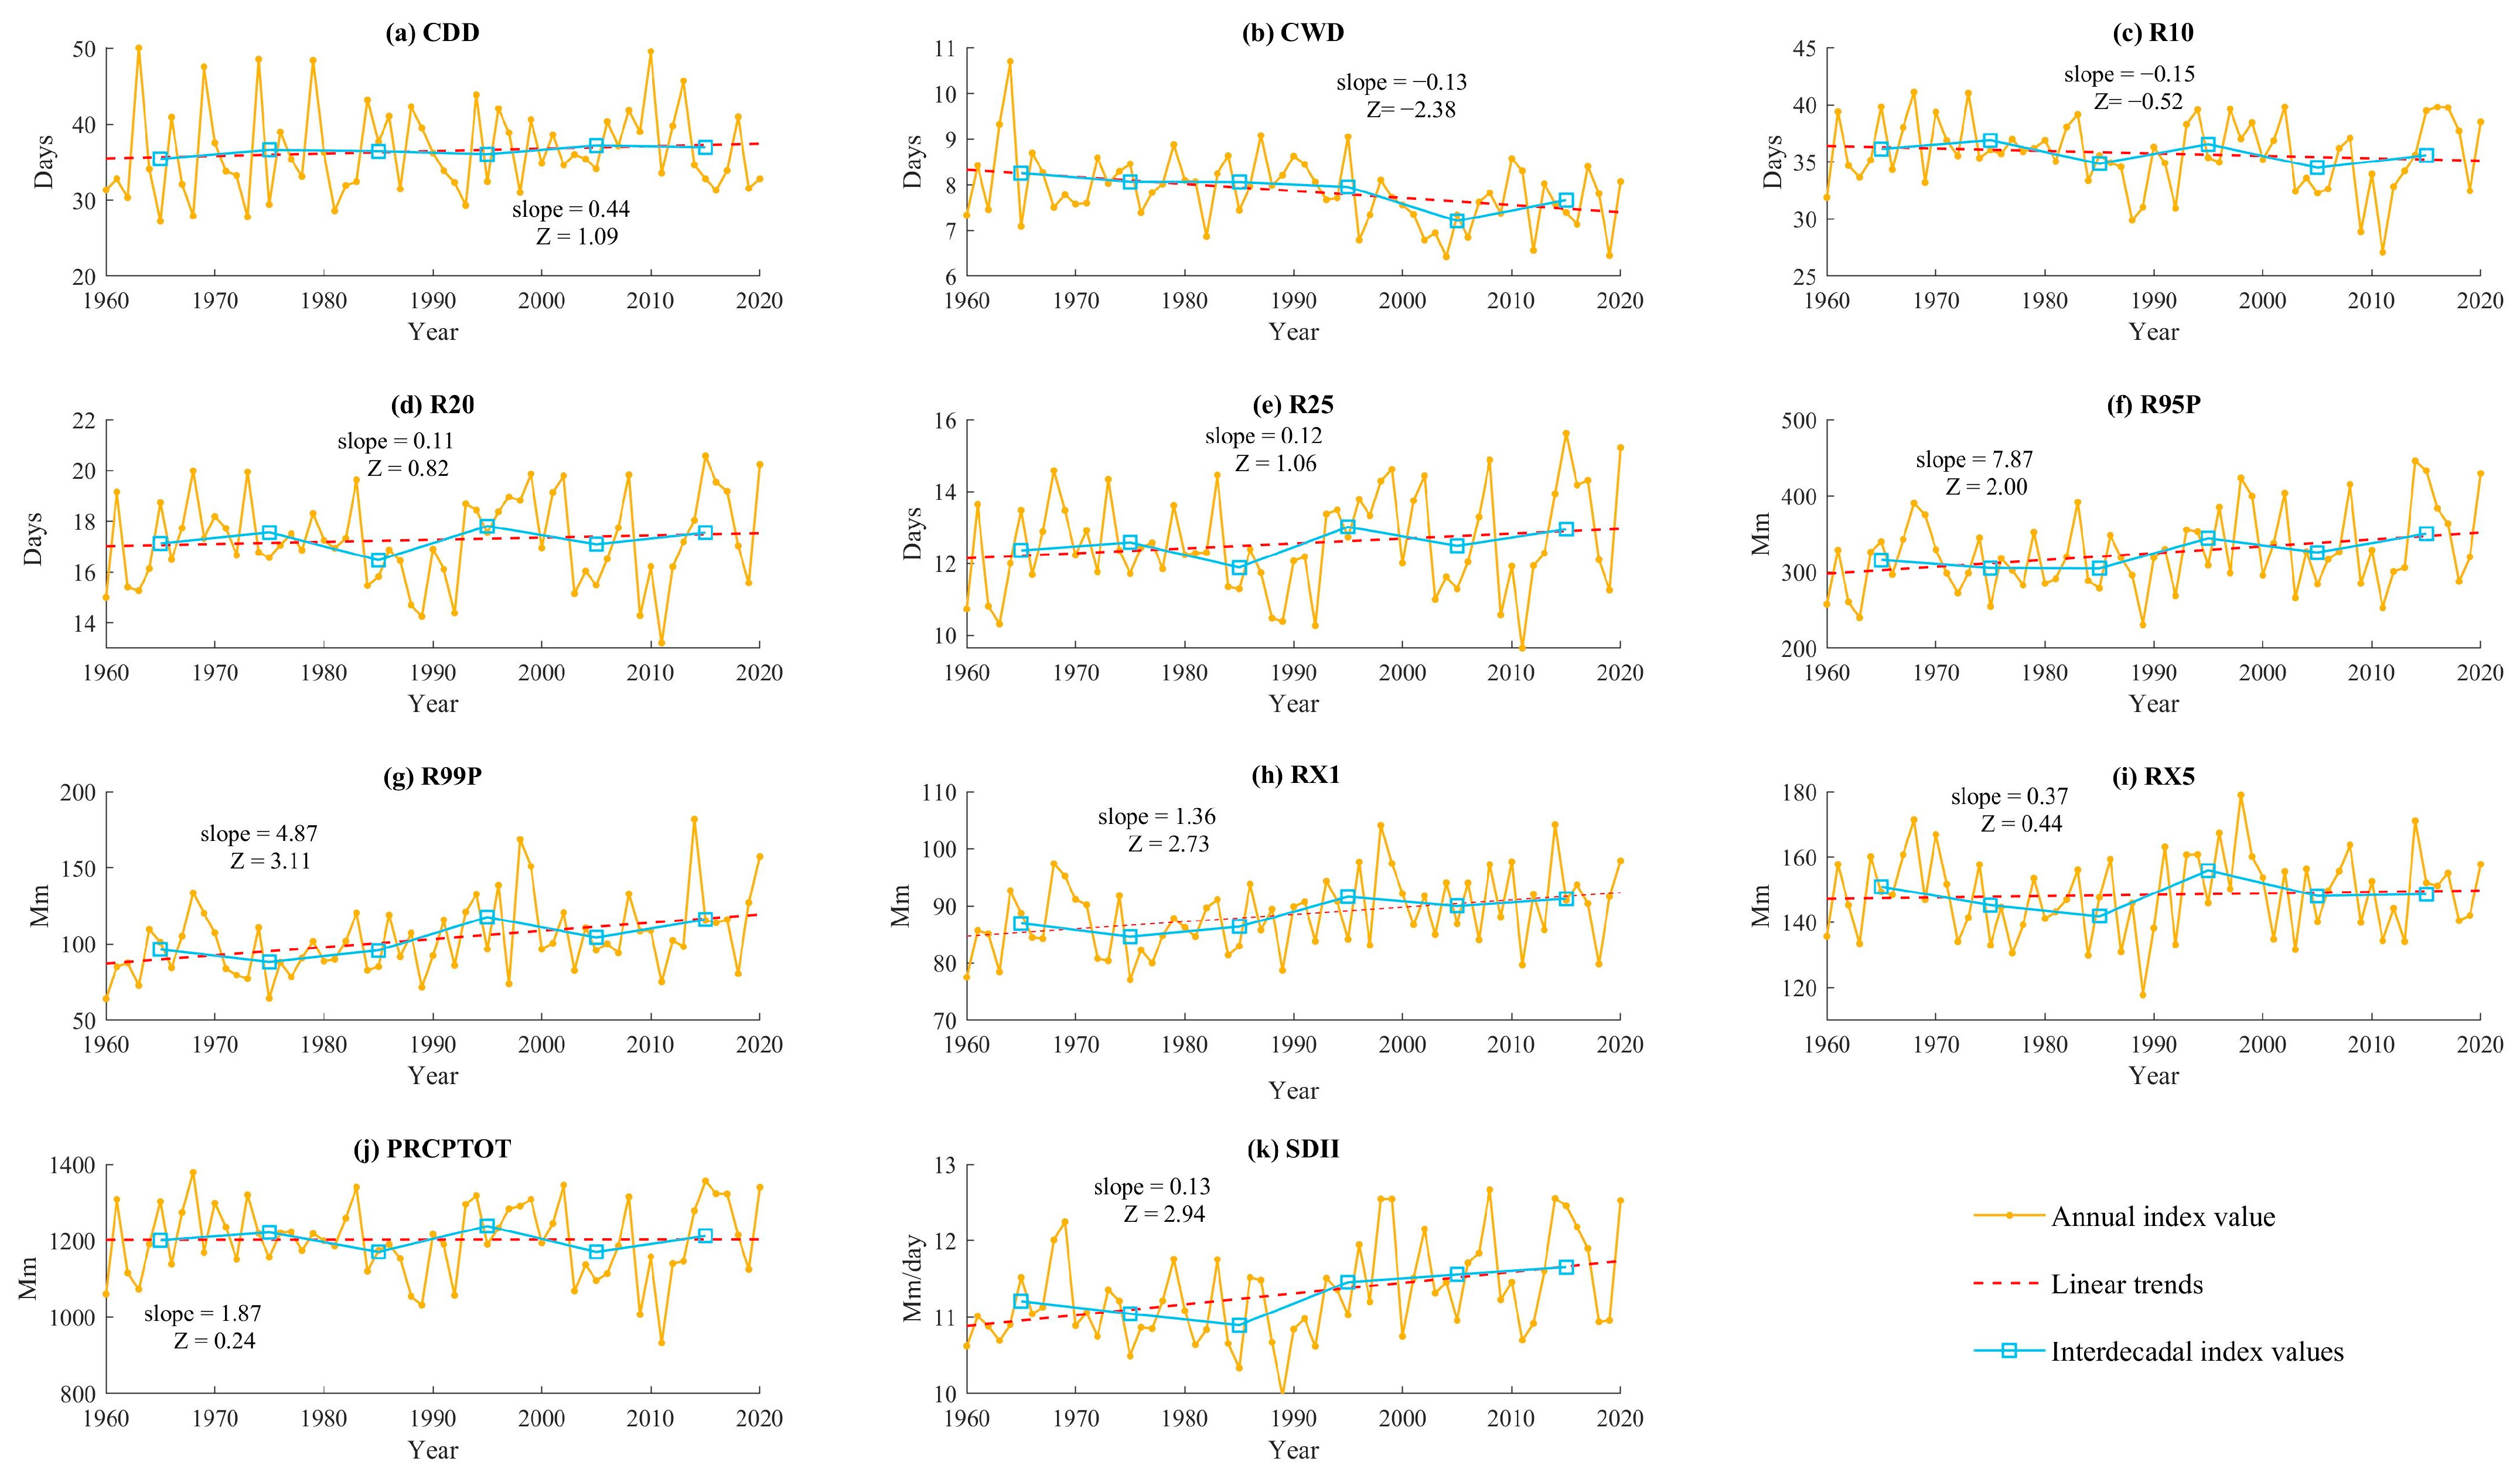
The interannual trends of EP in the YGPR from 1960–2020 are shown in Figure 2. EP showed an overall upward trend, and all indices, except CWD and R10, showed different degrees of upward trend. Moreover, CWD, R95P, P99P, RX1, and SDII produced significant changes at the significance level of 0.05. Specifically, the number of continuous dry days (CDD) significantly increased, with a trend of 0.44 days/10a and with a large value of 49.6 days in 2010. The number of continuous wet days (CWD) and the number of precipitation days greater than 10mm (R10) declined slightly, with a trend of −0.13 days/10a and −0.15 days/10a, respectively. The above three indices indicate that the number of dry days slightly increased. Wet day precipitation (PRCPTOT) and simple daily intensity (SDII) showed an increasing trend of 1.87 mm/10a and 0.12 mm/day/10a, respectively, further indicating an insignificant trend in the degree of drought. The number of precipitation days greater than 20 mm (R20) and the number of precipitation days greater than 25 mm (R25) show an increasing tendency of 0.11 days/10a and 0.12 days/10a, respectively, both with a minimum around 2010 and a maximum in 2015. Very wet days (R95P), extremely wet day (R99P), maximum one-day precipitation (RX1), and maximum five-day precipitation (RX5) all show the increasing trends with trends of 7.87 mm/10a, 4.87 mm/10a, 1.36 mm/10a, and 0.37 mm/10a, respectively, which are all larger values in 1998 and 2014, indicating an enhancement of heavy and very heavy precipitation in the region. The overall drought degree in the study area did not change significantly, but the number of drought days increased. The precipitation concentration increased, with an increase of the total precipitation amount, the number of precipitation days, and the amount of heavy precipitation.
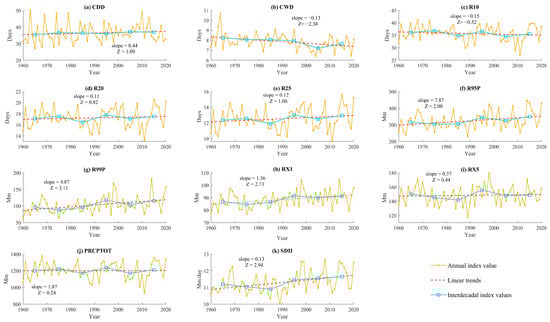
Figure 2.
Map of EP temporal trend based on 11 indices (including annual and interdecadal trends) The slope is obtained from the Sen’s slope and |Z| > 1.96 indicates that the series passes the 0.05 significance level test.
Table 2 shows the interdecadal variation of EP in the study area since 1960. From Figure 2 and Table 2, it can be seen that CDD has shown an upward trend since the 1960s, peaking in the early 2010s; CWD and R10 show a fluctuating downward trend throughout the study period, with a trough in the early 2010s. PRCPTOT is similar to R20 and R25. They show a fluctuating upward trend since 1960 and peaks in the 1990s and mid-2010s, respectively, i.e., a double peak in the time series, which indicates that annual precipitation is mainly influenced by the number of days of moderate and heavy rainfall. The changes in R95, R99, RX1, and RX5 are consistent, with an upward trend starting in the 1960s and peaking in the 1990s and the 2010s. SDII showed a downward trend from 1960 to 1990 and an upward trend from 1990 onwards, with a peak in the 2010s. Overall, EP trends are generally consistent on both an interdecadal and interannual basis.
Table 2.
EPIs for different inter-decadal periods.
In summary, the EP shows an overall trend of gradual enhancement in the study area. ED shows an increasing trend, EHP is enhanced, and EP events mostly originate from single-day strong, EHP, or continuous precipitation. The precipitation indices, except for CDD and CWD, were found to have peaks in the 1990s and the 2010s, which meant the concentration of heavy precipitation and frequent flooding. According to the survey data, China experienced mega floods that caused huge casualties and property losses in 1998 and 2016, and Guanxi and Guizhou provinces within the YGPR also had several big floods in 2020 [54]. Such drastic changes in EP may be influenced by strong El Niño events [19]. With the intensification of human activities, greenhouse gas emissions from increased industrial activities and large-scale urban land use could be the cause of enhanced precipitation. The number of drought days in the YGPR reached a large value in 2010 and drought occurred in China in the same year, with the most severe drought in the southwest [55].
4.1.2. Analysis of Abrupt Changes in EP
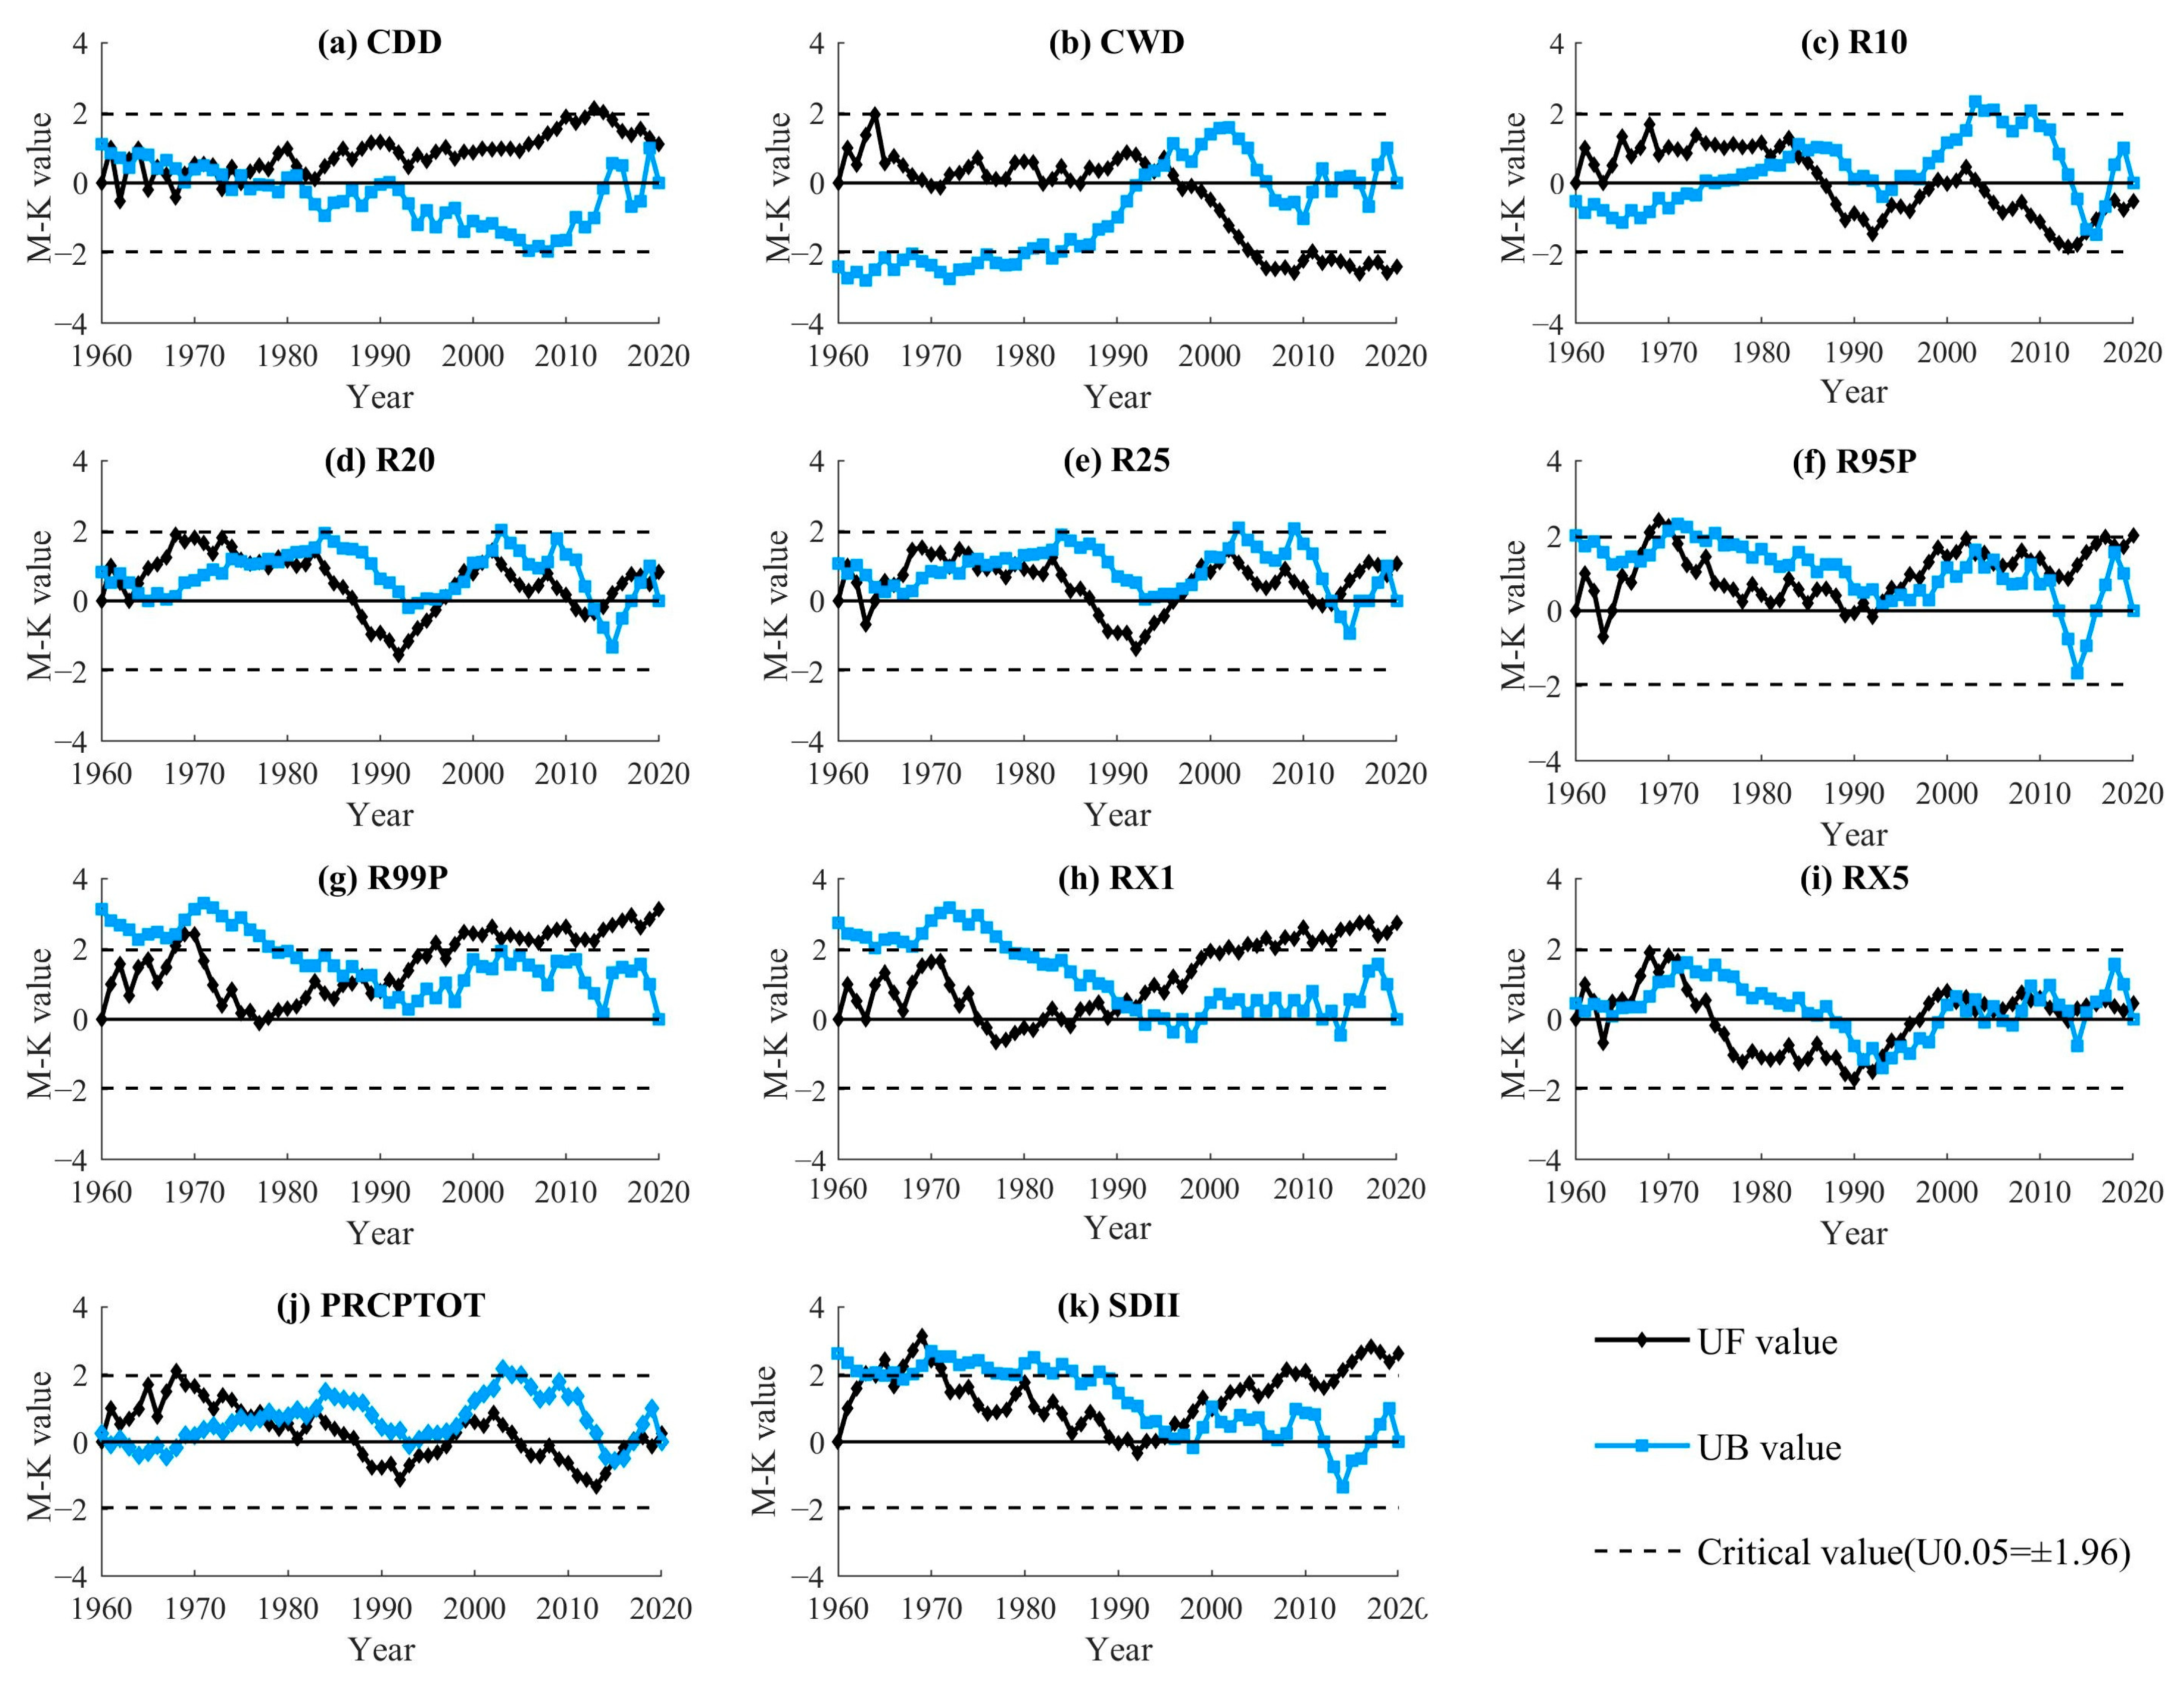
Figure 3 and Table 3 show the results of Mann–Kendall mutation test for the EPI of 1960–2020. There were no significant abrupt changes in CDD, with a steady upward trend overall. CWD mutated in 1994 and the post-mutation UF curve exceeds the 0.05 significance level line, indicating a more pronounced downward trend after the mutation than before. The abrupt change in R10 occurred around 1984, with a trend from increasing to decreasing; the UF curve lies within the 0.05 significance level lines with an insignificant trend. R20 and R25, reflecting the number of days of rainfall during the year above moderate and heavy rainfall, respectively, both showed abrupt changes in 1997 and 1998, with the trend change from increasing to decreasing after the first abrupt change and from decreasing to increasing after the second abrupt change, but with an overall upward trend. R95P, R99P, RX1, and RX5 reflect EHP. The first three indicators all have one abrupt change point, which occurred in 1993, 1990, and 1990, respectively, and their abrupt changes are relatively close to each other in time, especially R99P and RX1, with the same abrupt change time. However, the UF curve exceeds the significance level of 0.05 after abrupt change, which indicates that the upward trend after abrupt change is more obvious. RX5 was abruptly changed in 1972 and 1993, with the abrupt changes from rising to falling and from falling to rising, respectively, but RX5 performed an overall upward trend. The mutation characteristics of PRCPTOT are more similar to those of R20 and R25, with the mutation points occurring in 1977. The abrupt change of SDII appeared in 1995, showing a more obvious upward trend after the abrupt change than before.

Figure 3.
M–K mutation test curves for EPIs time series. The dashed line indicates the 0.05 significance level line; UF, the ordinal statistic of the EPI time series, and UB, the inverse ordinal statistic.
Table 3.
Year of abrupt change in EPIs.
The analysis of R20, R25, R95P, R99P, RX1, RX5, and SDII shows that the abrupt changes of EHP occurred mainly between 1990 and 2000, with no abrupt changes after 2000 and an increasing upward trend after the abrupt changes, which is similar to the research results of Wang [38]. Ban [56] found that the average temperature of the YGPR underwent a significant warming abrupt change in 1990, as with the abrupt change time of EHP, which may mean that the significant changes in EHP might have been influenced by the average temperature.
4.1.3. Periodic Analysis of EP
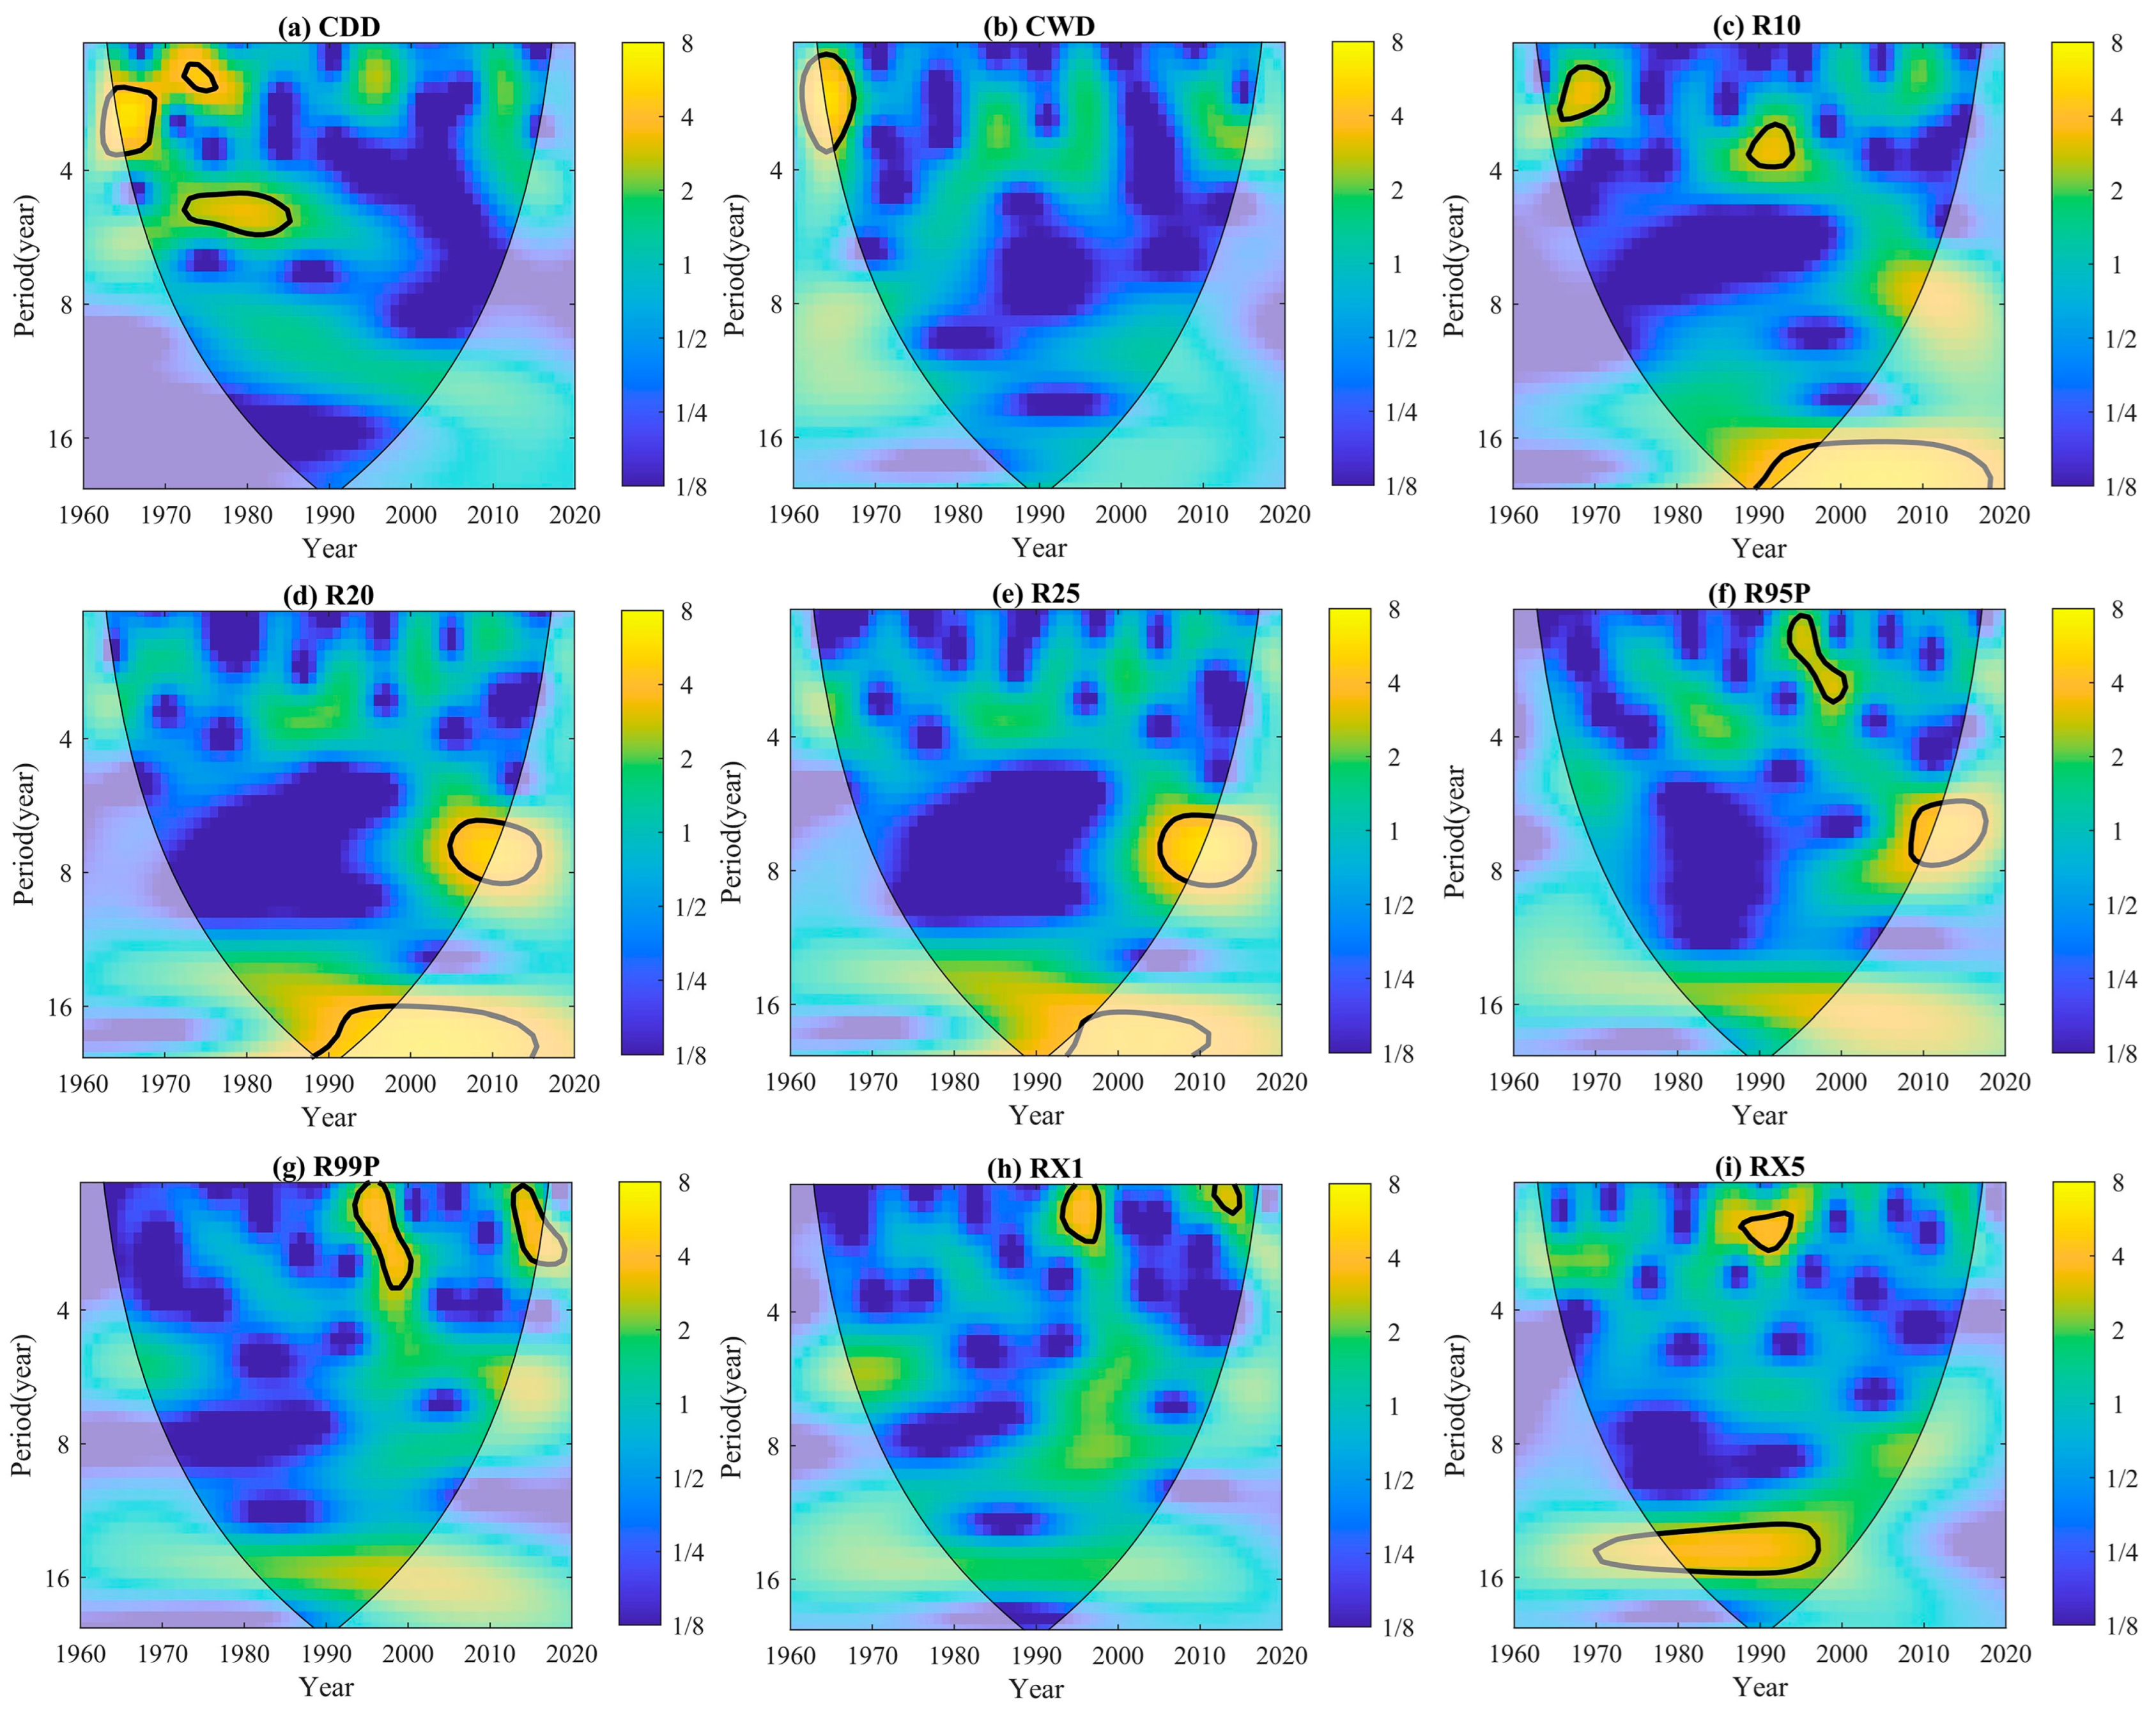
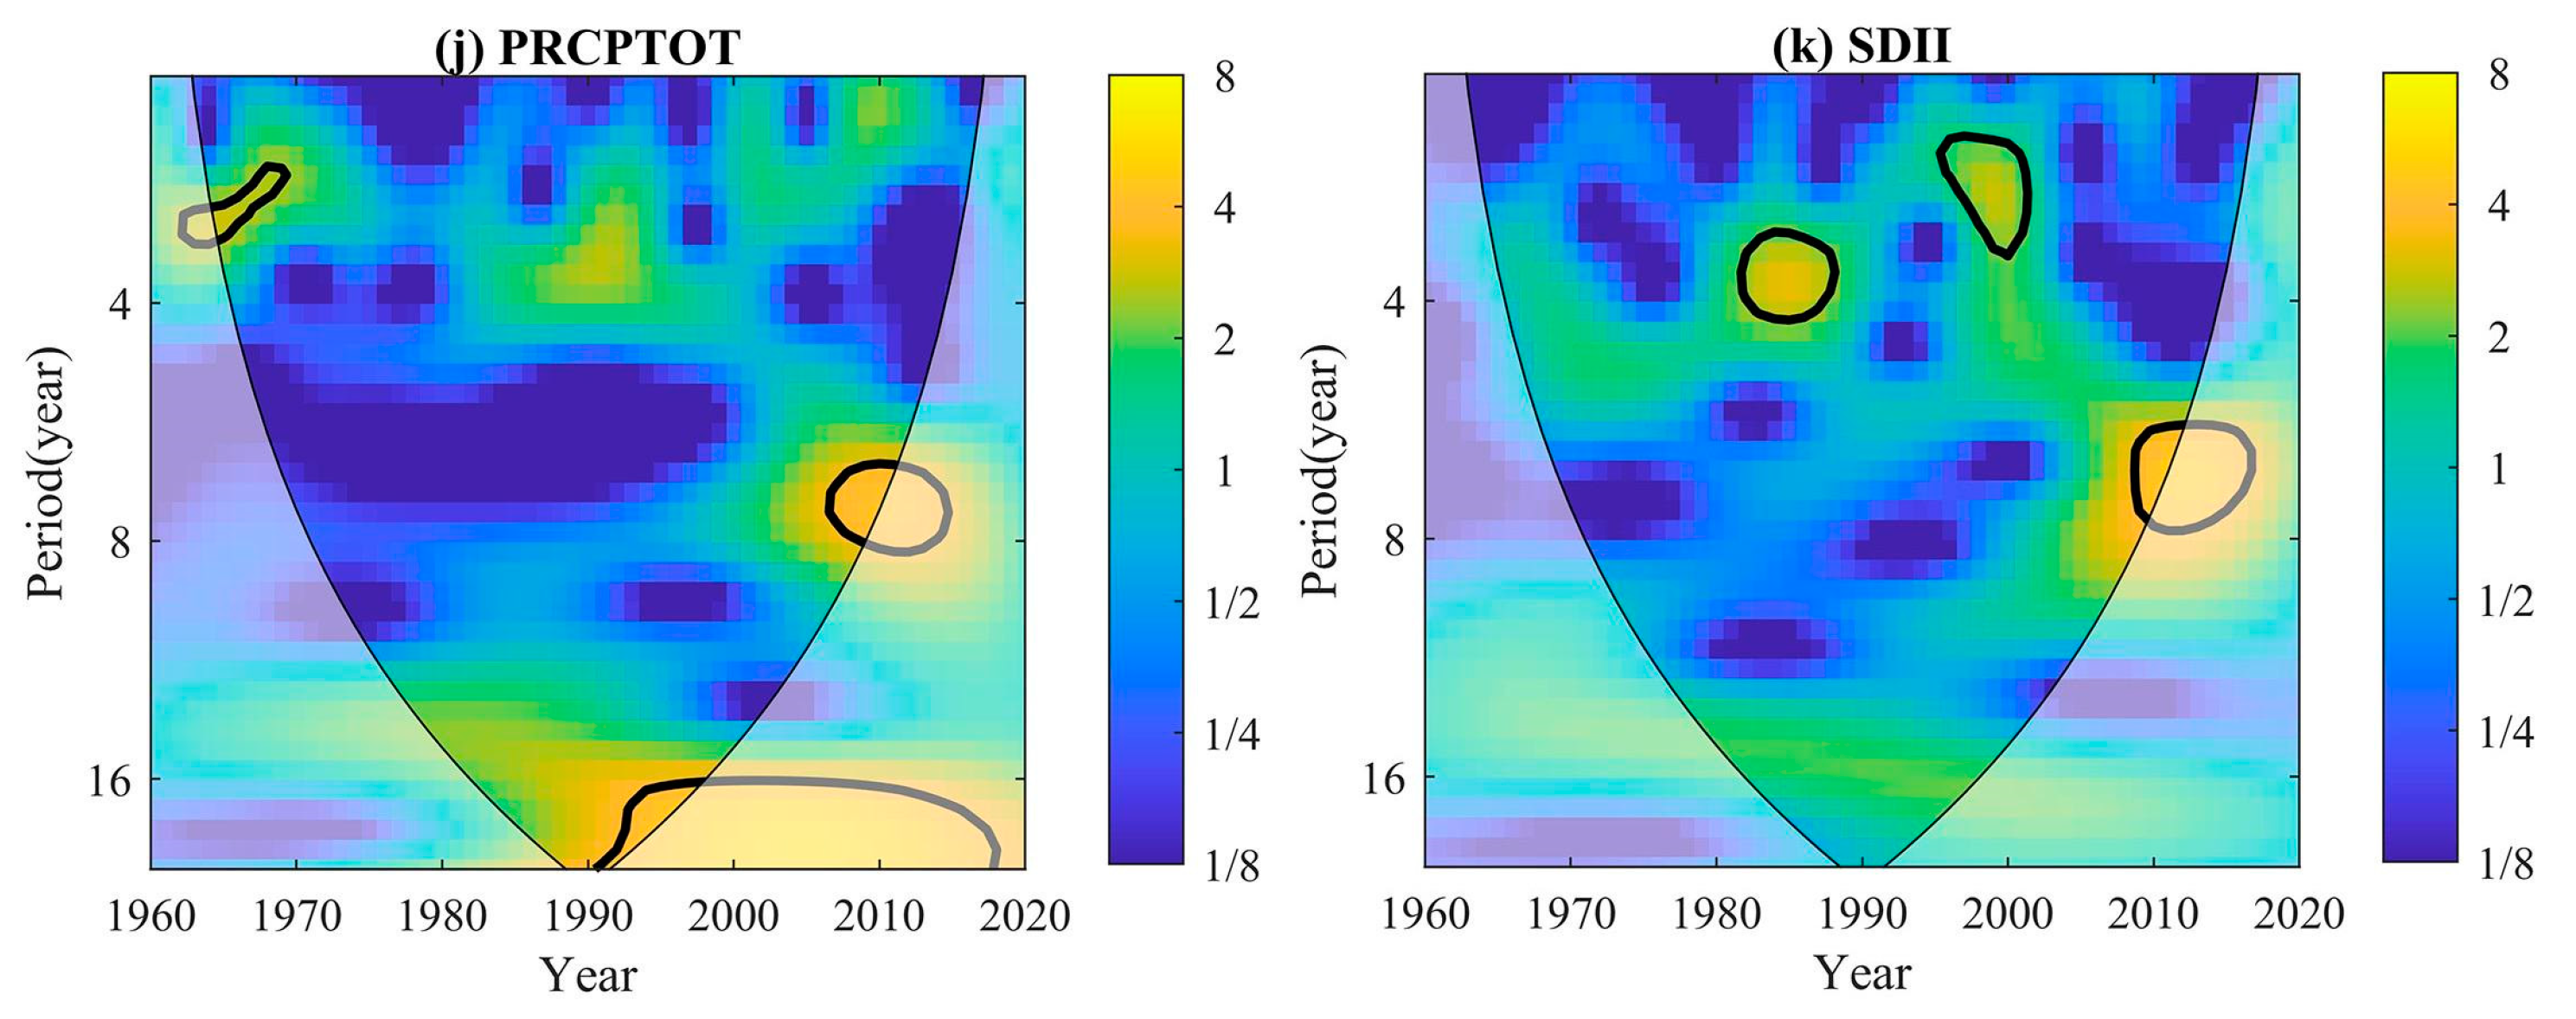
Figure 4 shows the wavelet periods of the 11 EPIs in the YGPR from 1960 to 2020. At the 95% confidence level, all 11 EPIs have a clear periodic character. CDD has a strong period of 2–4 years (1964–1975) and a weak period of 4–8 years (1973–1985). CWD has a significant period of 2–4 years (1963–1968). The R10 has three indirect periods of two 2–4 years periods (1966–1971, 1988–1994) and one period of around 16 years (1989–1997). The periods of R20 and R25 are similar, both having a period of around 8 years (2000–2012). R95P has periods of 2–4 years (1990–2001) and 4–8 years (2007–2012); R99P and RX1 both have periods of 2–4 years (1990–2001, 2012–2017), which is consistent with the findings of Xia et al. [36]; RX5 has periods of 2–4 years (1988–1995) and 8 years (1978–1998); PRCPTOT has three periods of 2–4 years (1964–1969), 16 years (1990–2000) and 4–8 years (2000–2011); SDII has three periods of 2–4 years (1980–1988, 1995–2002) and a period of around 8 years (2008–2012).
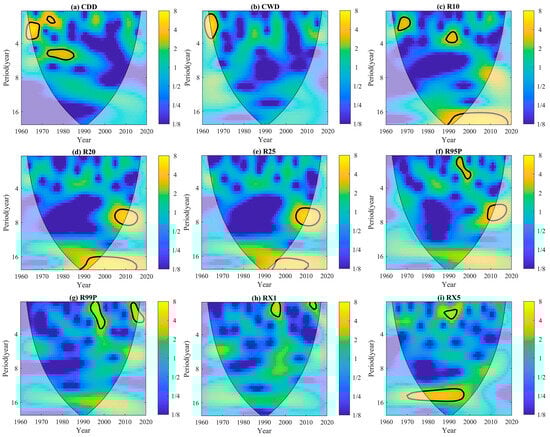

Figure 4.
Continuous wavelet power spectrum of EPIs in the YGPR, 1960–2020. The x-axis represents the position of the wavelet in time, the y-axis represents the period of the wavelet, the area with the thick black outline indicates that it passes the 95% confidence test, the vertical colored bar on the right represents the period strength, and the black curve is the cone of influence.
The synthesis shows that the indices, R95P, R99P, RX1, RX5, and SDII, characterizing EHP in the study area show a clear periodic character of 2–4 years in the 1990s and about 8 years in the last 20 years, and insignificant periodic character in the other periods; the indices characterizing ED show a period character of 2–4 years in the 1960s and insignificant in the other periods.
4.2. Spatially Variable Characteristics of EP
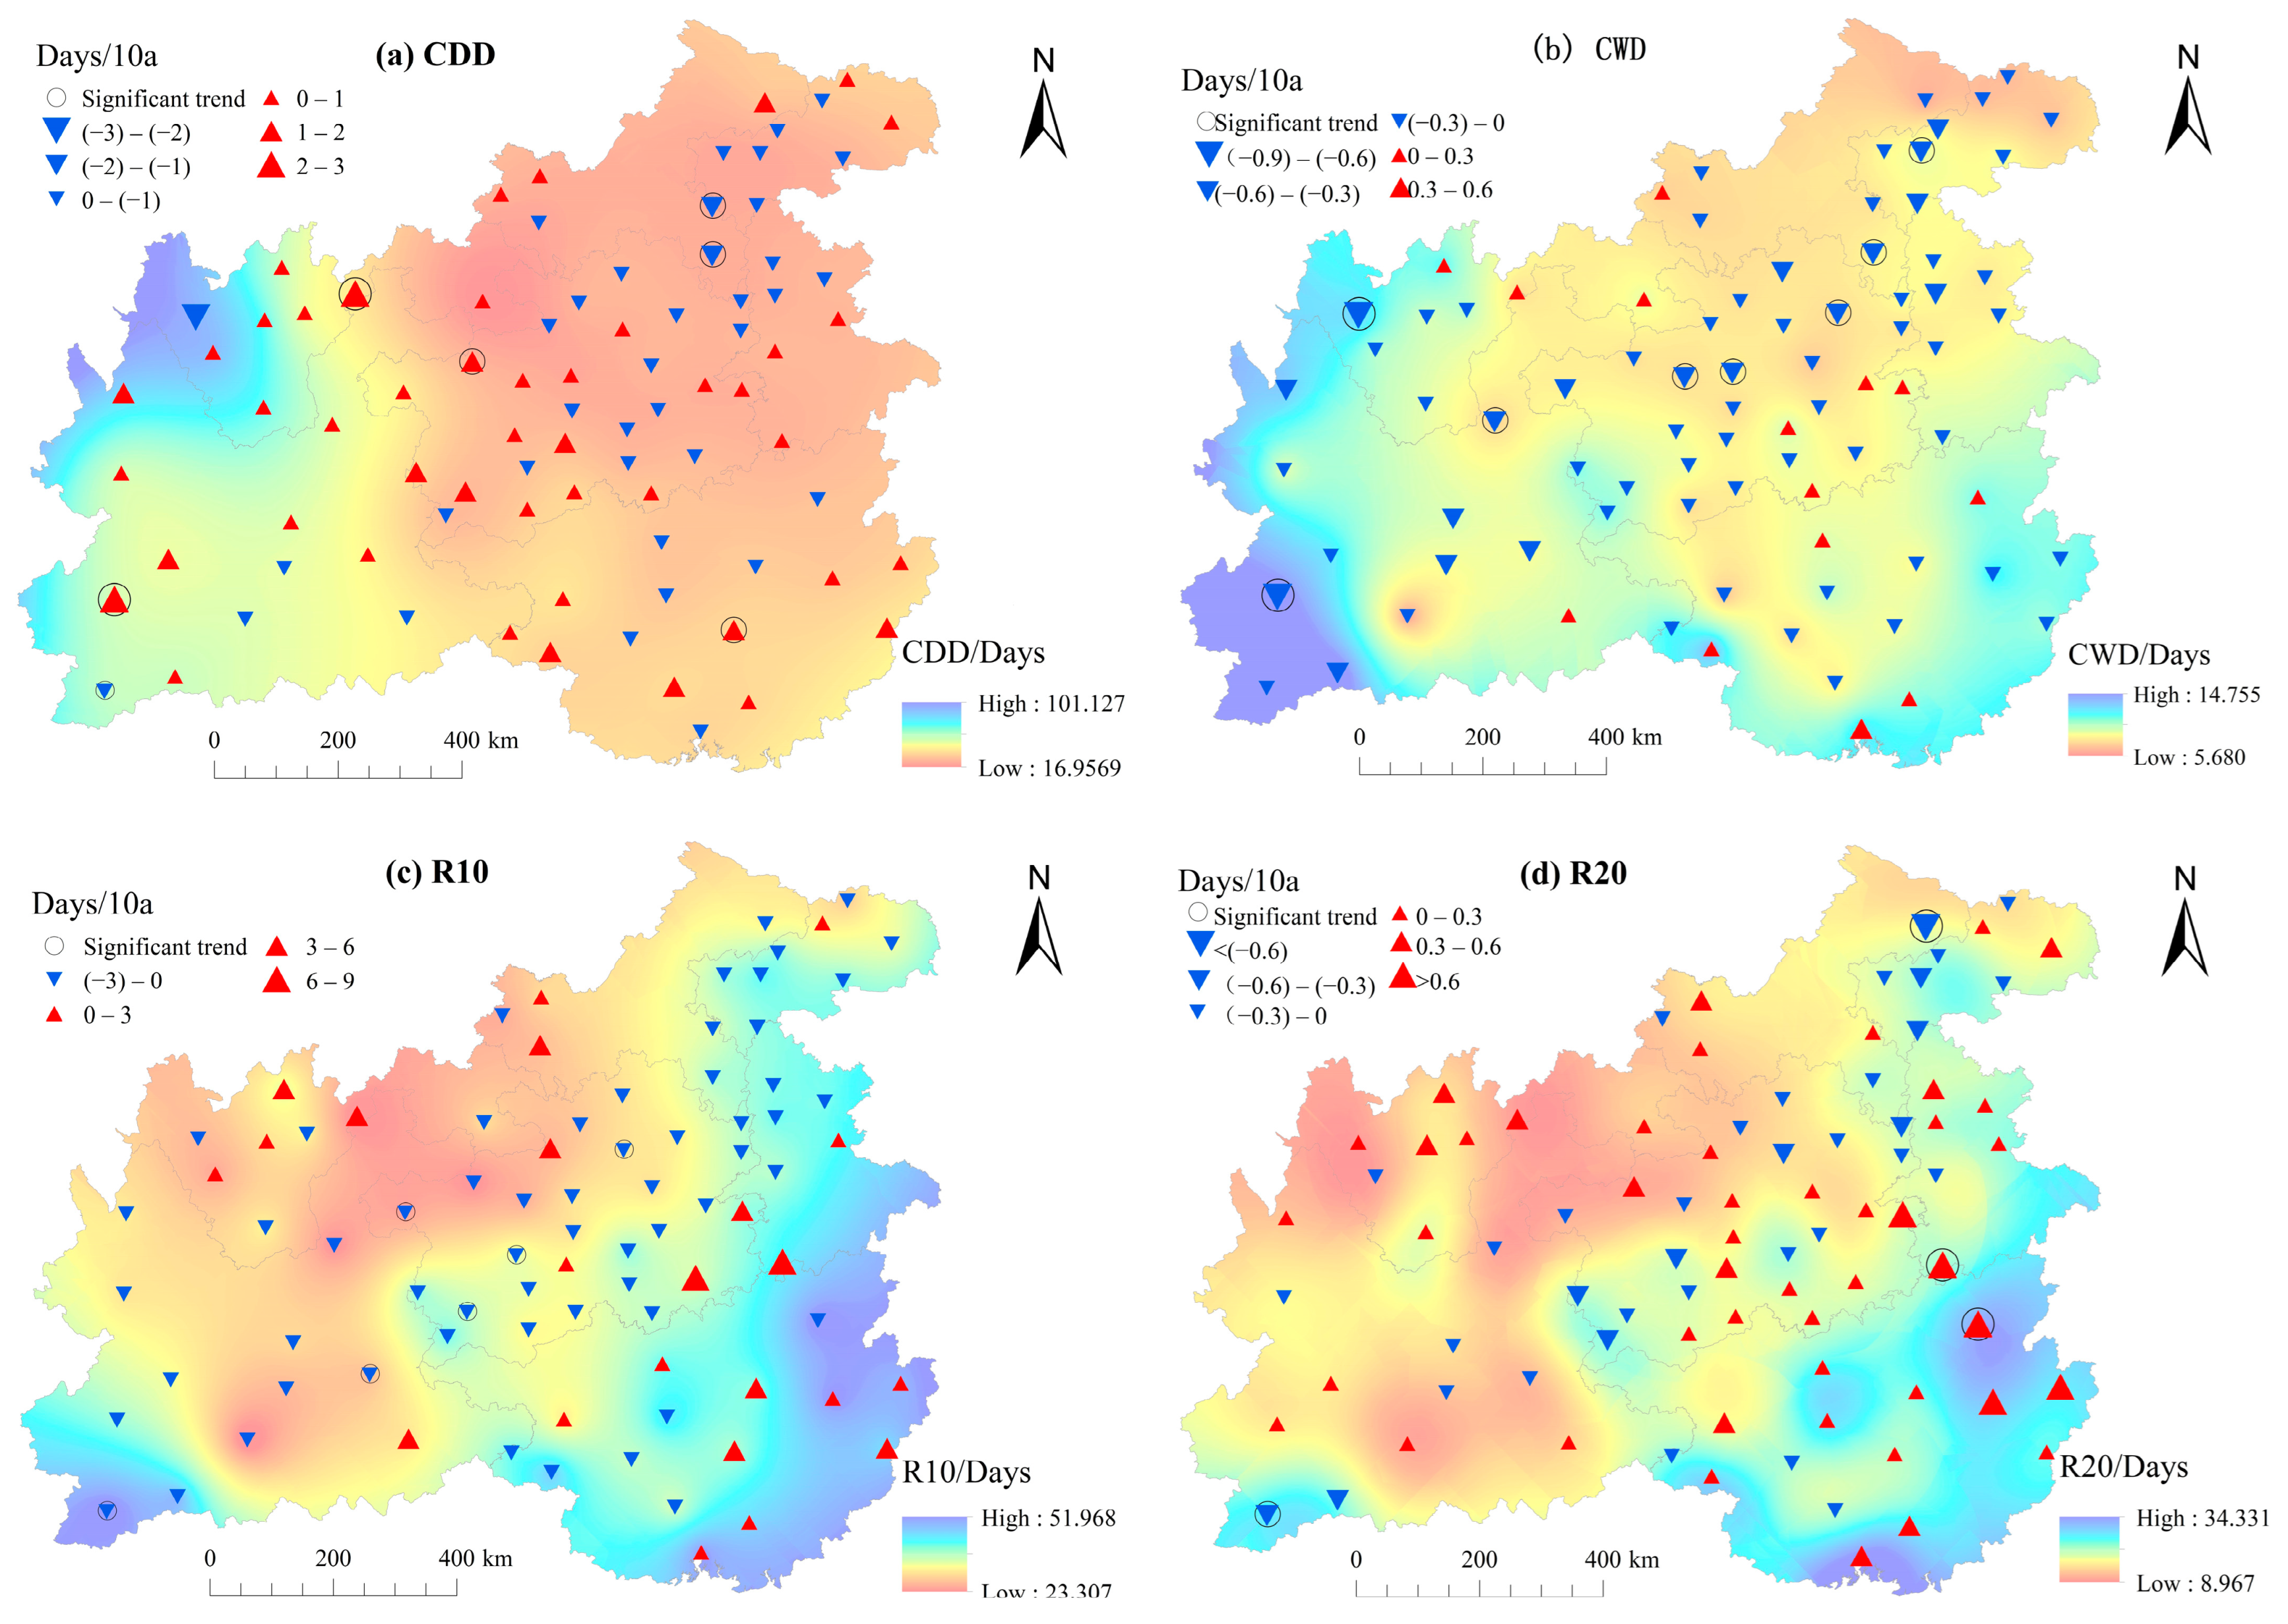
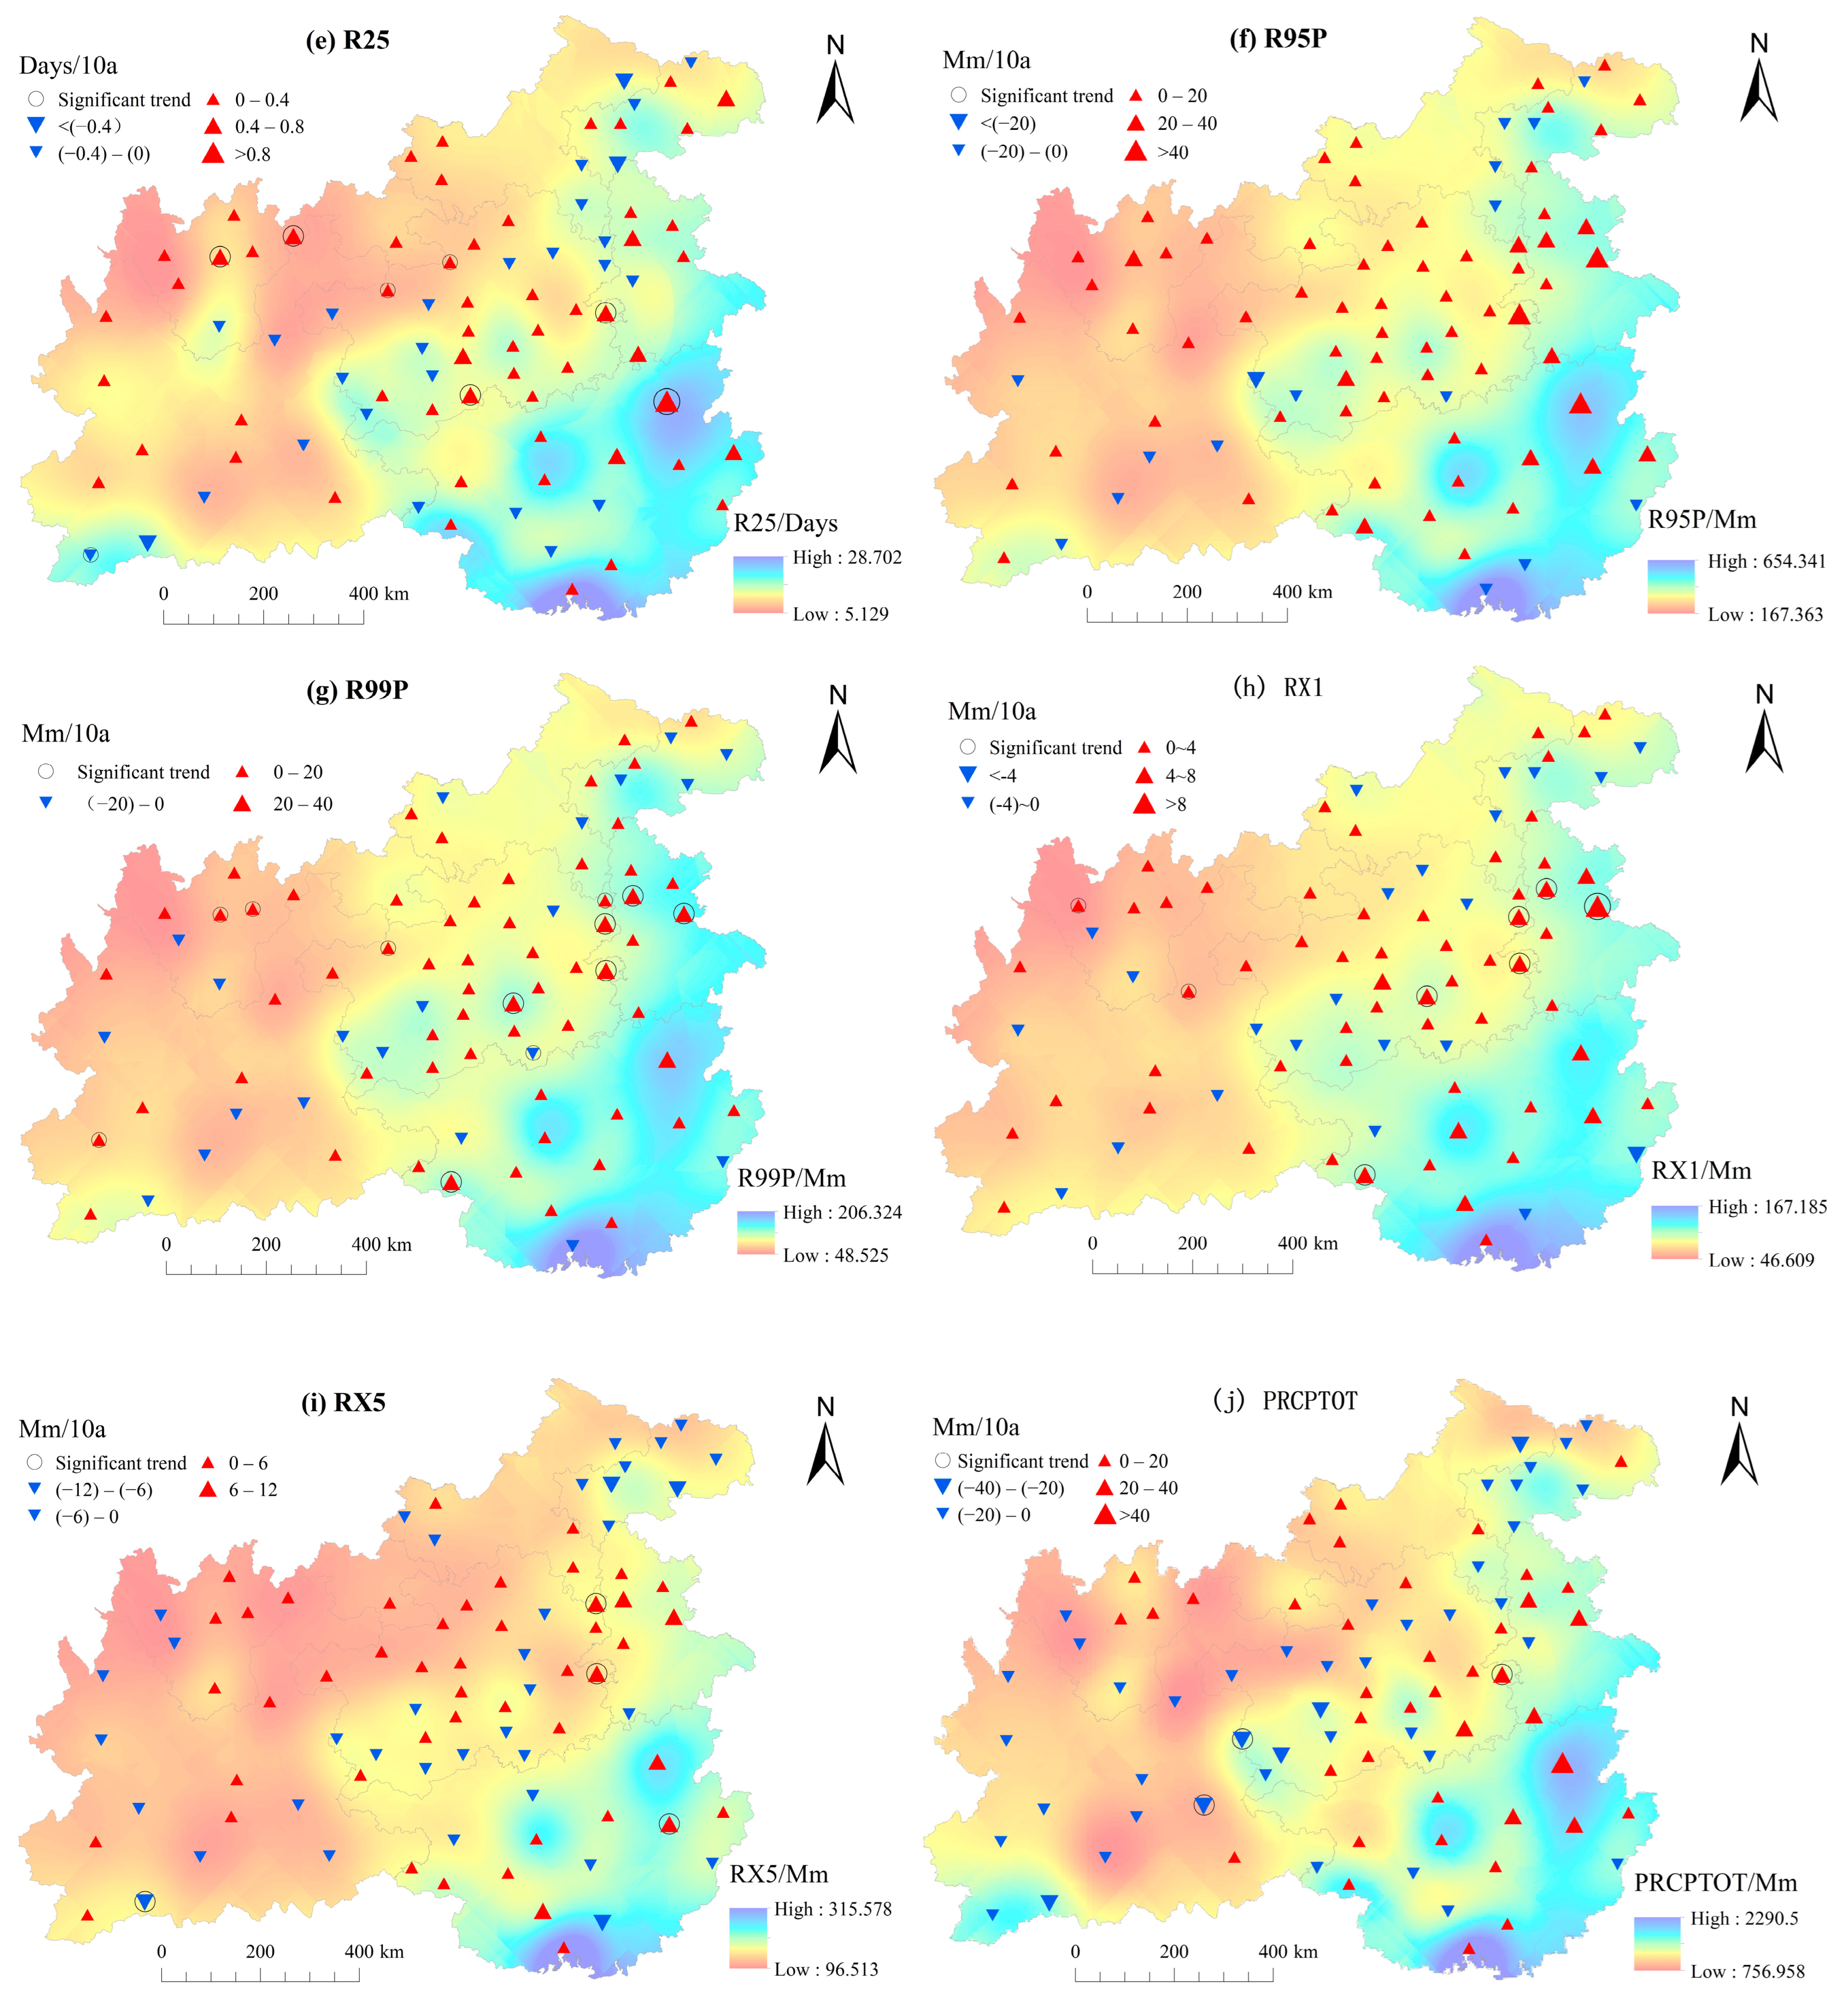
This paper uses the Kriging interpolation method to spatially interpolate the multi-year average value of the EPI at each station in order to analyze the spatial distribution characteristics of EP (Figure 5). The overall trend of EP in the study area is decreasing from southeast to northwest, which is consistent with the spatial distribution of precipitation across the country. Specifically, CDD decreases from the north-west as a high value area to the east; CWD decreases from the southwestern and southeastern regions to the northeastern region, showing a circular decreasing distribution, with the wetter area in the southwestern region; R10, R20, R25, and PRCPTOT decrease from the southwestern and southeastern regions to the north-central and northwestern regions; R95P, R99P, RX1, RX5, and SDII show a predominantly southeast to northwest decreasing trend, with the high-value areas in southern Guangxi. This spatial distribution of EP is related to topography and moisture transport. Moisture from the Indian Ocean enters YGPR from the southwest and is blocked by the Mourning Mountains and the Hengduan Mountain Range (see Figure 1), which creates a slope-climbing effect of the moisture [57]. Meanwhile, in the eastern part of the study area, Pacific Ocean moisture enters the area from the southeastern to the northwestern direction. The moisture from these two different sources meets with the cooler air from the north [58], creating abundant precipitation. Therefore, the precipitation in the southwestern part of the study area is mainly influenced by the Indian Ocean moisture and this influence decreases as it moves to the northeast. Precipitation in the southeastern and eastern regions of the study area is more controlled by Pacific Ocean moisture, and the influence decreases from the southeast to northwest (Figure 5c–e,j). The centre and north area of the study area, northeastern Yunnan and western Guizhou, are less influenced by the two sources of moisture and receive less precipitation. In addition, extremely heavy precipitation is mainly distributed in the southeastern and eastern regions, which are more influenced by Pacific moisture (Figure 5f–i,k).
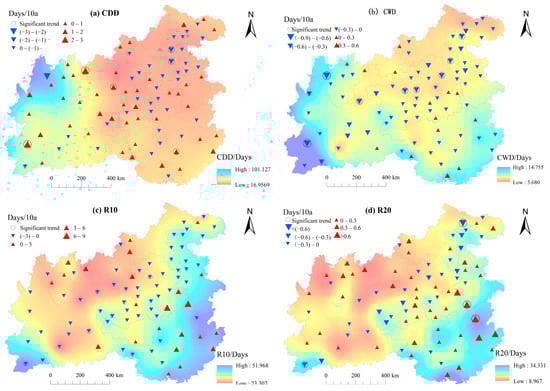
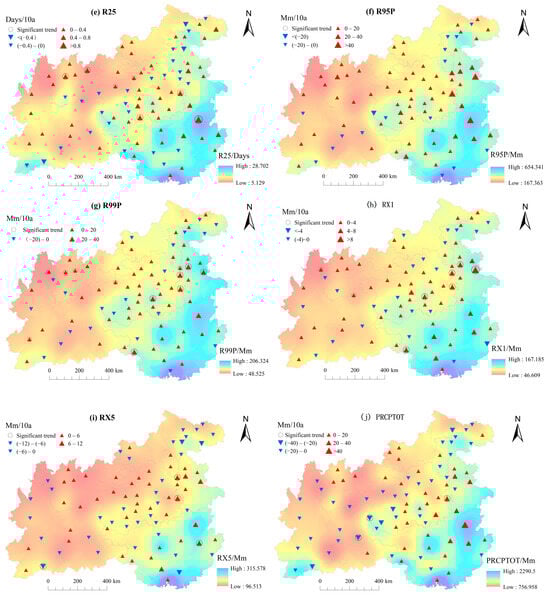
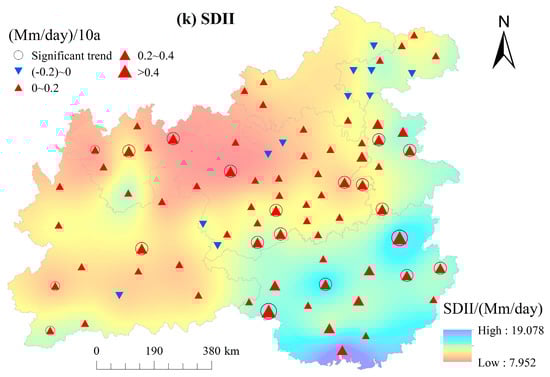
Figure 5.
Spatial distribution of EPIs and their trends in the YGPR.
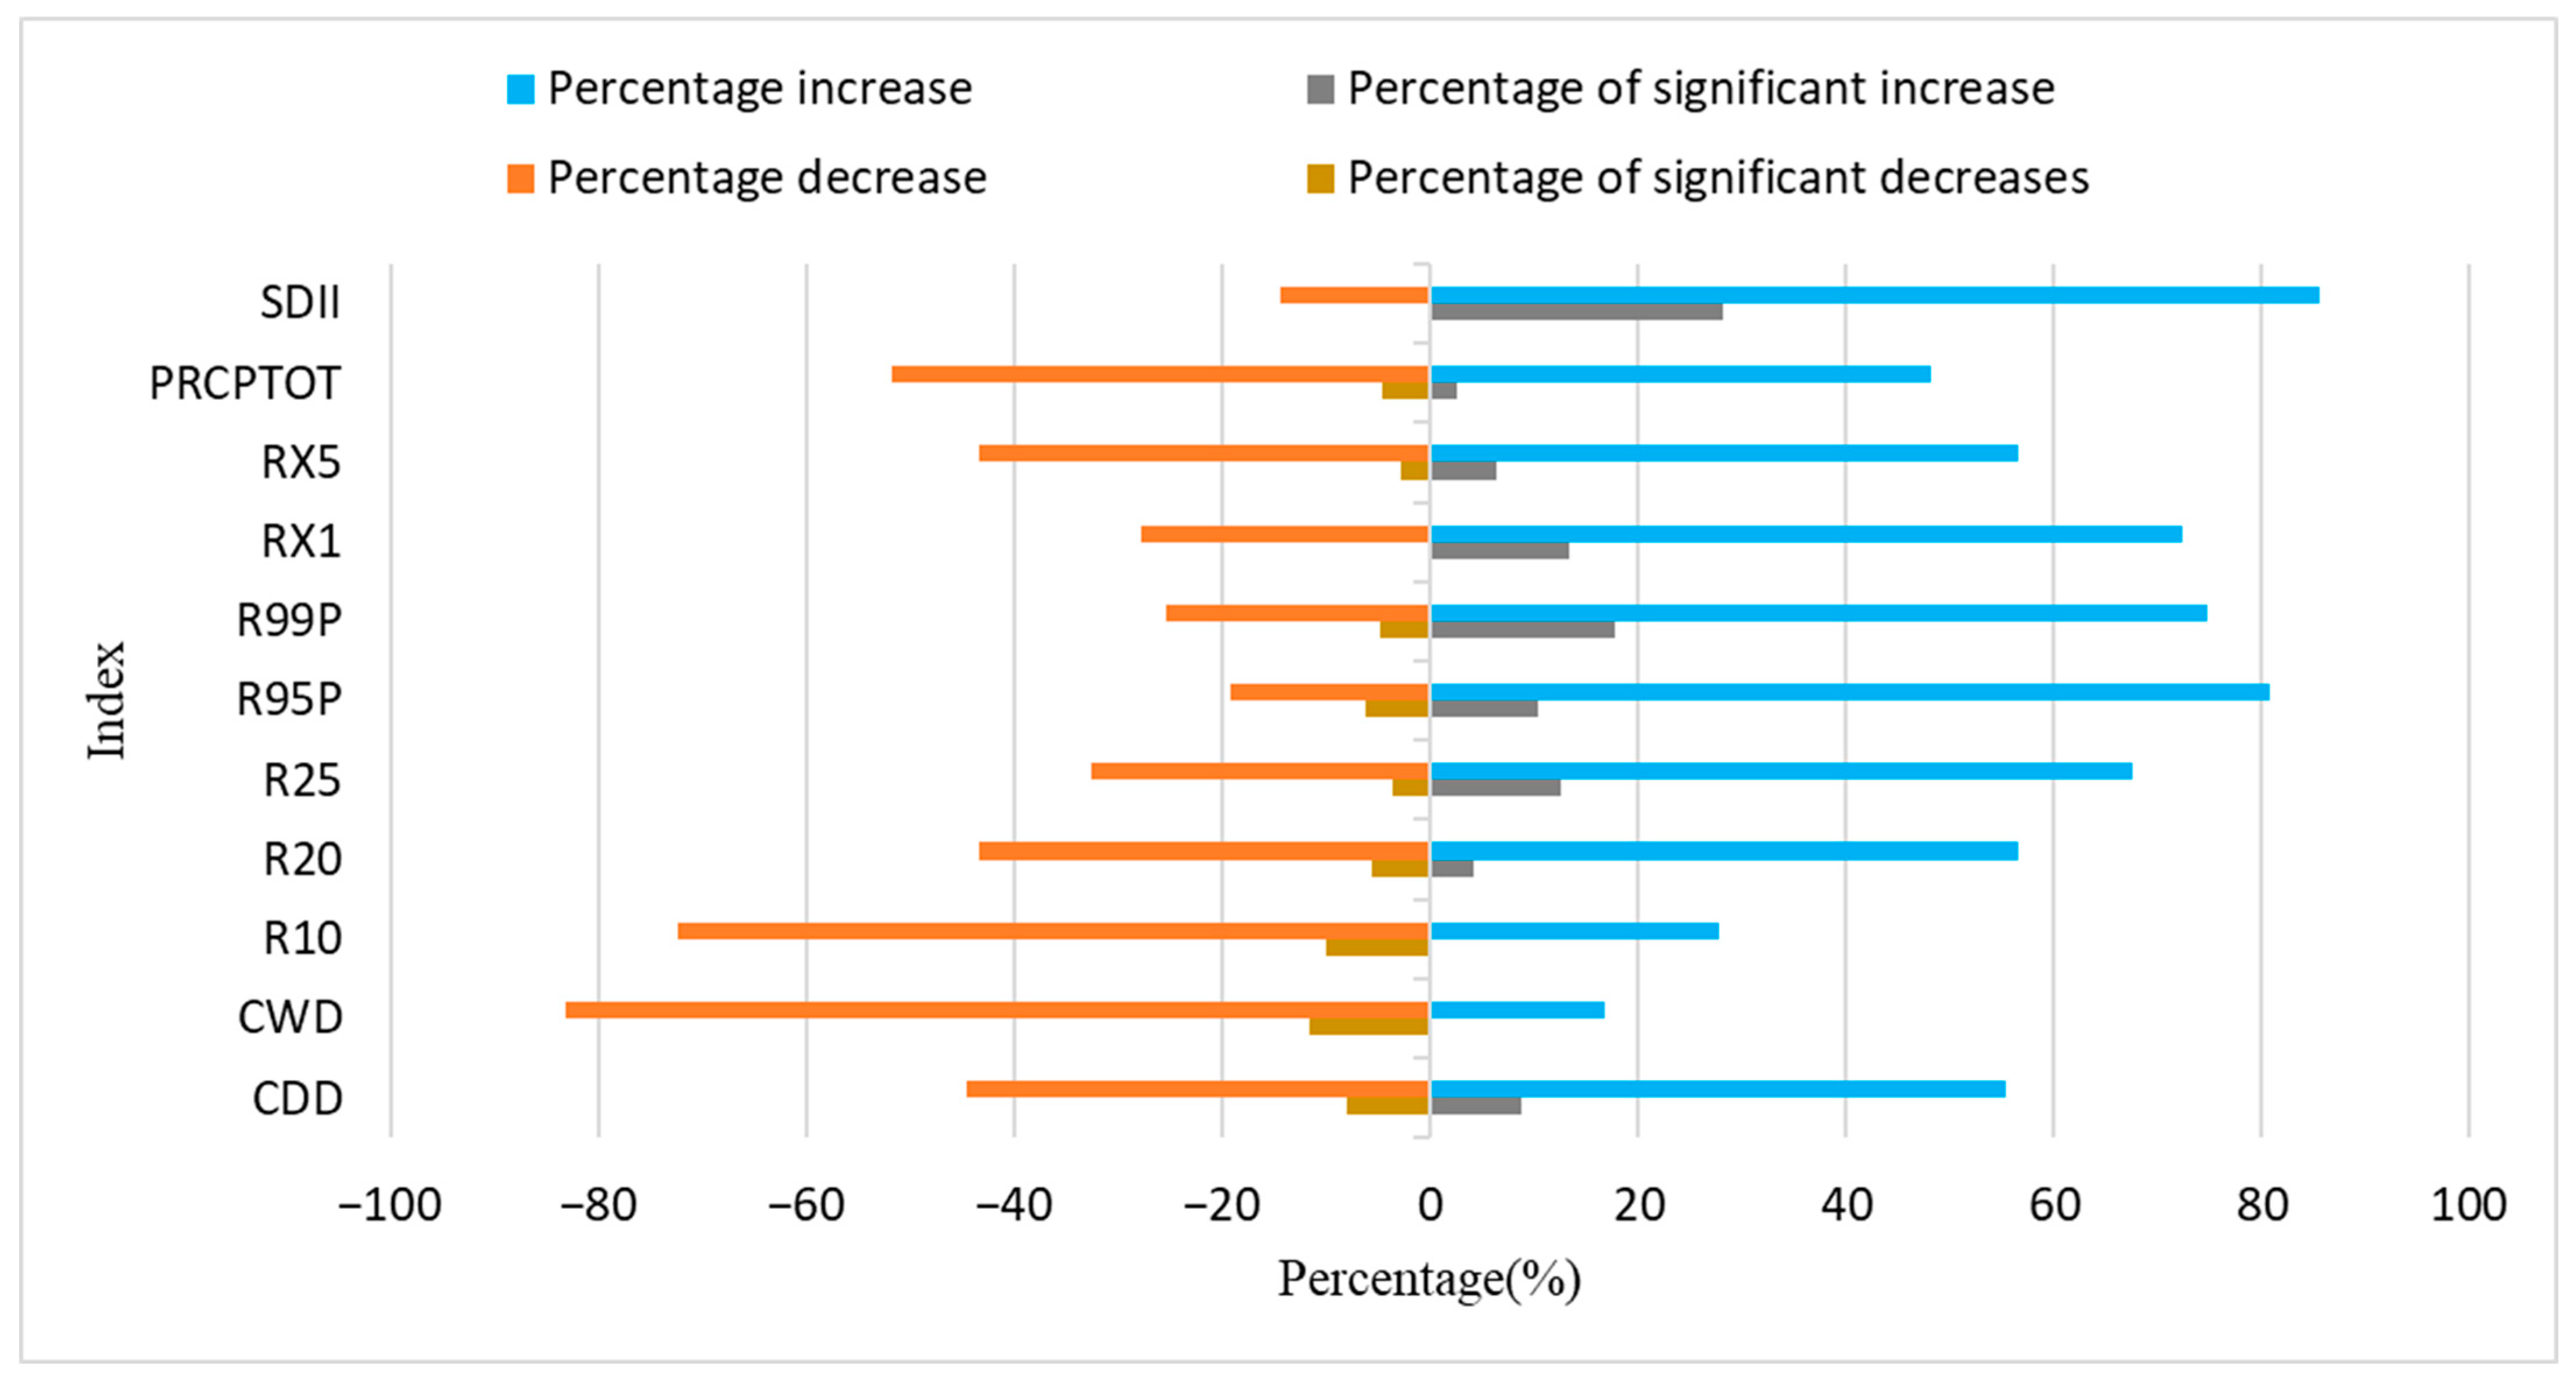
This study calculated 83 stations’ linear trends in order to understand the characteristics of EP trends in the study area (Figure 5). Figure 6 shows the percentage of stations’ trends. The trend of the EPI is significantly spatially heterogeneous. In total, 55% of the stations showed an upward trend in CDD, mainly distributing in the western part of the study area, in which four stations show a significant upward trend. For CWD, 83% of stations showed a decreasing trend in the central, western, and north-eastern parts of the study area, in which 12% of the stations gave a significant decreasing trend. R10 values of 72% of the stations show a continuous downward trend in Yunnan, Guizhou, Chongqing, southwestern Hubei, and western Hunan, in which 10% of the stations show a significant downward trend. In addition, 56% of the stations have an increasing trend in R20 and 67% of the stations have an increasing trend in R25, both mainly occurring in the South East and North West. The spatial distribution of R95P and R99P trends is similar, with 81% and 75% of the stations showing an upward trend, respectively, both mostly occurring in the northwest, central, and eastern parts of the study area, and with a larger upward trend in the east. An increasing trend for RX1 at 72% of the stations appeared in the northwest, central, and eastern parts of the region. The trend for RX5 is more complex, with 57% of the stations showing an upward trend, mainly in northern Guizhou, western Hunan, and Guangxi. SDII has an increasing trend for 86% of the stations, mainly in the northwest and southeast regions, in which Guangxi showed a significant upward trend. PRCPTOT at 52% of the stations showed an increasing trend while 48% of the stations showed a decreasing trend, in which most stations in southeastern Guizhou and Guangxi showed an increasing trend while most of the stations in Yunnan Province showed a decreasing trend, which is similar to the findings of Liu [59].

Figure 6.
Proportional distribution of stations with increasing and decreasing value for each EPI.
In summary, CWD and R10 show a decreasing trend, while the other indices show an increasing trend, which indicates that the risk in the study area shows an increasing trend in drought and short-term EP, which is the same as the results of study Section 4.1.1. The CDD, which characterizes the drought index, tends to increase mainly in the western part of the study area, while the CWD and R10 tend to decrease in the west; this indicates an increase in ED in the western part of the study area. The indices of extremely heavy precipitation mainly increase in the east-central and south-eastern regions, which indicates that EP tends to increase in this region. This indicates that with climate change, the western part of the study area may be at risk of drought, while the central and southeastern parts of the study area are at risk of flooding and mudslides, which will have an impact on the regional ecosystem and agricultural production. Therefore, the government and the community must improve the management of water resources and the drainage infrastructure in order to mitigate such impacts in the future.
4.3. Correlation Analysis of EPIs
Table 4 shows the correlation between the EPIs in the YGPR from 1960 to 2020. Except for CDD and CWD, the other EPIs have a good correlation with the annual total precipitation and pass the significance level test of 0.01, indicating that the annual total precipitation is significantly affected by the EPIs. Among them, the correlation coefficients of R10, R20, and R25 reached more than 0.9, thereby having the most obvious influence on annual total precipitation, which supports the results in Section 4.1.1 that the annual precipitation is influenced mostly by R10, R20, and R25, followed by R95P. In addition, Table 4 also shows that there is a high mutual correlation coefficient between R10, R20, and R25 as well as a good mutual correlation between R95P, R99P, RX1, RX5, and SDII.
Table 4.
Mutual correlation analysis between EPIs.
The above shows that EP is closely related to the annual total precipitation, except CDD and CWD, that the EPI will have a good indication of the annual total precipitation change, and that the individual EPIs are also closely mutually related. This will provide some help to the local meteorological-related departments when attempting to judge the process of EP changes and future trends.
5. Discussion
5.1. EP in Relation to Geographical Factors
Studies have shown that geographical factors can influence EP [30], with longitude, latitude, and elevation being the most representative geographic factors. Longitude reflects the water-heat difference from the coast to the inland, latitude determines the heat distribution on the surface, and altitude influences the distribution of water vapour and heat in the mountainous areas, all of which will have a certain impact on regional climate change [60]. Gan et al. [30] found that latitude, longitude, and altitude determine the spatial distribution characteristics of EP in Sichuan Province. This study selects the above three representative geographic factors and uses the Pearson correlation coefficient method to explore the potential relationship between them and EP. The correlation coefficients are shown in Table 5.
Table 5.
Correlation coefficients between EPIs and geographical factors (longitude, latitude, altitude) in the YGPR.
5.1.1. Relationship between EP and the Latitude and Longitude Factors
According to the Table 5, the correlation coefficient between longitude and EP is larger than that between latitude and EP and passes the significance level test of 0.05, which indicates that longitude has a greater influence on the EPIs. Specifically, except for CDD and CWD, which are significantly negatively correlated with longitude, the other nine indices are significantly positively correlated with longitude, indicating that CDD and CWD decrease and the other EPIs increase with increasing longitude. This is consistent with the fact that the distribution of precipitation in China is influenced by differences in the thermal properties of land and sea. All EPIs are significantly negatively correlated with latitude, i.e., EP decreases with increasing latitude. The above shows that the regional characteristics of EP are obvious, and the influence of latitude and longitude on EHP is consistent with the spatial distribution characteristic of decreasing from southeast to northwest, which is consistent with the research results of Gan et al. [30].
5.1.2. Relationship between EP and Elevation
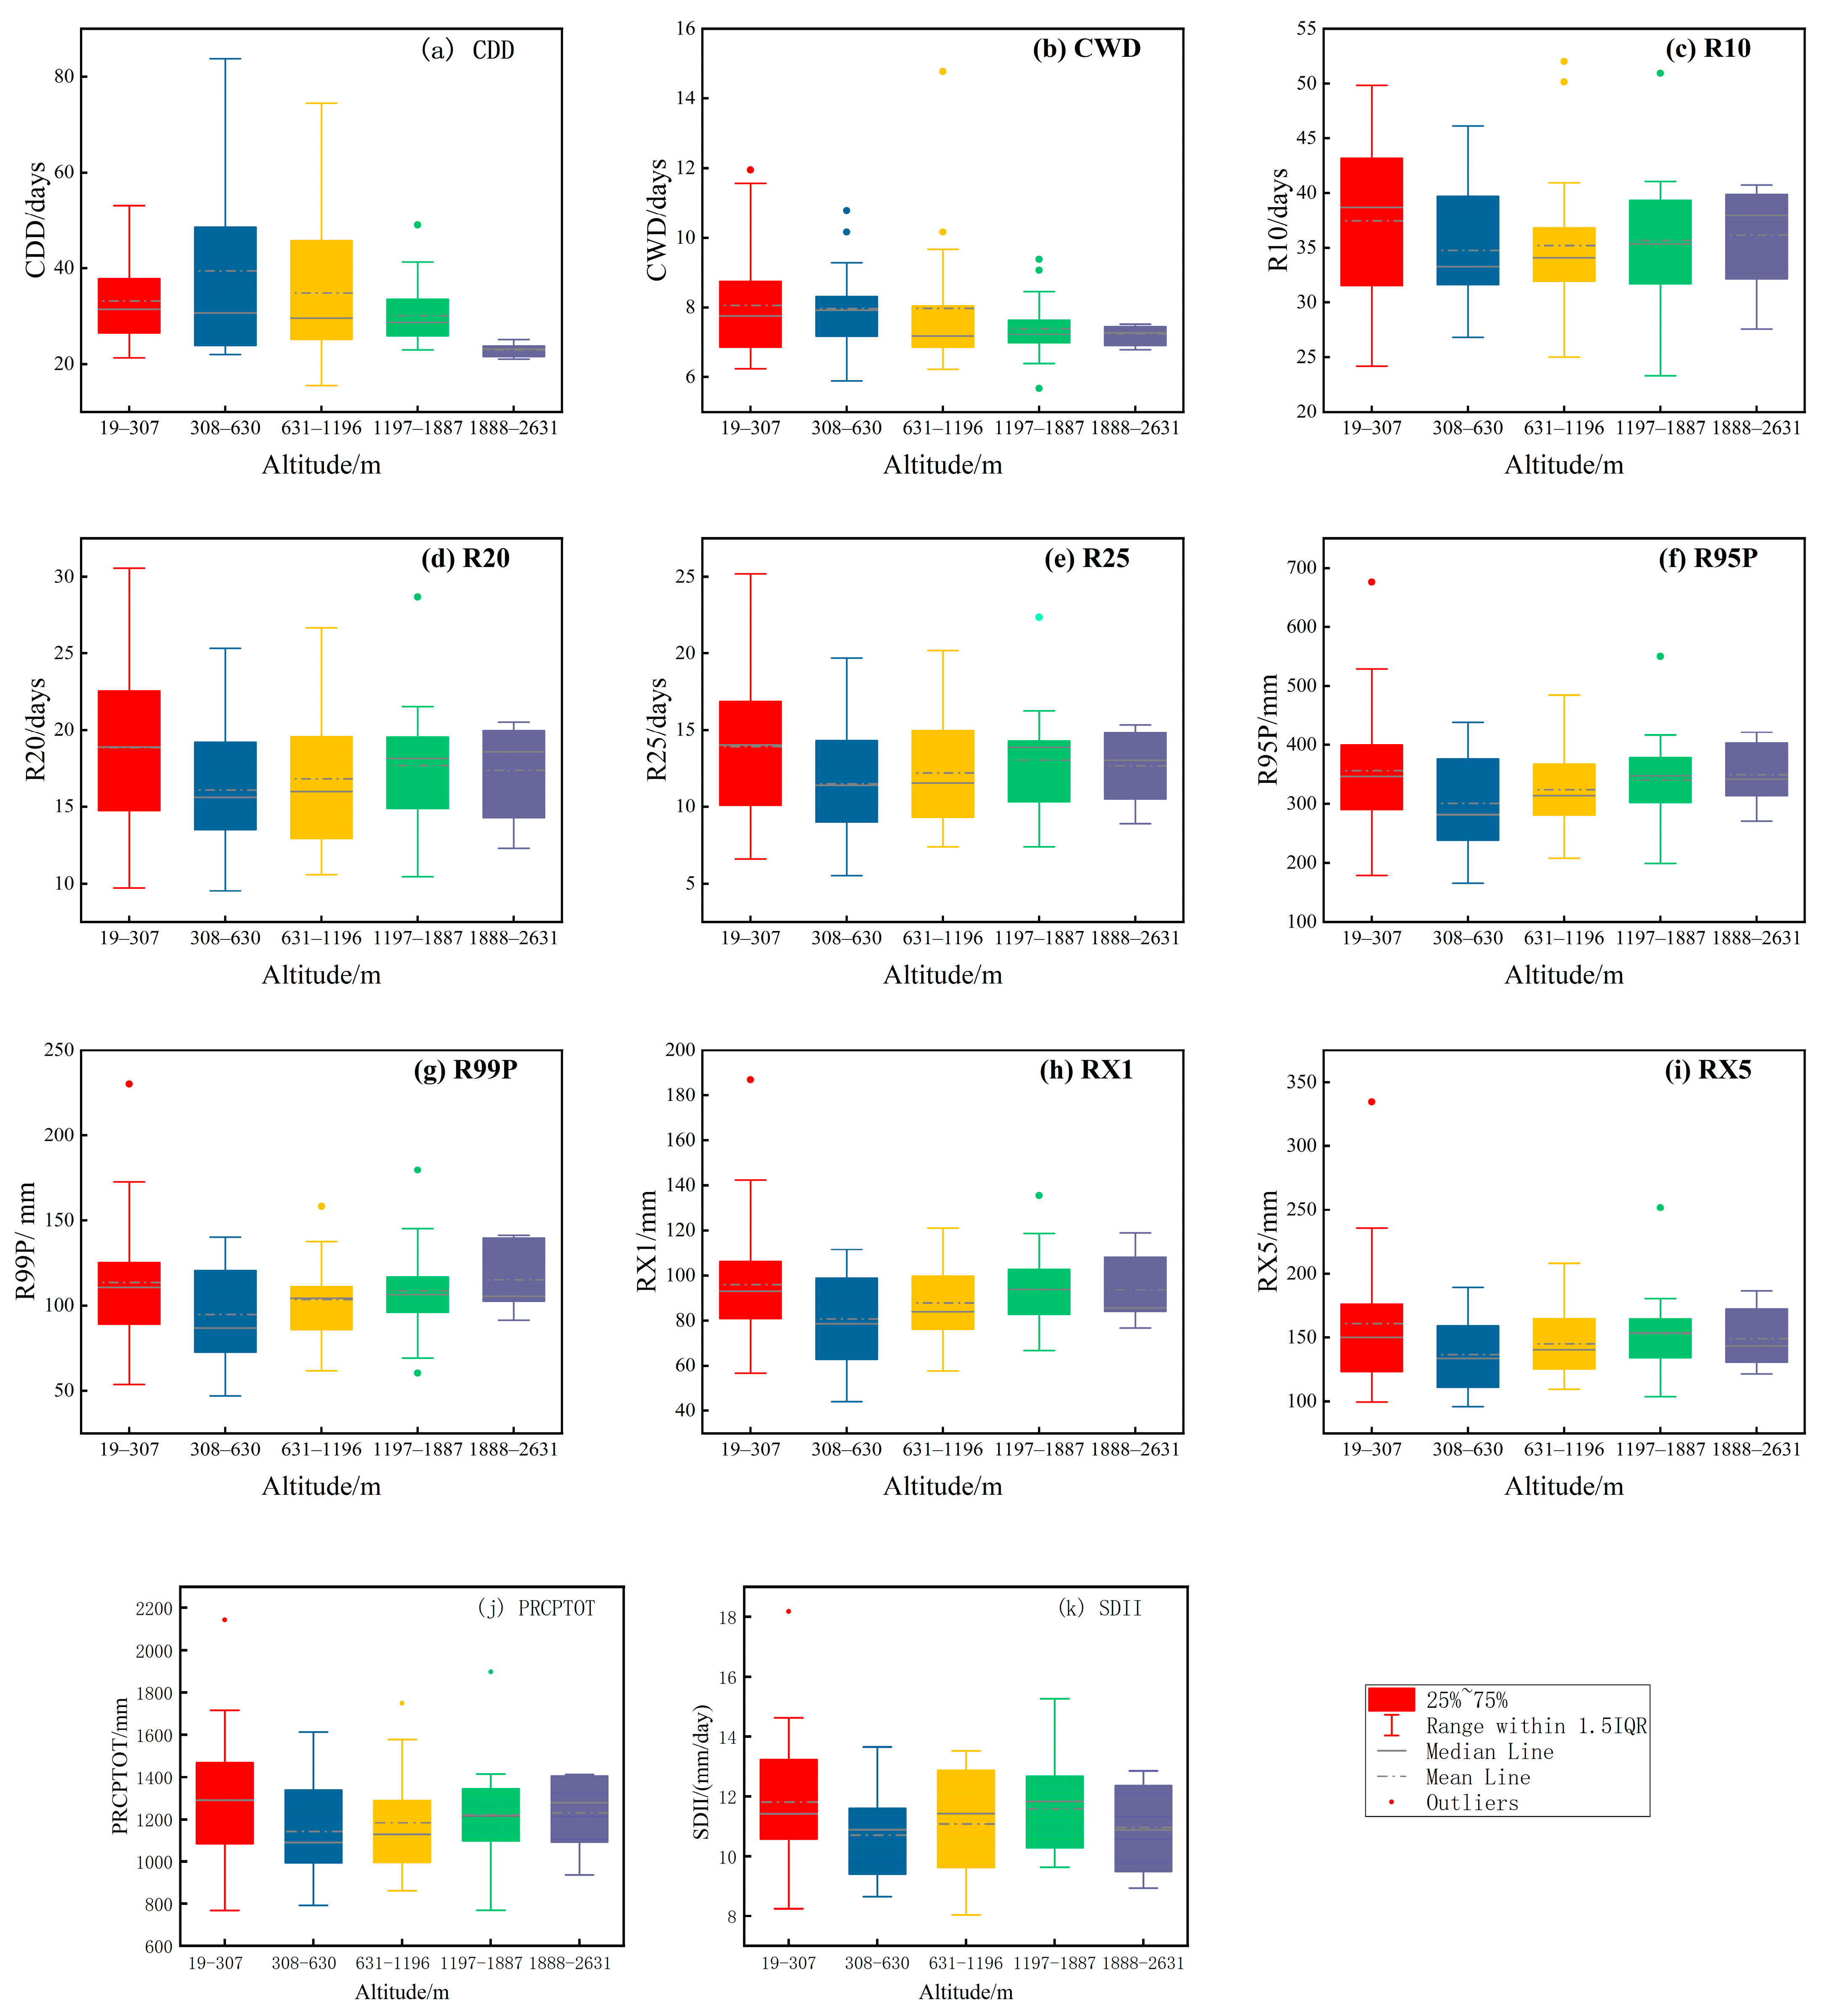
The relationship between EP and elevation is complex in the study area, where there are large differences in elevation [61]. This study used the natural breakpoint grading method in ArcGIS10.6 software to classify the elevations of 83 stations in the study area into five categories (Table 5) in order to analyze the relationship between EP and elevation. At the range of 19–307 m, except for CDD, which was positively correlated with elevation, the other EPIs were significantly negatively correlated with elevation and passed the significance level test of 0.05, and the EPIs of R10, R20, R25, R95P, R99P, RX1, RX5, PRCPTOT, and SDII decreased by 60.8 d, 72.7 d, 73.8 d, 74.6 mm, 74 mm, 74 mm, 71.6 mm, 72.8 mm, 73.6 mm, and 68.2 (mm/d), respectively, for every 100m increase in altitude. At the range of 1888–2631m, CDD was negatively correlated with altitude, and the other EPIs were positively correlated with altitude, with EPIs R10, R20, R25, R95P, R99P, RX1, RX5, PRCPTOT, and SDII increasing by 50 d, 60.8 d, 62.6 d, 55.4 mm, 52.6 mm, 60.7 mm, 54.6 mm, 56.3 mm, and 66.6 (mm/d), respectively, for each 100 m increase in altitude. In this study, a box plot is drawn with the multi-year mean series of EPIs for each station at different altitudes (Figure 7). The maximum mean values of CWD, R10, R20, R25, R95P, RX1, RX5, and SDII all occur at altitudes of 19–307, the maximum mean value of R99P occurs at altitudes of 1888–2631, and the maximum mean value of CDD occurs at altitudes of 308–630. The minimum mean values of all indices, except CDD and CWD, occur at altitudes of 308–630. In general, EP in the study area is closely related to altitude, but there are some differences in the relationship between different altitude bands and EP. Except for CDD, the other EPIs gradually decrease with altitude at low altitudes and gradually increase with altitude at high altitudes. EHP mainly occurs at low altitudes (19–307 m) and high altitudes (1888–2631 m) and there is little precipitation at middle altitudes (308–630 m), which is highly susceptible to drought. The reason is that low-altitude areas are mainly located in the eastern part of the study area and are windward slopes with abundant moisture and abundant precipitation; mid-altitude areas have complex topography and are blocked by mountain ranges, where moisture does not flow easily, which will result in less precipitation and less EP; high-altitude areas are affected by climate warming, with little heat release from the subsurface latent heat action leading to enhanced evapotranspiration [62], where EHP is very likely to be formed.
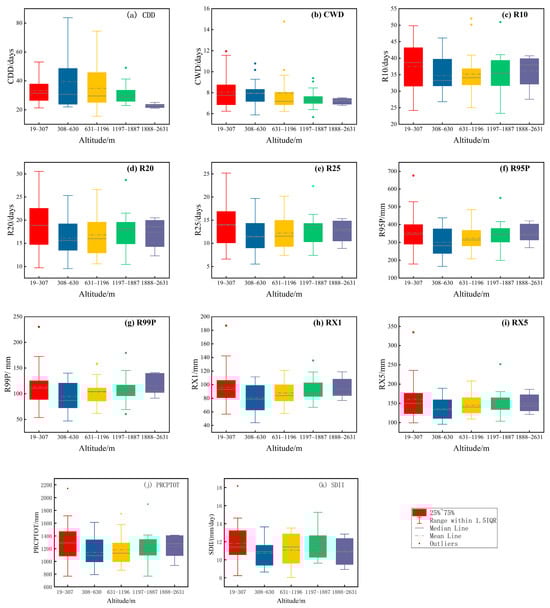
Figure 7.
Box plots of EPIs within altitude segments in the YGPR.
5.2. EP in Relation to Atmospheric Circulation Factorrs
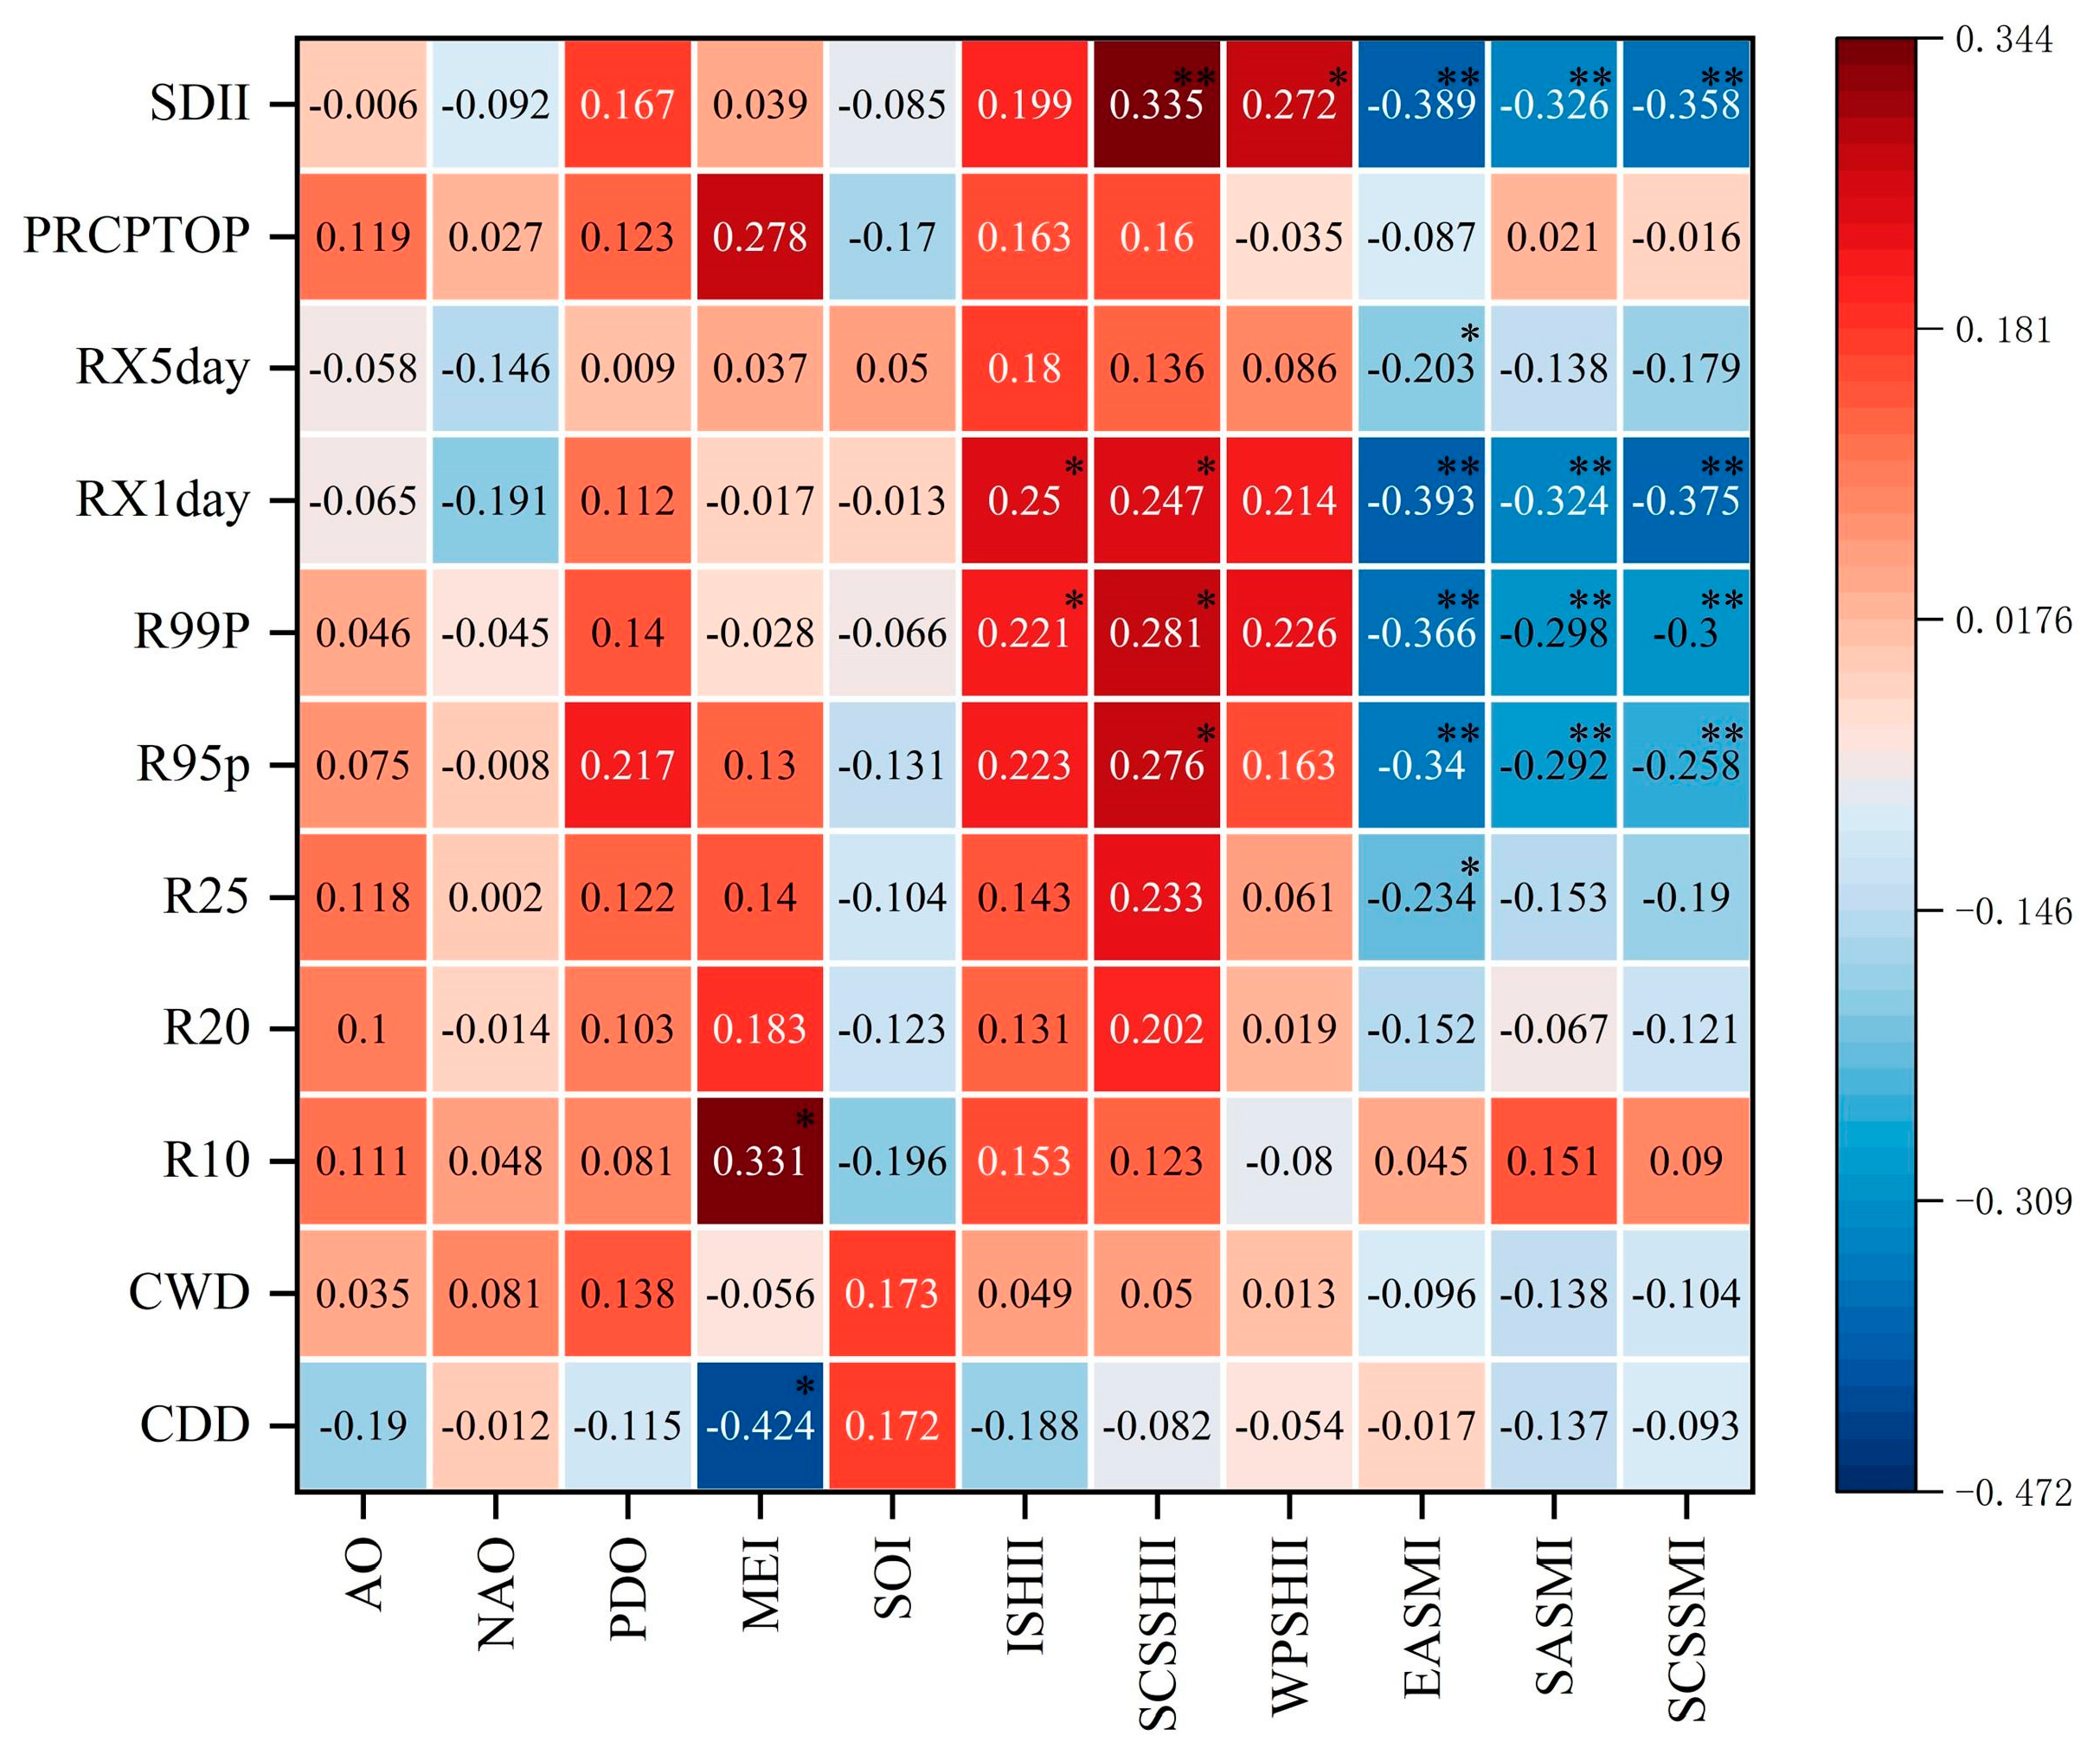
It has been shown that the 11 atmospheric circulation indices are related to precipitation in the southern region of China [16,38,63]. Therefore, our study investigates the relationship between EPIs and the 11 atmospheric circulation indices in the YGPR to analyze the influence of atmospheric circulation on EP in the study area, and the result can be seen in Figure 8. As can be seen from the Figure 8, R95P, R99P, RX1, and SDII, which characterize the process of EHP variability, are significantly and negatively correlated (p < 0.05) with SASMI, EASMI, and SCSSMI, and the strongest is EASMI. It indicates that with the indexes weakening of the summer monsoons from South Asia, East Asia, and the South China Sea, the EHP in the study area will be enhanced, with the East Asian monsoon having the most significant influence on EP. The indices are strong positively correlated with SCSSHII and WPSHII, indicating that the EHP in the study area will be enhanced with the elevation of the subtropical high pressure in the South China Sea and the subtropical high pressure in the western Pacific Ocean. The CDD, which characterizes the number of drought days, is significantly negatively correlated with the MEI, indicating that the increase in the degree of drought variability in the study area is affected by ENSO events.
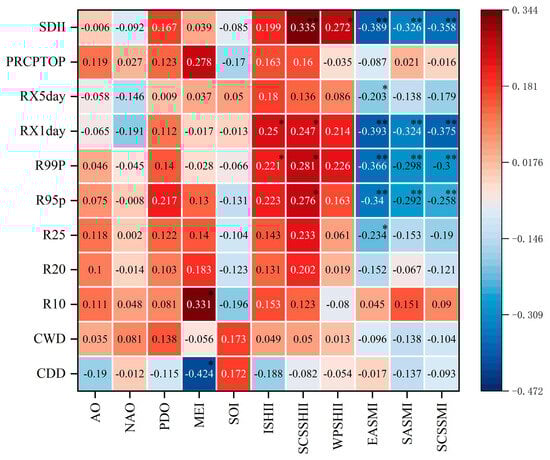
Figure 8.
Correlation coefficients between the EPIs and the atmospheric circulation indexes (** significant at the 0.01 level; * significant at the 0.05 level).
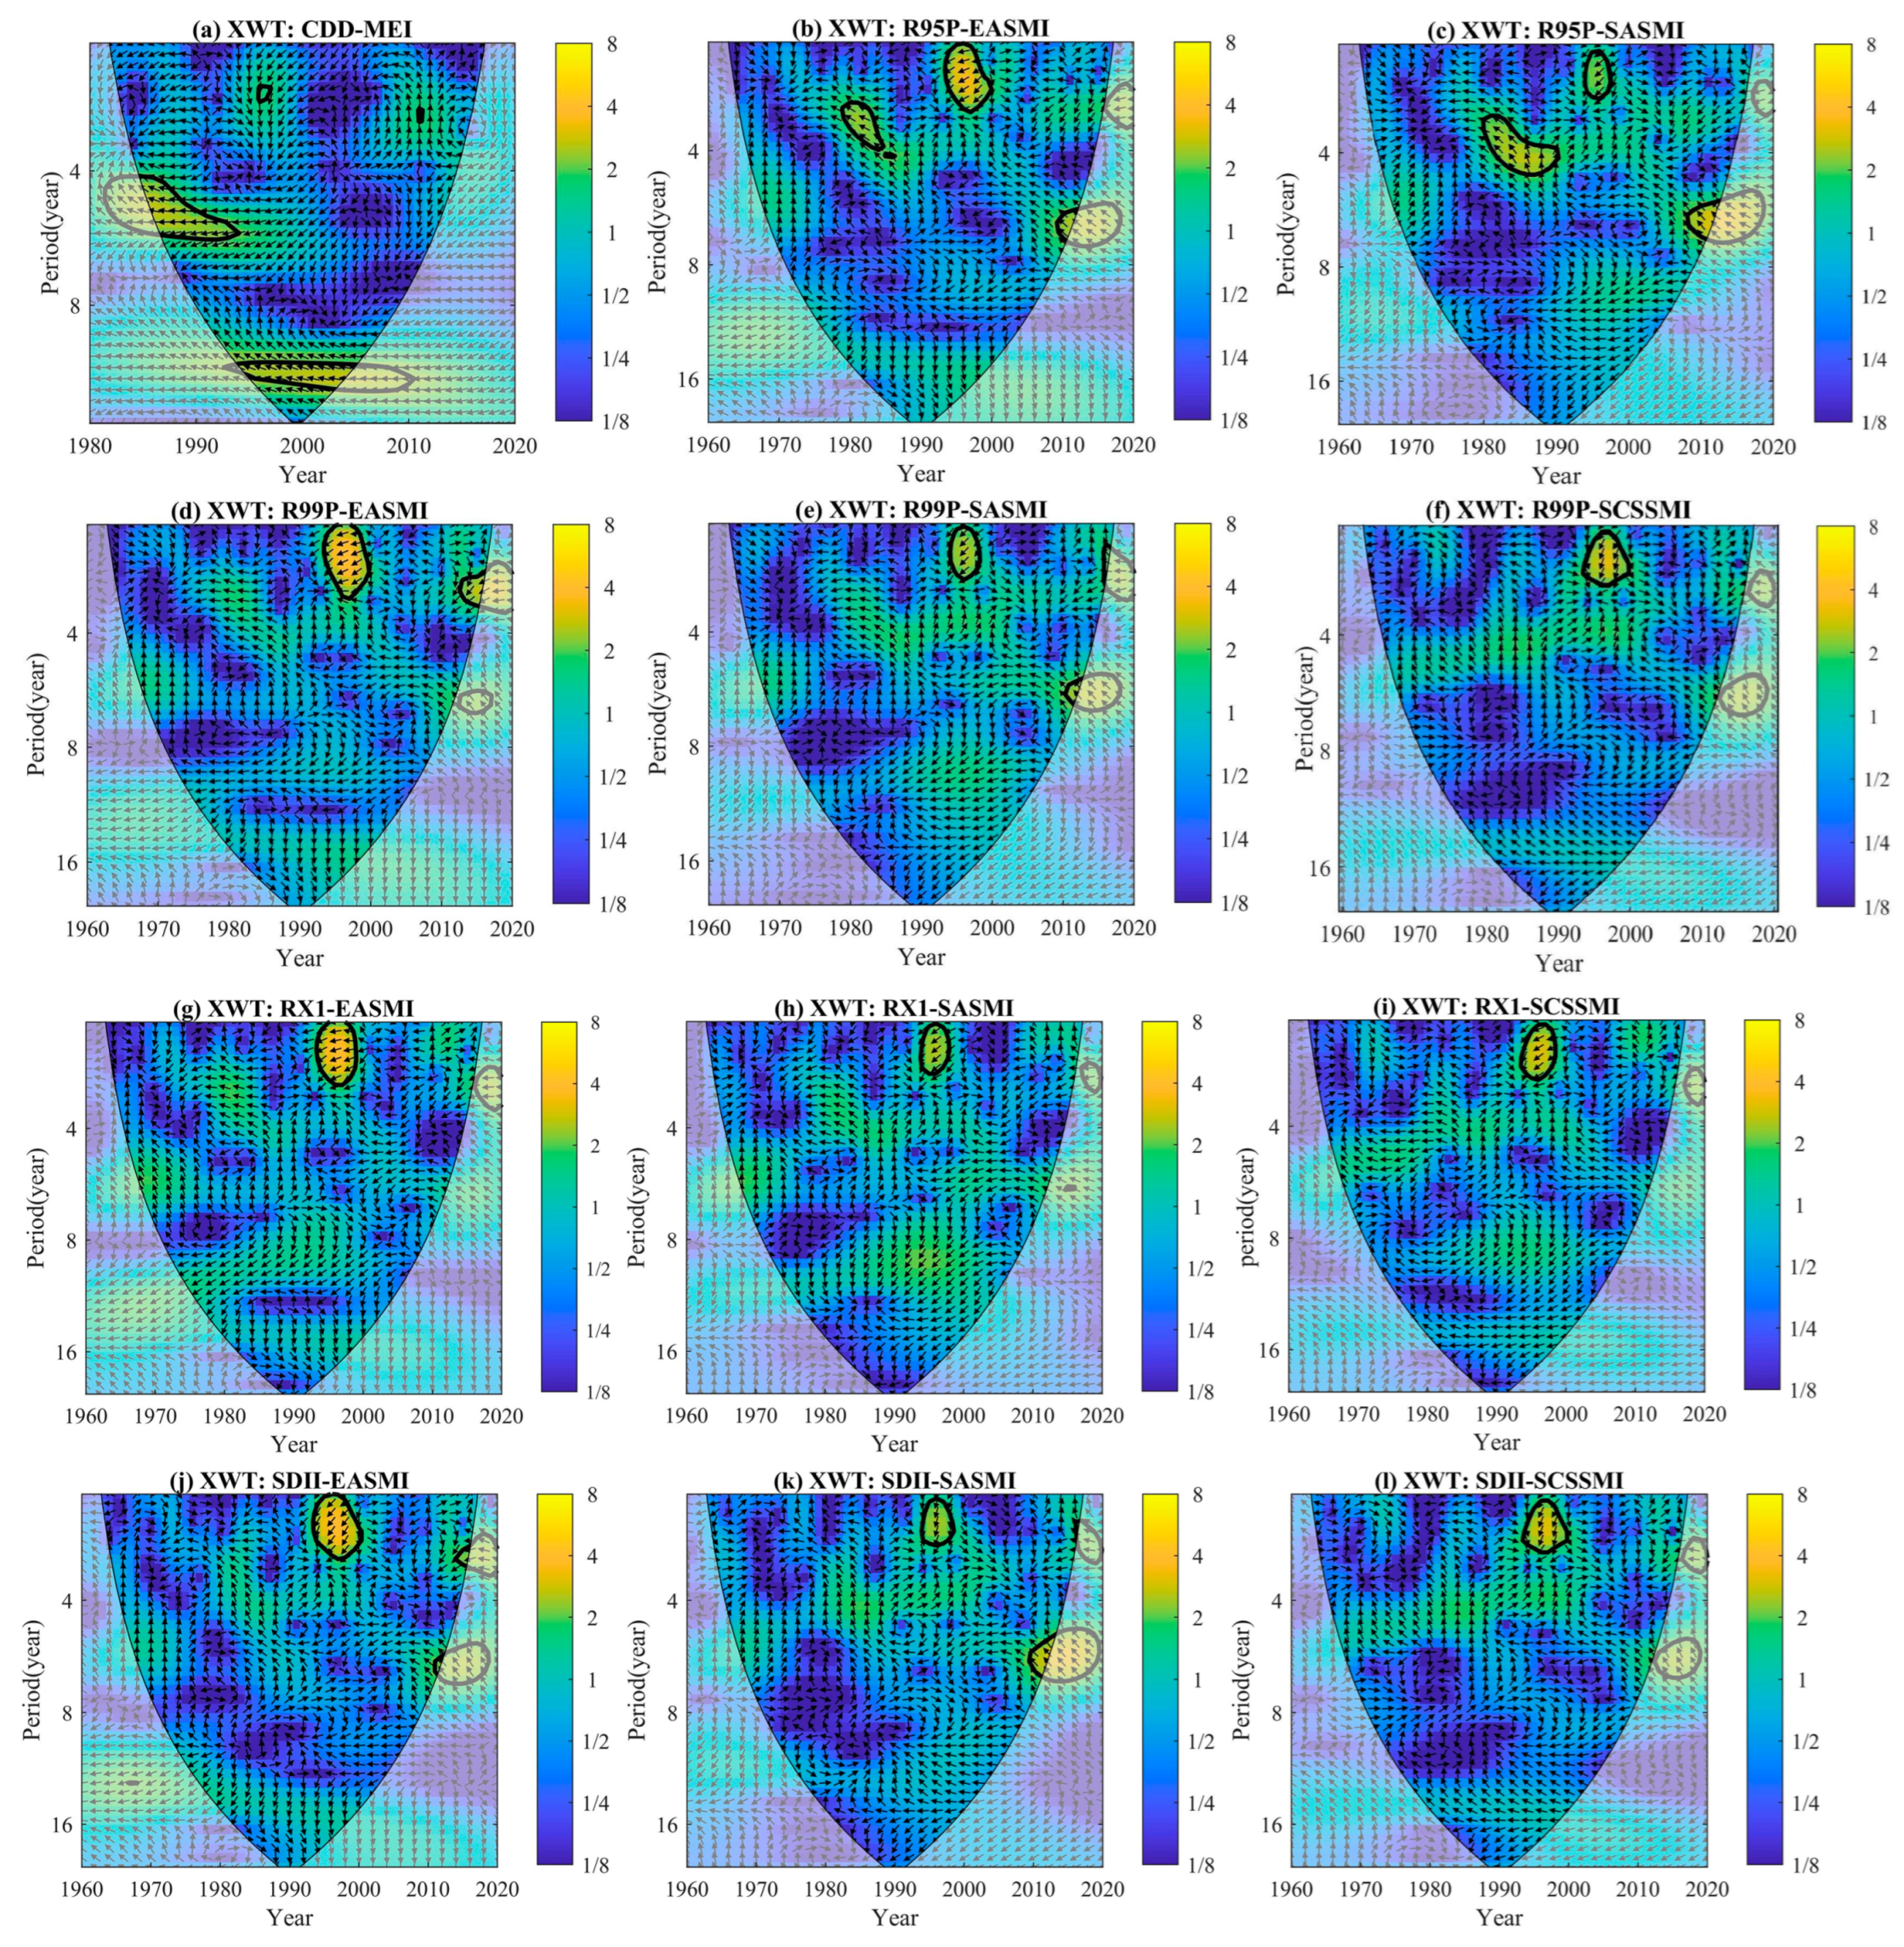
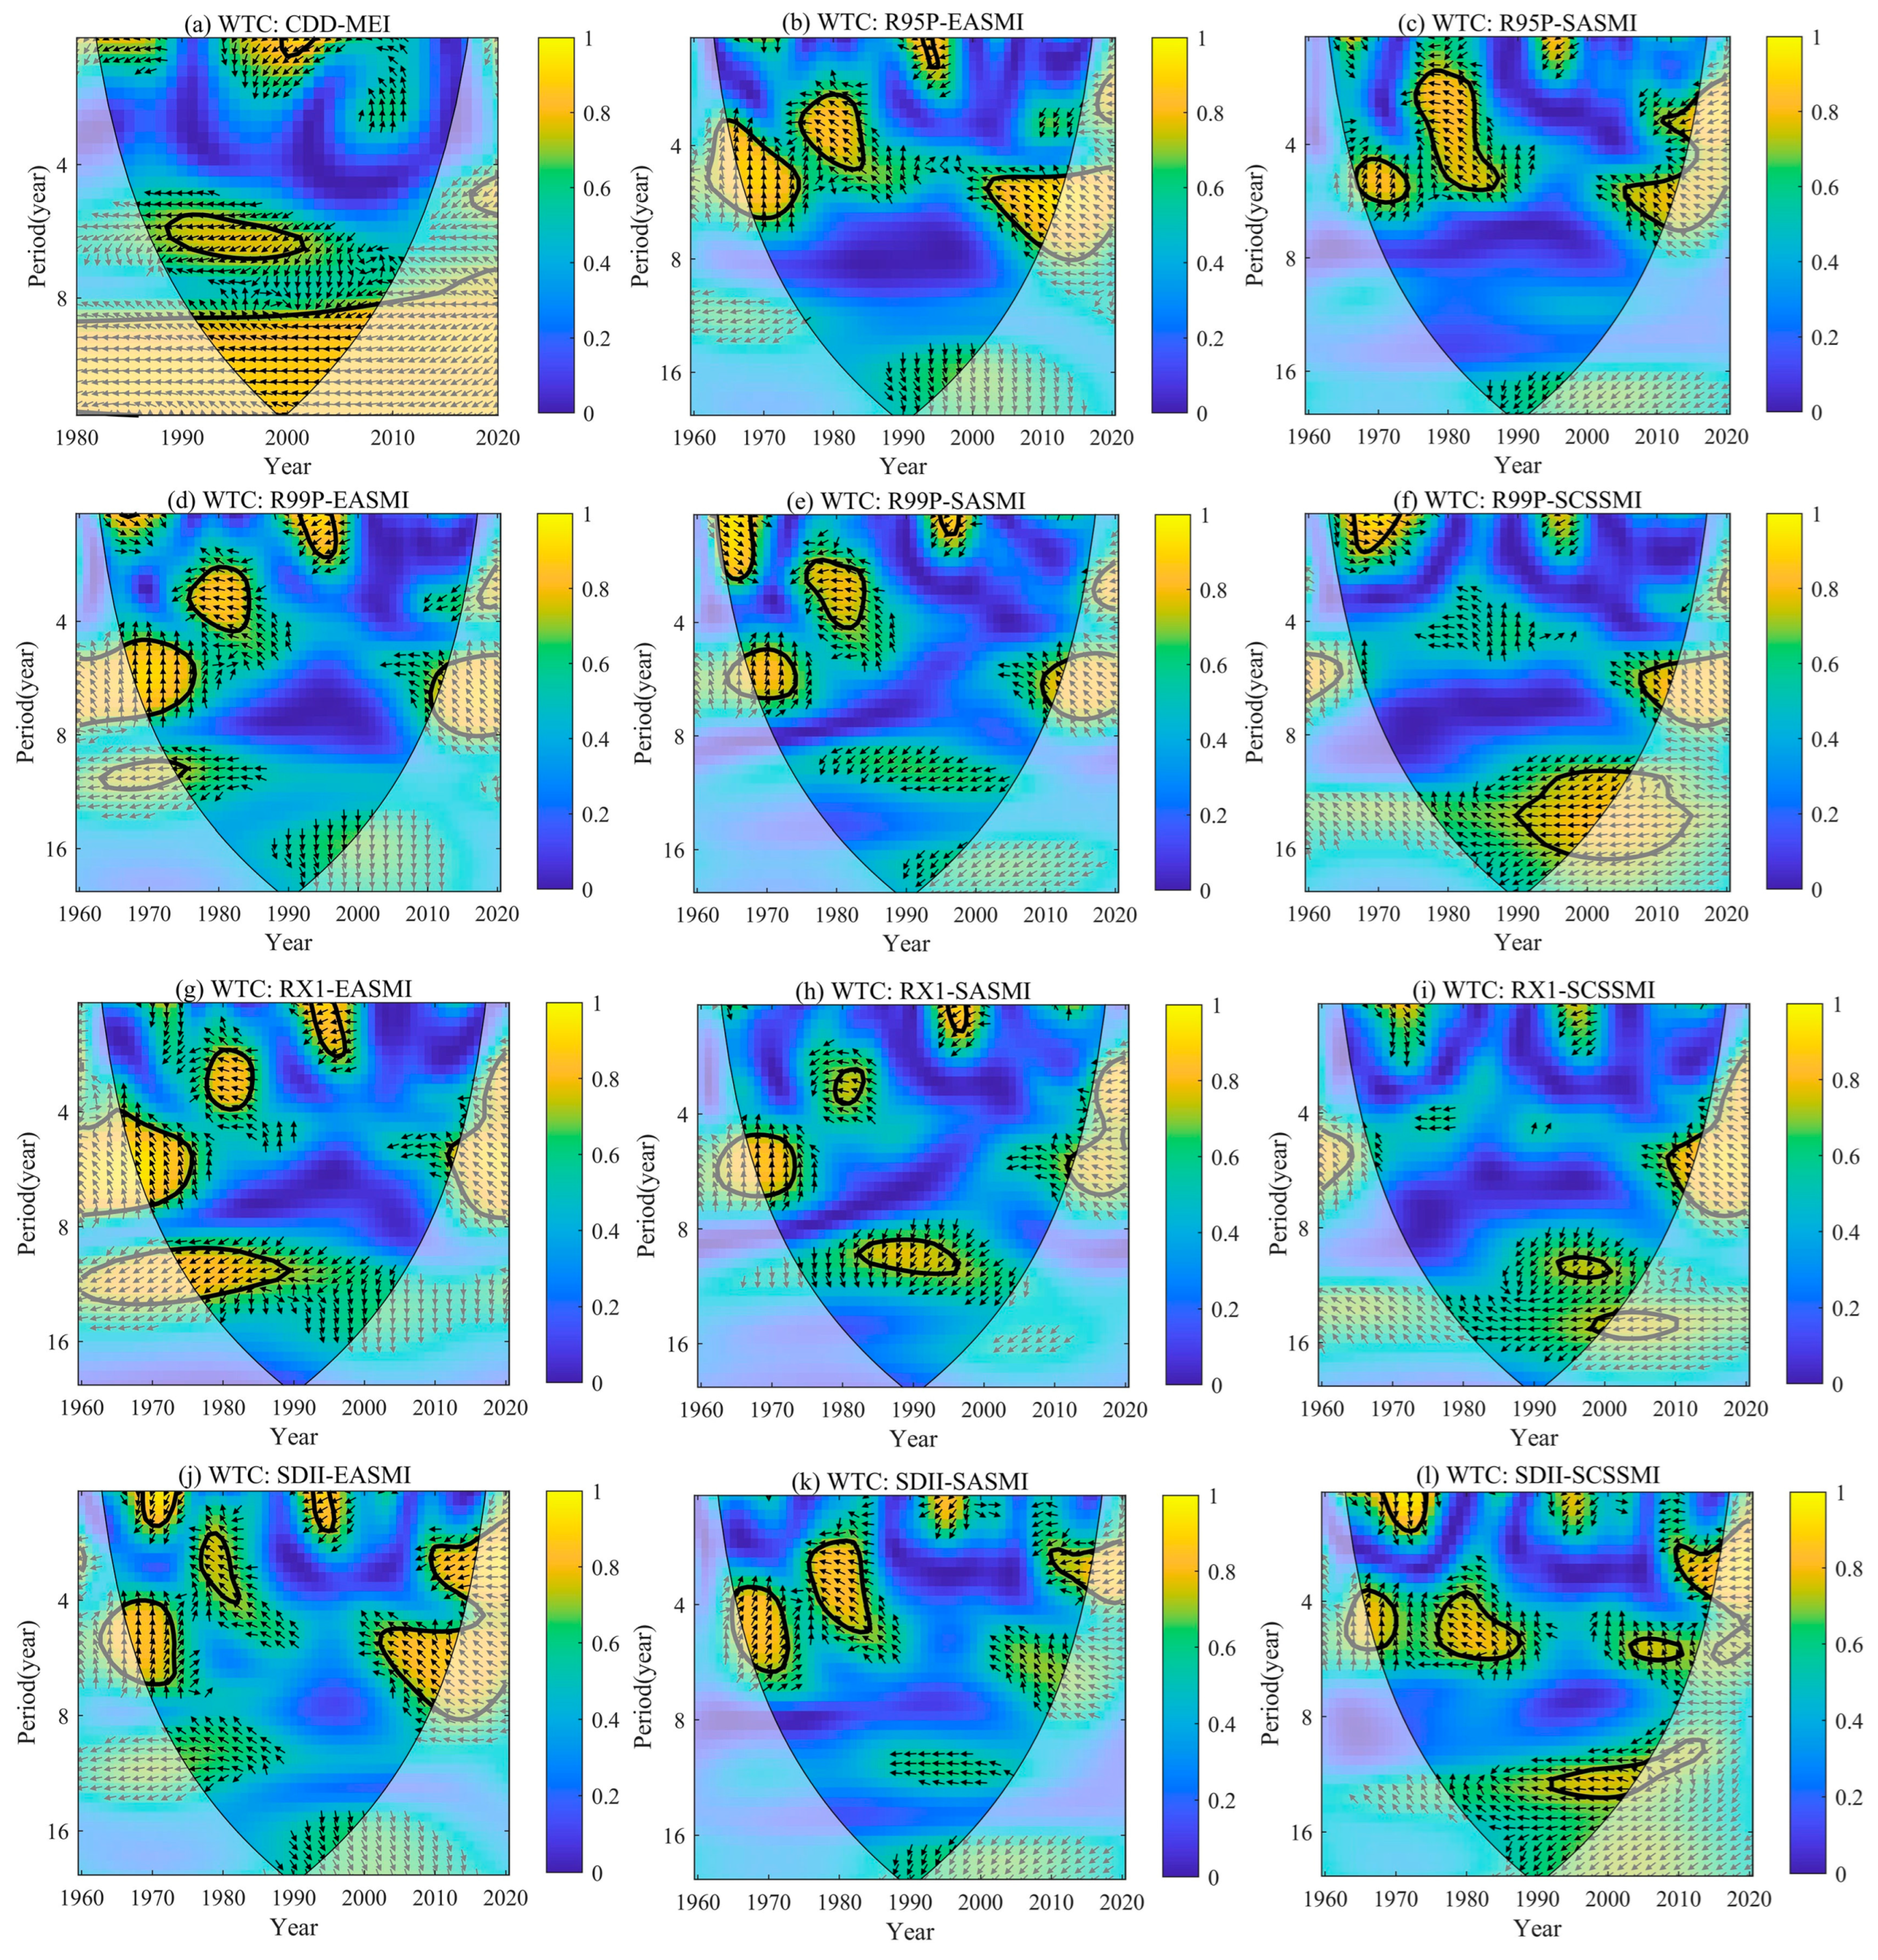
To further analyze the possible influence of atmospheric circulation on EP, CDD, R95P, R99P, RX1, and SDII, according to the magnitude of the correlation coefficients, were selected for cross-transformation (Figure 9) and wavelet coherence analysis (Figure 10) with MEI, EASMI, SASMI, and SCSSMI. The range surrounded by the thick black line in the figure indicates that it passes the 95% confidence level test, the black curve is the cone of influence, and the power spectrum outside the curve is influenced by the wavelet cone without taking it into account. The arrows indicate the phase relationship between the two, with arrows to the right indicating in phase and arrows to the left indicating anti-phase [64,65]. As can be seen from the graph, there are resonance periods of around 4–8 years (1985–1995) and 8–16 years (1994–2005) between the CDD and MEI, both of which exhibit negative phases. Meanwhile, wavelet coherence detects a certain degree of coherence at this time, indicating that droughts may occur in the study area in this timeframe with the weakening of the MEI. R95P has a 4-year (1979–1988) and 2–4-year (1994–2001) resonance period with EASMI and SASMI, both showing a negative phase and strong coherence. According to the results of 4.1.3, R95P also shows a 2–4 year period in 1994–2001, at which time the increase in R95P was mainly influenced by the weakening of the two major monsoons, with the East Asian monsoon having the most pronounced effect on EP. The R99P and RX1 both have a resonance period of about 2–4 years (1994–2000) with EASMI, SASMI, and SCSSMI showing a negative phase with coherence, indicating that EASMI has the strongest influence on R99P and RX1 at this period. SDII has a resonance period of about 2–4 years (1992–2000) with EASMI, SASMI, and SCSSM, which shows a negative phase and strong coherence, and the changes in SDII in this period are mainly influenced by EASMI, SASMI, and SCSSM. In summary, in 1994–2000, the MEI weakening will lead to an increase in the degree of drought, and EHP will increase when the summer monsoon index is weaker in South Asia, East Asia, and the South China Sea.
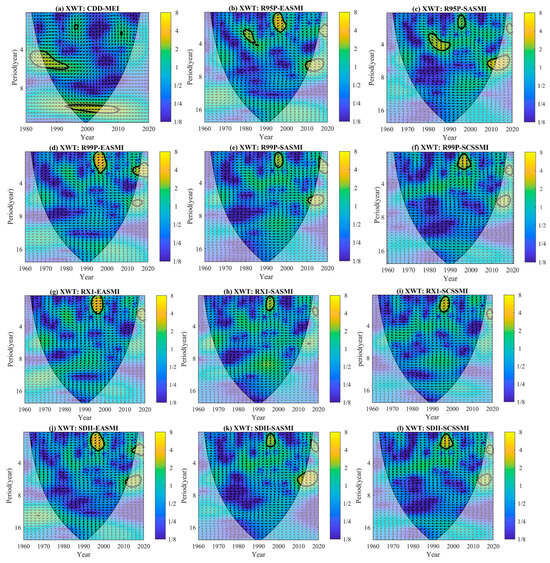
Figure 9.
Cross wavelets of the EPIs and the atmospheric circulation indexes. The area with the thick black outline indicates that it passes the 95% confidence test. The black curve is the cone of influence. The arrow to the right, the two signals are in phase and the arrow to the left, the two signals are in anti-phase.
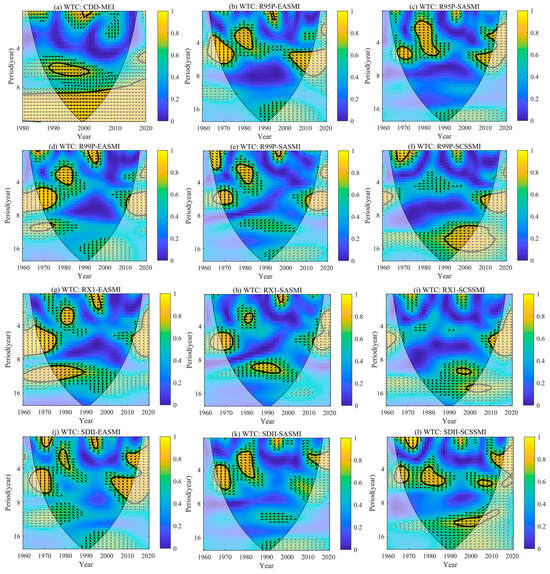
Figure 10.
Wavelet coherence of the EPI with the atmospheric circulation indexes.
The study shows that atmospheric circulation factors have a large influence on EP, but there are significant differences at different times of the year. In other words, the mechanism underlying the influence of atmospheric circulation factors on EP is more complex. CDD and MEI are negatively phased and strongly correlated, and drought conditions in individual regions of the study area are influenced by ENSO events. The related studies have also shown that drought events in southwest China are influenced by ENSO events [66]. EASMI, SASMI, and SCSSMI affect EP events in the study area to varying degrees, suggesting that the strength of summer monsoons in East Asia, South Asia, and the South China Sea can bring about risks such as heavy rainfall or flooding in the study area, which is consistent with the findings of Wang et al. [38]. The East Asian summer monsoon has the strongest influence on extremely heavy precipitation, and a weak East Asian monsoon may lead to an increase in extremely heavy precipitation in the study area. Zhang et al. [67] confirmed that the East Asian monsoon has weakened in strength in recent years, and the northward propagation of the East Asian summer monsoon has been restricted, which leads to a southward shift of the summer rain belt. Thus, the strength of the East Asian summer monsoon is significantly associated with EP in the study area, with EP negatively correlated with the East Asian monsoon in the 1990s when EHP intensified in the study area. That indicates that the response of extremely heavy precipitation to the East Asian monsoon was particularly pronounced during this period. Related studies have shown that the weakening of the Asian monsoon since 1970 and the weakening of the summer monsoons in the South China Sea since the 1980s may be responsible for the enhanced EHP in the study area [63,68].
5.3. Comparison of Regional Differences in EP
In order to verify the result reliability, we made a comparison with the results obtained from previous studies for the global and other regions of the country (Table 6). We found that the study results are generally consistent with their results, but with slight differences in the specifics. The trend of EP in the study area in recent decades is consistent with the global [4], indicating that the change in EP responds to the change in trend under global warming. The general upward trend is also consistent with that of the whole of China [13] and the southwestern region of China [19], but there are slight differences in individual indices, e.g., R95P and R99P are higher than the national average, suggesting that the YGPR is a sensitive area for EP. The total annual precipitation in this study shows an increasing trend, contrary to the Chinese southwestern region, which may be influenced by the topography. As the high mountains ranging in the northwestern and central parts of the YGPR block moisture entering the north-central part of the Chinese southwestern region, the YGPR has more abundant precipitation than the Chinese southwestern region.
Compared with the EPIs in Southern China [16], the Hengduan Mountains [69], the Tibetan Plateau [41], and the Yangtze River Basin [70], the change trend in the study area is more complicated and there are some differences, which may be influenced by regional climate characteristics, topographic differences, and other factors to varying degrees. The trends of CWD and R10 in the study area are opposite to those in South China, and the increasing trends of other EPIs are weaker than those in South China, while the trends of R95P and R99P are larger than those in the Hengduan Mountain area, Loess Plateau, Tibetan Plateau, and Yangtze River Basin. The reasons may be as follows: first, the moisture in the study area mainly comes from the Bay of Bengal in southwest direction and the South China Sea in southeast direction, which is relatively abundant compared to the Hengduan Mountainous Region, the Tibetan Plateau, and the Yangtze River Basin, so the increasing trend in the EHP is larger. However, the YGPR moisture content is lower compared to South China, as the study area is further from the moisture source of the South China Sea [16] and because the western mountains in the study area block part of moisture from the Arabian Sea and the Bay of Bengal; as a result. precipitation in South China is more abundant than in the YGPR. Second, from the topography view, the study area has a special geographic location, including complex and interlocking mountainous terrain that can influence the moisture distribution and create some conditions for the appearance of EP.
Table 6.
The trend slope of EPIs in different regions.
Table 6.
The trend slope of EPIs in different regions.
| Indic | This Study 1960–2020 | Global [4] 1951–2003 | China [13] 1960–2017 | Southwest China [19] 1969–2020 | Southern China [16] 1959–2016 | Hengduan Mountains [69] 1961–2012 | Loess Plateau [71] 1981–2015 | Qinghai-Tibetan Plateau [41] 1961–2016 | Yangtze River Basin [70] 1962–2011 |
|---|---|---|---|---|---|---|---|---|---|
| CDD | 0.32 | −0.55 | — | 0.26 | 0.09 | −0.56 | −0.97 | −2.10 | −0.15 |
| CWD | −0.15 | — | −0.07 | −0.18 | 0.11 | −0.12 | −0.03 | −0.03 | −0.19 |
| R10 | −0.21 | — | — | −0.28 | 0.31 | 0.15 | 0.09 | 0.27 | −0.31 |
| R20 | 0.08 | — | 0.13 | −0.09 | 0.48 | 0.03 | 0.02 | 0.06 | −0.25 |
| R25 | 0.14 | — | — | — | — | 0.09 | 0.00 | — | −0.24 |
| R95p | 8.92 | 4.07 | 0.64 | 8.88 | 17.46 | 4.21 | 2.12 | 2.41 | 2.18 |
| R99P | 5.36 | — | −0.1 | 4.58 | 7.23 | 0.95 | 2.69 | 1.50 | 1.51 |
| RX1 | 1.27 | 0.85 | 0.52 | 0.47 | 2.06 | 0.27 | −0.10 | 0.31 | 0.21 |
| RX5 | 0.42 | 0.55 | 0.10 | 0.35 | 3.22 | −1.20 | −0.10 | 0.54 | −0.68 |
| PRCP-TOP | 0.19 | 10.59 | 6.00 | −5.78 | 19.96 | 5.05 | −2.65 | 7.24 | −11.96 |
| SDII | 0.14 | 0.05 | 0.13 | 0.09 | 0.34 | 0.03 | −0.10 | 0.05 | 0.07 |
5.4. Analysis of Future Trends in EP
Persistence analysis of EP events in the YGPR was carried out using the R/S analysis method in order to calculate the Hurst and fractal dimension D of the EPI, respectively (Table 7). This was combined with the trend changes of EP to analyze the future EP trends. The table shows that each EPI has Hurst > 0.5 and fractal dimension D < 1.5, which indicates that each EPI is persistent, i.e., the future trend will be the same as the past trend with an upward trend basically, except for the CWD and R10. It shows that the study area may have the increasing possibility of heavy rainfall and flood and the increasing drought trend in some areas of study area, which will have a certain impact on the life of the local people and the development of agriculture. In the future, the local community needs to strengthen water resource management and local infrastructure to mitigate the effects of these meteorological disasters.
Table 7.
Analysis of future trends in EP.
6. Conclusions
This study analyzed the variation characteristics of EP and investigated the influence of geographical factors and atmospheric circulation on EP in the YGPR using daily precipitation data from 83 meteorological stations for the period 1960 to 2020.
The conclusions are as follows:
- On the time scale, there has been an overall increase for EP in the YGPR since 1960, with all indices except CWD and R10 of different degrees of increasing trends, in which the increasing trends of CDD, R95P, P99P, RX1, and SDII are the most obvious (p < 0.05). It indicates that the drought days in the study area may increase and the possibility of precipitation concentration and intensity and EHP may enhance.
- At the spatial scale, there is significant spatial heterogeneity for EP in the study area. ED decreases from northwest to east, with the high-value area in the northwest. Total annual precipitation and EHP show a decreasing trend from southeast to northwest, with the high-value area in southern Guangxi, and total annual precipitation also shows a decreasing trend from southwest to north-central. Since 1960, the ED in the western region of the study area has been enhanced and the extreme heavy precipitation in the central-eastern and southeastern regions shows an upward trend. This indicates that the western region is more prone to droughts and the central-eastern and southeastern regions may have frequent EP events and flooding, which will increase the flood control pressure of the local people’s lives, agricultural production, and ecological construction.
- Except for CDD and CWD, correlation analysis shows a good correlation between the other EPIs and annual precipitation (p < 0.01) and a good indication of EP events. This means that their variations will have a significant effect on the total annual precipitation, in which R10, R20, and R25 have the most obvious effect on EP.
- EP is influenced by geographical factors (longitude, latitude, and altitude), EHP has significantly positive and negative correlations with longitude (p < 0.05) and the latitude (p < 0.05), respectively. The relationship with altitude is complex, and the extremely heavy precipitation decreases with increasing altitude in the lower altitude regions and increases with increasing altitude in higher altitude regions. EHP mainly occurs at lower and higher altitudes, and drought is prone to happen in mid-altitude areas.
- EP is closely related to atmospheric circulation. The degree of drought variability in the study area is significantly negatively correlated with ENSO events (p < 0.05). The process of extremely heavy precipitation variability is significantly negatively correlated with the summer monsoons in South Asia, East Asia, and the South China Sea (p < 0.05), with the East Asian monsoon having the most pronounced influence. The sharp change in EHP in the 1990s is mainly due to the weakening of the East Asian summer monsoons.
- The R/S analysis shows that all Hurst indexes of EPIs are greater than 0.5 and have persistence. Joint analysis with the historical trend of EPIs predicts that EPIs in the study area, except CWD and R10, have an increasing trend in the future, i.e., they are prone to drought and EP events in the future.
This study reveals the evolution of EP in the YGPR from a spatial and temporal perspective and explores the impact mechanisms of the geographic factors and several typical atmospheric circulation indices on the EP. From the analysis, it can be seen that the overall trend of EP in the study area shows an upward trend, and there are some spatial differences due to the influence of geography and other factors. The current trend of climate change indicates that the risk of drought and flooding due to EP will continue to increase, which will not only harm regional agricultural production but also have an impact on people’s lives. These results may provide some reference value for regional water resource management, meteorological warnings, and the agricultural production safeguard. In order to safeguard local social life, community infrastructure, disaster prevention, and forecasting measures should be strengthened. However, this paper is inadequate in the analysis of the spatial and temporal changes of EP and the evolution mechanism study. In the study, 83 national meteorological stations are used, but the station number in high-altitude areas are sparse, which may result in some deviations in the effect of altitude on EP, so we will consider the use of satellite data or climate model data for further comprehensive research. Under the background of global warming, the mechanism of EP change in various regions and the affecting factors are complex, and there may be other affecting factors in addition to geographic factors and atmospheric circulation factors. For example, human activities are a key factor in exacerbating climate change, just as greenhouse gas emissions and land-use changes will have an impact on EP. Sunspot activity is related to climate change on Earth to some extent, and have an abnormal impact on precipitation through the coupled air-sea feedback mechanism; some studies have concluded that EP shows a downward trend when sunspots are active [72]. Therefore, the EP study will be further explored to consider other factors such as human activities, land use, and sunspots.
Author Contributions
Conceptualization, H.Z. and R.Z.; methodology, H.Z. and Q.J.; software, R.Z.; validation, R.Z., Q.J. and Y.H.; formal analysis, Y.H. and R.Z.; investigation, G.K., Y.X. and J.H.; resources, H.Z.; data curation, R.Z., G.K., Y.X. and J.H.; writing—original draft preparation, R.Z. and H.Z.; writing—review and editing, H.Z.; visualization, Y.H.; supervision, H.Z.; project administration, H.Z., Q.J. and Y.H.; funding acquisition, Y.H. and H.Z. All authors have read and agreed to the published version of the manuscript.
Funding
The study was funded by National Natural Science Foundation of China through Grant No.52164009, the Scientific Research Fund Approved by the Education Department of Yunnan Province No.202350129 and the Belt and Road Special Foundation of The National Key Laboratory of Water Disaster Prevention No.2022490411.
Institutional Review Board Statement
Not Applicable.
Informed Consent Statement
Not Applicable.
Data Availability Statement
The following supporting information can be downloaded online. AO data is from https://www.cpc.ncep.noaa.gov/ (accessed on 8 September 2023), PDO, MEI, and SOI date from https://psl.noaa.gov/ (accessed on 8 September 2023), ISHII, SCSSHII and WPSHII date from http://cmdp.ncc-cma.net/cn/index.htm (accessed on 8 September 2023), NAO, EASMI, SASM and SCSSMI data from http://lijianping.cn/dct/page/1 (accessed on 8 September 2023).
Conflicts of Interest
The authors declare no conflict of interest.
References
- Zhai, P.; Zhou, B.; Chen, Y.; Yu, R. Several new understandings in the climate change science. Clim. Chang. Res. 2021, 17, 629–635. [Google Scholar]
- Arias, P.; Bellouin, N.; Coppola, E.; Jones, R.; Krinner, G.; Marotzke, J.; Vaishali, N.; Matthew, P.; Plattner, G.; Joeri, R. IPCC Climate Change 2021: The Physical Science Basis. Contribution of Working Group I to the Sixth Assessment Report of the Intergovernmental Panel on Climate Change; Cambridge University Press: Cambridge, UK, 2021. [Google Scholar]
- Mo, K. Extreme Climate Change in Zhejiang Province and Future Flood Changes in Ou River Basin. Master’s Thesis, Zhejiang University, Hangzhou, China, 2020. [Google Scholar]
- Alexander, L.V.; Zhang, X.; Peterson, T.C.; Caesar, J.; Gleason, B.; Klein Tank, A.M.G.; Haylock, M.; Collins, D.; Trewin, B.; Rahimzadeh, F.; et al. Global observed changes in daily climate extremes of temperature and precipitation. J. Geophys. Res. 2006, 111. [Google Scholar] [CrossRef]
- Ortiz-Gómez, R.; Muro-Hernández, L.J.; Flowers-Cano, R.S. Assessment of extreme precipitation through climate change indices in Zacatecas, Mexico. Theor. Appl. Climatol. 2020, 141, 1541–1557. [Google Scholar] [CrossRef]
- Kiktev, D.; Sexton, D.M.H.; Alexander, L.; Folland, C.K. Comparison of Modeled and Observed Trends in Indices of Daily Climate Extremes. J. Clim. 2003, 16, 3560–3571. [Google Scholar] [CrossRef]
- Liu, Y.R.; Li, Y.P.; Ma, Y.; Huang, G.H.; Zhou, X. Analyzing extreme precipitation and temperature in Central Asia as well as quantifying their main and interactive effects under multiple uncertainties. J. Hydrol. 2022, 607, 127469. [Google Scholar] [CrossRef]
- van den Besselaar, E.J.M.; Klein Tank, A.M.G.; Buishand, T.A. Trends in European precipitation extremes over 1951–2010. Int. J. Climatol. 2012, 33, 2682–2689. [Google Scholar] [CrossRef]
- Fan, Y.; Li, J.; Zhu, S.; Li, H.; Zhou, B. Trends and variabilities of precipitation and temperature extremes over Southeast Asia during 1981–2017. Meteorol. Atmos. Phys. 2022, 134, 78. [Google Scholar] [CrossRef]
- Jakob, D.; Walland, D. Variability and long-term change in Australian temperature and precipitation extremes. Weather Clim. Extrem. 2016, 14, 36–55. [Google Scholar] [CrossRef]
- Ezaz, G.T.; Zhang, K.; Li, X.; Shalehy, M.H.; Hossain, M.A.; Liu, L. Spatiotemporal changes of precipitation extremes in Bangladesh during 1987–2017 and their connections with climate changes, climate oscillations, and monsoon dynamics. Glob. Planet. Chang. 2022, 208, 103712. [Google Scholar] [CrossRef]
- Quan, N.T.; Khoi, D.N.; Hoan, N.X.; Phung, N.K.; Dang, T.D. Spatiotemporal Trend Analysis of Precipitation Extremes in Ho Chi Minh City, Vietnam during 1980–2017. Int. J. Disaster Risk Sci. 2020, 12, 131–146. [Google Scholar] [CrossRef]
- Ji, D.-J.-Q.; Yuan, Y.; Han, J. Spatial-temporal Changes and Trend Predictions of Extreme Precipitation Events in China. China Rural Water Hydropower 2022, 10, 74–80. [Google Scholar]
- Zhai, P.; Zhou, X. Changes in Temperature and Precipitation and Their Impacts on Drought in China during 1951–2003. Clim. Change Res. 2005, 1, 16–18. [Google Scholar]
- He, H.; Lu, H.; Chen, S. Temporal-spatial variation characteristics of the extreme precipitation days over South China from 1961 to 2010. J. Anhui Agric. Sci. 2012, 40, 7256–7259+7276. [Google Scholar]
- Dai, S.; Luo, H.; Li, M.; Li, H.; Zhen, Q.; Hu, Y. Extreme precipitation vents variations in southern China from 1959 to 2016. Chin. J. Agric. Resour. Reg. Plan. 2022, 43, 128–142. [Google Scholar]
- Ren, Z.; Zhang, M.; Wang, S.; Qiang, F.; Zhu, X.; Dong, L. Changes in daily extreme precipitation events in South China from 1961 to 2011. J. Geogr. Sci. 2014, 25, 58–68. [Google Scholar] [CrossRef]
- Zheng, G.; Li, Y.; Chen, Q.; Zhou, X.; Gao, G.; Li, M.; Duan, T. The increasing predominance of extreme precipitation in Southwest China since the late 1970s. Atmos. Ocean. Sci. Lett. 2022, 15, 100227. [Google Scholar] [CrossRef]
- Chen, Z.; Wang, L.; Li, X.; Xue, Y.; Jia, H. Spatiotemporal Change Characteristics of Extreme Precipitation in Southwestern China and its Relationship with Intense ENSO Events. Plateau Meteorol. 2022, 41, 604–616. [Google Scholar]
- Ding, W. Spatial and Temporal Variability of the Daily Precipitation in Southwest China. Resour. Environ. Yangtze Basin 2014, 23, 1071–1079. [Google Scholar]
- Yuan, W.; Zheng, J.; Dong, K. Spatial and temporal variation in extreme precipitation events in Southwestern China during 1962–2012. Resour. Sci. 2014, 36, 766–772. [Google Scholar]
- Han, G. Analysis on Climate Change of the Qinghai-Tibet Plateau in the Recent 50 Years. Master’s Thesis, Chengdu University of Technology, Chengdu, China, 2012. [Google Scholar]
- Wu, S.; Hu, Z.; Wang, Z.; Cao, S.; Yang, Y.; Qu, X.; Zhao, W. Spatiotemporal variations in extreme precipitation on the middle and lower reaches of the Yangtze River Basin (1970–2018). Quat. Int. 2021, 592, 80–96. [Google Scholar] [CrossRef]
- Qin, Z.; Peng, T.; Singh, V.P.; Chen, M. Spatio-temporal variations of precipitation extremes in Hanjiang River Basin, China, during 1960–2015. Theor. Appl. Climatol. 2019, 138, 1767–1783. [Google Scholar] [CrossRef]
- Li, Q.; Zeng, T.; Chen, Q.; Han, X.; Weng, X.; He, P.; Zhou, Z.; Du, Y. Spatio-temporal changes in daily extreme precipitation for the Lancang–Mekong River Basin. Nat. Hazards 2022, 115, 641–672. [Google Scholar] [CrossRef]
- Zhang, D.-D.; Yan, D.-H.; Wang, Y.-C.; Lu, F.; Wu, D. Changes in extreme precipitation in the Huang-Huai-Hai River basin of China during 1960–2010. Theor. Appl. Climatol. 2014, 120, 195–209. [Google Scholar] [CrossRef]
- Zhang, Y.; Liu, C.; Liang, K.; Lu, J. Spatio-temporal variation of precipitation in the Yarlung Zangbo river basin. Acta Geogr. Sin. 2022, 77, 603–618. [Google Scholar]
- Chun, L.; Qin, F.; Bao, L.; Na, Y.; Bao, Y.; Bao, S. Spatiotemporal Variation of Extreme Precipitation lndices in Inner Mongola in Recent 55 Years. Ar. Zone Res. 2019, 36, 963–972. [Google Scholar]
- Ma, A.; Yue, D.; Zhao, J.; Hu, Q. Spatiotemporal variation and effect of extreme precipitation in Inner Mongolia in recent 60 years. Ar. Zone Res. 2020, 37, 74–85. [Google Scholar]
- Gan, L.; Liu, R.; Ji, Q.; Li, X.; You, L. Spatio-Temporal Evolution Characteristics of Extreme Precipitation in Sichuan Province, China. Mt. Res. 2021, 39, 10–24. [Google Scholar]
- Xu, Y.; Lei, Q.; Zhou, J.; Zhang, Y.; Wu, S.; Zhai, L.; Wang, H.; Li, Y.; Liu, H. Study on the change characteristics of extreme climate indices from 1960 to 2015 in Yunnan province, China. Chin. J. Agric. Resour. Reg. Plan. 2020, 41, 15–27. [Google Scholar]
- Saini, A.; Sahu, N. Decoding trend of Indian summer monsoon rainfall using multimethod approach. Stoch. Environ. Res. Risk Assess. 2021, 35, 2313–2333. [Google Scholar] [CrossRef]
- Saini, A.; Sahu, N.; Duan, W.; Kumar, M.; Avtar, R.; Mishra, M.; Kumar, P.; Pandey, R.; Behera, S. Unraveling Intricacies of Monsoon Attributes in Homogenous Monsoon Regions of India. Front. Earth Sci. 2022, 10, 794634. [Google Scholar] [CrossRef]
- Varikoden, H.; Revadekar, J. On the extreme rainfall events during the southwest monsoon season in northeast regions of the Indian subcontinent. Meteorol. Appl. 2020, 27, e1822. [Google Scholar] [CrossRef]
- Mishra, V.; Thirumalai, K.; Singh, D.; Aadhar, S. Future exacerbation of hot and dry summer monsoon extremes in India. NPJ Clim. Atmos. Sci. 2020, 3, 10. [Google Scholar] [CrossRef]
- Xia, Y.; Long, Y.; Ren, Q.; Wang, F.; Gao, P. Characteristics of Extreme Daily Precipitation Events Over Yunnan-Guizhou Plateau during Boreal Summer. J. Trop. Meteorol. 2018, 34, 239–249. [Google Scholar]
- Yan, X. Study on Temporal and Spatial Distribution of Extreme Precipitation in Typical Geomorphological Areas of Yunnan-Guizhou Plateau Based on GIS. Master’s Thesis, Guizhou University, Guiyang, China, 2018. [Google Scholar]
- Wang, X.; Zheng, X.; Huang, W.; Yang, P.; Zhou, D. Change characteristics of severe rainfall and extreme rainfall in flood season over Yunnan-Guizhou Plateau in recent 47 years. Resour. Environ. Yangtze Basin 2010, 19, 1350–1355. [Google Scholar]
- Wu, S.; Pan, T.; Cao, J.; He, D.; Xiao, Z. Barrier-corridor effect of longitudinal range-gorge terrain on monsoons in Southwest China. Geogr. Res. 2012, 31, 1–13. [Google Scholar]
- Guo, C. Study on the Characteristics of Extreme Climate Events in Xinjiang in Recent 56 Year. Master’s Thesis, Xinjiang Normal University, Urumqi, China, 2019. [Google Scholar]
- Zhao, J. Study on the Variation Characteristics of Extreme Climate Events on the Qinghai-Tibet. Plateau during 1961–2016. Master’s Thesis, Lanzhou University, Lanzhou, China, 2019. [Google Scholar]
- Shen, L.; Yang, Y.; Wu, J.; Bai, L. Spatial and temporal variation characteristics of extreme climate events in the yellow river basin. Res. Soil. Water Conserv. 2022, 29, 231–242. [Google Scholar]
- Mann, H.B. Nonparametric tests against trend. Econom. J. Econom. Soc. 1945, 13, 245–259. [Google Scholar] [CrossRef]
- Kendall, M.G. Rank Correlation Methods; Charles Griffin: London, UK, 1975. [Google Scholar]
- Spearman, C. The Proof and Measurement of Association between Two Things; Appleton-Century-Crofts: New York, NY, USA, 1961. [Google Scholar]
- Onyutha, C. Graphical-statistical method to explore variability of hydrological time series. Hydrol. Res. 2021, 52, 266–283. [Google Scholar] [CrossRef]
- Şen, Z. Innovative trend analysis methodology. J. Hydrol. Eng. 2012, 17, 1042–1046. [Google Scholar] [CrossRef]
- Nakken, M. Wavelet analysis of rainfall–runoff variability isolating climatic from anthropogenic patterns. Environ. Model. Softw. 1999, 14, 283–295. [Google Scholar] [CrossRef]
- Beecham, S.; Chowdhury, R. Temporal characteristics and variability of point rainfall: A statistical and wavelet analysis. Int. J. Climatol. J. R. Meteorol. Soc. 2010, 30, 458–473. [Google Scholar] [CrossRef]
- Zou, L.; Yu, J.; Wang, F.; Zhang, Y. Spatial-temporal variations of extreme precipitation indices and their response to atmospheric circulation factors in the Weihe River Basin. Ar. Zone Res. 2021, 38, 764–774. [Google Scholar]
- Hu, S.; Qiu, H.; Song, J.; Ma, S.; Yang, D.; Pei, Y.; Yang, W.; Cao, M. Influencing mechanisms of climate change on runoff process in the north slope of Qinling Mountains: A case of the Bahe River Basin. Ar. Land. Geogr. 2017, 40, 967–978. [Google Scholar]
- Hurst, H.E. Long-term storage capacity of reservoirs. Trans. Am. Soc. Civ. Eng. 1951, 116, 770–799. [Google Scholar] [CrossRef]
- Granero, M.S.; Segovia, J.T.; Pérez, J.G. Some comments on Hurst exponent and the long memory processes on capital markets. Phys. A Stat. Mech. Its Appl. 2008, 387, 5543–5551. [Google Scholar] [CrossRef]
- Chen, J.; Tao, H.; Liu, J.; Zhai, J.; Su, B.; Jiang, T. Temporal and Spatial Variations of Extreme Precipitation in China-Pakistan Economic Corridor. Plateau Meteorol. 2021, 40, 1048–1056. [Google Scholar]
- Duan, L.; Wang, S.; Feng, J. The National Drought Situation in 2010 and Its Impact and Causes. J. Arid. Meteorol. 2011, 29, 126–132. [Google Scholar]
- Ban, J.; Miao, Q.; Li, X. Analysis of Characteristics of Temperature Variations in Southwest China in Recent 50 Years. Resour. Environ. Yangtze Basin 2006, 15, 346–351. [Google Scholar]
- Ren, R.; Shan, C.; Zhang, Y.; Ding, W.; Gu, Y.; Lou, D. Spatio-Temporal Characteristics of Precipitation and Water Vapor Resource over the Yunnan-Guizhou Plateau in Summer. Meteorol. Mon. 2017, 43, 315–322. [Google Scholar]
- Chen, M.; Zhi, H.; Lu, Q. Analysis of Extreme Precipitation Events and Their Circulation Characteristics in Guangxi in the Last 50 Years. In Proceedings of the 33rd Annual Meeting of the Chinese Meteorological Society S6 Climate Variability and Extreme Events in East Asia and Their Prediction, Xi’an, China, 1 November 2016. [Google Scholar]
- Liu, L.; Xu, Z.X. Regionalization of precipitation and the spatiotemporal distribution of extreme precipitation in southwestern China. Nat. Hazards 2015, 80, 1195–1211. [Google Scholar] [CrossRef]
- Wang, L.; Chen, S.; Zhu, W.; Ren, H.; Zhang, L.; Zhu, L. Spatiotemporal variations of extreme precipitation and its potential driving factors in China’s North-South Transition Zone during 1960–2017. Atmos. Res. 2021, 252, 105429. [Google Scholar] [CrossRef]
- Dong, X.; Ni, X. Spatiotemporal Variation of Extreme Precipitation at Different Elevations in Southwest China. J. Southwest Univ. (Nat. Sci. Ed.) 2022, 44, 110–121. [Google Scholar]
- Tai, J.; Dong, J.; Liu, G.; Zhang, G.; Zhu, T.; Song, W.; Wang, C.; Chen, A.; Wang, S. Characteristics of Temperature and Precipitation Change along Increasing Elevations in Different Agriculture Regions of Southwest China. Chin. J. Agrometeorol. 2016, 37, 379–389. [Google Scholar]
- Wang, H.J. The weakening of the Asian monsoon circulation after the end of 1970’s. Adv. Atmos. Sci. 2001, 18, 376–386. [Google Scholar]
- Lorenzo-Lacruz, J.; Morán-Tejeda, E.; Vicente-Serrano, S.M.; Hannaford, J.; García, C.; Peña-Angulo, D.; Murphy, C. Streamflow frequency changes across western Europe and interactions with North Atlantic atmospheric circulation patterns. Glob. Planet. Change 2022, 212, 103797. [Google Scholar] [CrossRef]
- Hong, M.; Liu, K.; Zhang, D.; Zhang, R.; Ge, J. The Correlation of the Western Pacific Subtropical High Interannual Variability Wit Tropical SST and Atmospheric Circulation Anomalies Based on the Cross-Wavelet Analysis. J. Trop. Meteorol. 2020, 36, 166–179. [Google Scholar]
- Cheng, Q.; Gao, L.; Zuo, X.; Zhong, F. Statistical analyses of spatial and temporal variabilities in total, daytime, and nighttime precipitation indices and of extreme dry/wet association with large-scale circulations of Southwest China, 1961–2016. Atmos. Res. 2019, 219, 166–182. [Google Scholar] [CrossRef]
- Zhang, Q.; Xu, C.-Y.; Zhang, Z.; Chen, Y.D.; Liu, C.-L.; Lin, H. Spatial and temporal variability of precipitation maxima during 1960–2005 in the Yangtze River basin and possible association with large-scale circulation. J. Hydrol. 2008, 353, 215–227. [Google Scholar] [CrossRef]
- Li, J.P.; Zheng, Q.C. A new monsoon index and the geographical distribution of the global monsoons. Adv. Atmos. Sci. 2003, 20, 299–302. [Google Scholar]
- Zhang, K.; Pan, S.; Cao, L.; Wang, Y.; Zhao, Y.; Zhang, W. Spatial distribution and temporal trends in precipitation extremes over the Hengduan Mountains region, China, from 1961 to 2012. Quat. Int. 2014, 349, 346–356. [Google Scholar] [CrossRef]
- Wang, Q. Changes in Extreme Events of Temperature and Precipitation in the Yangtze River Basin during 1962–2011. Master’s Thesis, Northwest Normal University, Lanzhou, China, 2014. [Google Scholar]
- Yang, W.; Sun, J.; Kang, Y.; Ma, H.; Xu, R. Temporal and spatial changes of extreme weather indices in the Loess Plateau. Arid. Land. Geogr. 2020, 43, 1456–1466. [Google Scholar]
- Meng, Q.; Gao, X.; Bai, H.; Zhang, Y.; Wang, H. Temporal and Spatial Variations and Trends of Extreme Precipitation in Qinling. Mountains during the Period. 1960–2015. Res. Soil Water Conserv. 2019, 26, 171–178+183. [Google Scholar]

Disclaimer/Publisher’s Note: The statements, opinions and data contained in all publications are solely those of the individual author(s) and contributor(s) and not of MDPI and/or the editor(s). MDPI and/or the editor(s) disclaim responsibility for any injury to people or property resulting from any ideas, methods, instructions or products referred to in the content. |
© 2023 by the authors. Licensee MDPI, Basel, Switzerland. This article is an open access article distributed under the terms and conditions of the Creative Commons Attribution (CC BY) license (https://creativecommons.org/licenses/by/4.0/).