Analysis of Extreme Precipitation Variation Characteristics and the Influencing Factors in the Yunnan-Guizhou Plateau Region, China
Abstract
:1. Introduction
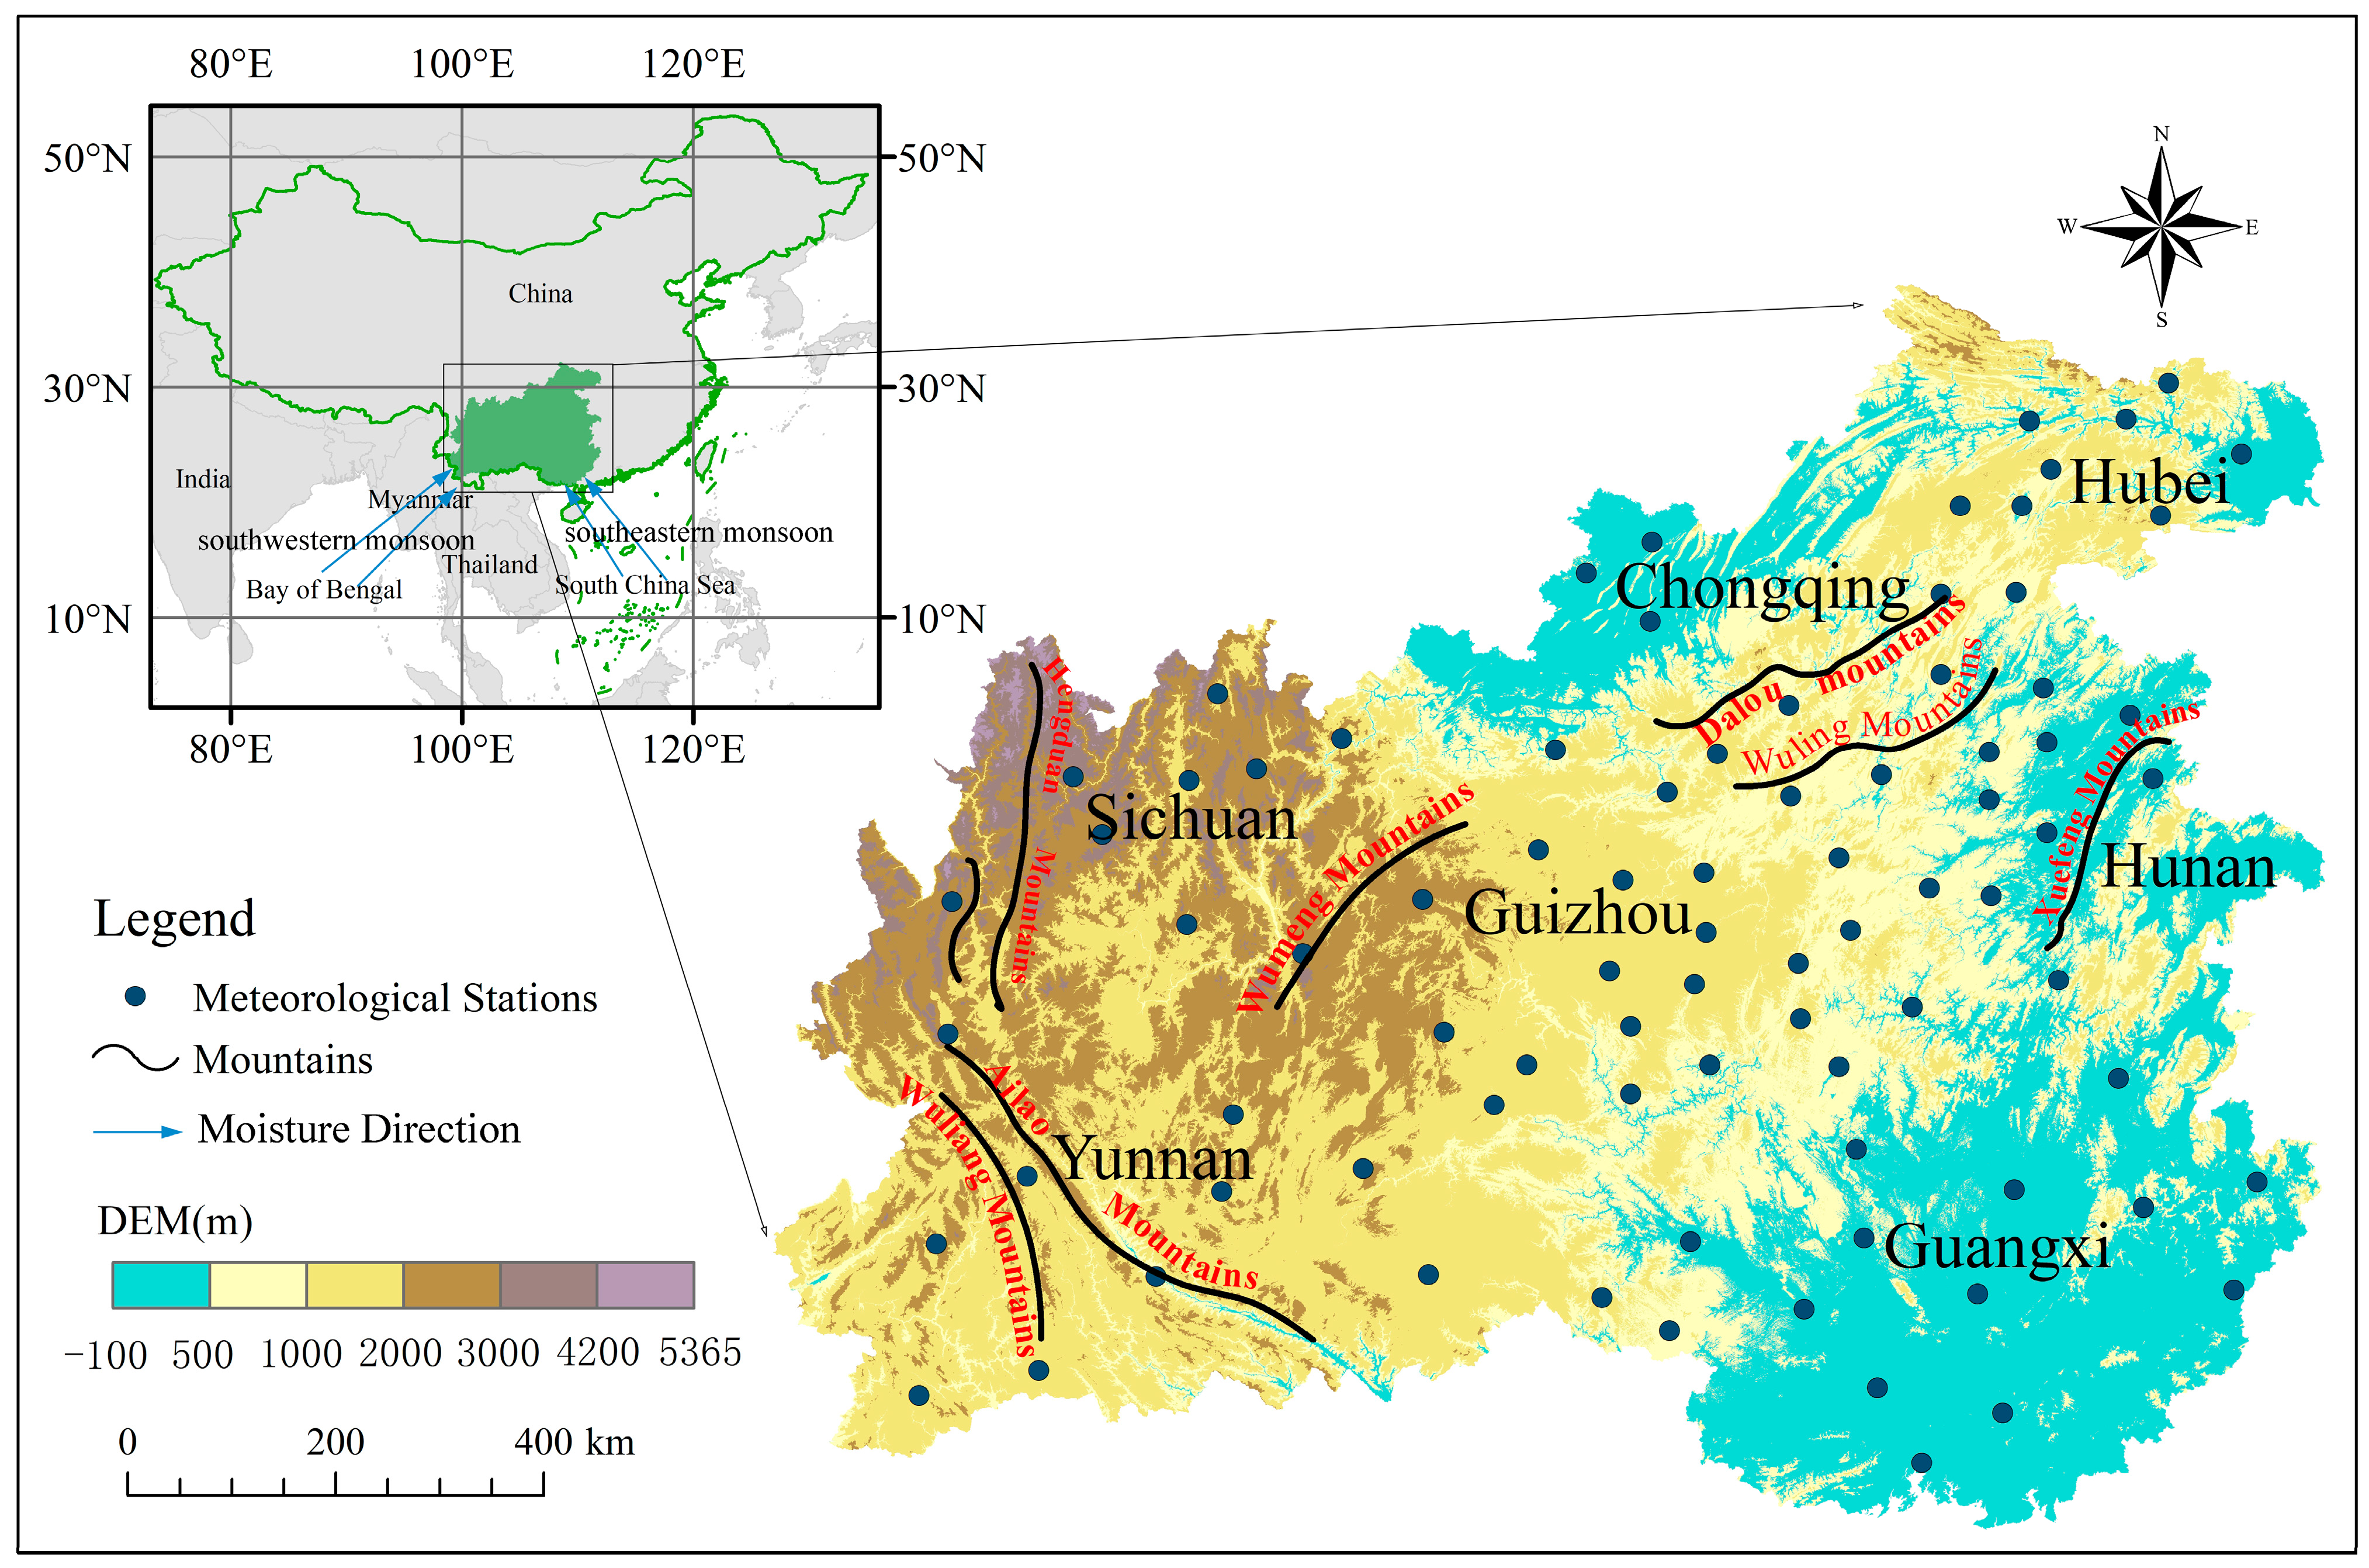
2. Study Area
3. Data and Methods
3.1. Data
3.2. Methods
3.2.1. Definition and Calculation of EPIs
3.2.2. Mann–Kendall Trend Test and Sen’s Slope
3.2.3. Mann–Kendall Mutation Test
3.2.4. Continuous Wavelet Analysis
3.2.5. Kriging Interpolation
3.2.6. Cross Wavelet Transform (XWT) and Wavelet Coherence (WTC)
3.2.7. R/S Analysis
4. Results and Analysis
4.1. Temporal Variability of EP Characteristics
4.1.1. Trend Analysis of EP
4.1.2. Analysis of Abrupt Changes in EP
4.1.3. Periodic Analysis of EP
4.2. Spatially Variable Characteristics of EP
4.3. Correlation Analysis of EPIs
5. Discussion
5.1. EP in Relation to Geographical Factors
5.1.1. Relationship between EP and the Latitude and Longitude Factors
5.1.2. Relationship between EP and Elevation
5.2. EP in Relation to Atmospheric Circulation Factorrs
5.3. Comparison of Regional Differences in EP
| Indic | This Study 1960–2020 | Global [4] 1951–2003 | China [13] 1960–2017 | Southwest China [19] 1969–2020 | Southern China [16] 1959–2016 | Hengduan Mountains [69] 1961–2012 | Loess Plateau [71] 1981–2015 | Qinghai-Tibetan Plateau [41] 1961–2016 | Yangtze River Basin [70] 1962–2011 |
|---|---|---|---|---|---|---|---|---|---|
| CDD | 0.32 | −0.55 | — | 0.26 | 0.09 | −0.56 | −0.97 | −2.10 | −0.15 |
| CWD | −0.15 | — | −0.07 | −0.18 | 0.11 | −0.12 | −0.03 | −0.03 | −0.19 |
| R10 | −0.21 | — | — | −0.28 | 0.31 | 0.15 | 0.09 | 0.27 | −0.31 |
| R20 | 0.08 | — | 0.13 | −0.09 | 0.48 | 0.03 | 0.02 | 0.06 | −0.25 |
| R25 | 0.14 | — | — | — | — | 0.09 | 0.00 | — | −0.24 |
| R95p | 8.92 | 4.07 | 0.64 | 8.88 | 17.46 | 4.21 | 2.12 | 2.41 | 2.18 |
| R99P | 5.36 | — | −0.1 | 4.58 | 7.23 | 0.95 | 2.69 | 1.50 | 1.51 |
| RX1 | 1.27 | 0.85 | 0.52 | 0.47 | 2.06 | 0.27 | −0.10 | 0.31 | 0.21 |
| RX5 | 0.42 | 0.55 | 0.10 | 0.35 | 3.22 | −1.20 | −0.10 | 0.54 | −0.68 |
| PRCP-TOP | 0.19 | 10.59 | 6.00 | −5.78 | 19.96 | 5.05 | −2.65 | 7.24 | −11.96 |
| SDII | 0.14 | 0.05 | 0.13 | 0.09 | 0.34 | 0.03 | −0.10 | 0.05 | 0.07 |
5.4. Analysis of Future Trends in EP
6. Conclusions
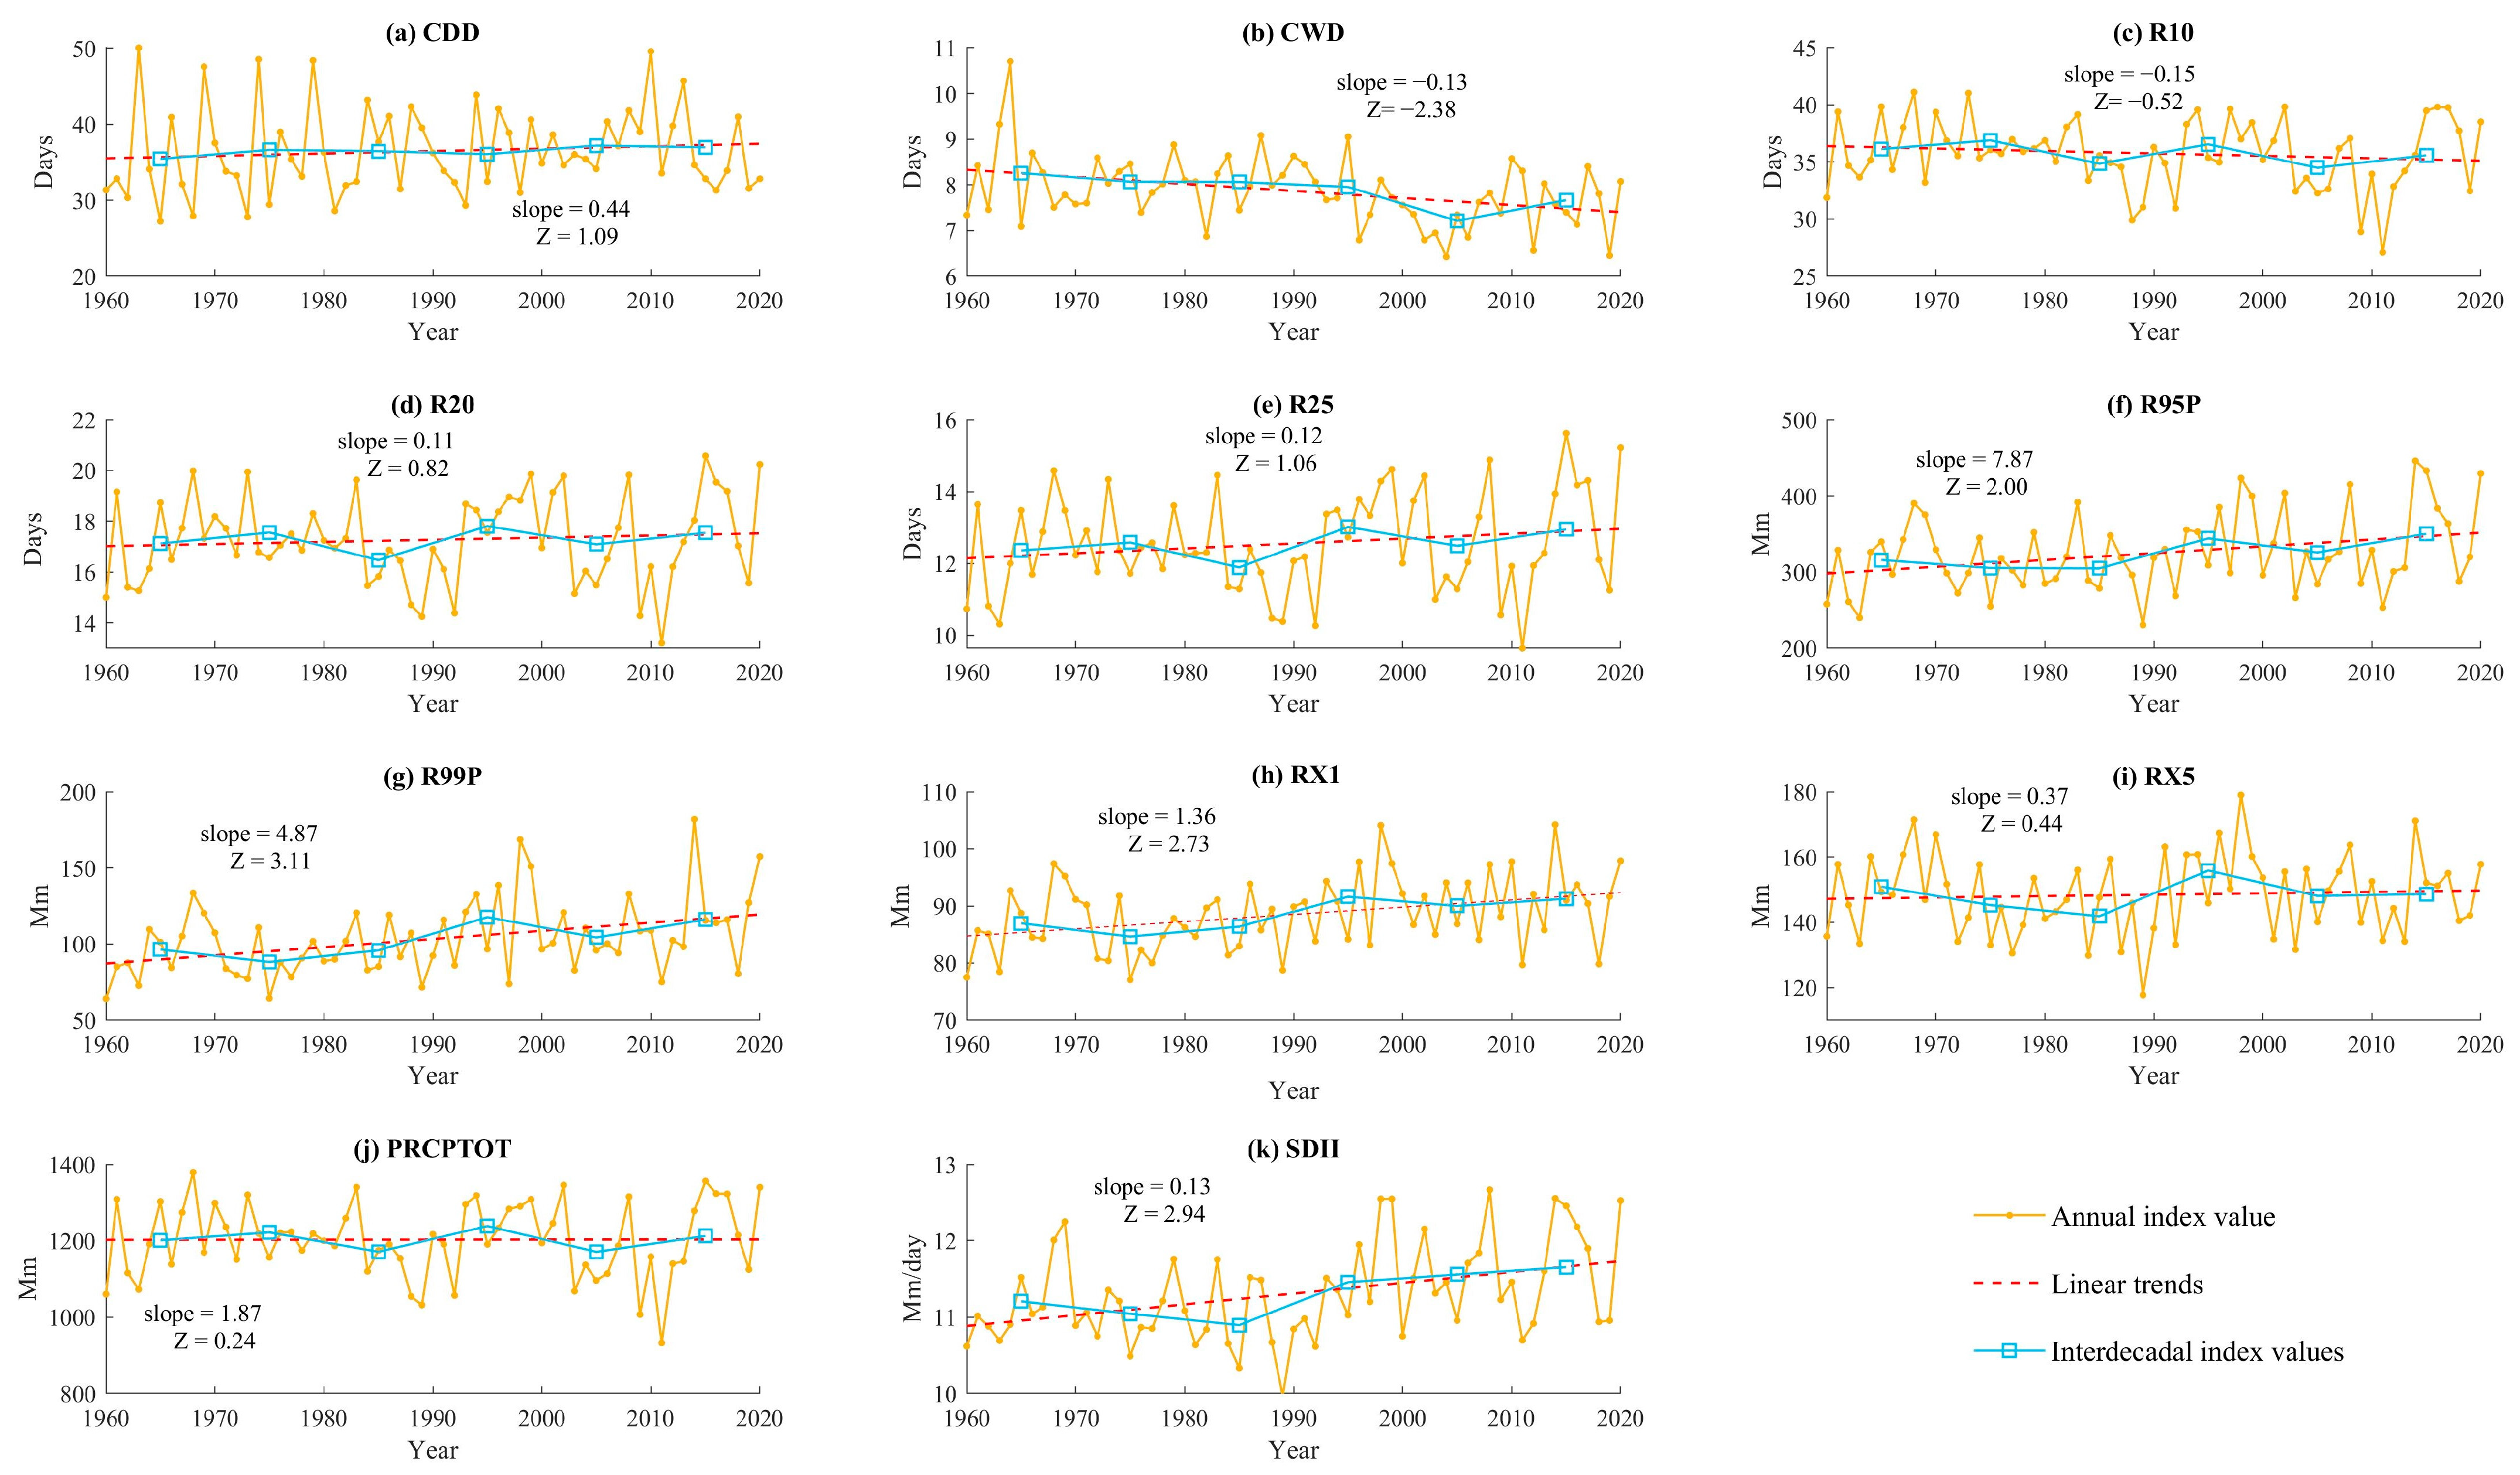
- On the time scale, there has been an overall increase for EP in the YGPR since 1960, with all indices except CWD and R10 of different degrees of increasing trends, in which the increasing trends of CDD, R95P, P99P, RX1, and SDII are the most obvious (p < 0.05). It indicates that the drought days in the study area may increase and the possibility of precipitation concentration and intensity and EHP may enhance.
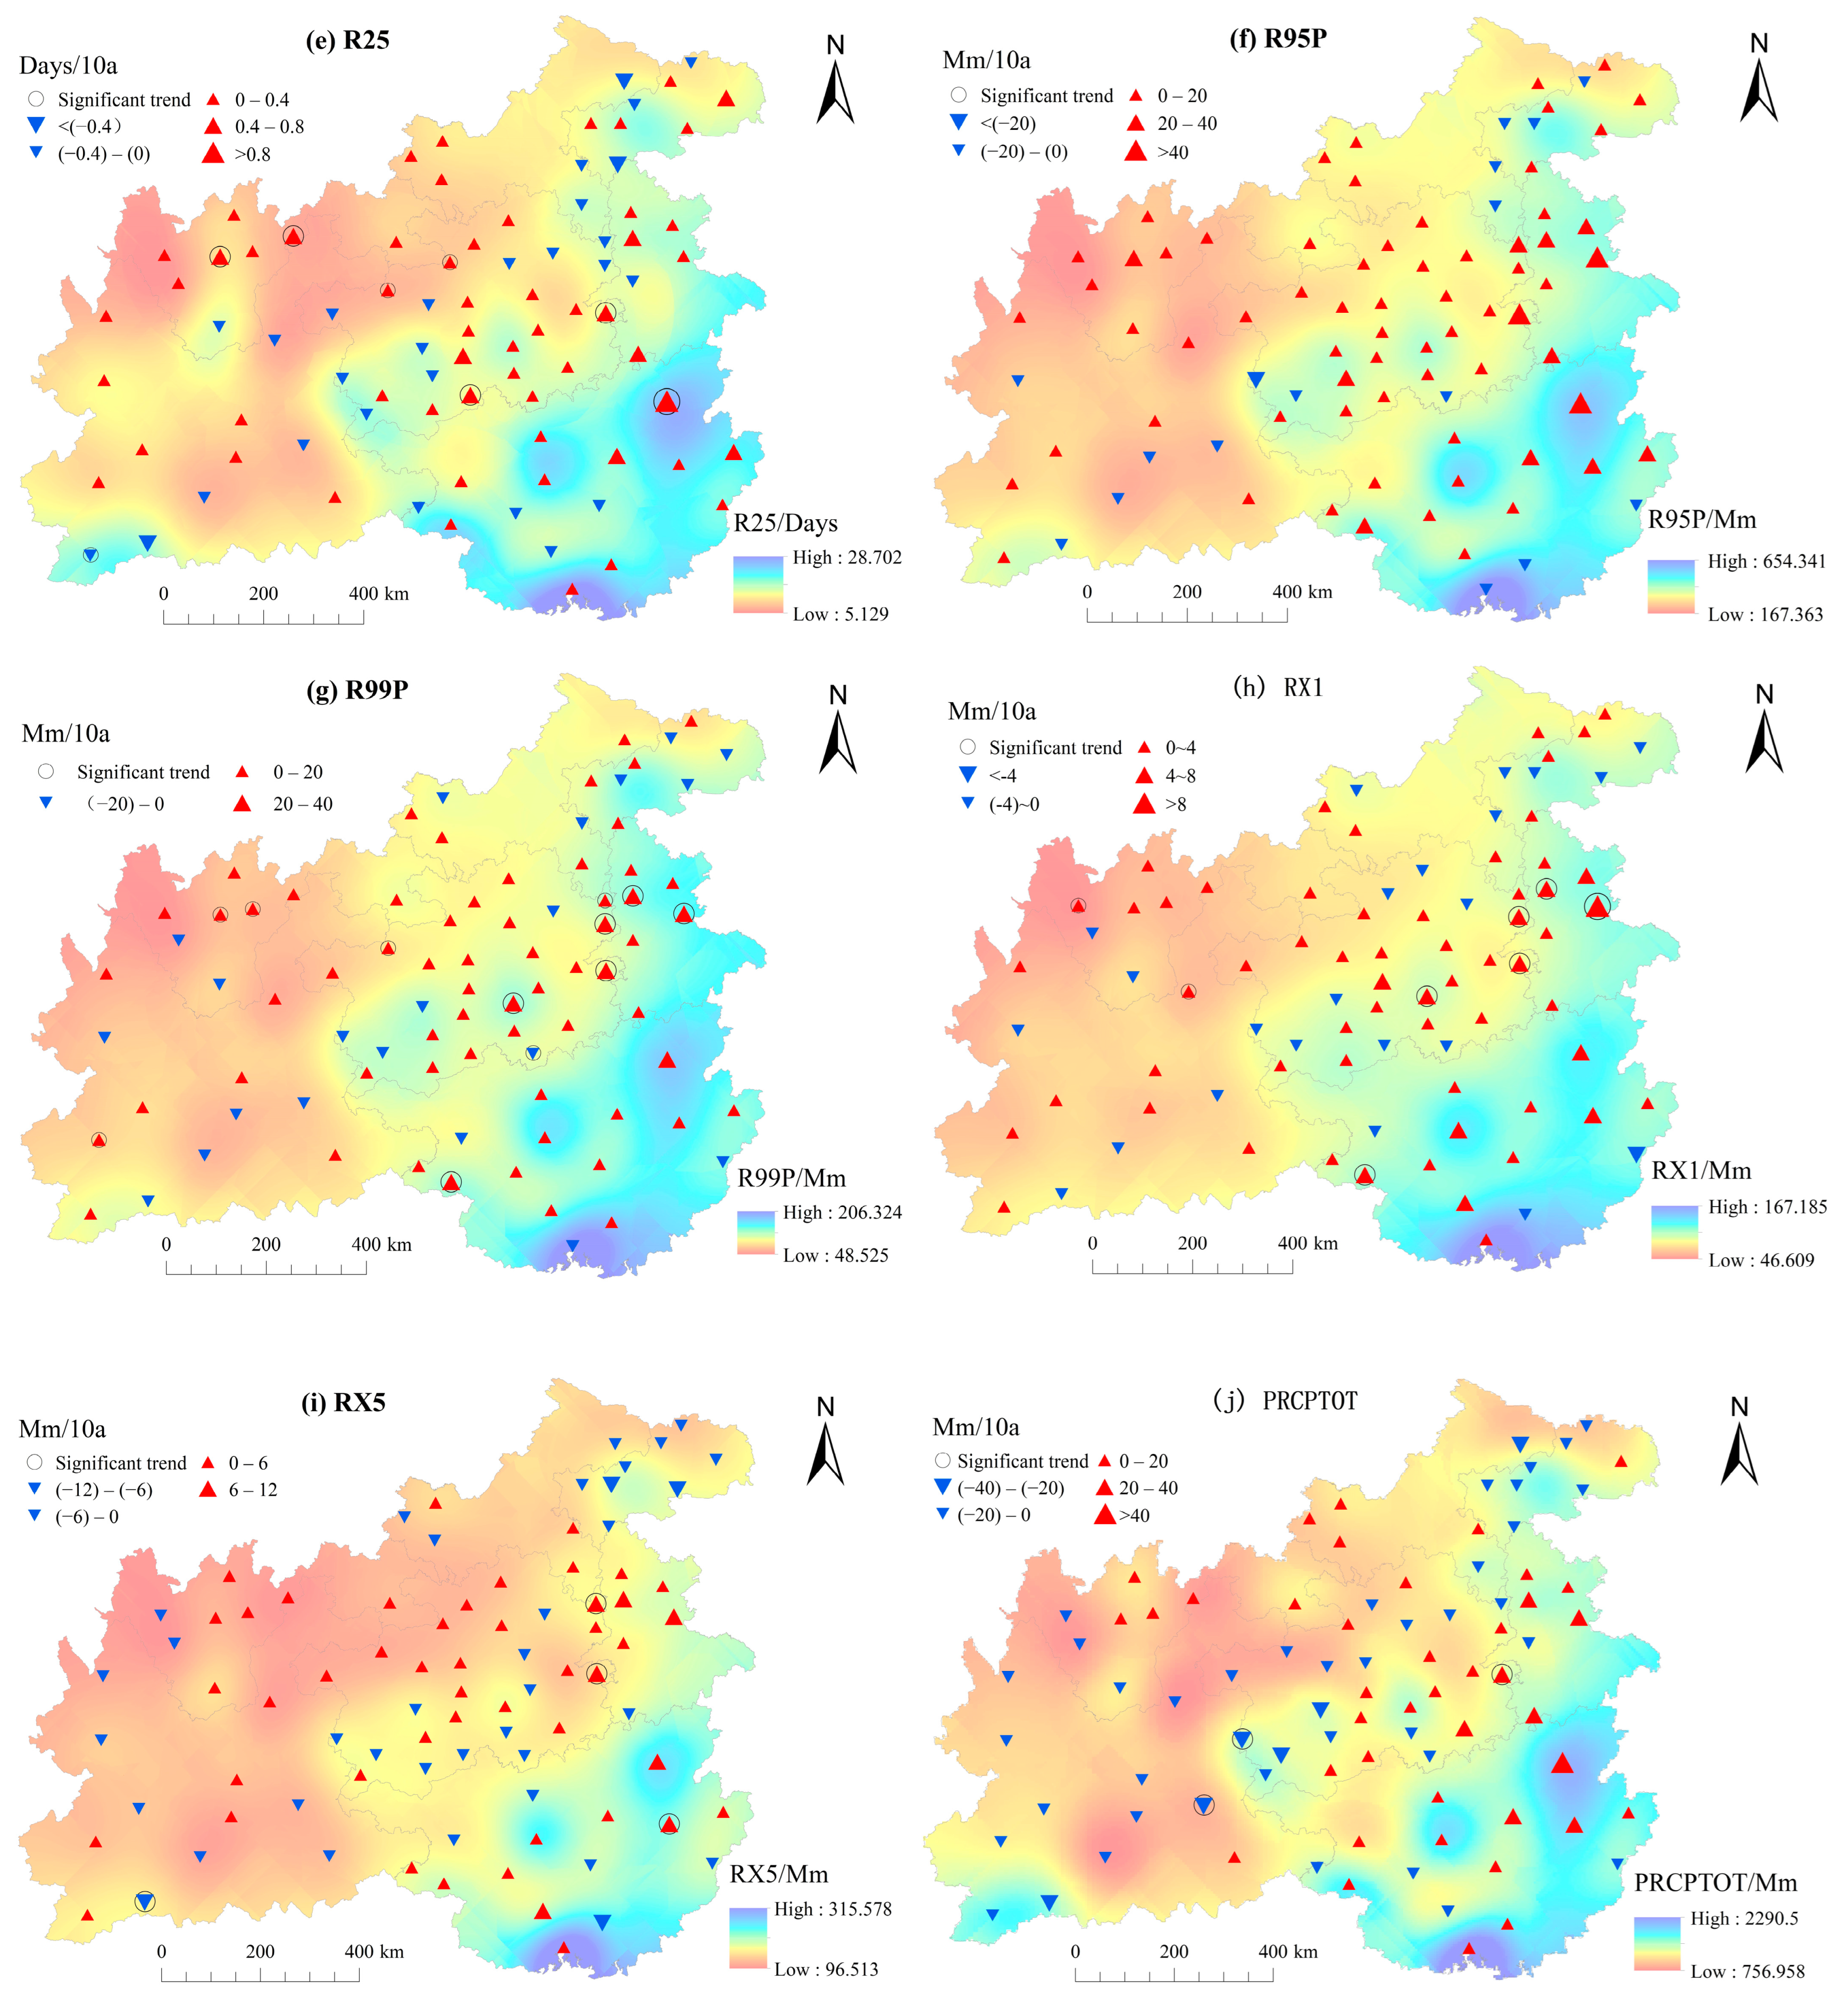
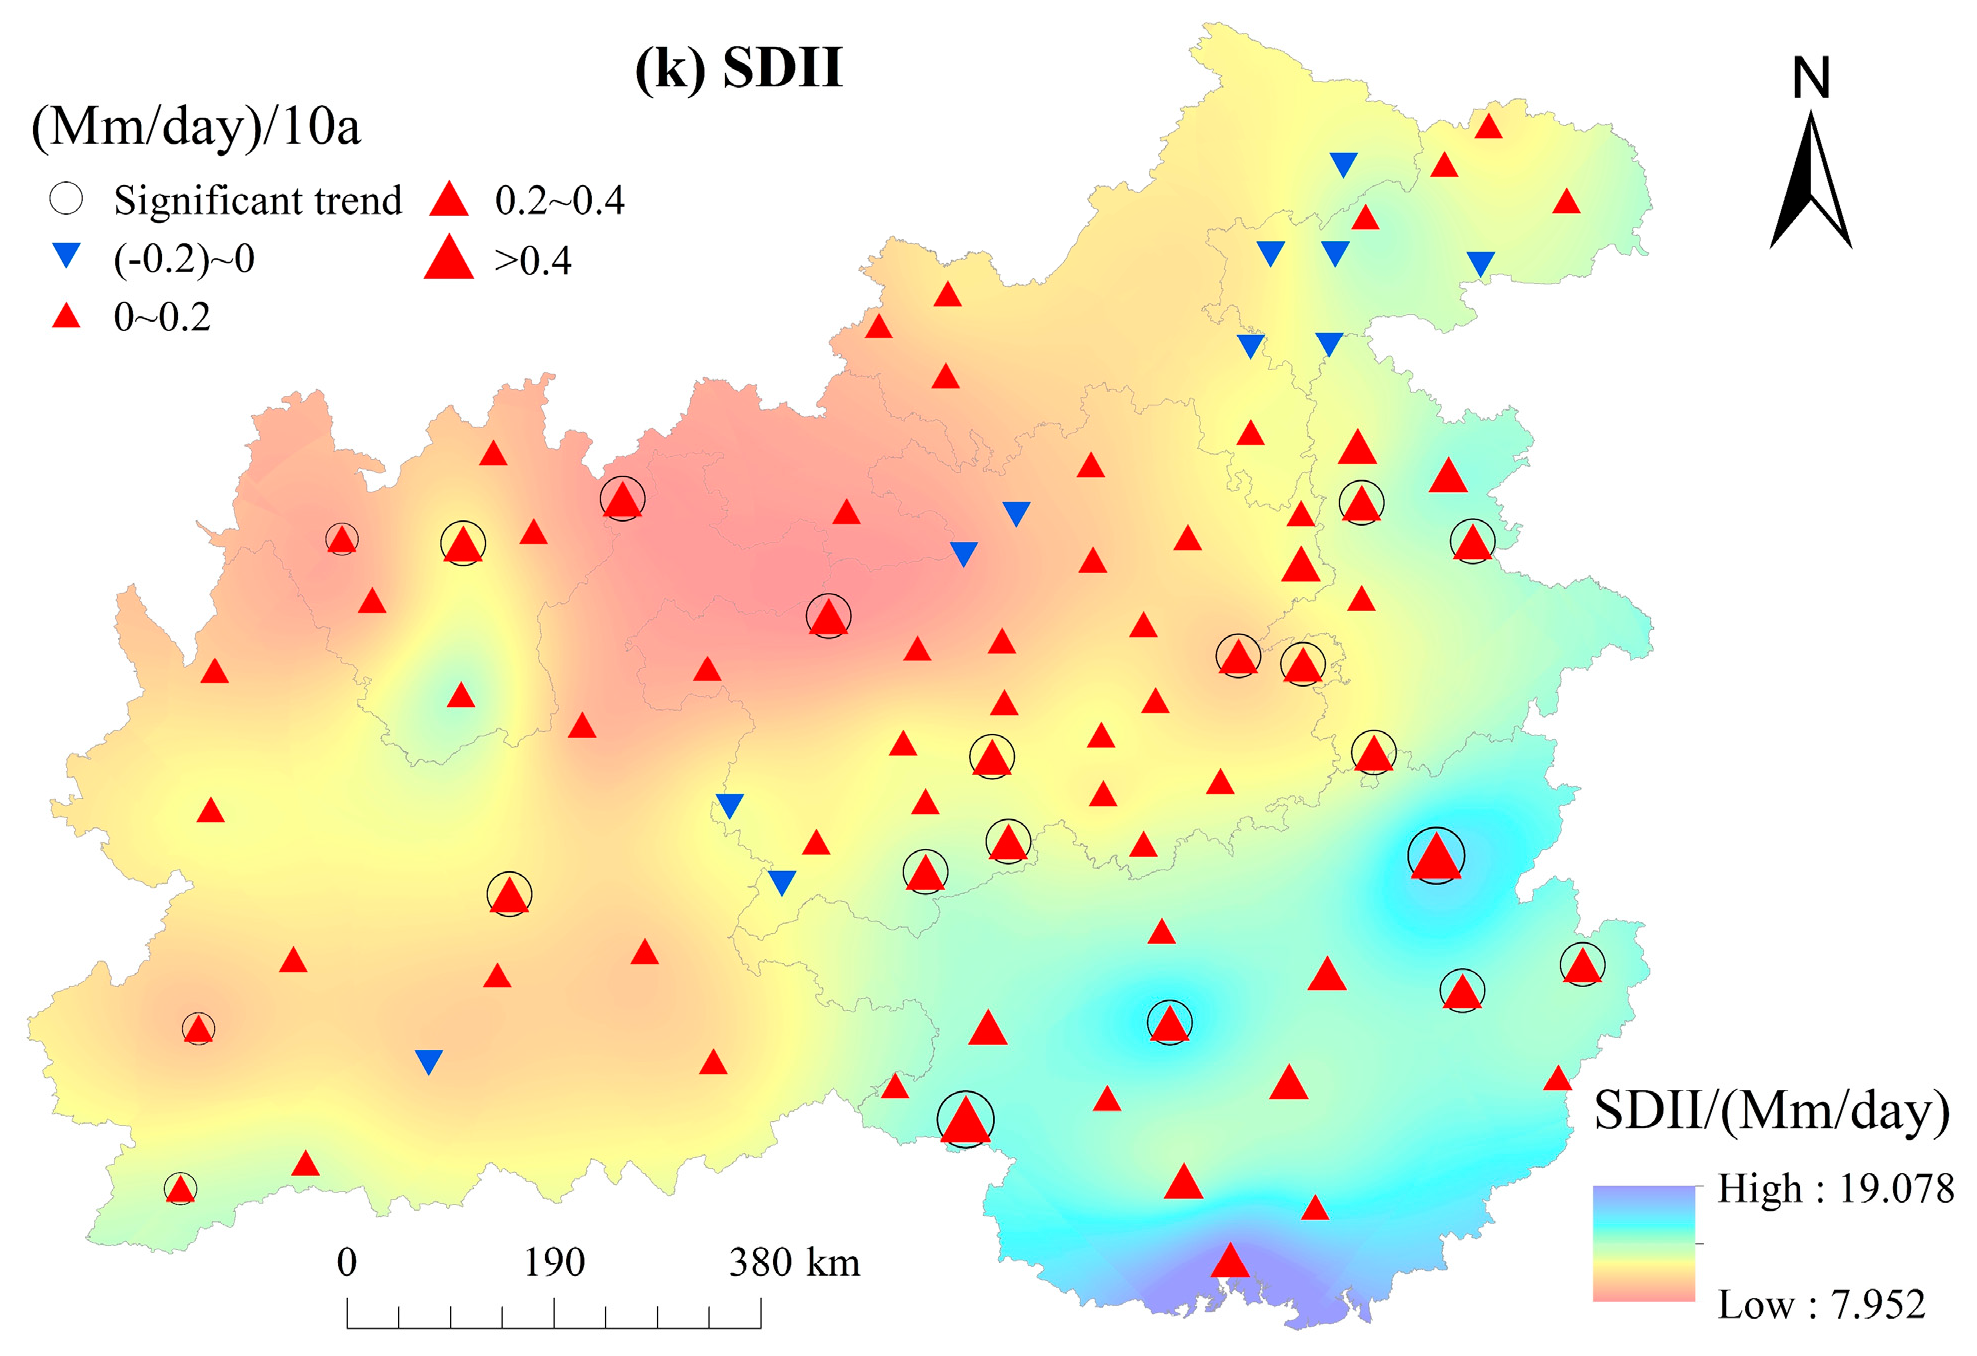
- At the spatial scale, there is significant spatial heterogeneity for EP in the study area. ED decreases from northwest to east, with the high-value area in the northwest. Total annual precipitation and EHP show a decreasing trend from southeast to northwest, with the high-value area in southern Guangxi, and total annual precipitation also shows a decreasing trend from southwest to north-central. Since 1960, the ED in the western region of the study area has been enhanced and the extreme heavy precipitation in the central-eastern and southeastern regions shows an upward trend. This indicates that the western region is more prone to droughts and the central-eastern and southeastern regions may have frequent EP events and flooding, which will increase the flood control pressure of the local people’s lives, agricultural production, and ecological construction.
- Except for CDD and CWD, correlation analysis shows a good correlation between the other EPIs and annual precipitation (p < 0.01) and a good indication of EP events. This means that their variations will have a significant effect on the total annual precipitation, in which R10, R20, and R25 have the most obvious effect on EP.
- EP is influenced by geographical factors (longitude, latitude, and altitude), EHP has significantly positive and negative correlations with longitude (p < 0.05) and the latitude (p < 0.05), respectively. The relationship with altitude is complex, and the extremely heavy precipitation decreases with increasing altitude in the lower altitude regions and increases with increasing altitude in higher altitude regions. EHP mainly occurs at lower and higher altitudes, and drought is prone to happen in mid-altitude areas.
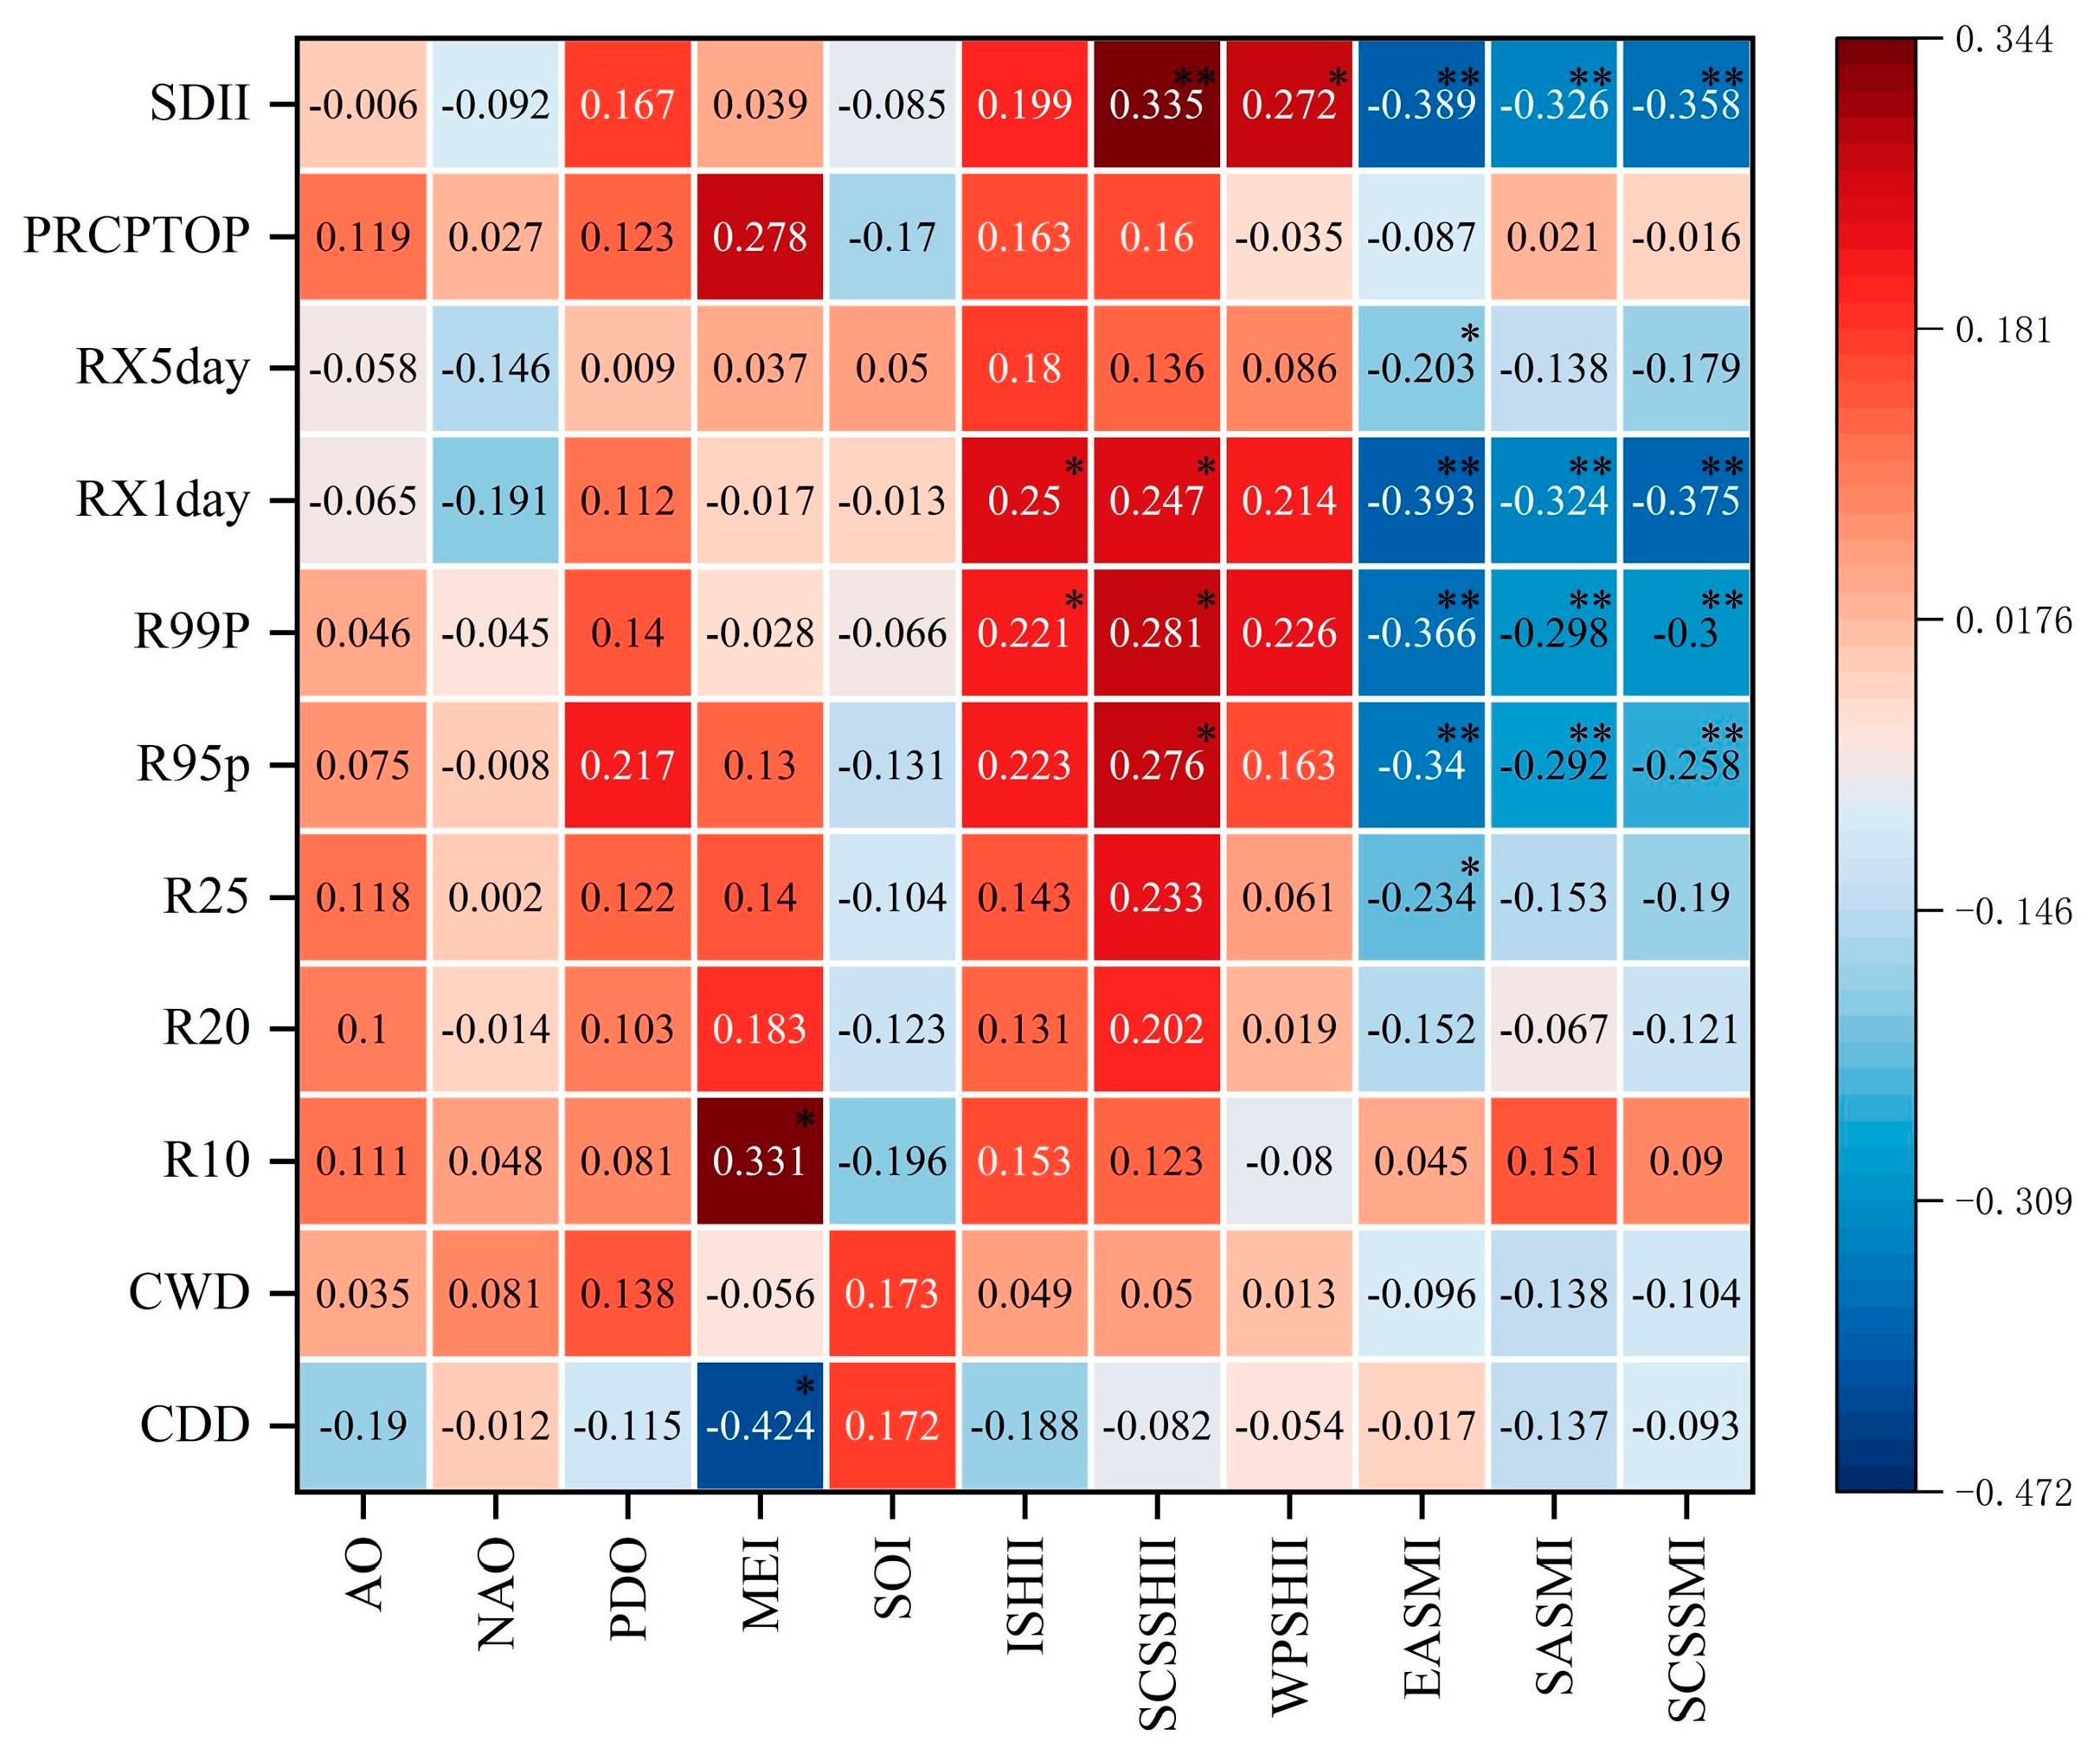
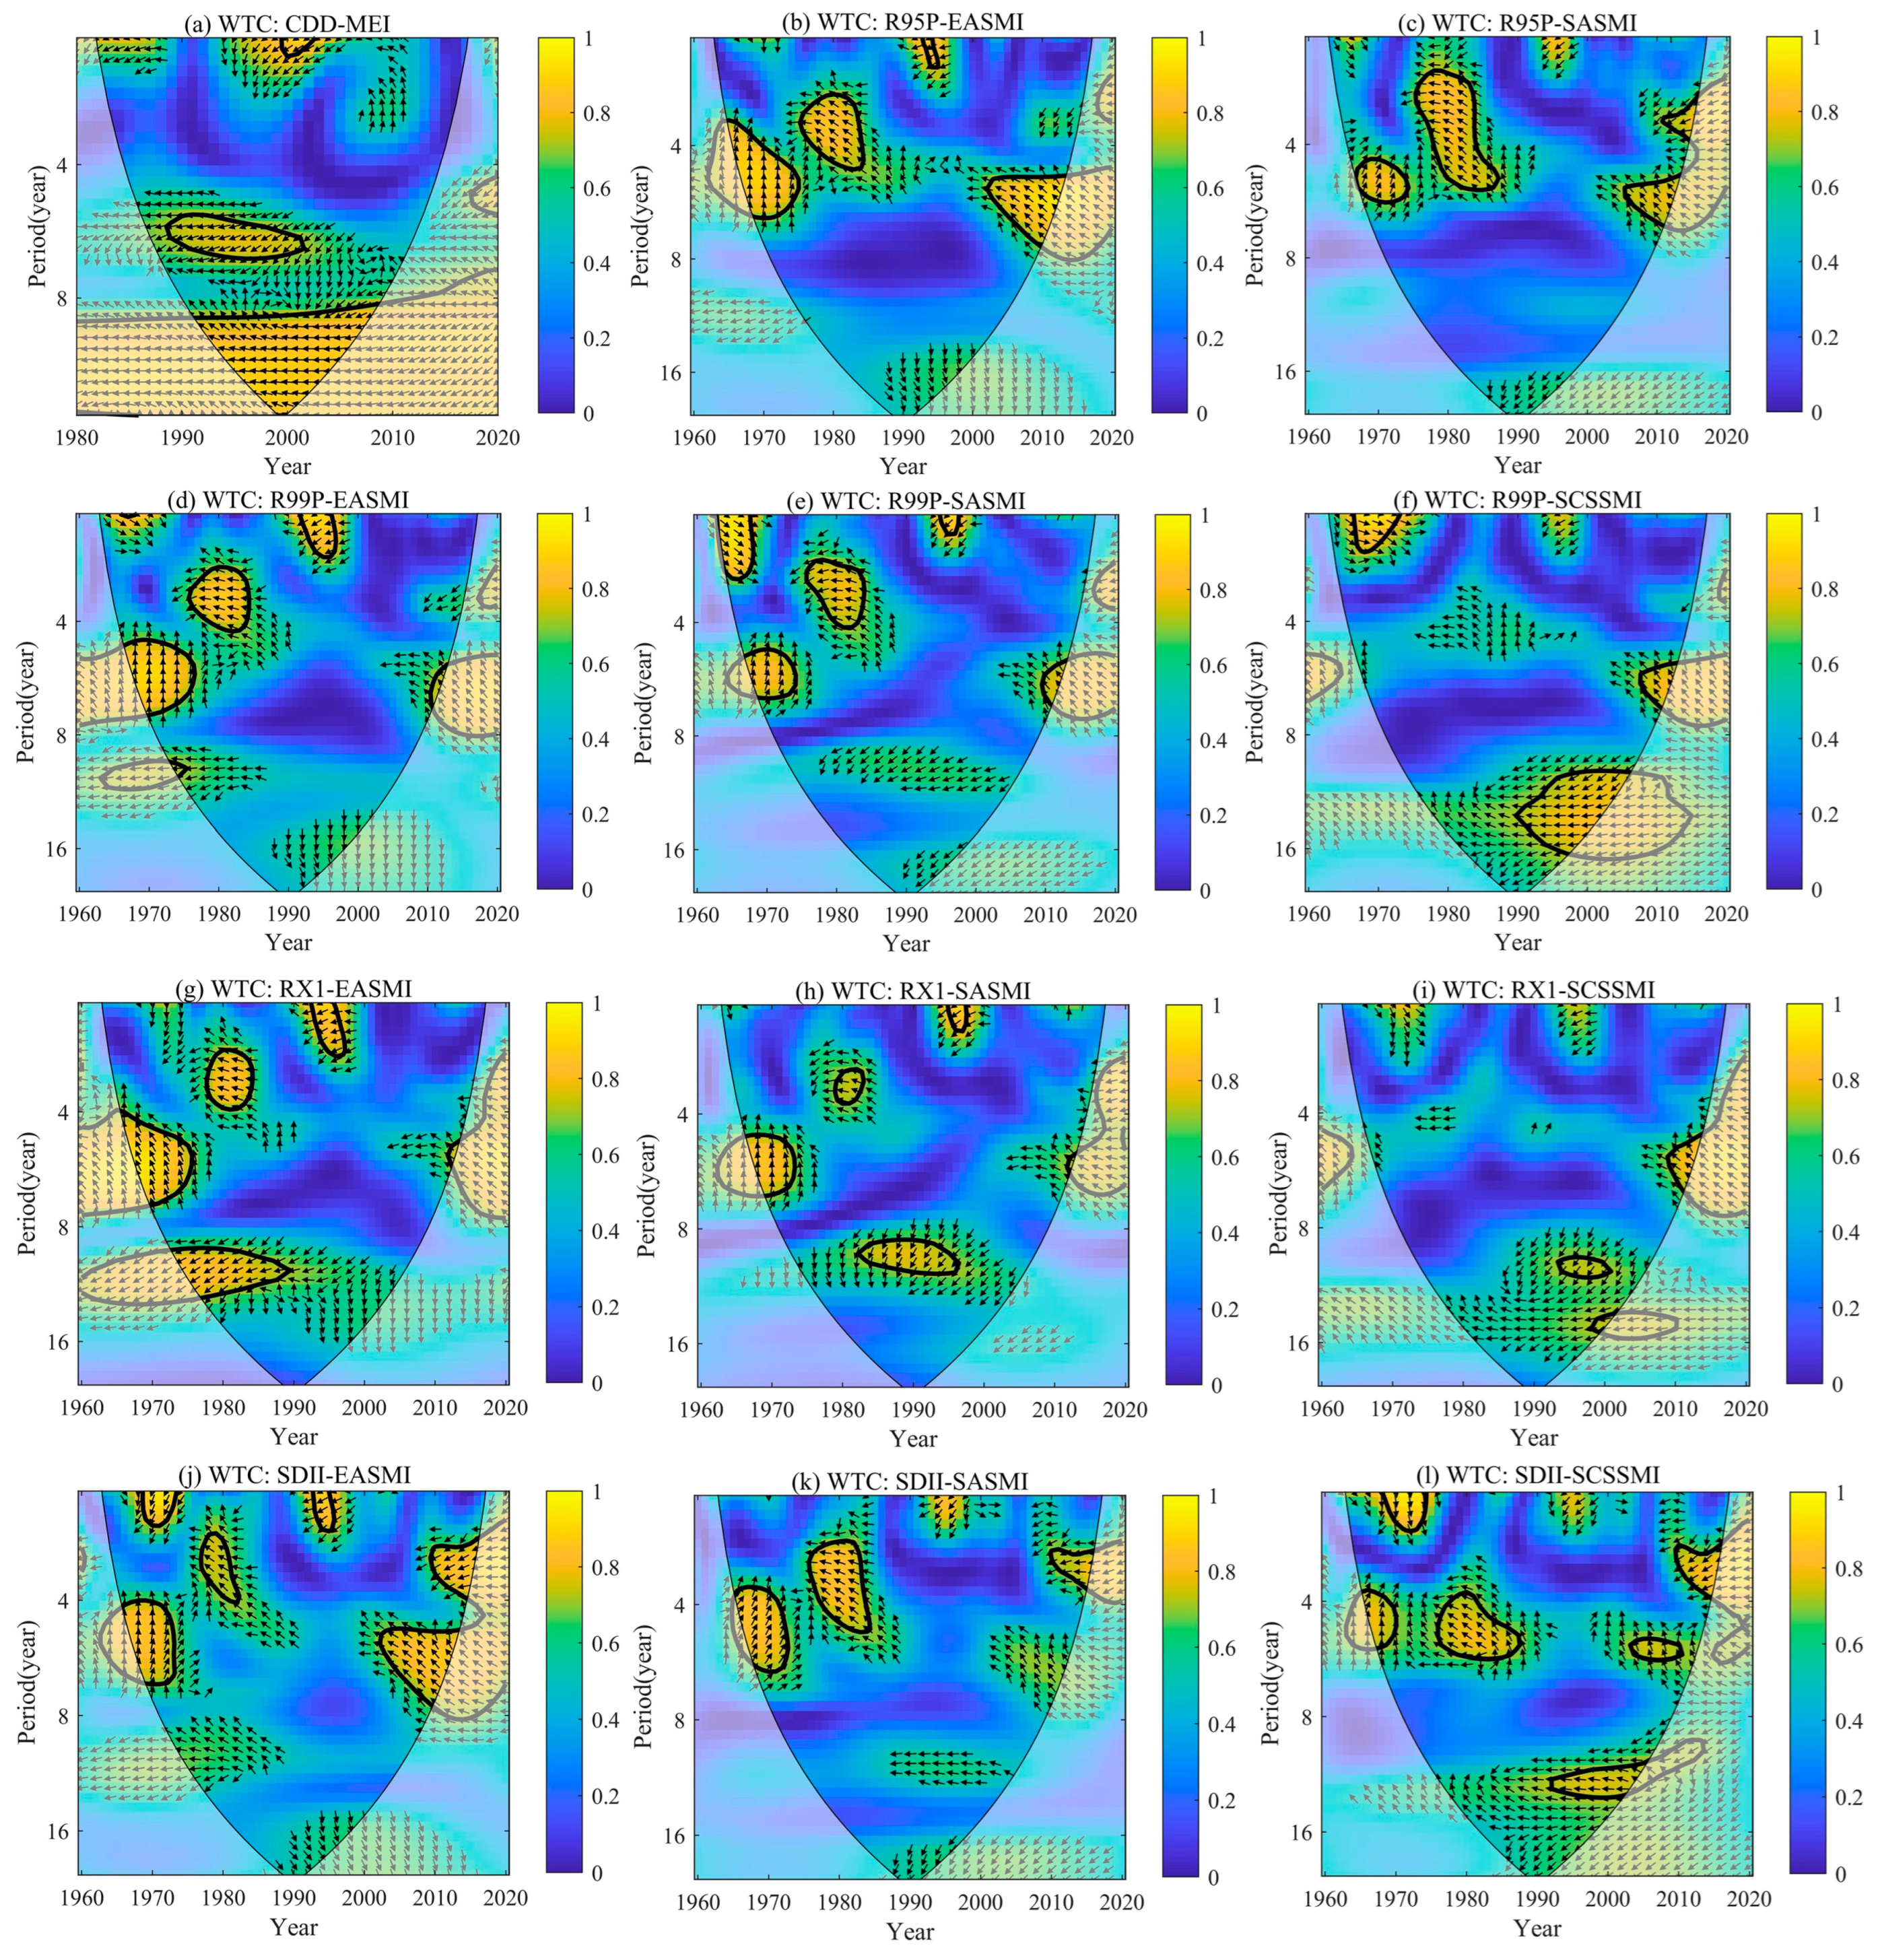
- EP is closely related to atmospheric circulation. The degree of drought variability in the study area is significantly negatively correlated with ENSO events (p < 0.05). The process of extremely heavy precipitation variability is significantly negatively correlated with the summer monsoons in South Asia, East Asia, and the South China Sea (p < 0.05), with the East Asian monsoon having the most pronounced influence. The sharp change in EHP in the 1990s is mainly due to the weakening of the East Asian summer monsoons.
- The R/S analysis shows that all Hurst indexes of EPIs are greater than 0.5 and have persistence. Joint analysis with the historical trend of EPIs predicts that EPIs in the study area, except CWD and R10, have an increasing trend in the future, i.e., they are prone to drought and EP events in the future.
Author Contributions
Funding
Institutional Review Board Statement
Informed Consent Statement
Data Availability Statement
Conflicts of Interest
References
- Zhai, P.; Zhou, B.; Chen, Y.; Yu, R. Several new understandings in the climate change science. Clim. Chang. Res. 2021, 17, 629–635. [Google Scholar]
- Arias, P.; Bellouin, N.; Coppola, E.; Jones, R.; Krinner, G.; Marotzke, J.; Vaishali, N.; Matthew, P.; Plattner, G.; Joeri, R. IPCC Climate Change 2021: The Physical Science Basis. Contribution of Working Group I to the Sixth Assessment Report of the Intergovernmental Panel on Climate Change; Cambridge University Press: Cambridge, UK, 2021. [Google Scholar]
- Mo, K. Extreme Climate Change in Zhejiang Province and Future Flood Changes in Ou River Basin. Master’s Thesis, Zhejiang University, Hangzhou, China, 2020. [Google Scholar]
- Alexander, L.V.; Zhang, X.; Peterson, T.C.; Caesar, J.; Gleason, B.; Klein Tank, A.M.G.; Haylock, M.; Collins, D.; Trewin, B.; Rahimzadeh, F.; et al. Global observed changes in daily climate extremes of temperature and precipitation. J. Geophys. Res. 2006, 111. [Google Scholar] [CrossRef]
- Ortiz-Gómez, R.; Muro-Hernández, L.J.; Flowers-Cano, R.S. Assessment of extreme precipitation through climate change indices in Zacatecas, Mexico. Theor. Appl. Climatol. 2020, 141, 1541–1557. [Google Scholar] [CrossRef]
- Kiktev, D.; Sexton, D.M.H.; Alexander, L.; Folland, C.K. Comparison of Modeled and Observed Trends in Indices of Daily Climate Extremes. J. Clim. 2003, 16, 3560–3571. [Google Scholar] [CrossRef]
- Liu, Y.R.; Li, Y.P.; Ma, Y.; Huang, G.H.; Zhou, X. Analyzing extreme precipitation and temperature in Central Asia as well as quantifying their main and interactive effects under multiple uncertainties. J. Hydrol. 2022, 607, 127469. [Google Scholar] [CrossRef]
- van den Besselaar, E.J.M.; Klein Tank, A.M.G.; Buishand, T.A. Trends in European precipitation extremes over 1951–2010. Int. J. Climatol. 2012, 33, 2682–2689. [Google Scholar] [CrossRef]
- Fan, Y.; Li, J.; Zhu, S.; Li, H.; Zhou, B. Trends and variabilities of precipitation and temperature extremes over Southeast Asia during 1981–2017. Meteorol. Atmos. Phys. 2022, 134, 78. [Google Scholar] [CrossRef]
- Jakob, D.; Walland, D. Variability and long-term change in Australian temperature and precipitation extremes. Weather Clim. Extrem. 2016, 14, 36–55. [Google Scholar] [CrossRef]
- Ezaz, G.T.; Zhang, K.; Li, X.; Shalehy, M.H.; Hossain, M.A.; Liu, L. Spatiotemporal changes of precipitation extremes in Bangladesh during 1987–2017 and their connections with climate changes, climate oscillations, and monsoon dynamics. Glob. Planet. Chang. 2022, 208, 103712. [Google Scholar] [CrossRef]
- Quan, N.T.; Khoi, D.N.; Hoan, N.X.; Phung, N.K.; Dang, T.D. Spatiotemporal Trend Analysis of Precipitation Extremes in Ho Chi Minh City, Vietnam during 1980–2017. Int. J. Disaster Risk Sci. 2020, 12, 131–146. [Google Scholar] [CrossRef]
- Ji, D.-J.-Q.; Yuan, Y.; Han, J. Spatial-temporal Changes and Trend Predictions of Extreme Precipitation Events in China. China Rural Water Hydropower 2022, 10, 74–80. [Google Scholar]
- Zhai, P.; Zhou, X. Changes in Temperature and Precipitation and Their Impacts on Drought in China during 1951–2003. Clim. Change Res. 2005, 1, 16–18. [Google Scholar]
- He, H.; Lu, H.; Chen, S. Temporal-spatial variation characteristics of the extreme precipitation days over South China from 1961 to 2010. J. Anhui Agric. Sci. 2012, 40, 7256–7259+7276. [Google Scholar]
- Dai, S.; Luo, H.; Li, M.; Li, H.; Zhen, Q.; Hu, Y. Extreme precipitation vents variations in southern China from 1959 to 2016. Chin. J. Agric. Resour. Reg. Plan. 2022, 43, 128–142. [Google Scholar]
- Ren, Z.; Zhang, M.; Wang, S.; Qiang, F.; Zhu, X.; Dong, L. Changes in daily extreme precipitation events in South China from 1961 to 2011. J. Geogr. Sci. 2014, 25, 58–68. [Google Scholar] [CrossRef]
- Zheng, G.; Li, Y.; Chen, Q.; Zhou, X.; Gao, G.; Li, M.; Duan, T. The increasing predominance of extreme precipitation in Southwest China since the late 1970s. Atmos. Ocean. Sci. Lett. 2022, 15, 100227. [Google Scholar] [CrossRef]
- Chen, Z.; Wang, L.; Li, X.; Xue, Y.; Jia, H. Spatiotemporal Change Characteristics of Extreme Precipitation in Southwestern China and its Relationship with Intense ENSO Events. Plateau Meteorol. 2022, 41, 604–616. [Google Scholar]
- Ding, W. Spatial and Temporal Variability of the Daily Precipitation in Southwest China. Resour. Environ. Yangtze Basin 2014, 23, 1071–1079. [Google Scholar]
- Yuan, W.; Zheng, J.; Dong, K. Spatial and temporal variation in extreme precipitation events in Southwestern China during 1962–2012. Resour. Sci. 2014, 36, 766–772. [Google Scholar]
- Han, G. Analysis on Climate Change of the Qinghai-Tibet Plateau in the Recent 50 Years. Master’s Thesis, Chengdu University of Technology, Chengdu, China, 2012. [Google Scholar]
- Wu, S.; Hu, Z.; Wang, Z.; Cao, S.; Yang, Y.; Qu, X.; Zhao, W. Spatiotemporal variations in extreme precipitation on the middle and lower reaches of the Yangtze River Basin (1970–2018). Quat. Int. 2021, 592, 80–96. [Google Scholar] [CrossRef]
- Qin, Z.; Peng, T.; Singh, V.P.; Chen, M. Spatio-temporal variations of precipitation extremes in Hanjiang River Basin, China, during 1960–2015. Theor. Appl. Climatol. 2019, 138, 1767–1783. [Google Scholar] [CrossRef]
- Li, Q.; Zeng, T.; Chen, Q.; Han, X.; Weng, X.; He, P.; Zhou, Z.; Du, Y. Spatio-temporal changes in daily extreme precipitation for the Lancang–Mekong River Basin. Nat. Hazards 2022, 115, 641–672. [Google Scholar] [CrossRef]
- Zhang, D.-D.; Yan, D.-H.; Wang, Y.-C.; Lu, F.; Wu, D. Changes in extreme precipitation in the Huang-Huai-Hai River basin of China during 1960–2010. Theor. Appl. Climatol. 2014, 120, 195–209. [Google Scholar] [CrossRef]
- Zhang, Y.; Liu, C.; Liang, K.; Lu, J. Spatio-temporal variation of precipitation in the Yarlung Zangbo river basin. Acta Geogr. Sin. 2022, 77, 603–618. [Google Scholar]
- Chun, L.; Qin, F.; Bao, L.; Na, Y.; Bao, Y.; Bao, S. Spatiotemporal Variation of Extreme Precipitation lndices in Inner Mongola in Recent 55 Years. Ar. Zone Res. 2019, 36, 963–972. [Google Scholar]
- Ma, A.; Yue, D.; Zhao, J.; Hu, Q. Spatiotemporal variation and effect of extreme precipitation in Inner Mongolia in recent 60 years. Ar. Zone Res. 2020, 37, 74–85. [Google Scholar]
- Gan, L.; Liu, R.; Ji, Q.; Li, X.; You, L. Spatio-Temporal Evolution Characteristics of Extreme Precipitation in Sichuan Province, China. Mt. Res. 2021, 39, 10–24. [Google Scholar]
- Xu, Y.; Lei, Q.; Zhou, J.; Zhang, Y.; Wu, S.; Zhai, L.; Wang, H.; Li, Y.; Liu, H. Study on the change characteristics of extreme climate indices from 1960 to 2015 in Yunnan province, China. Chin. J. Agric. Resour. Reg. Plan. 2020, 41, 15–27. [Google Scholar]
- Saini, A.; Sahu, N. Decoding trend of Indian summer monsoon rainfall using multimethod approach. Stoch. Environ. Res. Risk Assess. 2021, 35, 2313–2333. [Google Scholar] [CrossRef]
- Saini, A.; Sahu, N.; Duan, W.; Kumar, M.; Avtar, R.; Mishra, M.; Kumar, P.; Pandey, R.; Behera, S. Unraveling Intricacies of Monsoon Attributes in Homogenous Monsoon Regions of India. Front. Earth Sci. 2022, 10, 794634. [Google Scholar] [CrossRef]
- Varikoden, H.; Revadekar, J. On the extreme rainfall events during the southwest monsoon season in northeast regions of the Indian subcontinent. Meteorol. Appl. 2020, 27, e1822. [Google Scholar] [CrossRef]
- Mishra, V.; Thirumalai, K.; Singh, D.; Aadhar, S. Future exacerbation of hot and dry summer monsoon extremes in India. NPJ Clim. Atmos. Sci. 2020, 3, 10. [Google Scholar] [CrossRef]
- Xia, Y.; Long, Y.; Ren, Q.; Wang, F.; Gao, P. Characteristics of Extreme Daily Precipitation Events Over Yunnan-Guizhou Plateau during Boreal Summer. J. Trop. Meteorol. 2018, 34, 239–249. [Google Scholar]
- Yan, X. Study on Temporal and Spatial Distribution of Extreme Precipitation in Typical Geomorphological Areas of Yunnan-Guizhou Plateau Based on GIS. Master’s Thesis, Guizhou University, Guiyang, China, 2018. [Google Scholar]
- Wang, X.; Zheng, X.; Huang, W.; Yang, P.; Zhou, D. Change characteristics of severe rainfall and extreme rainfall in flood season over Yunnan-Guizhou Plateau in recent 47 years. Resour. Environ. Yangtze Basin 2010, 19, 1350–1355. [Google Scholar]
- Wu, S.; Pan, T.; Cao, J.; He, D.; Xiao, Z. Barrier-corridor effect of longitudinal range-gorge terrain on monsoons in Southwest China. Geogr. Res. 2012, 31, 1–13. [Google Scholar]
- Guo, C. Study on the Characteristics of Extreme Climate Events in Xinjiang in Recent 56 Year. Master’s Thesis, Xinjiang Normal University, Urumqi, China, 2019. [Google Scholar]
- Zhao, J. Study on the Variation Characteristics of Extreme Climate Events on the Qinghai-Tibet. Plateau during 1961–2016. Master’s Thesis, Lanzhou University, Lanzhou, China, 2019. [Google Scholar]
- Shen, L.; Yang, Y.; Wu, J.; Bai, L. Spatial and temporal variation characteristics of extreme climate events in the yellow river basin. Res. Soil. Water Conserv. 2022, 29, 231–242. [Google Scholar]
- Mann, H.B. Nonparametric tests against trend. Econom. J. Econom. Soc. 1945, 13, 245–259. [Google Scholar] [CrossRef]
- Kendall, M.G. Rank Correlation Methods; Charles Griffin: London, UK, 1975. [Google Scholar]
- Spearman, C. The Proof and Measurement of Association between Two Things; Appleton-Century-Crofts: New York, NY, USA, 1961. [Google Scholar]
- Onyutha, C. Graphical-statistical method to explore variability of hydrological time series. Hydrol. Res. 2021, 52, 266–283. [Google Scholar] [CrossRef]
- Şen, Z. Innovative trend analysis methodology. J. Hydrol. Eng. 2012, 17, 1042–1046. [Google Scholar] [CrossRef]
- Nakken, M. Wavelet analysis of rainfall–runoff variability isolating climatic from anthropogenic patterns. Environ. Model. Softw. 1999, 14, 283–295. [Google Scholar] [CrossRef]
- Beecham, S.; Chowdhury, R. Temporal characteristics and variability of point rainfall: A statistical and wavelet analysis. Int. J. Climatol. J. R. Meteorol. Soc. 2010, 30, 458–473. [Google Scholar] [CrossRef]
- Zou, L.; Yu, J.; Wang, F.; Zhang, Y. Spatial-temporal variations of extreme precipitation indices and their response to atmospheric circulation factors in the Weihe River Basin. Ar. Zone Res. 2021, 38, 764–774. [Google Scholar]
- Hu, S.; Qiu, H.; Song, J.; Ma, S.; Yang, D.; Pei, Y.; Yang, W.; Cao, M. Influencing mechanisms of climate change on runoff process in the north slope of Qinling Mountains: A case of the Bahe River Basin. Ar. Land. Geogr. 2017, 40, 967–978. [Google Scholar]
- Hurst, H.E. Long-term storage capacity of reservoirs. Trans. Am. Soc. Civ. Eng. 1951, 116, 770–799. [Google Scholar] [CrossRef]
- Granero, M.S.; Segovia, J.T.; Pérez, J.G. Some comments on Hurst exponent and the long memory processes on capital markets. Phys. A Stat. Mech. Its Appl. 2008, 387, 5543–5551. [Google Scholar] [CrossRef]
- Chen, J.; Tao, H.; Liu, J.; Zhai, J.; Su, B.; Jiang, T. Temporal and Spatial Variations of Extreme Precipitation in China-Pakistan Economic Corridor. Plateau Meteorol. 2021, 40, 1048–1056. [Google Scholar]
- Duan, L.; Wang, S.; Feng, J. The National Drought Situation in 2010 and Its Impact and Causes. J. Arid. Meteorol. 2011, 29, 126–132. [Google Scholar]
- Ban, J.; Miao, Q.; Li, X. Analysis of Characteristics of Temperature Variations in Southwest China in Recent 50 Years. Resour. Environ. Yangtze Basin 2006, 15, 346–351. [Google Scholar]
- Ren, R.; Shan, C.; Zhang, Y.; Ding, W.; Gu, Y.; Lou, D. Spatio-Temporal Characteristics of Precipitation and Water Vapor Resource over the Yunnan-Guizhou Plateau in Summer. Meteorol. Mon. 2017, 43, 315–322. [Google Scholar]
- Chen, M.; Zhi, H.; Lu, Q. Analysis of Extreme Precipitation Events and Their Circulation Characteristics in Guangxi in the Last 50 Years. In Proceedings of the 33rd Annual Meeting of the Chinese Meteorological Society S6 Climate Variability and Extreme Events in East Asia and Their Prediction, Xi’an, China, 1 November 2016. [Google Scholar]
- Liu, L.; Xu, Z.X. Regionalization of precipitation and the spatiotemporal distribution of extreme precipitation in southwestern China. Nat. Hazards 2015, 80, 1195–1211. [Google Scholar] [CrossRef]
- Wang, L.; Chen, S.; Zhu, W.; Ren, H.; Zhang, L.; Zhu, L. Spatiotemporal variations of extreme precipitation and its potential driving factors in China’s North-South Transition Zone during 1960–2017. Atmos. Res. 2021, 252, 105429. [Google Scholar] [CrossRef]
- Dong, X.; Ni, X. Spatiotemporal Variation of Extreme Precipitation at Different Elevations in Southwest China. J. Southwest Univ. (Nat. Sci. Ed.) 2022, 44, 110–121. [Google Scholar]
- Tai, J.; Dong, J.; Liu, G.; Zhang, G.; Zhu, T.; Song, W.; Wang, C.; Chen, A.; Wang, S. Characteristics of Temperature and Precipitation Change along Increasing Elevations in Different Agriculture Regions of Southwest China. Chin. J. Agrometeorol. 2016, 37, 379–389. [Google Scholar]
- Wang, H.J. The weakening of the Asian monsoon circulation after the end of 1970’s. Adv. Atmos. Sci. 2001, 18, 376–386. [Google Scholar]
- Lorenzo-Lacruz, J.; Morán-Tejeda, E.; Vicente-Serrano, S.M.; Hannaford, J.; García, C.; Peña-Angulo, D.; Murphy, C. Streamflow frequency changes across western Europe and interactions with North Atlantic atmospheric circulation patterns. Glob. Planet. Change 2022, 212, 103797. [Google Scholar] [CrossRef]
- Hong, M.; Liu, K.; Zhang, D.; Zhang, R.; Ge, J. The Correlation of the Western Pacific Subtropical High Interannual Variability Wit Tropical SST and Atmospheric Circulation Anomalies Based on the Cross-Wavelet Analysis. J. Trop. Meteorol. 2020, 36, 166–179. [Google Scholar]
- Cheng, Q.; Gao, L.; Zuo, X.; Zhong, F. Statistical analyses of spatial and temporal variabilities in total, daytime, and nighttime precipitation indices and of extreme dry/wet association with large-scale circulations of Southwest China, 1961–2016. Atmos. Res. 2019, 219, 166–182. [Google Scholar] [CrossRef]
- Zhang, Q.; Xu, C.-Y.; Zhang, Z.; Chen, Y.D.; Liu, C.-L.; Lin, H. Spatial and temporal variability of precipitation maxima during 1960–2005 in the Yangtze River basin and possible association with large-scale circulation. J. Hydrol. 2008, 353, 215–227. [Google Scholar] [CrossRef]
- Li, J.P.; Zheng, Q.C. A new monsoon index and the geographical distribution of the global monsoons. Adv. Atmos. Sci. 2003, 20, 299–302. [Google Scholar]
- Zhang, K.; Pan, S.; Cao, L.; Wang, Y.; Zhao, Y.; Zhang, W. Spatial distribution and temporal trends in precipitation extremes over the Hengduan Mountains region, China, from 1961 to 2012. Quat. Int. 2014, 349, 346–356. [Google Scholar] [CrossRef]
- Wang, Q. Changes in Extreme Events of Temperature and Precipitation in the Yangtze River Basin during 1962–2011. Master’s Thesis, Northwest Normal University, Lanzhou, China, 2014. [Google Scholar]
- Yang, W.; Sun, J.; Kang, Y.; Ma, H.; Xu, R. Temporal and spatial changes of extreme weather indices in the Loess Plateau. Arid. Land. Geogr. 2020, 43, 1456–1466. [Google Scholar]
- Meng, Q.; Gao, X.; Bai, H.; Zhang, Y.; Wang, H. Temporal and Spatial Variations and Trends of Extreme Precipitation in Qinling. Mountains during the Period. 1960–2015. Res. Soil Water Conserv. 2019, 26, 171–178+183. [Google Scholar]





| Indicator Name | Index | Definitions | Units |
|---|---|---|---|
| Consecutive dry days | CDD | Maximum number of consecutive days with annual daily precipitation < 1 mm | days |
| Consecutive wet days | CWD | Maximum number of consecutive days with annual daily precipitation ≥ 1 mm | days |
| Number of heavy precipitation days | R10 | Number of days with annual daily precipitation ≥ 10 mm | days |
| Number of very heavy precipitation days | R20 | Number of days with annual daily precipitation ≥ 20 mm | days |
| Number of heaviest precipitation days | R25 | Number of days with annual daily precipitation ≥ 25 mm | days |
| Precipitation amount for very wet day | R95P | Sum of intra-annual daily precipitation greater than the 61-year average value of the daily precipitation in the 95th percentile for each year of 1960–2020 | mm |
| Precipitation amount for extremely wet day | R99P | Sum of intra-annual daily precipitation greater than the 61-year average value of the daily precipitation in the 99th percentile for each year of 1960–2020 | mm |
| Precipitation amount for annual Max 1-day | RX1 | Maximum single-day precipitation per year | mm |
| Precipitation amount for annual Max 5-day | RX5 | Maximum continuous 5-day precipitation per year | mm |
| Annual total wet-day precipitation | PRCPTOT | Sum of wet day’s precipitation (wet day’sprecipitation > 1 mm) during the year | mm |
| Simple daily intensity index | SDII | Ratio of total precipitation to the number of wet day days | mm/day |
| Period | CDD | CWD | R10 | R20 | R25 | R95 | R99 | RX1 | RX5 | PRCPTOT | SDII |
|---|---|---|---|---|---|---|---|---|---|---|---|
| 1960s | 35.449 | 8.260 | 36.137 | 17.124 | 12.363 | 315.918 | 96.409 | 86.973 | 150.916 | 1200.977 | 11.205 |
| 1970s | 36.631 | 8.069 | 36.900 | 17.561 | 12.582 | 305.485 | 88.247 | 84.639 | 145.280 | 1221.770 | 11.042 |
| 1980s | 36.464 | 8.063 | 34.859 | 16.472 | 11.892 | 304.936 | 95.892 | 86.388 | 141.868 | 1170.855 | 10.894 |
| 1990s | 36.071 | 7.956 | 36.554 | 17.810 | 13.016 | 344.234 | 117.689 | 91.616 | 155.864 | 1238.225 | 11.457 |
| 2000s | 37.200 | 7.212 | 34.500 | 17.093 | 12.490 | 325.826 | 104.317 | 90.005 | 148.108 | 1170.734 | 11.557 |
| 2010s | 36.974 | 7.666 | 35.593 | 17.547 | 12.948 | 350.241 | 116.121 | 91.284 | 148.653 | 1212.183 | 11.653 |
| Index | CDD | CWD | R10 | R20 | R25 | R95P | R99P | RX1 | RX5 | PRCPTOT | SDII |
|---|---|---|---|---|---|---|---|---|---|---|---|
| Year of abrupt change | - | 1994 | 1984 | 1977 1998 | 1977 1998 | 1993 | 1990 | 1990 | 1972 1993 | 1977 | 1995 |
| Index | PRCPTOP | CDD | CWD | R10 | R20 | R25 | R95P | R99P | RX1 | RX5 | SDII |
|---|---|---|---|---|---|---|---|---|---|---|---|
| PRCPT-OP | 1.000 | ||||||||||
| CDD | −0.233 | 1.000 | |||||||||
| CWD | −0.091 | 0.141 | 1.000 | ||||||||
| R10 | 0.949 ** | −0.284 * | −0.039 | 1.000 | |||||||
| R20 | 0.954 ** | −0.182 | −0.118 | 0.897 ** | 1.000 | ||||||
| R25 | 0.918 ** | −0.141 | −0.116 | 0.808 ** | 0.971 ** | 1.000 | |||||
| R95p | 0.760 ** | −0.03 | −0.146 | 0.546 ** | 0.772 ** | 0.863 ** | 1.000 | ||||
| R99P | 0.510 ** | 0.018 | −0.173 | 0.270 * | 0.491 ** | 0.604 ** | 0.873 ** | 1.000 | |||
| RX1 | 0.466 ** | 0.066 | −0.220 | 0.229 | 0.443 ** | 0.544 ** | 0.809 ** | 0.907 ** | 1.000 | ||
| RX5 | 0.645 ** | −0.047 | −0.096 | 0.487 ** | 0.575 ** | 0.625 ** | 0.762 ** | 0.762 ** | 0.779 ** | 1.000 | |
| SDII | 0.606 ** | 0.041 | −0.195 | 0.436 ** | 0.716 ** | 1.000 | 0.890 ** | 0.773 ** | 0.732 ** | 0.613 ** | 1.000 |
| Index | Lon | Lat | Alt | ||||
|---|---|---|---|---|---|---|---|
| 19–307/m | 308–630/m | 631–1196/m | 1197–1887/m | 1888–2631/m | |||
| CDD/d | −0.726 ** | −0.250 * | 0.213 | 0.206 | −0.305 | −0.027 | −0.129 |
| CWD/d | −0.430 ** | −0.479 ** | −0.280 | 0.193 | −0.322 | −0.110 | 0.280 |
| R10/d | 0.373 ** | −0.352 ** | −0.608 ** | 0.025 | −0.183 | 0.060 | 0.500 |
| R20/d | 0.492 ** | −0.393 ** | −0.727 ** | −0.096 | −0.182 | 0.152 | 0.608 |
| R25/d | 0.517 ** | −0.394 ** | −0.738 ** | −0.118 | −0.152 | 0.164 | 0.626 |
| R95P/mm | 0.591 ** | −0.269 * | −0.746 ** | −0.066 | 0.029 | 0.175 | 0.554 |
| R99P/mm | 0.613 ** | −0.223 * | −0.740 ** | −0.084 | 0.122 | 0.203 | 0.526 |
| RX1/mm | 0.623 ** | −0.263 * | −0.716 ** | −0.179 | 0.024 | 0.311 | 0.607 |
| RX5/mm | 0.505 ** | −0.361 ** | −0.728 ** | −0.134 | −0.036 | 0.197 | 0.546 |
| PRCPTOP/mm | 0.497 ** | −0.350 ** | −0.736 ** | −0.033 | −0.115 | 0.126 | 0.563 |
| SDII/(mm/d) | 0.463 ** | −0.394 ** | −0.682 ** | −0.202 | −0.183 | 0.314 | 0.666 |
| Indic | CDD | CWD | R10 | R20 | R25 | R95p | R99P | RX1 | RX5 | PRCPTOP | SDII |
|---|---|---|---|---|---|---|---|---|---|---|---|
| H | 0.553 | 0.775 | 0.840 | 0.884 | 0.845 | 0.737 | 0.742 | 0.720 | 0.837 | 0.863 | 0.738 |
| D | 1.447 | 1.225 | 1.160 | 1.116 | 1.155 | 1.263 | 1.258 | 1.28 | 1.163 | 1.137 | 1.262 |
Disclaimer/Publisher’s Note: The statements, opinions and data contained in all publications are solely those of the individual author(s) and contributor(s) and not of MDPI and/or the editor(s). MDPI and/or the editor(s) disclaim responsibility for any injury to people or property resulting from any ideas, methods, instructions or products referred to in the content. |
© 2023 by the authors. Licensee MDPI, Basel, Switzerland. This article is an open access article distributed under the terms and conditions of the Creative Commons Attribution (CC BY) license (https://creativecommons.org/licenses/by/4.0/).
Share and Cite
Zhang, H.; Zhang, R.; Ju, Q.; Kong, G.; Xie, Y.; He, J.; Huang, Y. Analysis of Extreme Precipitation Variation Characteristics and the Influencing Factors in the Yunnan-Guizhou Plateau Region, China. Sustainability 2023, 15, 14735. https://doi.org/10.3390/su152014735
Zhang H, Zhang R, Ju Q, Kong G, Xie Y, He J, Huang Y. Analysis of Extreme Precipitation Variation Characteristics and the Influencing Factors in the Yunnan-Guizhou Plateau Region, China. Sustainability. 2023; 15(20):14735. https://doi.org/10.3390/su152014735
Chicago/Turabian StyleZhang, Hongbo, Runyun Zhang, Qin Ju, Gong Kong, Yina Xie, Jufang He, and Yonghui Huang. 2023. "Analysis of Extreme Precipitation Variation Characteristics and the Influencing Factors in the Yunnan-Guizhou Plateau Region, China" Sustainability 15, no. 20: 14735. https://doi.org/10.3390/su152014735
APA StyleZhang, H., Zhang, R., Ju, Q., Kong, G., Xie, Y., He, J., & Huang, Y. (2023). Analysis of Extreme Precipitation Variation Characteristics and the Influencing Factors in the Yunnan-Guizhou Plateau Region, China. Sustainability, 15(20), 14735. https://doi.org/10.3390/su152014735


