
Interdisciplinary Linkages among Sustainability Dimensions in the Context of European Cities and Regions Research


Abstract
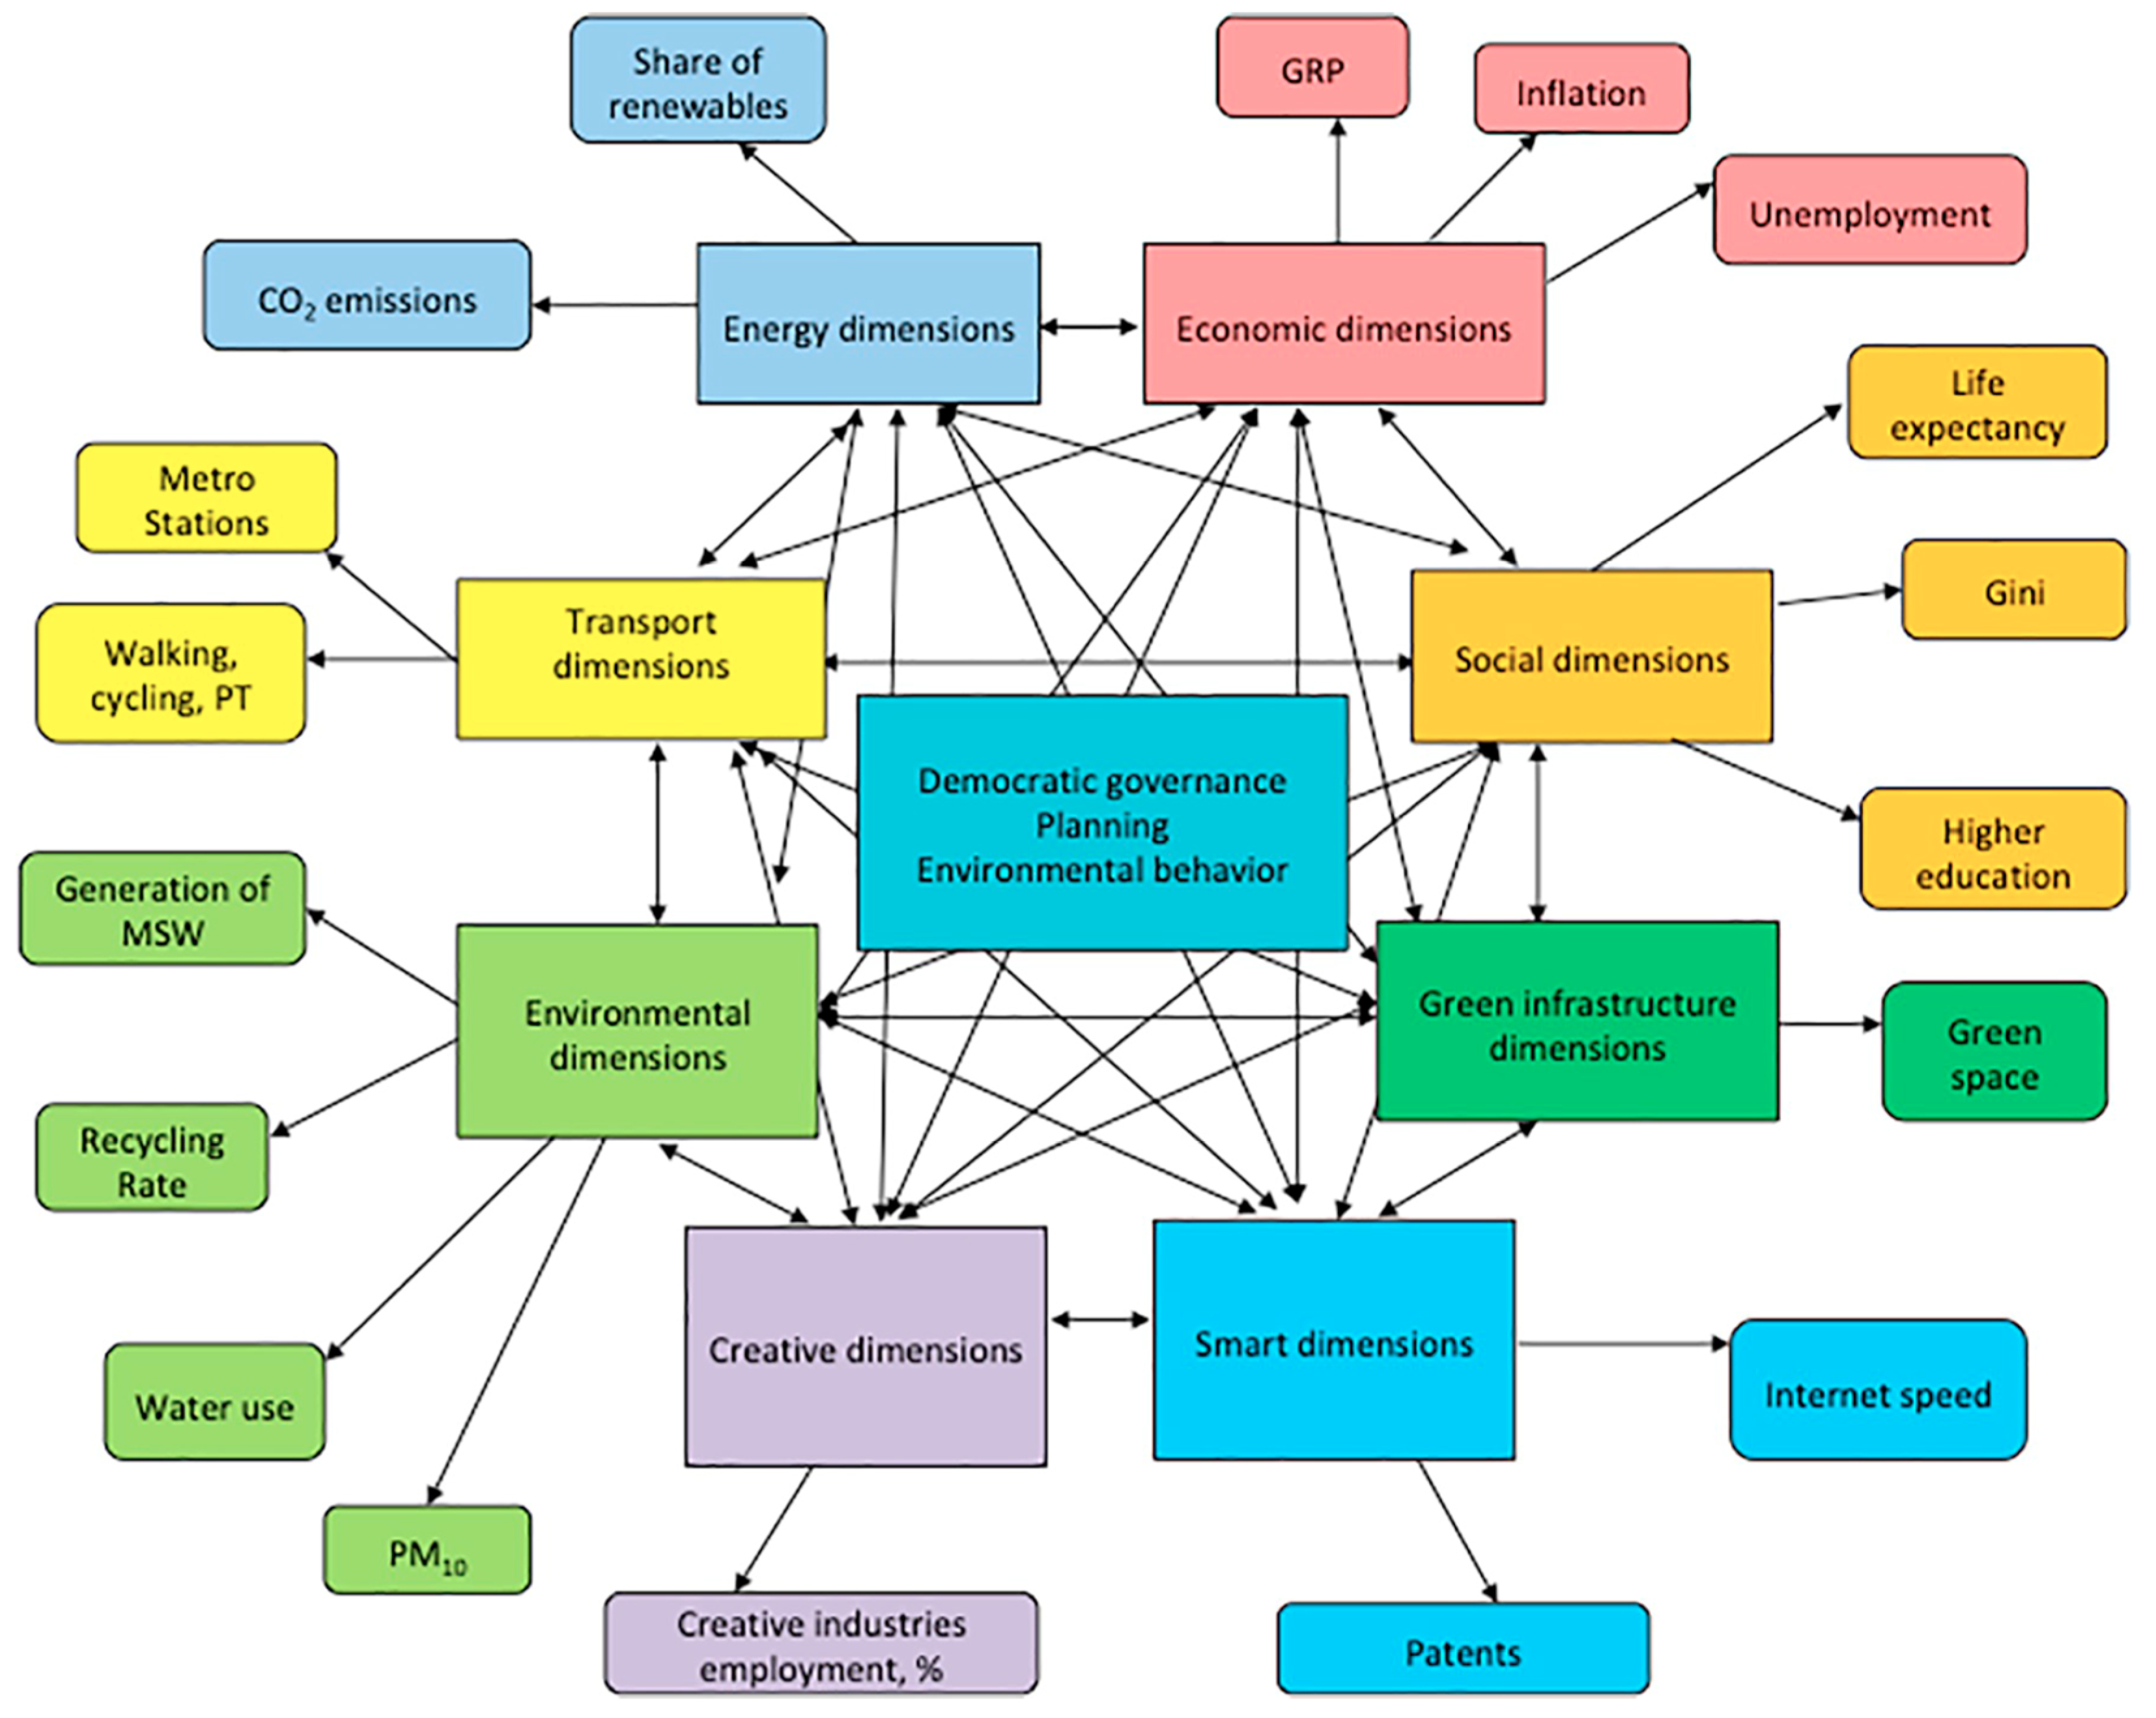
:1. Introduction
2. Methodology
3. Structured Literature Review and Analysis of Performance: Economic Dimensions
3.1. GDP per Capita
3.2. Unemployment Rate
4. Structured Literature Review and Analysis of Performance: Smart Dimensions
4.1. Number of Patents per 1000 Inhabitants
4.2. Average Broadband Internet Speed, Mb/c
4.3. Creative Industry Employment
4.4. Number of Underground Stations per 1,000,000 Inhabitants
5. Structured Literature Review and Analysis of Performance: Social Dimensions
5.1. Life Expectancy at Birth, Years
5.2. Share of Population Aged 25–64 with a Higher Education
5.3. Gini Index of Income Inequality, %
6. Structured Literature Review and Analysis of Performance: Environmental Dimensions
6.1. Annual per Capita CO2 Emissions
6.2. Percentage of Renewable Energy in the Energy Mix
6.3. PM10 Average Annual Concentrations, mg/m3
6.4. Municipal Solid Waste, in kg per Person per Year
6.5. Domestic Water Consumption, m3 per Person per Year
6.6. Recycling Rate
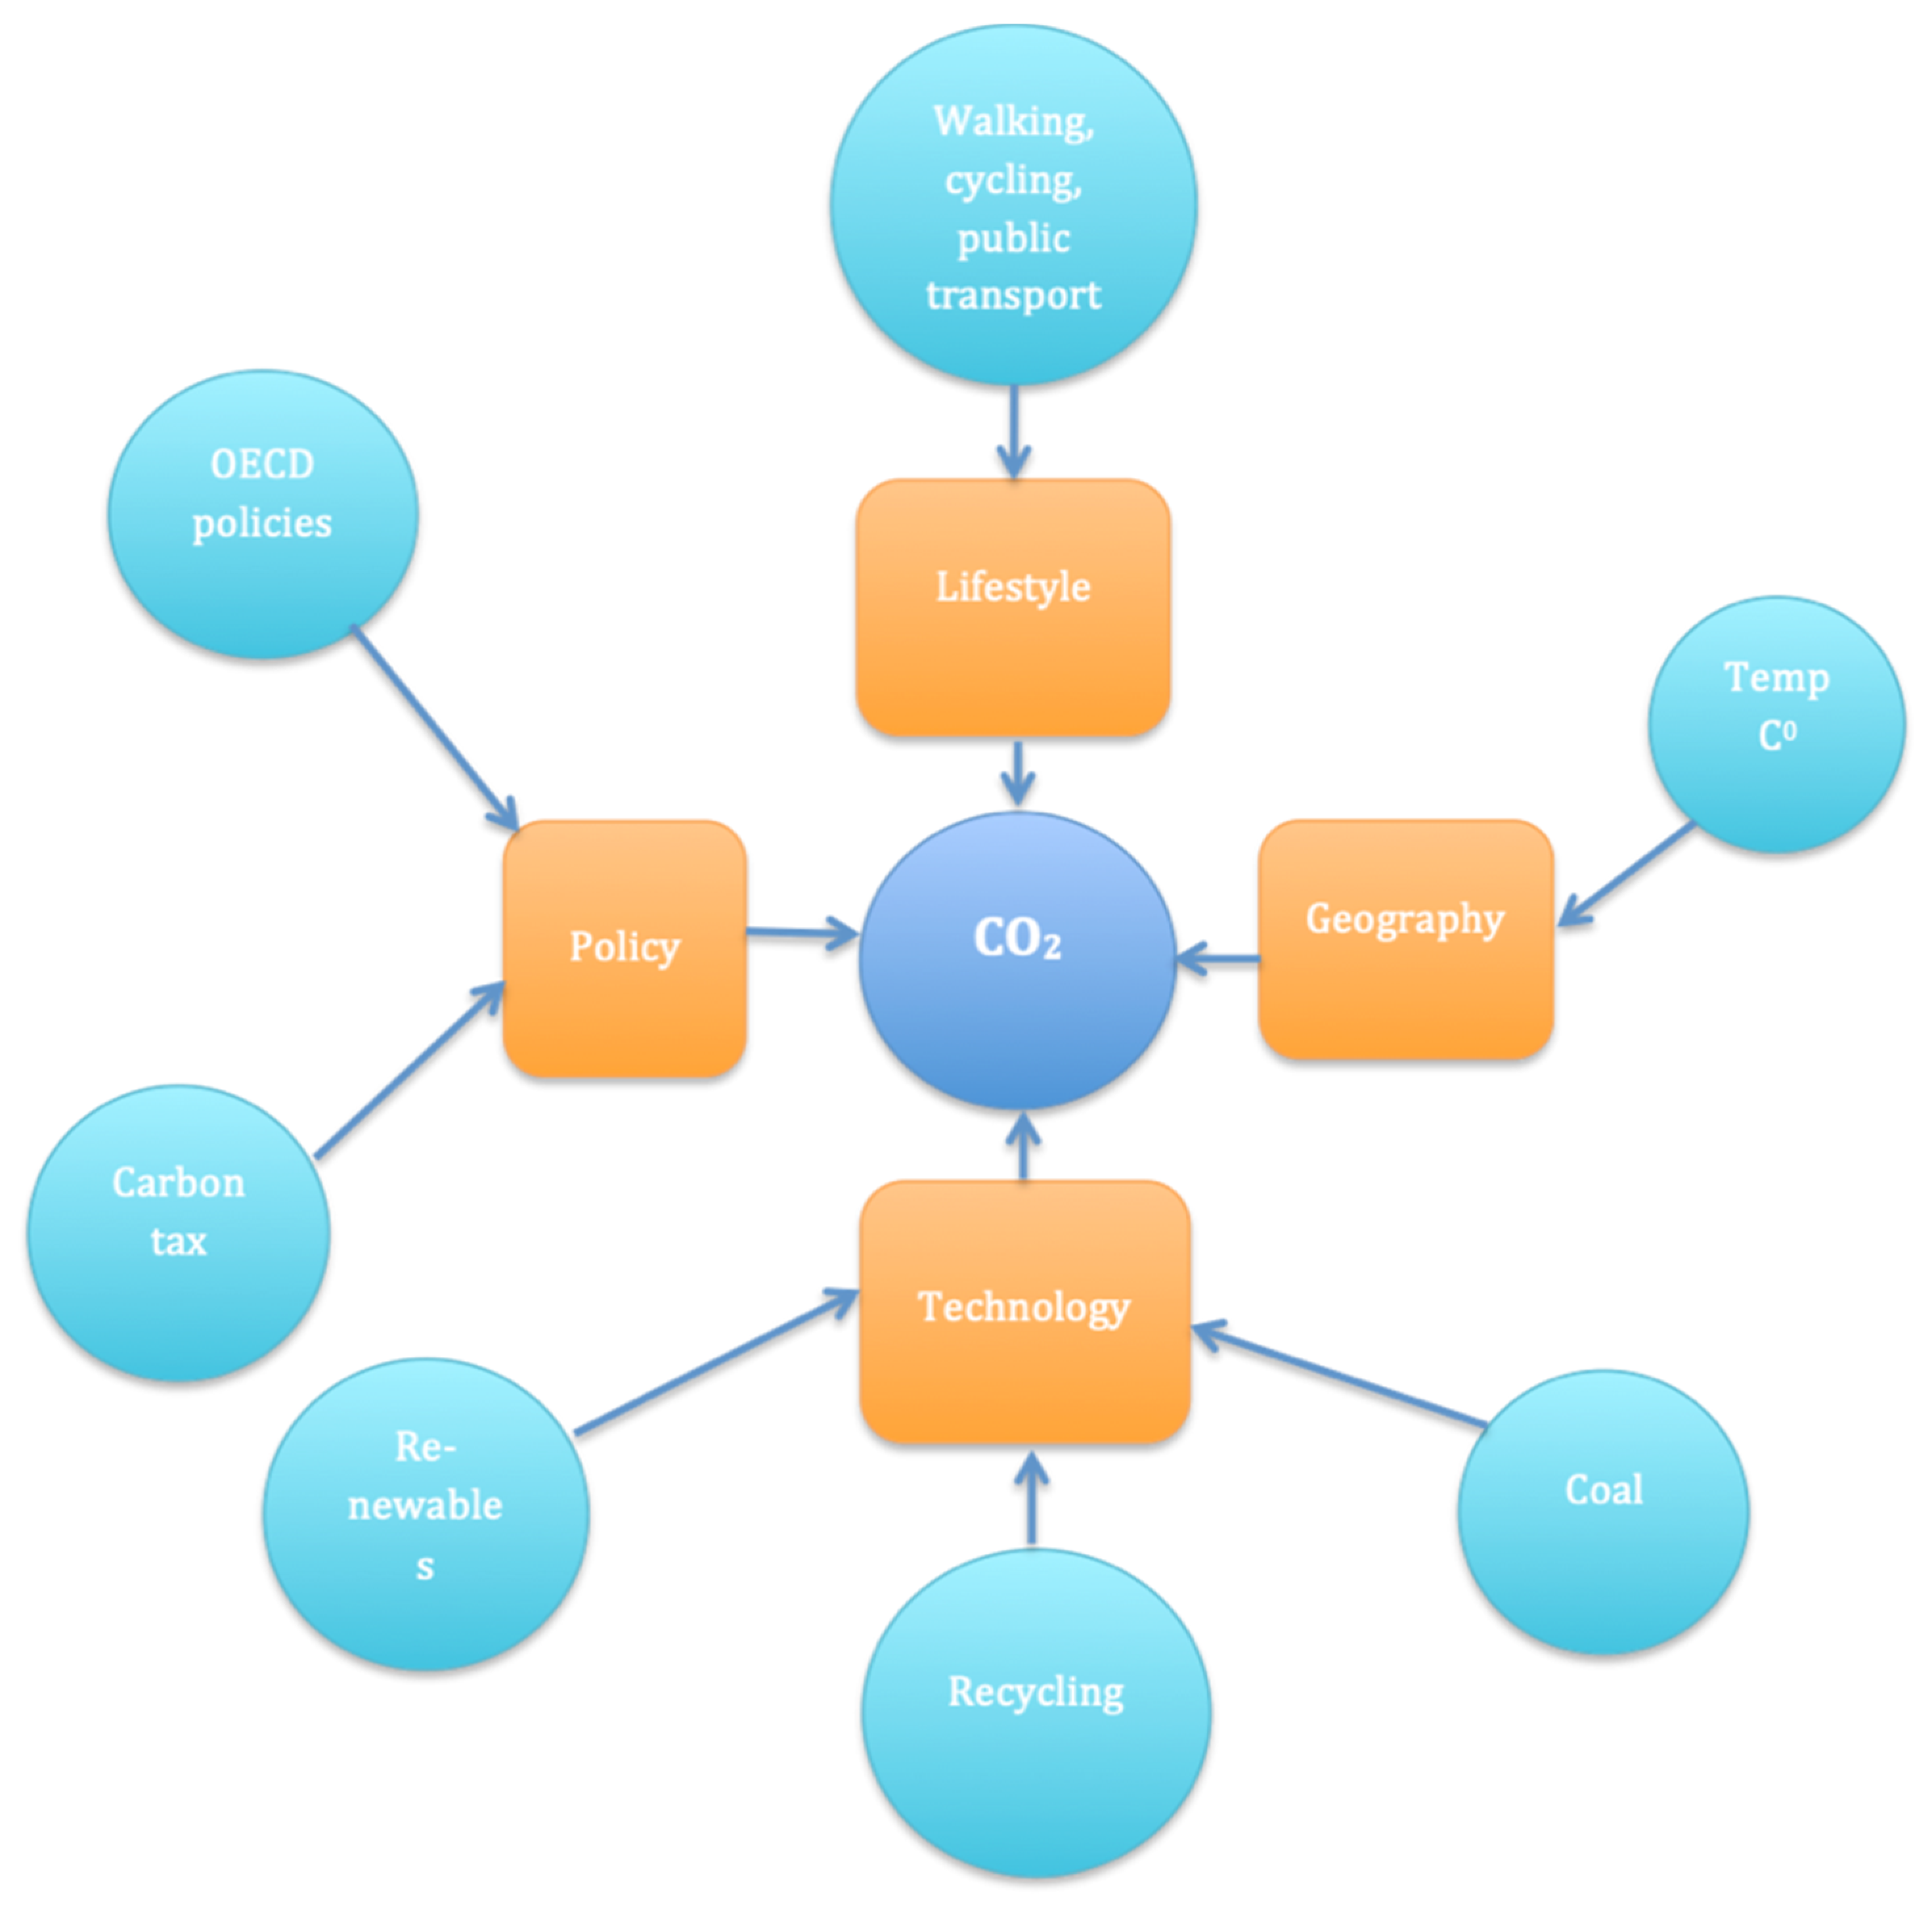
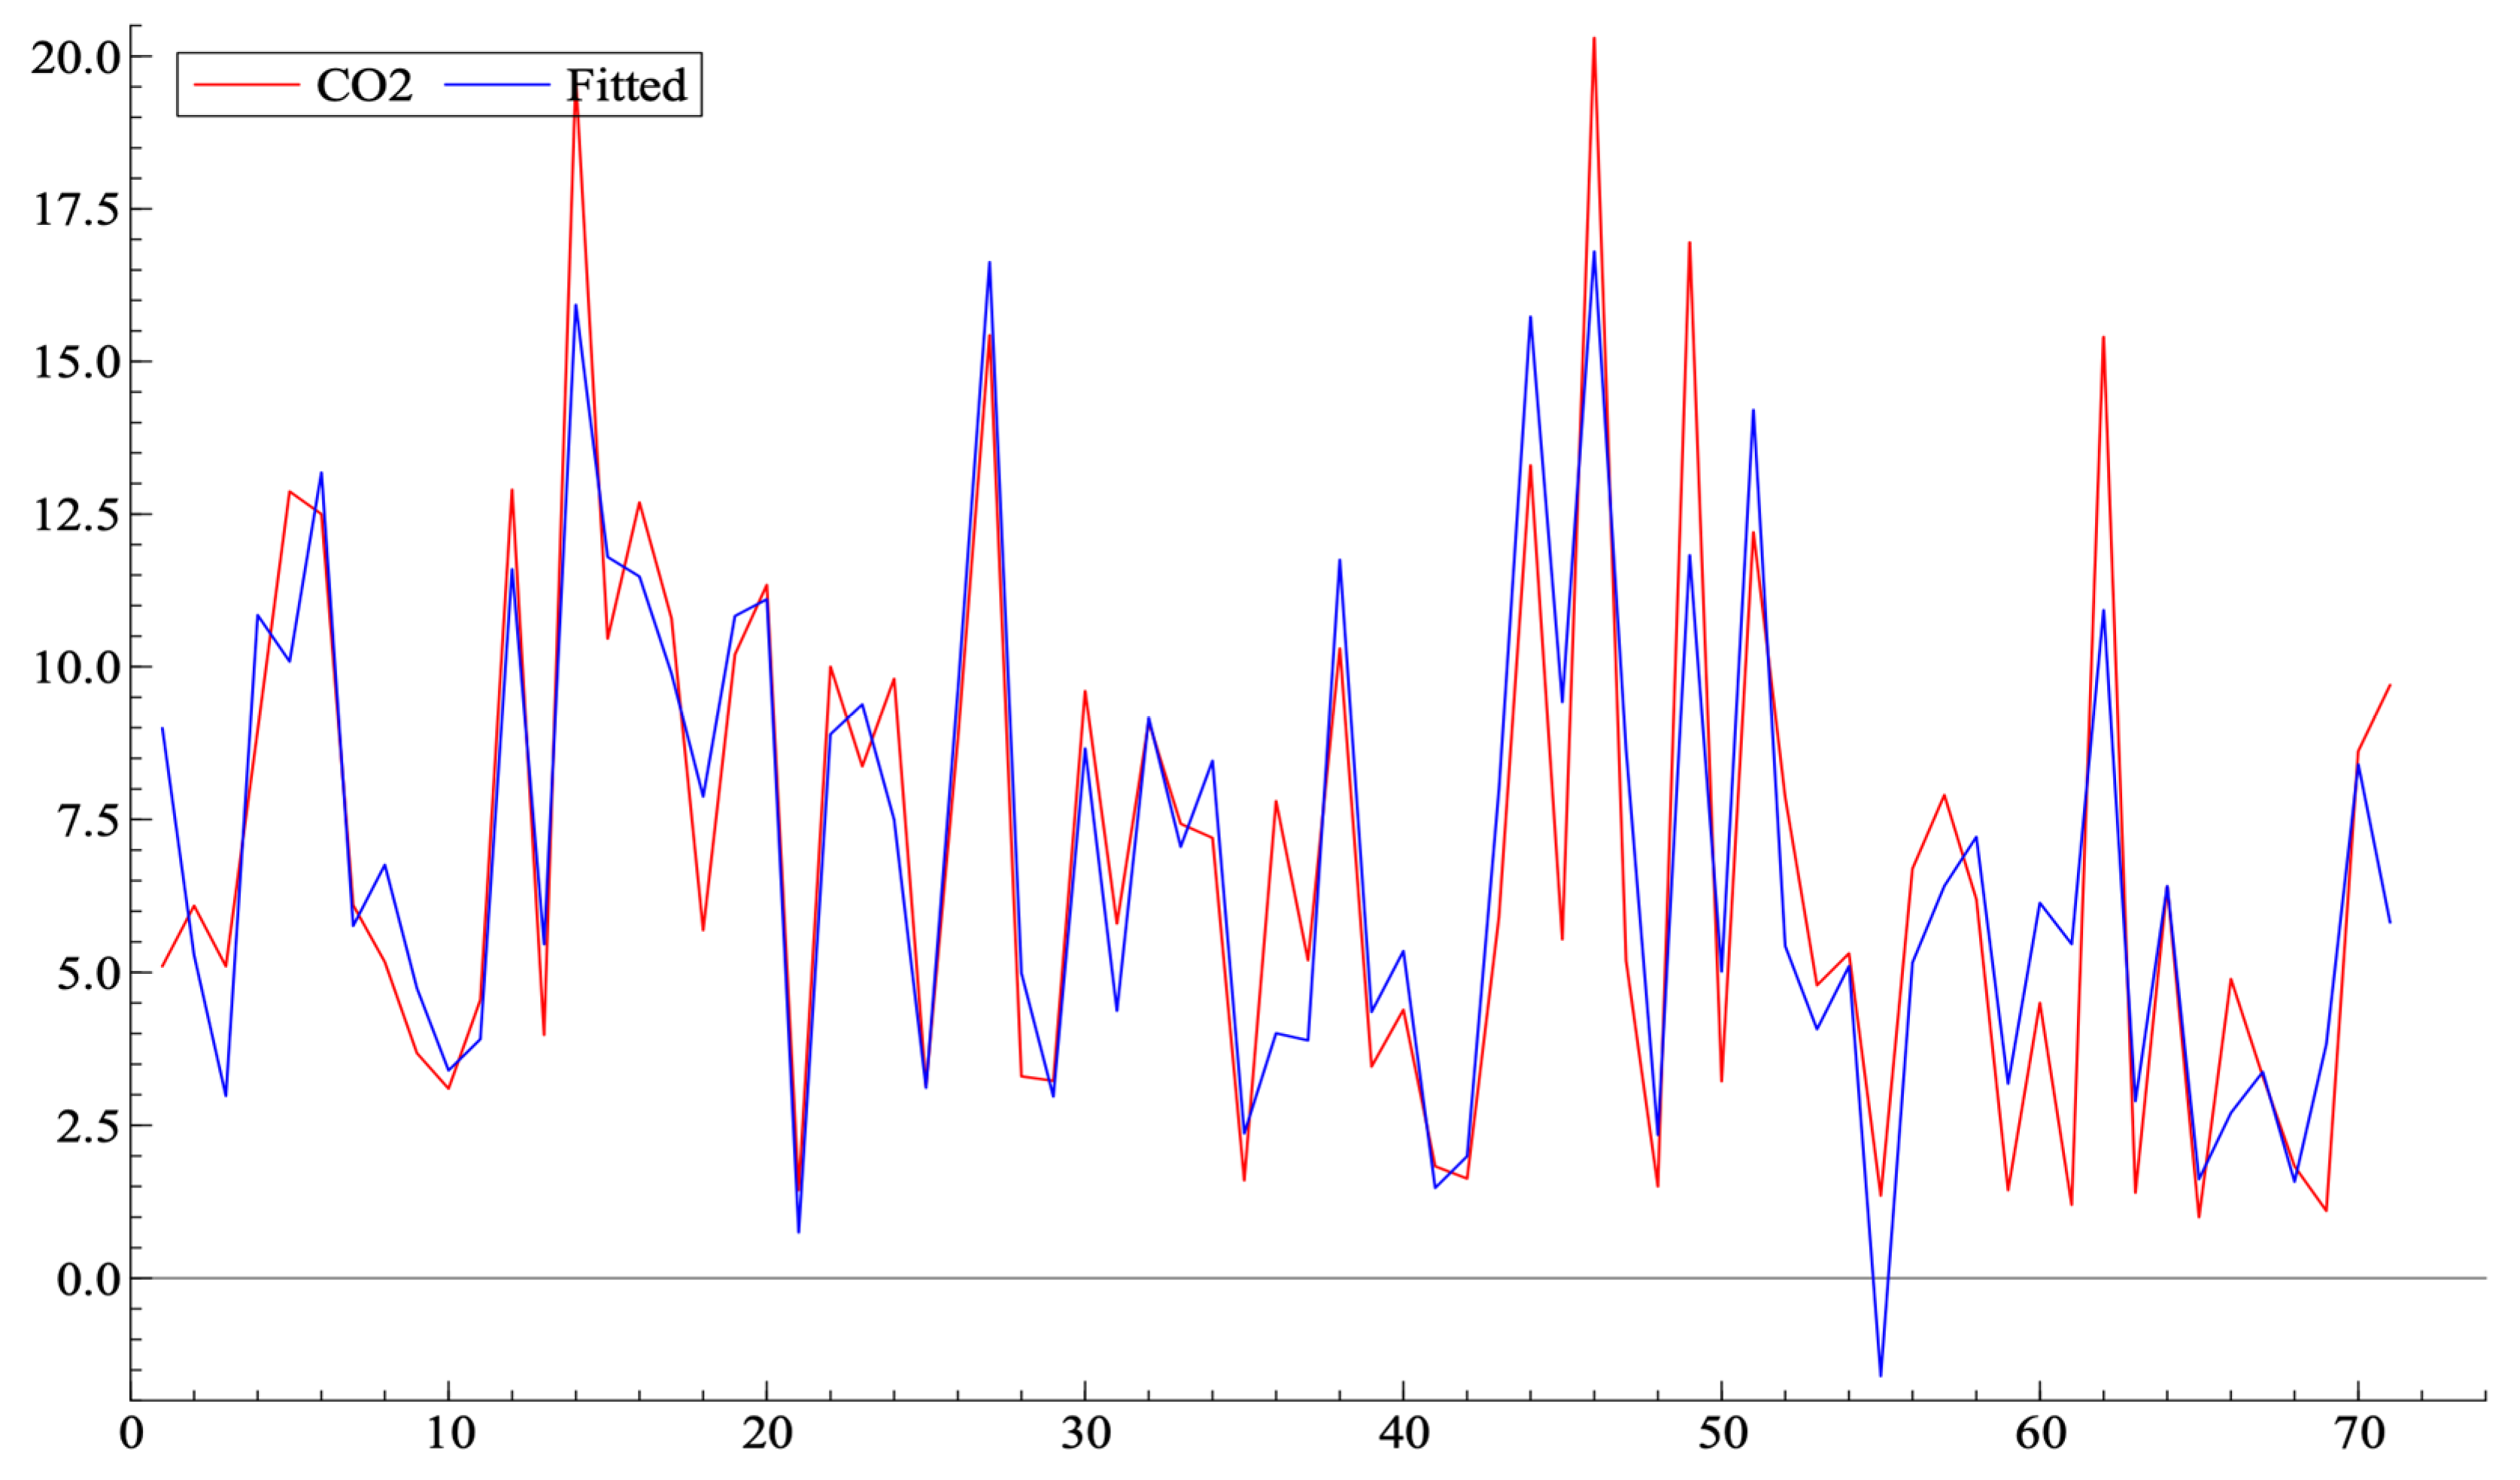
7. Empirical Application
8. Discussion
9. Conclusions
Author Contributions
Funding
Institutional Review Board Statement
Informed Consent Statement
Data Availability Statement
Conflicts of Interest
References
- UN Habitat. World Cities Report 2022. Envisaging the Future of Cities. 2022. Available online: https://unhabitat.org/wcr/ (accessed on 5 August 2022).
- UN. Transforming Our World: The 2030 Agenda for Sustainable Development, Resolution Adopted by the General Assembly on 25 September 2015; UN: New York, NY, USA, 2015. [Google Scholar]
- UN Habitat. The Strategic Plan 2020–2023; UN Habitat: Nairobi, Kenya, 2019. [Google Scholar]
- UN Habitat. The New Urban Agenda; UN Habitat: Nairobi, Kenya, 2020. [Google Scholar]
- UN Habitat. World Cities Report 2020: The Value of Sustainable Urbanization; UN Habitat: Nairobi, Kenya, 2020. [Google Scholar]
- United Nations Development Program. Sustainable Development Goals—Goal 11 Sustainable Cities and Communities. UNDP. Available online: https://www.undp.org/sustainable-development-goals#sustainable-cities-and-communities (accessed on 10 February 2022).
- Shmelev, S.E.; Shmeleva, I.A. Sustainable Cities: Problems of Integrated Interdisciplinary Research. Int. J. Sustain. Dev. 2009, 12, 4–24. [Google Scholar] [CrossRef]
- Shmelev, S.E. Sustainable Cities Reimagined; Routledge: London, UK, 2019. [Google Scholar]
- Shmelev, S.E.; Sagiyeva, R.K.; Kadyrkhanova, Z.M.; Chzhan, Y.Y.; Shmeleva, I.A. Comparative Sustainability Analysis of Two Asian Cities: A Multidimensional Assessment of Taipei and Almaty. J. Asian Financ. Econ. Bus. 2018, 5, 143–155. [Google Scholar] [CrossRef]
- Shmelev, S.E.; Shmeleva, I.A. Global urban sustainability assessment: A multidimensional approach. Sustain. Dev. 2018, 26, 904–920. [Google Scholar] [CrossRef]
- Karvonen, A.; Cvetkovic, V.; Herman, P.; Johansson, K.; Kjellström, H.; Molinari, M.; Skoglund, M. The ‘New Urban Science’: Towards the interdisciplinary and transdisciplinary pursuit of sustainable transformations. Urban Transform. 2021, 3, 9. [Google Scholar] [CrossRef]
- Hadfield-Hill, S.; Horton, J.; Kraftl, P.; Balestieri, J.A.P.; Vilanova, M.R.N.; Dias, R.A.; Soares, P.V. Spaces of interdisciplinary in/congruity: The coming together of engineers and social scientists in planning for sustainable urban environments. Int. J. Urban Sustain. Dev. 2020, 12, 251–266. [Google Scholar] [CrossRef]
- Sommier, M.; Wang, Y.; Vasques, A. Transformative, interdisciplinary and intercultural learning for developing HEI students’ sustainability-oriented competences: A case study. Environ. Dev. Sustain. 2022, 1–18. [Google Scholar] [CrossRef]
- Dijst, M.; Worrell, E.; Böcker, L.; Brunner, P.; Davoudi, S.; Geertman, S.; Harmsen, R.; Helbich, M.; Holtslag, A.A.; Kwan, M.-P.; et al. Exploring urban metabolism—Towards an interdisciplinary perspective. Resour. Conserv. Recycl. 2018, 132, 190–203. [Google Scholar] [CrossRef]
- Elmqvist, T.; Andersson, E.; McPhearson, T.; Bai, X.; Bettencourt, L.; Brondizio, E.; Colding, J.; Daily, G.; Folke, C.; Grimm, N.; et al. Urbanization in and for the Anthropocene. NPJ Urban Sustain. 2021, 1, 6. [Google Scholar] [CrossRef]
- Gallopin, G.C. Linkages between Vulnerability, Resilience, and Adaptive Capacity. Glob. Environ. Chang. 2006, 16, 293–303. [Google Scholar] [CrossRef]
- Wilson, A. Being Interdisciplinary: Adventures in Urban Science and Beyond; UCL Press: London, UK, 2022. [Google Scholar] [CrossRef]
- European Commission. European Green Capital Award. European Commission. 2022. Available online: https://environment.ec.europa.eu/topics/urban-environment/european-green-capital-award_en (accessed on 20 November 2022).
- Purvis, B.; Mao, Y.; Robinson, D. A multi-scale integrated assessment model to support urban sustainability. Sustain. Sci. 2022, 17, 151–169. [Google Scholar] [CrossRef]
- Kissinger, M.; Stossel, Z. An integrated, multi-scale approach for modelling urban metabolism changes as a means for assessing urban sustainability. Sustain. Cities Soc. 2021, 67, 102695. [Google Scholar] [CrossRef]
- Chen, F.; Kusaka, H.; Bornstein, R.; Ching, J.; Grimmond, C.S.B.; Grossman-Clarke, S.; Lori-dan, T.; Manning, K.W.; Martilli, A.; Miao, S.; et al. The Integrated WRF/Urban Modeling System: Development, Evaluation, and Applications to Urban Environmental Problems. Mechanical and Materials Engineering Faculty Publications and Presentations. Int. J. Climatol. 2011, 31, 273–288. Available online: http://pdxscholar.library.pdx.edu/mengin_fac/45 (accessed on 5 May 2022).
- Batty, M. Cities and Complexity: Understanding Cities with Cellular Automata, Agent-Based Models, and Fractals; MIT Press: Cambridge, MA, USA, 2007. [Google Scholar]
- Batty, M. Urban Modelling: Algorithms, Calibrations, Predictions; Cambridge University Press: Cambridge, UK, 2010. [Google Scholar]
- Batty, M. The New Sciences of Cities; MIT Press: Cambridge, MA, USA, 2013. [Google Scholar]
- Chaiechi, T. Sustainable Tropical Cities: A Scoping Review of Multidisciplinary Methods for Urban Planning. eTropic Electron. J. Stud. Trop. 2020, 19, 25–51. [Google Scholar] [CrossRef]
- Crane, M.; Lloyd, S.; Haines, A.; Ding, D.; Hutchinson, E.; Belesova, K.; Davies, M.; Osrin, D.; Zimmermann, N.; Capon, A.; et al. Transforming cities for sustainability: A health perspective. Environ. Int. 2021, 147, 106366. [Google Scholar] [CrossRef] [PubMed]
- Dawson, R.J.; Wyckmans, A.; Heidrich, O.; Köhler, J.; Dobson, S.; Feliu, E. Understanding Cities: Advances in Integrated Assessment of Urban Sustainability; Final Report of COST Action TU0902; Centre for Earth Systems Engineering Research (CESER): Newcastle, UK, 2014; ISBN 978-0-9928437-0-0. [Google Scholar]
- Du, F.; Zhang, L.; Du, F. Smart City Evaluation Index System: Based on AHP Method; Springer: Singapore, 2020; pp. 563–569. [Google Scholar]
- Geropanta, V.; Karagianni, A.; Mavroudi, S.; Parthenios, P. Chapter 10—Exploring the relationship between the smart-sustainable city, well-being, and urban planning: An analysis of current approaches in Europe. In Smart Cities and the un SDGs; Visvizi, A., Pérez Del Hoyo, R., Eds.; Elsevier: Amsterdam, The Netherlands, 2021. [Google Scholar]
- Gil, M.T.N.; Carvalho, L.; Paiva, I. Determining factors in becoming a sustainable smart city: An empirical study in Europe. Econ. Sociol. 2020, 13, 24–39. [Google Scholar] [CrossRef]
- Huovila, A.; Bosch, P.; Airaksinen, M. Comparative analysis of standardized indicators for Smart sustainable cities: What indicators and standards to use and when? Cities 2019, 89, 141–153. [Google Scholar] [CrossRef]
- Koca, G.; Egilmez, O.; Akcakaya, O. Evaluation of the smart city: Applying the dematel technique. Telemat. Inform. 2021, 62, 101625. [Google Scholar] [CrossRef]
- Laslett, D.; Urmee, T. The effect of aggregation on city sustainability rankings. Ecol. Indic. 2020, 112, 106076. [Google Scholar] [CrossRef]
- Li, X.; Yeh, A.G.-O. Modelling sustainable urban development by the integration of constrained cellular automata and GIS. Int. J. Geogr. Inf. Sci. 2000, 14, 131–152. [Google Scholar] [CrossRef]
- MacLeod, M.; Nagatsu, M. What does interdisciplinarity look like in practice: Mapping interdisciplinarity and its limits in the environmental sciences. Stud. Hist. Philos. Sci. Part A 2018, 67, 74–84. [Google Scholar] [CrossRef]
- Mak, H.W.L.; Lam, Y.F. Comparative assessments and insights of data openness of 50 smart cities in air quality aspects. Sustain. Cities Soc. 2021, 69, 102868. [Google Scholar] [CrossRef]
- Ozkaya, G.; Erdin, C. Evaluation of smart and sustainable cities through a hybrid MCDM approach based on ANP and TOPSIS technique. Heliyon 2020, 6, e05052. [Google Scholar] [CrossRef] [PubMed]
- Mokarrari, K.R.; Torabi, S.A. Ranking cities based on their smartness level using MADM methods. Sustain. Cities Soc. 2021, 72, 103030. [Google Scholar] [CrossRef]
- Sáez, L.; Heras-Saizarbitoria, I.; Rodríguez-Núñez, E. Sustainable city rankings, benchmarking and indexes: Looking into the black box. Sustain. Cities Soc. 2019, 53, 101938. [Google Scholar] [CrossRef]
- Sisto, R.; López, J.G.; Martín, J.L.; Aldeanueva, C.M.; Ferreiro, L.R. City Assessment Tool to Measure the Impact of Public Policies on Smart and Sustainable Cities. The Case Study of the Municipality of Alcobendas (Spain) Compared with Similar European Cities. In Smart and Sustainable Planning for Cities and Regions: Results of SSPCR 2019; Springer International Publishing: Cham, Switzerland, 2021; pp. 81–101. [Google Scholar] [CrossRef]
- Sustainable Development Solutions Network. European Cities SDG Index. European Cities SDG Index. 2019. Available online: https://euro-cities.sdgindex.org/#/ (accessed on 10 February 2022).
- Calabrese, F.; Diao, M.; Di Lorenzo, G.; Ferreira, J., Jr.; Ratti, C. Understanding individual mobility patterns from urban sensing data: A mobile phone trace example. Transp. Res. Part C Emerg. Technol. 2013, 26, 301–313. [Google Scholar] [CrossRef]
- Bongiorno, C.; Zhou, Y.; Kryven, M.; Theurel, D.; Rizzo, A.; Santi, P.; Tenenbaum, J.; Ratti, C. Vector-based pedestrian navigation in cities. Nat. Comput. Sci. 2021, 1, 678–685. [Google Scholar] [CrossRef]
- Yan, L.; Luo, X.; Zhu, R.; Santi, P.; Wang, H.; Wang, D.; Zhang, S.; Ratti, C. Quantifying and analyzing traffic emission reductions from ridesharing: A case study of Shanghai. Transp. Res. Part D Transp. Environ. 2020, 89, 102629. [Google Scholar] [CrossRef]
- Nicholson, S.; Tomasi, M.; Belleri, D.; Ratti, C.; Nikolopoulou, M. Greening’ the Cities: How Data Can Drive Interdisciplinary Connections to Foster Ecological Solutions. SPOOL 2022, 9, 5–18. [Google Scholar] [CrossRef]
- Legeby, A.; Koch, D.; Duarte, F.; Heine, C.; Benson, T.; Fugiglando, U.; Ratti, C. New urban habits in Stockholm following COVID-19. Urban Stud. 2021, 60, 1448–1464. [Google Scholar] [CrossRef]
- Esmaeilian, B.; Wang, B.; Lewis, K.; Duarte, F.; Ratti, C.; Behdad, S. The Future of Waste Management in Smart and Sustainable Cities: A Review and Concept Paper. Waste Manag. 2018, 81, 177–195. [Google Scholar] [CrossRef]
- Abu-Rayash, A.; Dincer, I. Development of integrated sustainability performance indicators for better management of smart cities. Sustain. Cities Soc. 2021, 67, 102704. [Google Scholar] [CrossRef]
- Shen, L.; Kyllo, J.M.; Guo, X. An Integrated Model Based on a Hierarchical Indices System for Monitoring and Evaluating Urban Sustainability. Sustainability 2013, 5, 524–559. [Google Scholar] [CrossRef]
- Wey, W.-M.; Peng, T.-C. Study on Building a Smart Sustainable City Assessment Framework Using Big Data and Analytic Network Process. J. Urban Plan. Dev. 2021, 147, 04021031. [Google Scholar] [CrossRef]
- Ouyang, X.; Luo, X. Models for Assessing Urban Ecosystem Services: Status and Outlooks. Sustainability 2022, 14, 4725. [Google Scholar] [CrossRef]
- Orozco-Messana, J.; Iborra-Lucas, M.; Calabuig-Moreno, R. Neighbourhood Modelling for Urban Sustainability Assessment. Sustainability 2021, 13, 4654. [Google Scholar] [CrossRef]
- Buzási, A.; Jäger, B.S. District-scale assessment of urban sustainability. Sustain. Cities Soc. 2020, 62, 102388. [Google Scholar] [CrossRef]
- Shamsuzzoha, A.; Nieminen, J.; Piya, S.; Rutledge, K. Smart city for sustainable environment: A comparison of participatory strategies from Helsinki, Singapore and London. Cities 2021, 114, 103194. [Google Scholar] [CrossRef]
- Shmelev, S.E.; Shmeleva, I.A. Smart and Sustainable Benchmarking of Cities and Regions in Europe: The Application of Multicriteria Assessment, Cities. SSRN, 2023; in press. [Google Scholar]
- Shmelev, S.E.; Shmeleva, I.A. Multidimensional sustainability benchmarking for smart megacities. Cities 2019, 92, 134–163. [Google Scholar] [CrossRef]
- Eurostat. Eurostat Regional Yearbook: 2021 Edition; Eurostat: Luxembourg, 2021. [Google Scholar]
- Eurostat. Eurostat Regional Yearbook: 2022 Edition; Eurostat: Luxembourg, 2022; Available online: https://ec.europa.eu/eurostat/documents/15234730/15242104/KS-HA-22%E2%80%91001-EN-N.pdf/ffb89e8c-a7c9-517e-101f-13462ba1cf65?t=1667398021883 (accessed on 5 May 2022).
- Formánek, T. GDP per capita in selected EU countries: Economic growth factors and spatio-temporal interactions examined at the NUTS2 level. J. Int. Stud. 2019, 12, 119–133. [Google Scholar] [CrossRef]
- Bosker, M. The spatial evolution of regional GDP disparities in the ‘old’ and the ‘new’ Europe*. Pap. Reg. Sci. 2009, 88, 3–27. [Google Scholar] [CrossRef]
- Österholm, P. Estimating the Relationship between Age Structure and GDP in the OECD Using Panel Cointegration Methods; OECD: Paris, France, 2004. [Google Scholar]
- Edlund, P.-O.; Karlsson, S. Forecasting the Swedish unemployment rate VAR vs. transfer function modelling. Int. J. Forecast. 1993, 9, 61–76. [Google Scholar] [CrossRef]
- Howe, W.J. The Effects of Higher Education on Unemployment Rates. In Higher Education and Economic Growth; Becker, W.E., Lewis, D.R., Eds.; Springer: Dordrecht, The Netherlands, 1993. [Google Scholar]
- Núñez, I.; Livanos, I. Higher education and unemployment in Europe: An analysis of the academic subject and national effects. High. Educ. 2009, 59, 475–487. [Google Scholar] [CrossRef]
- European Commission. The Eco-Innovation Scoreboard and the Eco-Innovation Index. 2020. Available online: https://ec.europa.eu/environment/ecoap/indicators/index_en (accessed on 15 March 2022).
- Jaumotte, F.; Pain, N. From Ideas to Development: The Determinants of R&D and Patenting; OECD Publishing: Berlin, Germany, 2005. [Google Scholar]
- Koutroumpis, P. The Economic Impact of Broadband: Evidence from OECD Countries, Ofcom. 2018. Available online: https://www.ofcom.org.uk/__data/assets/pdf_file/0025/113299/economic-broadband-oecd-countries.pdf (accessed on 20 May 2022).
- Actis. Global Digital Infrastructure Investment. Enabling a Just Transition. 2022. Available online: https://www.act.is/wp-content/uploads/2022/03/ac-0209-203028-Global-Digital-Infrastructure-Investment-LOW-RES.pdf (accessed on 20 May 2022).
- ITU. Broadband Mapping Systems in Europe and the Status of Harmonization in the Region; ITU: Geneva, Switzerland, 2020. [Google Scholar]
- EIB. Digitalisation in Europe in 2020–2021. Evidence from the EIB Investment Survey; EIB: Luxembourg, 2021. [Google Scholar]
- Lemstra, W.; van Gorp, N.; Voogt, B. Explaining Telecommunications Performance across the EU; TUDelft: Delft, The Netherlands, 2014. [Google Scholar]
- European Commission. Digital Economy and Society Index. 2022. Available online: https://digital-strategy.ec.europa.eu/en/policies/desi (accessed on 5 May 2022).
- OECD. Broadband Portal. 2022. Available online: https://www.oecd.org/digital/broadband/broadband-statistics/ (accessed on 20 May 2022).
- UNCTAD. Creative Economy Outlook 2022; UNCTAD: Geneva, Switzerland, 2022. [Google Scholar]
- Department for Culture, Media and Sport. Creative Industries Sector Vision: A Joint Plan to Drive Growth, Build Talent and Develop Skills; Department for Culture, Media and Sport: London, UK, 2023. [Google Scholar]
- Lazzeretti, L.; Capone, F.; Boix, R. Reasons for Clustering of Creative Industries in Italy and Spain. Eur. Plan. Stud. 2012, 20, 1243–1262. [Google Scholar] [CrossRef]
- Shmeleva, I.A.; Shmelev, S.E. How Smart is Sustainable and How Sustainable is Smart? In Sustainable Cities Reimagined: Multidimensional Assessment and Smart Solutions; Shmelev, S.E., Ed.; Routledge: London, UK, 2019. [Google Scholar]
- Roy, B.; Hugonnard, J. Ranking of suburban line extension projects on the Paris metro system by a multicriteria method. Transp. Res. Part A Gen. 1982, 16, 301–312. [Google Scholar] [CrossRef]
- OECD. Health at a Glance 2017; OECD: Paris, France, 2017. [Google Scholar]
- Braconier, H. Determinants of Tertiary Graduations. In OECD Economics Department Working Papers; No. 1138; OECD Publishing: Paris, France, 2015. [Google Scholar] [CrossRef]
- OECD. OECD Environmental Performance Reviews: Greece 2020; OECD: Paris, France, 2020. [Google Scholar]
- Climate Disclosure Protocol. Cities Scores—CDP. 2021. Available online: https://www.cdp.net/en/cities/cities-scores (accessed on 10 February 2022).
- Eurostat. Coal Production and Consumption Decreased by a Third in 2 Years. 2021. Available online: https://ec.europa.eu/eurostat/web/products-eurostat-news/-/ddn-20210810-1 (accessed on 17 February 2022).
- Mac Domhnaill, C.; Ryan, L. Towards renewable electricity in Europe: Revisiting the determinants of renewable electricity in the European Union. Renew. Energy 2020, 154, 955–965. [Google Scholar] [CrossRef]
- Karagulian, F.; Belis, C.A.; Dora, C.F.C.; Prüss-Ustün, A.M.; Bonjour, S.; Adair-Rohani, H.; Amann, M. Contributions to cities’ ambient particulate matter (PM): A systematic review of local source contributions at global level. Atmos. Environ. 2015, 120, 475–483. [Google Scholar] [CrossRef]
- World Bank. Urban Population (% of Total Population)—European Union|Data; World Bank: Washington, DC, USA, 2020. [Google Scholar]
- Ebenstein, A.; Fan, M.; Greenstone, M.; He, G.; Zhou, M. New evidence on the impact of sustained exposure to air pollution on life expectancy from China’s Huai River Policy. Proc. Natl. Acad. Sci. USA 2017, 114, 10384–10389. [Google Scholar] [CrossRef]
- European Environment Agency. Bulgaria—Air Pollution Country Fact Sheet. 2020. Available online: https://www.eea.europa.eu/themes/air/country-fact-sheets/2020-country-fact-sheets/bulgaria (accessed on 5 May 2022).
- World Health Organization (WHO). Ambient (Outdoor) Air Pollution. 2018. Available online: https://www.who.int/news-room/fact-sheets/detail/ambient-(outdoor)-air-quality-and-health (accessed on 27 January 2022).
- Romano, G.; Rapposelli, A.; Marrucci, L. Improving waste production and recycling through zero-waste strategy and privatization: An empirical investigation. Resour. Conserv. Recycl. 2019, 146, 256–263. [Google Scholar] [CrossRef]
- Romano, G.; Salvati, N.; Guerrini, A. An empirical analysis of the determinants of water demand in Italy. J. Clean. Prod. 2016, 130, 74–81. [Google Scholar] [CrossRef]
- Sidique, S.F.; Joshi, S.V.; Lupi, F. Factors influencing the rate of recycling: An analysis of Minnesota counties. Resour. Conserv. Recycl. 2010, 54, 242–249. [Google Scholar] [CrossRef]


| Ranking | Unemployment Rate (Q4, 2019, %) | R&D Expenditure (% GDP) | FDI Inflows (% GDP) | Share of Population Aged 25–64 with Higher Education (2020) | Inflation (2020) | Ratio of Economically Active Female Population, % | Share of the Population Aged 18–64, % (2020) | Labour (Hours Worked per Person per Year) | |
|---|---|---|---|---|---|---|---|---|---|
| Effect (+/−) | − | + | + | + | − | + | + | + | |
| Stockholm | 1 | 6.20% | 5.50% | 3.13% | 53% | 0.50% | 90.38% | 62.10% | 1452 |
| Paris | 2 | 6.30% | 2.19% | 1.88% | 51.50% | 0.48% | 84.87% | 66.70% | 1511 |
| London | 3 | 4.30% | 1.76% | 141% | 59.6% (1) | 0.99% | 85.38% | 65.20% | 1537 |
| Gothenburg | 7 | 5.90% | 5.50% | 3.13% | 42.30% | 0.50% | 90.38% | 64.60% | 1452 |
| Malmö | 9 | 10.10% | 5.50% | 3.13% | 51.50% | 0.50% | 90.38% | 63.50% | 1452 |
| Munich | 5 | 3.20% | 3.18% | 1.75% | 40.50% | 0.51% | 82.96% | 66.70% | 1382 |
| Hamburg | 19 | 6.40% | 3.18% | 1.75% | 37.10% | 0.51% | 82.96% | 65% | 1382 |
| Ranking | Inflation (2020) | Change in GDP | Index of Industrial Prouction (100% in 2015) | Consumer Price Index (2021) | Real Labour Costs, € (2020) | |
|---|---|---|---|---|---|---|
| Effect (+/−) | − | + | − | + | + | |
| Stockholm | 1 | 0.50% | 1.26% | 107.13% | 1.83% | 37.3 |
| Paris | 2 | 0.48% | 1.51% | 92.71% | 1.42% | 37.5 |
| London | 3 | 0.99% | 1.46% | 94.71% | 2.10% | 24.77 |
| Gothenburg | 7 | 0.50% | 1.26% | 107.13% | 1.83% | 37.3 |
| Malmö | 9 | 0.50% | 1.26% | 107.13% | 1.83% | 37.3 |
| Munich | 5 | 0.51% | 0.55% | 108.77% | 2.55% | 36.6 |
| Hamburg | 19 | 0.51% | 0.55% | 108.77% | 2.55% | 36.6 |
| Ranking | Availability of Scientists and Engineers (% of Active Pop) (2020) | Share of Population Aged 25–64 with Tertiary Education (% GDP) | R&D Tax Incentives | FDI Restrictions | FDI Inflows (% GDP) | Stock Market Cap to GDP | Stock of Non-Business R&D, bln EUR (2018) | Stock of Business R&D, bln EUR (2018) | Total R&D as % of GDP (2018) | Direct Government Spending and Tax Support for Business R&D (2018) | Total Public Spending to Education (2017) | Share of Students to Total Population (2021) | |
|---|---|---|---|---|---|---|---|---|---|---|---|---|---|
| Effect (+/−) | + | + | + | + | + | + | + | + | + | + | + | + | |
| Stockholm | 1 | 15.70% | 53.00% | Yes | No | 3.13% | 176.10% | 4.8 | 12.2 | 3.34% | 0.12% | 7.75% | 4% (3) |
| Paris | 2 | 10.60% | 51.50% | Yes | Yes | 1.88% | 107.60% | 17.9 | 33.9 | 2.20% | 0.40% | 5.45% | 5.86% (2) |
| London | 3 | 12.70% | 59.60% | Yes | Yes | 141.00% | 102.10% | 11.2 | 23.6 | 1.70% | 0.33% | 5.44% | 4.20% |
| Gothenburg | 7 | 12.10% | 42.30% | Yes | No | 3.13% | 176.10% | 4.8 | 12.2 (1) | 3.34% | 0.12% | 7.57% | 9.25% |
| Malmö | 9 | 12.10% | 51.50% | Yes | No | 3.13% | 176.10% | 4.8 | 12.2 | 3.34% | 0.12% | 7.57% | 6.97% |
| Munich | 5 | 11.00% | 40.50% | Yes | No | 1.75% | 56.10% | 33 | 72 | 3.10% | 0.08% | 4.91% | 7.81% (4) |
| Hamburg | 19 | 10.70% | 37.10% | Yes | No | 1.75% | 56.10% | 33 | 72 | 3.10% | 0.08% | 4.91% | 4.17% |
| Ranking | GDP per Capita, EUR | Urban Density, Persons/km2 (Eurostat, 2019) | EU Digital Economy and Society Index (2020) | Share of Fiber by Country (OECD, 2021) | Share of Fiber by City (2021) | |
|---|---|---|---|---|---|---|
| Effect (+/−) | + | + | + | + | + | |
| Stockholm | 1 | 64,700 | 5012 | 69.7 | 78.04% | 90.00% |
| Paris | 2 | 60,400 | 8600 | 52.2 | 45.98% | 96.78% |
| London | 3 | 60,400 | 5598 | 60.4 | 7.09% | 90.00% |
| Gothenburg | 7 | 44,600 | 1300 | 69.7 | 78.04% | 96.50% |
| Malmö | 9 | 39,400 | 2183 | 69.7 | 78.04% | 96.20% |
| Munich | 5 | 60,400 | 4767 | 56.1 | 7.11% | 75.00% |
| Hamburg | 19 | 59,700 | 2597 | 56.1 | 7.11% | 72.00% |
| Ranking | City Population (2021) | Capital City | Tertiary Graduates among 25–64 | Number of Museums | Museums per 100,000 Inhabitants | Number of Films Released per Year (2018) | |
|---|---|---|---|---|---|---|---|
| Effect (+/−) | + | + | + | + | + | + | |
| Stockholm | 1 | 975,277 | Yes | 53.00% | 92 | 9 | 284 |
| Paris | 2 | 2,142,366 | Yes | 51.50% | 297 | 13.7 | 684 |
| London | 3 | 8,908,000 | Yes | 59.60% | 192 | 2 | 918 |
| Gothenburg | 7 | 583,684 | No | 42.30% | 17 | 3 | 284 |
| Malmö | 9 | 348,601 | No | 51.50% | 7 | 2 | 284 |
| Munich | 5 | 1,560,000 | No | 40.50% | 42 | 2.85 | 353 |
| Hamburg | 19 | 1,852,478 | No | 37.10% | 37 | 2 | 353 |
| Ranking | Daily Traffic, mln Passengers | Investment in Upgrades, mln EUR, 2021 | Number of Public Transport Modes | Number of Underground Lines | Overall Underground Length, km | Number of Stations | Ownership | Population Density | |
|---|---|---|---|---|---|---|---|---|---|
| Effect (+/−) | + | + | + | + | + | + | + | + | |
| Stockholm | 1 | 0.97 | 2548 | 6 | 7 | 25.5 | 100 | Private | 5012 |
| Paris | 2 | 4.27 | 1600 | 5 | 16 | 227 | 303 | Public | 8600 |
| London | 3 | 3.79 | 1351 | 6 | 11 | 402 | 272 | Public | 5598 |
| Gothenburg | 7 | NA | NA | 4 | NA | NA | NA | NA | 1301 |
| Malmö | 9 | NA | NA | 3 | NA | NA | NA | NA | 2183 |
| Munich | 5 | 1.12 | 230 | 4 | 8 | 103 | 100 | Public | 4767 |
| Hamburg | 19 | 0.66 | 282 | 4 | 4 | 106 | 93 | Public | 2597 |
| Ranking | Smoking (% Population, 2018) | Alcohol Daily or Risky Consumption (%, 2018) | Healthy Diet (% Consuming Vegetables Daily, 2014) | Private Health Spending (% Expenditure, 2018) | Exposure to Air Pollution by PM2.5 Particles, mg/m3 (2017) | Health Expenditure per Capita, EUR (2018) | Share of Tertiary Graduates (2020) | GRP per Capita, EUR | Unemployment Rate Q4, 2019 | |
|---|---|---|---|---|---|---|---|---|---|---|
| Effect (+/−) | − | − | + | − | − | + | + | + | − | |
| Stockholm | 1 | 7.00% | 18.30% | 52.10% | 13.78% | 4.5 | 5040 | 53.00% | 64,060 | 6.2% |
| Paris | 2 | 22.00% | 7.10% | 57.60% | 9.25% | 14.7 | 3952 | 51.50% | 94,832 | 6.30% |
| London | 3 | 14.10% | 21.60% | 65.30% | 16.71% | 11.5 | 3636 | 59.60% | 139,619 | 4.30% |
| Gothenburg | 7 | 9.00% | 16.00% | 52.10% | 13.78% | 5.5 | 5040 | 33.60% | 45,074 | 5.90% |
| Malmö | 9 | 11.00% | 16.00% | 52.10% | 13.78% | 7.8 | 5040 | 33.75% | 38,928 | 10.10% |
| Munich | 5 | 24.87% | 16.00% | 34.10% | 12.65% | 12.8 | 4611 | 40.50% | 71,348 | 3.20% |
| Hamburg | 19 | 27.49% | 16.00% | 34.10% | 12.65% | 12.7 | 5472 | 37.10% | 59,929 | 6.40% |
| Ranking | Gross Earning Differentials D9/D5 (2018) | Government Direct Expenditure per Student (USD PPP) (2017) | Employment Ratio: Tertiary vs. Secondary Education (2020) | Unemployment Rate Q4, 2019 | Government Direct Expenditure per Student (USD PPP) (2017) | Average PISA Score, Reading (2018) | Share of Students in Tertiary Private Institutions (2018) | GRP per Capita, EUR | University Tuition Fees, USD PPP (2017–2018) | |
|---|---|---|---|---|---|---|---|---|---|---|
| Effect (+/−) | + | + | − | − | + | + | − | + | − | |
| Stockholm | 1 | 1.7 | 13,836 | 103.00% | 6.2% | 13,836 | 506 | 9.70% | 64,060 | 0 |
| Paris | 2 | 1.8 | 10,495 | 138.00% | 6.30% | 10,495 | 493 | 23.70% | 94,832 | 330 |
| London | 3 | 2.1 | 9372 | 118.50% | 4.30% | 9372 | 504 | 100.00% | 139,619 | 12,000 |
| Gothenburg | 7 | 1.7 | 13,836 | 113.30% | 5.90% | 13,836 | 506 | 9.70% | 45,074 | 0 |
| Malmö | 9 | 1.7 | 13,836 | 113.30% | 10.10% | 13,836 | 506 | 9.70% | 38,928 | 0 |
| Munich | 5 | 1.8 | 11,628 | 131.60% | 3.20% | 11,628 | 498 | 10.50% | 71,348 | 133 |
| Hamburg | 19 | 1.8 | 11,628 | 131.60% | 6.40% | 11,628 | 498 | 10.50% | 59,929 | 133 |
| Ranking | Structure of Taxation System (Income) | Income Not Taxed, EUR (2021) | Tax Rate Range, % (2021) | Highest Tax Rate, % (2020) | Share of Income & Property Taxes in GDP, % | Membership of Trade Unions | Share of Social Democrats in Parliament | Collective Bargaining Agreements, OECD (2018) | |
|---|---|---|---|---|---|---|---|---|---|
| Effect (+/−) | − | − | − | − | − | − | − | − | |
| Stockholm | 1 | Progressive | 0 | 32–52% | 57.10% | 42.60% | 65.20% | 28.70% | 88.00% |
| Paris | 2 | Progressive | 10,083 | 10–45% | 45.00% | 45.10% | 10.80% | 7.80% | 98.00% |
| London | 3 | Progressive | 14,694 | 20–45% | 45.00% | 35.30% | 23.50% | 31.07% | 26.00% |
| Gothenburg | 7 | Progressive | 0 | 32–52% | 57.10% | 42.60% | 65.20% | 28.70% | 88.00% |
| Malmö | 9 | Progressive | 0 | 32–52% | 57.10% | 42.60% | 65.20% | 28.70% | 88.00% |
| Munich | 5 | Progressive | 9744 | 14–45% | 45.00% | 39.50% | 16.30% | 27.98% | 54.00% |
| Hamburg | 19 | Progressive | 9744 | 14–45% | 45.00% | 39.50% | 16.30% | 27.98% | 54.00% |
| Ranking | OECD Capital Status | Daily mean Temperature, Deg C (2020) | Share of Coal, % (2019) | Share of Renewables (2019) | Share of Trips Made by Walking Cycling and Public Transport | Recycling Rate (2020) | CO2 Tax, EUR (2021) | |
|---|---|---|---|---|---|---|---|---|
| Effect (+/−) | − | − | + | − | − | + | − | |
| Stockholm | 1 | Yes | 10 °C | 3.00% | 71.00% | 54.00% | 30.00% | 114.0 |
| Paris | 2 | Yes | 14.3 °C | 2.20% | 37.30% | 73.00% | 20.70% | 44.6 |
| London | 3 | Yes | 13.6 °C | 3.21% | 11.10% | 61.00% | 33.40% | 18.0 |
| Gothenburg | 7 | No | 10.25 °C | 0.23% | 52.25% | 46.30% | 34.00% | 114.0 |
| Malmö | 9 | No | 10.75 °C | 0.41% | 50.31% | 65.00% | 37.00% | 114.0 |
| Munich | 5 | No | 11.25 °C | 2.60% | 19.70% | 54.50% | 54.50% | 25.0 |
| Hamburg | 19 | No | 11.25 °C | 52.20% | 4.70% | 58.00% | 58.00% | 25.0 |
| Ranking | Petrol Price, Euro (2021) | Household Gas Price, EUR per kWh (2020) | Energy Tax per l of Fuel, EUR (2020) | Energy Imports, kt | Energy Exports, kt | Population Growth, % (2019) | Growth of Tax and Levy Component of Electricty Prices (2019 to 2020), % | Solar Power Potential (kWh/year, 2010) | Wind Power Potential (m/s*km2/year, 2010) | GRP per Capita, EUR | Hydro Share (2018) | Fossil Fuel Share (2018) | Nuclear Share (2018) | Share of Taxes and Levies in Electricity Prices (2020) | |
|---|---|---|---|---|---|---|---|---|---|---|---|---|---|---|---|
| Effect (+/−) | + | + | + | − | + | + | + | + | + | + | + | − | − | + | |
| Stockholm | 1 | 1.613 | 0.1167 | 0.620 | 780 | 3029 | 14.00% | 200% | 676.1–845.0 | 204.547–487.852 | 64,060 | 53.00% | 5% | 21% | 38.20% |
| Paris | 2 | 1.540 | 0.084 | 0.680 | 1341 | 6307 | 3.10% | 12.80% | 951.1–1113.1 | 79.181–204.546 | 94,832 | 12.40% | 7% | 71.70% | 34.40% |
| London | 3 | 1.552 | 0.050 | 0.650 | 2111 | 291 | 1.16% | −17.80% | 845.1–951.0 | 0–79.180 | 139,619 | 1.70% | 47.50% | 19.50% | 30.46% |
| Gothenburg | 7 | 1.613 | 0.1167 | 0.620 | 780 | 3029 | 10.00% | 200% | 951.1–1113.1 | 487.853–1031.076 | 45,074 | 38.94% | 0.97% | 40.94% | 38.20% |
| Malmö | 9 | 1.613 | 0.1167 | 0.620 | 780 | 3029 | 10.20% | 200% | 676.1–845.0 | 204.547–487.852 | 38,928 | 22.12% | 23.59% | 21.70% | 38.20% |
| Munich | 5 | 1.490 | 0.059 | 0.650 | 3450 | 6529 | 3.30% | 36.60% | 951.1–1113.1 | 79.181–204.546 | 71,348 | 1.00% | 88.10% | 0.00% | 53.01% |
| Hamburg | 19 | 1.490 | 0.059 | 0.650 | 3450 | 6529 | 3.10% | 36.60% | 676.1–845.0 | 0–79.180 | 59,929 | 0.00% | 63.10% | 12.30% | 53.01% |
| Ranking | CO2 Emissions from Traffic, mln t (2018) | Share of Coal, % (2019) | Share of Gas (2018) | CO2 Emissions from Domestic Fuel Burning, mln t (2019) | Cars per 1000 Inhabitants | Population (2021) | Green Space per Capita, m2 (2019) | Daily Mean Temperature, Deg C (2020) | Electric Cars (%, 2020) | Number of Underground Stations per mln Inhabitants (2021) | Journey Modal Share, Cars (2019) | Share of Trips Made by Walking Cycling and Public Transport | |
|---|---|---|---|---|---|---|---|---|---|---|---|---|---|
| Effect (+/−) | + | + | + | + | + | + | − | + | − | − | + | − | |
| Stockholm | 1 | 1.019 | 3.00% | 2.00% | 0.582 | 394 | 975,277 | 41.61 | 10 °C | 3.74% | 102 | 46.00% | 54.00% |
| Paris | 2 | 4.200 | 20.20% | 5.70% | 41.26 | 420 | 2,142,366 | 14.50 | 14.3 °C | 1.39% | 128 | 27.00% | 73.00% |
| London | 3 | 7.929 | 3.21% | 39.50% | 67.64 | 295 | 8,908,000 | 19.23 | 13.6 °C | 1.38% | 30 | 39.00% | 61.00% |
| Gothenburg | 7 | 0.511 | 0.23% | 0.55% | 0.682 | 469 | 583,684 | 45.26 | 10.25 °C | 3.74% | NA | 53.70% | 46.30% |
| Malmö | 9 | 0.267 | 0.41% | 23.04% | 0.582 | 479 | 348,601 | 46.37 | 10.75 °C | 3.74% | NA | 35.00% | 65.00% |
| Munich | 5 | ND | 2.60% | 22.90% | 89.76 | 586 | 1,560,000 | 21.98 | 11.25 °C | 1.23% | 102 | 45.50% | 54.50% |
| Hamburg | 19 | ND | 52.20% | 24.30% | 89.76 | 430 | 1,852,478 | 30.15 | 11.25 °C | 1.23% | 25.00 | 42.00% | 58.00% |
| Ranking | Urban Density, persons/km2 (Eurostat, 2019) | Median Age of Inhabitants (2020) | Ownership of the Waste Utility (2021) | Zero Waste Strategy | GRP per Capita, EUR | Tourist Visits (2018) | Tourist Visits (2021) | |
|---|---|---|---|---|---|---|---|---|
| Effect (+/−) | + | + | + | + | + | + | + | |
| Stockholm | 1 | 5012 | 39.4 | Public | Yes | 64,060 | 2,604,600 | 5,420,000 |
| Paris | 2 | 8600 | 38 | Public | Yes | 94,832 | 17,560,200 | 22,600,000 |
| London | 3 | 5598 | 35.6 | Public | Yes | 139,619 | 19,233,000 | 2,600,000 |
| Gothenburg | 7 | 1301 | 39.1 | Private | No | 45,074 | 5,250,000 | 3,880,000 |
| Malmö | 9 | 2183 | 38.5 | Public | No | 38,928 | 1,970,000 | 1,320,000 |
| Munich | 5 | 4767 | 41.6 | Public & Private | Yes | 71,348 | 4,066,600 | 3,110,000 |
| Hamburg | 19 | 2597 | 41 | Public | Yes | 59,929 | 7,600,000 | 3,300,000 |
| Ranking | Population (2021) | GRP per Capita, EUR | Altiude Above Sea Level, m | Annual Expenditure on Residential Household Use of 192 m3 of Water (2017) | Utility Ownership | Tourist Visits (2018) | Tourist Visits (2021) | |
|---|---|---|---|---|---|---|---|---|
| Effect (+/−) | + | + | − | − | + | + | + | |
| Stockholm | 1 | 975,277 | 64,060 | 19 | 588.22 | Public | 2,604,600 | 5,420,000 |
| Paris | 2 | 2,142,366 | 94,832 | 33 | 702.35 | Public | 17,560,200 | 22,600,000 |
| London | 3 | 8,908,000 | 139,619 | 77 | 623.54 | Private | 19,233,000 | 2,600,000 |
| Gothenburg | 7 | 583,684 | 45,074 | 49 | 664.69 | Public | 5,250,000 | 3,880,000 |
| Malmö | 9 | 348,601 | 38,928 | 12 | 657.13 | Public | 1,970,000 | 1,320,000 |
| Munich | 5 | 1,560,000 | 71,348 | 526 | 340.99 | Public | 4,066,600 | 3,110,000 |
| Hamburg | 19 | 1,852,478 | 59,929 | 25 | 768.00 | Public | 7,600,000 | 3,300,000 |
| Ranking | Urban Density, persons/km2 (Eurostat, 2019) | GRP per Capita, EUR | Share of Tertiary Graduates (2020) | Mandatory Recycling Ordinance | Share of Population with Access to Kerbside Recycling | Real Rate of Waste Processing (2018) | Waste Sent Abroad, t (2018) | Waste Sent Abroad to Non-OECD Countries (2018) | Support for Incineration | Tourist Visits (2018) | Tourist Visits (2021) | |
|---|---|---|---|---|---|---|---|---|---|---|---|---|
| Effect (+/−) | + | + | + | − | + | + | − | − | − | − | − | |
| Stockholm | 1 | 5012 | 64,060 | 53.00% | Mandatory | 100% | 99.30% | 384,942 | 886 | Supported | 2,604,600 | 5,420,000 |
| Paris | 2 | 8600 | 94,832 | 51.50% | Mandatory | 100% | 95.70% | 2,179,659 | 102,324 | Zero waste strategy | 17,560,200 | 22,600,000 |
| London | 3 | 5598 | 139,619 | 59.60% | Not mandatory | 100% | 80.00% | 4,778,419 | 623,535 | Strong opposition | 19,233,000 | 2,600,000 |
| Gothenburg | 7 | 1301 | 45,074 | 33.60% | Mandatory | 100% | 99.30% | 384,942 | 886 | Supported | 5,250,000 | 3,880,000 |
| Malmö | 9 | 2183 | 38,928 | 33.75% | Mandatory | 100% | 99.30% | 384,942 | 886 | Supported | 1,970,000 | 1,320,000 |
| Munich | 5 | 4767 | 71,348 | 40.50% | Mandatory | 100% | 69.44% | 4,034,167 | 13,222 | Limited | 4,066,600 | 3,110,000 |
| Hamburg | 19 | 2597 | 59,929 | 37.10% | Mandatory | 100% | 69.44% | 4,034,167 | 13,222 | Waste avoidance encouraged | 7,600,000 | 3,300,000 |
| Variable | Coefficient | Std.Error | t-Value | t-Prob | Part.R^2 |
|---|---|---|---|---|---|
| Constant | 15.2640 | 1.023 | 14.9 | 0.0000 | 0.7794 |
| Daily Mean Temperature | −0.234784 | 0.04427 | −5.30 | 0.0000 | 0.3087 |
| OECD Capital Status | −2.29855 | 0.6474 | −3.55 | 0.0007 | 0.1667 |
| Share of Renewables in the Energy Mix | −0.0376761 | 0.01115 | −3.38 | 0.0013 | 0.1534 |
| Share of Coal in the Energy Mix | 0.0486420 | 0.009920 | 4.90 | 0.0000 | 0.2762 |
| Share of Trips made by Walking, Cycling and Public Transport | −0.113082 | 0.01036 | −10.9 | 0.0000 | 0.6543 |
| Recycling Rate | 0.0692216 | 0.01286 | 5.38 | 0.0000 | 0.3150 |
| CO2 Tax | −0.0306765 | 0.01428 | −2.15 | 0.0355 | 0.0683 |
Disclaimer/Publisher’s Note: The statements, opinions and data contained in all publications are solely those of the individual author(s) and contributor(s) and not of MDPI and/or the editor(s). MDPI and/or the editor(s) disclaim responsibility for any injury to people or property resulting from any ideas, methods, instructions or products referred to in the content. |
© 2023 by the authors. Licensee MDPI, Basel, Switzerland. This article is an open access article distributed under the terms and conditions of the Creative Commons Attribution (CC BY) license (https://creativecommons.org/licenses/by/4.0/).
Share and Cite
Shmelev, S.E.; Lefievre, N.; Saadi, N.; Shmeleva, I.A. Interdisciplinary Linkages among Sustainability Dimensions in the Context of European Cities and Regions Research. Sustainability 2023, 15, 14738. https://doi.org/10.3390/su152014738
Shmelev SE, Lefievre N, Saadi N, Shmeleva IA. Interdisciplinary Linkages among Sustainability Dimensions in the Context of European Cities and Regions Research. Sustainability. 2023; 15(20):14738. https://doi.org/10.3390/su152014738
Chicago/Turabian StyleShmelev, Stanislav E., Nathan Lefievre, Nadim Saadi, and Irina A. Shmeleva. 2023. "Interdisciplinary Linkages among Sustainability Dimensions in the Context of European Cities and Regions Research" Sustainability 15, no. 20: 14738. https://doi.org/10.3390/su152014738
APA StyleShmelev, S. E., Lefievre, N., Saadi, N., & Shmeleva, I. A. (2023). Interdisciplinary Linkages among Sustainability Dimensions in the Context of European Cities and Regions Research. Sustainability, 15(20), 14738. https://doi.org/10.3390/su152014738