Article

Green Spaces in Urban Environments: Network Planning of Plant Species Composition

1
Institute of Design and Urban Studies, ITMO University, Kronverksky Prospect 49, 197101 St. Petersburg, Russia
2
Scientific Research Institute of Perspective Urban Development, Italiyanskaya Street 4, 197342 St. Petersburg, Russia
3
Sberbank, AI Lab, Department of Data Science, Vavilova Street 19, 117997 Moscow, Russia
*
Authors to whom correspondence should be addressed.
Sustainability 2023, 15(20), 14905; https://doi.org/10.3390/su152014905
Submission received: 1 June 2023 / Revised: 12 August 2023 / Accepted: 18 September 2023 / Published: 16 October 2023
(This article belongs to the Special Issue Smart and Sustainable Cities and Regions)

Abstract

:
The article deals with the problem of automation and decision-making support in forming sustainable assortments of plant species for landscaped areas of cities, taking into account environmental factors, conditions of growing, properties of plant species, and landscaping practices adopted in the region. The automation of plant species and composition planning for planted territories requires formation of a knowledge base and output algorithms, as well as consideration of specific landscaping practices and techniques adopted in the region. It also requires the application of new modeling methods in combination with methods of spatial analysis, which together with the database of available regional plant species forms a recommendation system and provides decision support in the tasks of landscaping for city planners. The feature of the proposed method based on network analysis is the combination and composition of plant species, as well as the properties of invasive species, which require the use of graph models to form a knowledge base. The proposed method can be useful for forming sustainable assortments of plant species for landscaping squares, boulevards, small courtyards in the city, technical areas and other cases that do not involve the creation of individual complex landscape design. As part of the testing of the proposed method, the authors have formed a unique information base of species. The use of such a database, together with the method of selecting the species composition based on their resistances and interspecies compatibility will ensure the expansion of the diversity of species in the created ecosystem, which will make green areas more resistant to external anthropogenic factors and diseases, as well as preventing the spread of species invasive to the region.

1. Introduction

The issue of urban greenery is traditionally relevant for the tasks of forming a comfortable urban environment and ensuring quality of life for citizens [1]. These phenomena become ever more relevant in the context of sustainable cities [2]. Volumetric indicators of the greenness of modern cities are taken into account in such global rankings as the City in Motion Index [3]. There are also a number of ratings dedicated to the direct greening of cities [4]. The amount of required landscaping is regulated by a set of rules, where there are requirements for the necessary green areas in urban planning [5]. All this can serve as proof of the importance of solving the problem of landscaping modern cities in the world. Green spaces in cities play an important role: they are designed to keep the city from overheating [6] and clean the air from exhaust gases [7,8], and they perform recreational functions, forming a green infrastructure [9,10]. A number of functions of green spaces, describing their contribution to the healthy functioning of the urban ecosystem, are called ecosystem services [11].
In addition to utilitarian functions, green spaces play an important role in the formation of urban identity, creating an emotional connection between people and the city [12]. In large cities, there is an interaction of artificial and natural environments, so it is necessary to balance both sides directing landscape design in the urban structure [13]. In the end, the landscaped areas of the city act as a place where a person living in an urbanized environment can get in touch with the living natural environment, observe its seasonal transformations and correlate them with their own lives. In particular, therefore, the issues of urban greening form one of the main trends of modern urbanism [1,6]. The urban environment is most often aggressive for plants due to changes in the properties and composition of soils, microclimatic changes and factors of external environmental impact. Plants in the urban landscape weaken, becoming vulnerable to attacks of entomophages and phytopathological diseases, which in general affects the green appearance of the city. Moreover, for historical reasons, the species composition of urban greenery for many cities has changed, and includes many invasive species. All these features require careful planning when choosing the species composition of plants for landscaping urban areas. However, species composition planning is not carried out for a large number of landscaped areas due to their small scale. This applies to a lot of small areas, technical planting areas, small squares, barrier planting areas, and other similar areas, which, however, can form up to 80 percent of all the greenery in the city. The situation is exacerbated by the economic factor, which includes the cost of planting, maintenance and removal of plants [14], which for the above green areas are not produced. This leads to the spontaneous landscaping of large—in proportion—areas of the city: sometimes the formation of wasteland, sometimes a natural reduction in the area of green spaces. Thus, the aim of this work is to create a method and technology of decision support for the formation of sustainable combinations of plant species, taking into account the characteristics of their growth and the presence of external influences, as well as the combination of species, to automate the planning of species composition of plants. The method does not take into account the spatial proximity of individual plants to ensure its accessibility across different cities and management systems. Collecting these types of data for all potential green space sites is extremely resource-intensive. To avoid the need to use these data, the method calculates species interactions based on the most radical neighborhood scenario. We expect that the application of the method proposed in the article will reduce the cost of small and not unique or iconic areas to be landscaped. And the resulting assortments of plant species, if planted, will be sustainable and economically profitable for the city, and for the residents, it will allow for the decoration of the urban environment and will make interaction with it more pleasant.
This paper is further organized as follows. Section 2 contains a literature review with existing studies and methods in this and adjacent fields, Section 3 describes the process of plant species composition modeling and Section 4 presents the results of the algorithm application in two locations in Saint Petersburg, Russia.

2. Literature Review

Planning the plant species composition is one of the stages in the overall process of urban greening aimed at creating and controlling the condition and maintenance of urban green spaces. The quality of plant species selection in the planning phase determines the efficiency and cost-effectiveness, and sometimes the feasibility, of all subsequent work in the urban greening process. The units of control in the process of urban greening are green spaces. Green spaces are understood as a set of woody, shrubby and herbaceous plants in a particular area [15]. Each element performs its functions, and together, they form a biosystem, where much depends on their relationship and mutual arrangement.

2.1. The Challenges of Urban Green Spaces

Today’s demands on urban green spaces are increasing, and the conditions are becoming more severe, leading to changes in species composition planning processes around the world [16]. The creation of sustainable green spaces involves the use of plant species capable of functioning as designed, even under the stressful conditions of the urbanized environment. Stressful conditions in urban environments are mainly related to anthropogenic influences on plant growth and development; conditions may include general climate change or specific changes in soil salinity in a particular area. Urban green spaces require regular maintenance, the complexity and cost of which are largely determined by the assortment of plants chosen. As a rule, the assortment of urban plantings is divided into three categories: basic, additional and limited-use [17]. Examples of assortments by category are shown in Figure 1. The basic assortment includes trees and shrubs that make up the bulk of urban greenery. They withstand urban conditions well and do not require complex care. They can be used in street plantings and sanitary protection zones, and make up the main green mass on the objects. However, they are usually plants of medium ornamentality, and objects landscaped only with them will be rather monotonous.
Plants of the additional assortment are more ornamental and a little more fastidious than those of the main assortment. Often, these are introduced plants that have shown their resistance in the given environmental conditions. Plants of the limited assortment are difficult to care for, and are extremely demanding to environmental conditions. Trees and shrubs of limited assortment are used on territories protected from loads: inside parks, squares, in intra-quarter landscaping. Their use is justified due to their increased decorative qualities, which give almost unlimited opportunities for gardening. Basically, plants of limited assortment are divided into two categories: introductions and varieties. Sort plants are distinguished by their special decorative properties: a different color of foliage, habitus or shape and color of the flower from the species. Usually, such plants are used to create an accent in a composition. Costs of care and maintenance of green spaces are determined by the presence in the assortment of plants of limited or additional assortment, as well as the need to relocate plants over long distances.

2.2. Factors in the Formation of the Assortment of Plant Species for the City

The process of forming assortments of plants for use in urban areas must take into account many factors, among which the most important are ecological and biological factors, compositional factors and factors of combination of plant species.
One of the factors affecting plant viability is the relationship of plants to atmospheric pollution of PM 1 0 and CO2. Plants are actually absorbing CO2 and capturing air pollution in the form of PM 1 0 making the air cleaner and people healthier. The carbon uptake by different plant species depends on many environmental factors and the health of the plant itself. In urban areas where other depressing factors exist, uptake rates can vary greatly. In the most extensive in vitro study on the subject, 120 native and invasive species were selected for comparison in terms of carbon uptake by leaf laminae [18].
Ecological and biological factors include:
(a)
Type of climate and its corresponding temperatures, degree of moisture and prevailing types of air masses [19], which are habitual for the plant species. There are several options for defining climate zones. In addition to geography, the division of countries into regions, for each of which an assortment is defined, is taken into account for the planning of green spaces. In ornamental horticulture is also actively used the system USDA (United States Agriculture Department), where the division into climatic zones is tied to the minimum winter temperature [20].
(b)
Soil type. Anthropogenic factors are decisive for soil formation in urban areas. So, despite the fact that each city by its geographical location belongs to a certain climatic zone with a characteristic soil type, there is no possibility of using characteristic trees and shrubs. Urban soils are divided into three groups: natural undisturbed, natural disturbed and artificially created urban soils [21]. Due to the extremely small proportion of undisturbed soils on urban sites, in this research, we will consider artificially created urban soils, evaluated on the following parameters: acidity, fertility and soil type. The main sources of contamination of urban soils are roads, so plants resistant to soil contamination, as well as resistant to overconsolidation formed by constant vibration, are required for planting on adjacent sites.
(c)
Relation to light. According to their need for sunlight, plants are divided into conditional groups: heliophytes (light-loving) and sociophytes (shade-tolerant). Between them, sociogeliophytes are distinguished, by which they tolerate partial shading and can withstand untypical light regimes without harm. Lighting requirements may change with plants’ age as well as throughout the year. In groups of plants, this determines the distribution of species by tier as well as by light sides [22].
(d)
Relation to moisture. Plants can be classified according to their water requirements into the following categories: demanding plants (hygrophytes), which in natural conditions grow in excessively humid soils; moderately demanding (mesophytes), which grow in sufficiently humid places; and low-demanding (xerophytes), which prefer dry areas and can tolerate prolonged drought. According to limiting factors, plants are evaluated as resistant to temporary waterlogging and temporary soil desiccation.
(e)
Wind resistance. There are wind-tolerant plants, which are able to grow in open leeward spaces and are moderately resistant; and low-wind-tolerant, which are unable to grow in windy conditions due to the characteristics of the root system and wood.
(f)
Dust and gas resistance. Relation to air pollution PM 1 0 and greenhouse gasses, e.g., CO2. Tree and shrub plants are generally divided into three categories in relation to air pollution: resistant, moderately resistant and unstable [23]. For urban sites, depending on the adjacency of roads with different loads, different types are required: at the boundary with the main multi-lane streets is required the use of exceptionally resistant species that are able to function safely and protect less resistant plants. As you move further away from the source of pollution, there is an opportunity to use more vulnerable species.
(g)
Disease resistance. Today, in the active international trade in tree and shrub seedlings, many new varieties are being introduced on city streets, but pests or fungal disease spores can also be carried along with them. Pathogens can also persist in the soil and in existing plantings. Disease control primarily requires the avoidance of single-species stands, timely mowing, and the use of “disease-resistant” varieties. Unfortunately, no species is resistant to all diseases, but you can select varieties that are resistant to already identified diseases.
(h)
Height of the plant, which can be regulated by both urban planning regulations [5] and the location of plants in the green space, to obtain the required level of insolation.
(i)
The diameter of the crown and root system. The size of the root system turns out to be the main limiting factor for the selection of plants in outdoor plantings and a secondary one for gardens and public gardens. Since the soil in the street is seriously compacted due to vibration and pressure, new plantings are actually forced to limit the growth of their root system to the diameter of the planting hole. For this reason, plants with a compact root system and correspondingly compact crowns are recommended for street planting.
Compositional factors include:
(a)
Decorativeness. Despite the artistic and compositional value of all plants in the urban environment, they can also be divided into more or less decorative. According to ornamentality, plants can be divided into three main categories: basic—having a green coloring of leaves, as well as flowers and fruits; decorative— having bright coloring of leaves, as well as flowers, fruits, shaped leaves and fragrances; and strongly decorative—combining several features of ornamentality. Depending on the degree of human contact with plantings, plants with different ornamental qualities are used in different plantings. In the garden, basic plants; for the outer perimeter, ornamental for most of the plantings and strongly decorative next to paths and composition nodes; in the square and boulevard, basic and decorative.
(b)
Role in urban composition. The main types of organization of tree and shrub vegetation on the site include tree arrays; groups of trees and shrubs; solitary plants (solitaries); alleys; bossets and hedges; elements of vertical landscaping; street plantings; lawns; and flower compositions. In world practice, there are trends towards the use of complexly composed tree and shrub groups on city streets, which allow for the diversification of the urban environment [24].

2.2.1. Factors of Interrelationship and Combination of Plant Species

When forming assortments of plant species for landscaping areas, the presence of related parameters and plant species should be taken into account. Plant species interrelationships can limit the choice of plant species due to the impossibility of planting some species together. Among the most significant factors of plant species interrelationships are the following:
(a)
Growing conditions. The basic basis for combining plant species into groups is the identical growing conditions of plants, which are expressed in similar requirements for soil composition, climate, light and moisture [25].
(b)
The conditions of the combination of plant species due to the peculiarities of the joint growth of plants, which can be characterized by competition for resources or the successful coexistence of species. For example, certain plants cannot exist close to each other, while others increase their resistance to disease. This phenomenon is called allelopathy [26], a property of some organisms to secrete chemical compounds that inhibit or suppress the development of others. Allelopathy is also sometimes understood as both negative and positive interactions between plants in phytocenoses. Disease of plant species by diseases, viruses and pathogens depends mainly on the state of plant “immunity”, but we cannot exclude the factor of epidemics and wave pandemics, the development and spread of which is worth studying, supplementing the matrix of plant species interaction. For example, the spread of Elm borer, which as a pest is not at all dangerous to elm, but as a vector of fungal disease—Dutch elm disease—has destroyed by wave spread the entire middle belt of Russia and is spreading the disease already in Karelia [27].
(c)
Features of the accepted practices of landscaping in the region, in accordance with which in the city can be developed precedents for combinations of plant species, well proven in similar conditions.
(d)
Compositional features due to the intended function of planting. So, for ornamental purposes, there are stable combinations of species that proved themselves well. It should be noted that the above factors are interdependent, and this should be taken into account in the planning of plant assortments. For example, ecologo-biological factors are most often related to compositional factors due to the fact that ornamental properties are lower in more hardy plants. In particular, plants adapted to life with low light need less care: moisture evaporates more slowly, and they need fewer nutrients and grow more slowly. They are less likely to have bright, lush colors than light-loving plants.

2.2.2. Factors of Species Invasiveness

Invasiveness of species is a consequence of plant introduction in urban landscaping. There is a classification of invasive plant species according to the status of invasive impact on native vegetation species [28].
(a)
Transformers—actively invade natural and semi-natural communities; plants change their appearance and disrupt successional relationships.
(b)
Non-native—actively settling and naturalizing in disturbed semi-natural and natural habitats.
(c)
Species that disperse and naturalize in disturbed habitats—during further naturalization, some of them may establish themselves in natural and semi-natural plant communities.
(d)
Potentially invasive species—capable of regenerating in introduced habitats and have shown themselves to be invasive species in adjacent regions. There are many problem areas where cultivated species are impossible or extremely laborious, and the need and necessity for greening is high. Invasive species can act as a tool to increase the volumetric indicators of greening the territory [29,30].

2.3. Methods for Modeling Plant Species Composition for Green Spaces

Existing approaches to modeling the species composition of plants can be conventionally divided into groups of methods devoted to explaining the existing trends in the formation of plant communities in the areas under study, identifying factors and predicting the dynamics of the state of green spaces. The first group of methods may include works aimed at identifying the factors determining the formation of plant compositions. For example, in a study by Godefroyd [31], it was found that the natural composition of species in green spaces in urban areas is significantly influenced by the type and density of buildings. The authors point out that studies of urban ecology need to identify separate variables for each type of anthropogenic influence without reducing them to a single parameter. Another article identified attributes affecting the distribution of species in Portland parks [32]. Also, based on the analysis of species in parks in Taiwan [33], the authors noted that despite the primary role of landscape architects in the composition of species, artificial landscaping of an urban park will be the basis for the natural processes of its development.

2.4. Network Analysis

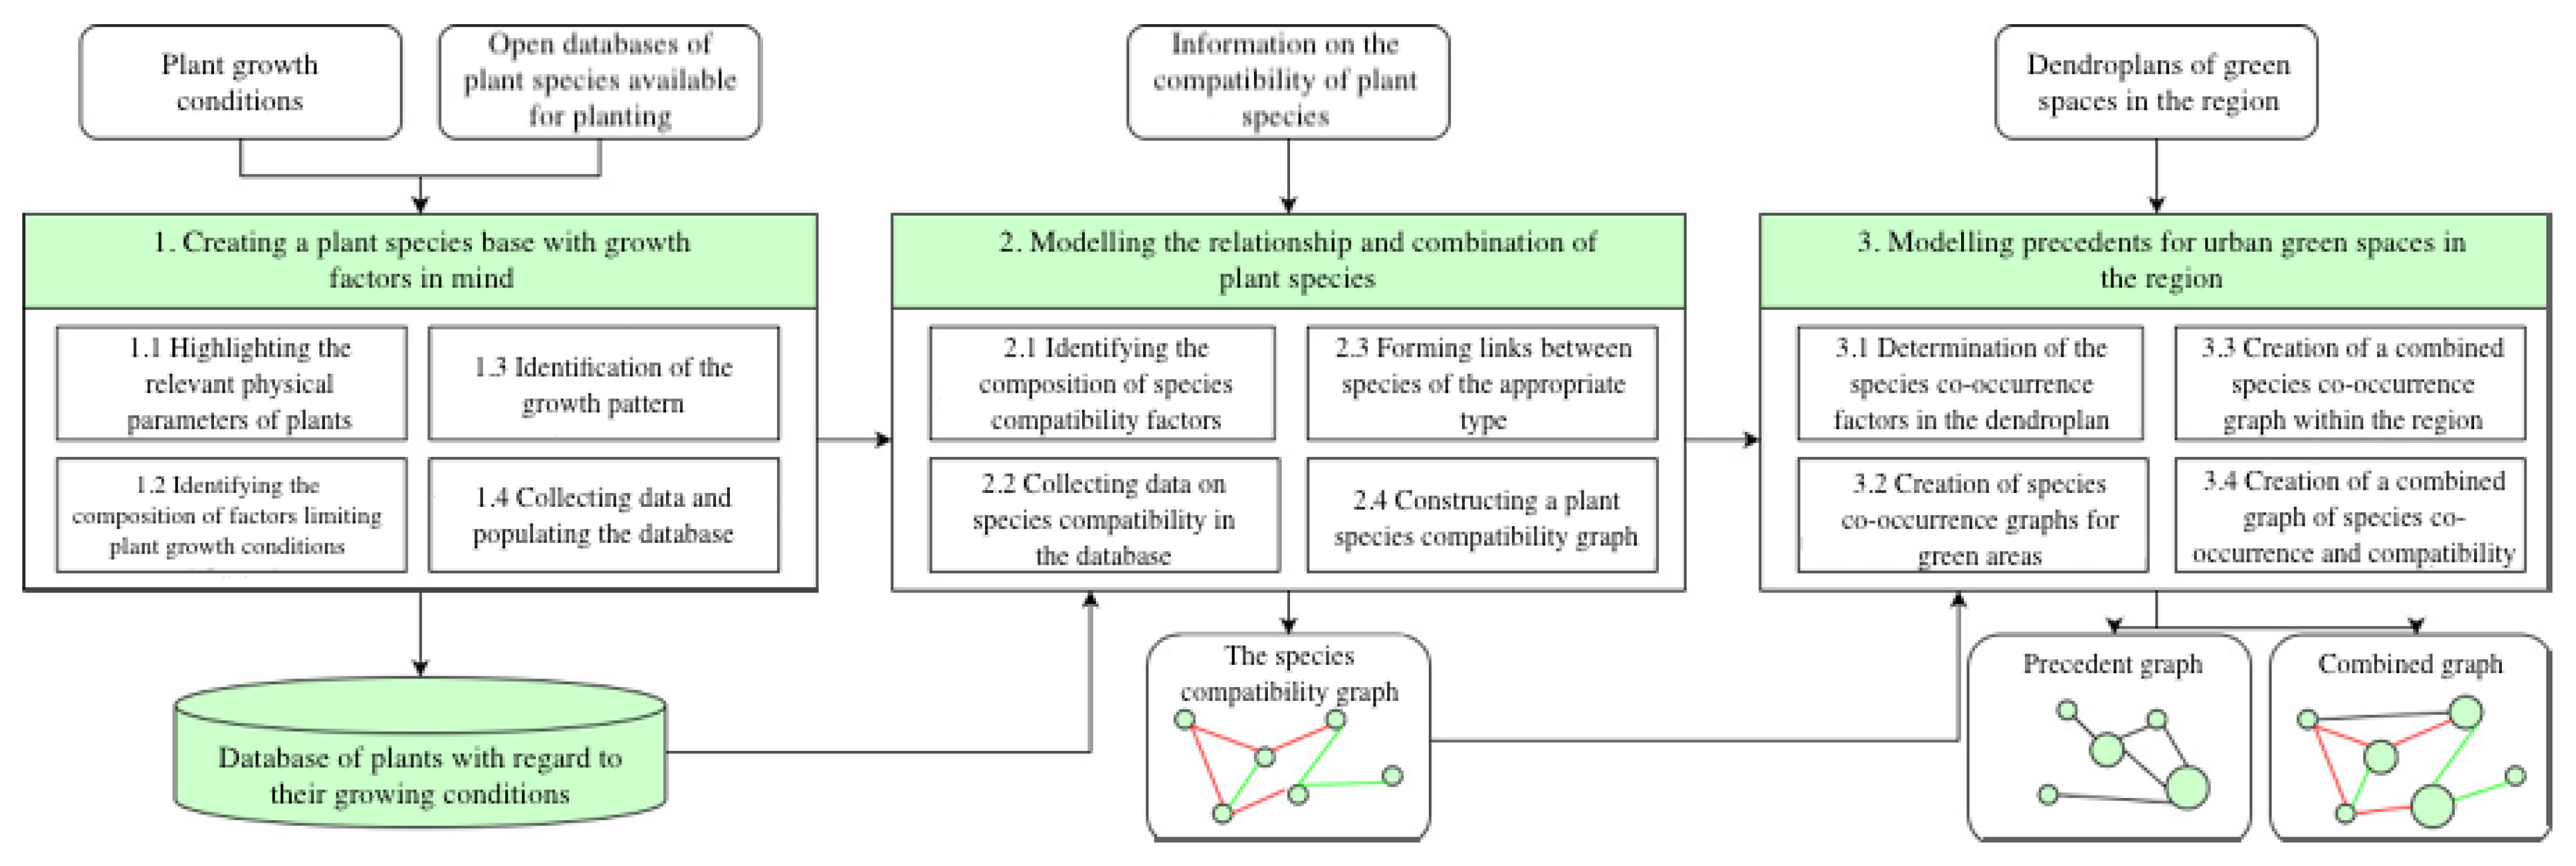
This group of methods uses a variety of spatial modeling and data analysis apparatus, the application of which is conditioned by the data and the applied problem to be solved. Ramirez [34] pointed out that network analysis is a suitable tool for studying and describing ecological communities, allowing us to consider factors from the individual level to the level of the entire ecosystem [35]. The method of network analysis is currently widely used in both natural and social sciences [36]. In a study [37], network analysis based on an empirical observation base was also used to determine the neighborhood patterns of different microbial communities in soil. Separately, the application of the null network models of species should be noted as a way to identify the factors affecting their distribution and composition. In particular, in one study [38], an attempt was made to identify cases of symbiotic interaction between fungi and plants based on the predicted neighborhood. In a model defined by environmental characteristics, the probability of species in an area was calculated based on the presence of organic materials in the soil and its acidity. Such models were also used to determine the prevalence of different types of plant species interactions [39]. In this case, the relationships in the graph were directional, which reflected the nature of the interaction (e.g., competitiveness). In addition, network analysis also allows one to display mutually beneficial relationships [40]. In this and other [41] works, the main properties of networks are nestedness, modularity and connectivity. Also, network analysis allows one to trace the influence of abiotic, biotic and interspecific factors on the formation of compositions [42]. In particular, filtering by environmental factors, facilitation of certain species in the presence of their pollinators, and exclusion of species from the composition as a result of competition are named as the three main processes of formation. Boolean networks are used to model such processes [43]. However, when applying network analysis to empirical data, the possible incompleteness of the observed species should be taken into account in order to avoid distortions in the conclusions [44]. A separate direction of the application of graphs in the study of species compositions, as well as in support of decision making on their composition, is knowledge networks. Facts about species and their interrelations are determined by experts and compiled into a network. An example of such a method is presented in Singh’s study [45]. Thus, the use of network models to study the vegetation dynamics of green spaces is generally accepted. In our work, we will also follow this approach, applying it to the task of planning plant species assortments for landscaping areas under specified conditions. The solution of this problem will include two parts: modeling plant species, the purpose of which is to form a knowledge base of plant species composition taking into account their growth factors Figure 2; and planning plant species composition for a given territory, the purpose of which is to form stable assortments of species for a specific landscaping area based on the previously formed knowledge base.

3. Plant Species Composition Modeling

Modeling of plant species composition aims to form a base of plant species, taking into account the conditions and factors of growth, which will serve as an information base in the tasks of planning plant assortments for specific areas to be landscaped. The procedure of plant species composition modeling includes a number of steps illustrated in Figure 2.

3.1. Creating a Base of Plant Species, Taking into Account the Factors of Growth

The first stage involves the creation of a database of plant species, taking into account the conditions of growth and allowing for the formation of an assortment of woody and herbaceous plants for landscaping urban spaces. The authors have allocated four groups of parameters (displayed in Table 1) determining the adaptability of the plant in certain environmental conditions that are the most important parameters for plant growth. 1. Physical parameters of plants, determined to take into account the location of the plant in the spatial structure. They include indicators of the average height of the plant and the average diameter of the crown in the mature state. 2. Limiting factors or environmental parameters that can inhibit certain plant species. The list of limiting factors is formed based on the analysis of the factors mentioned in Section 2.2. By identifying the attitude of plants to each of the parameters, it will be possible to select resistant species to the difficult conditions of the specific territory. 3. Soil parameters. Nutrient composition for the best growth of each plant allows the result to recommend a preferred planting soil when planting in a particular area. Plants respond to soil mechanical composition, acidity and fertility. 4. Parameters of the intensity of spreading, characterizing the ability of species to regenerate and actively reproduce unpretentious life. It is determined to understand the amount of planting material required, survival in areas of possible damage, and forced intentional damage—molding—thereby affecting the ornamental component. It takes into account the aggressiveness of development, the degree of survivability and whether the species is invasive. With the right application, it will allow one to achieve landscaping in adverse conditions.
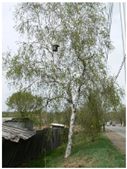
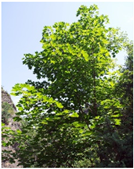
To illustrate, here is an example of filling the database for four plant species: see Table 2. The selection of these tree species representatives is based on their typical and natural growth with the possibility of forming extensive population communities in the conditions of the study area of the city of St. Petersburg and north-western Russia.
The list of plants is based on the Plantarium Atlas [46]. The Latin names were checked on the World Flora Online website [47]. The main sources for filling the database are the websites of ornamental plant nurseries [48,49,50]. At present, the database contains 537 plant species, of which 225 are woody plants and 195 shrubs. The database is available at [51]. On the basis of the generated base, it is possible to determine sustainable plant species for given growing conditions, which can be quite extensive for individual areas.

3.2. Modeling Plant Species Interrelationships and Combinations

The second step involves taking into account the factors of plant species compatibility in order to then identify sustainable plant assortments.
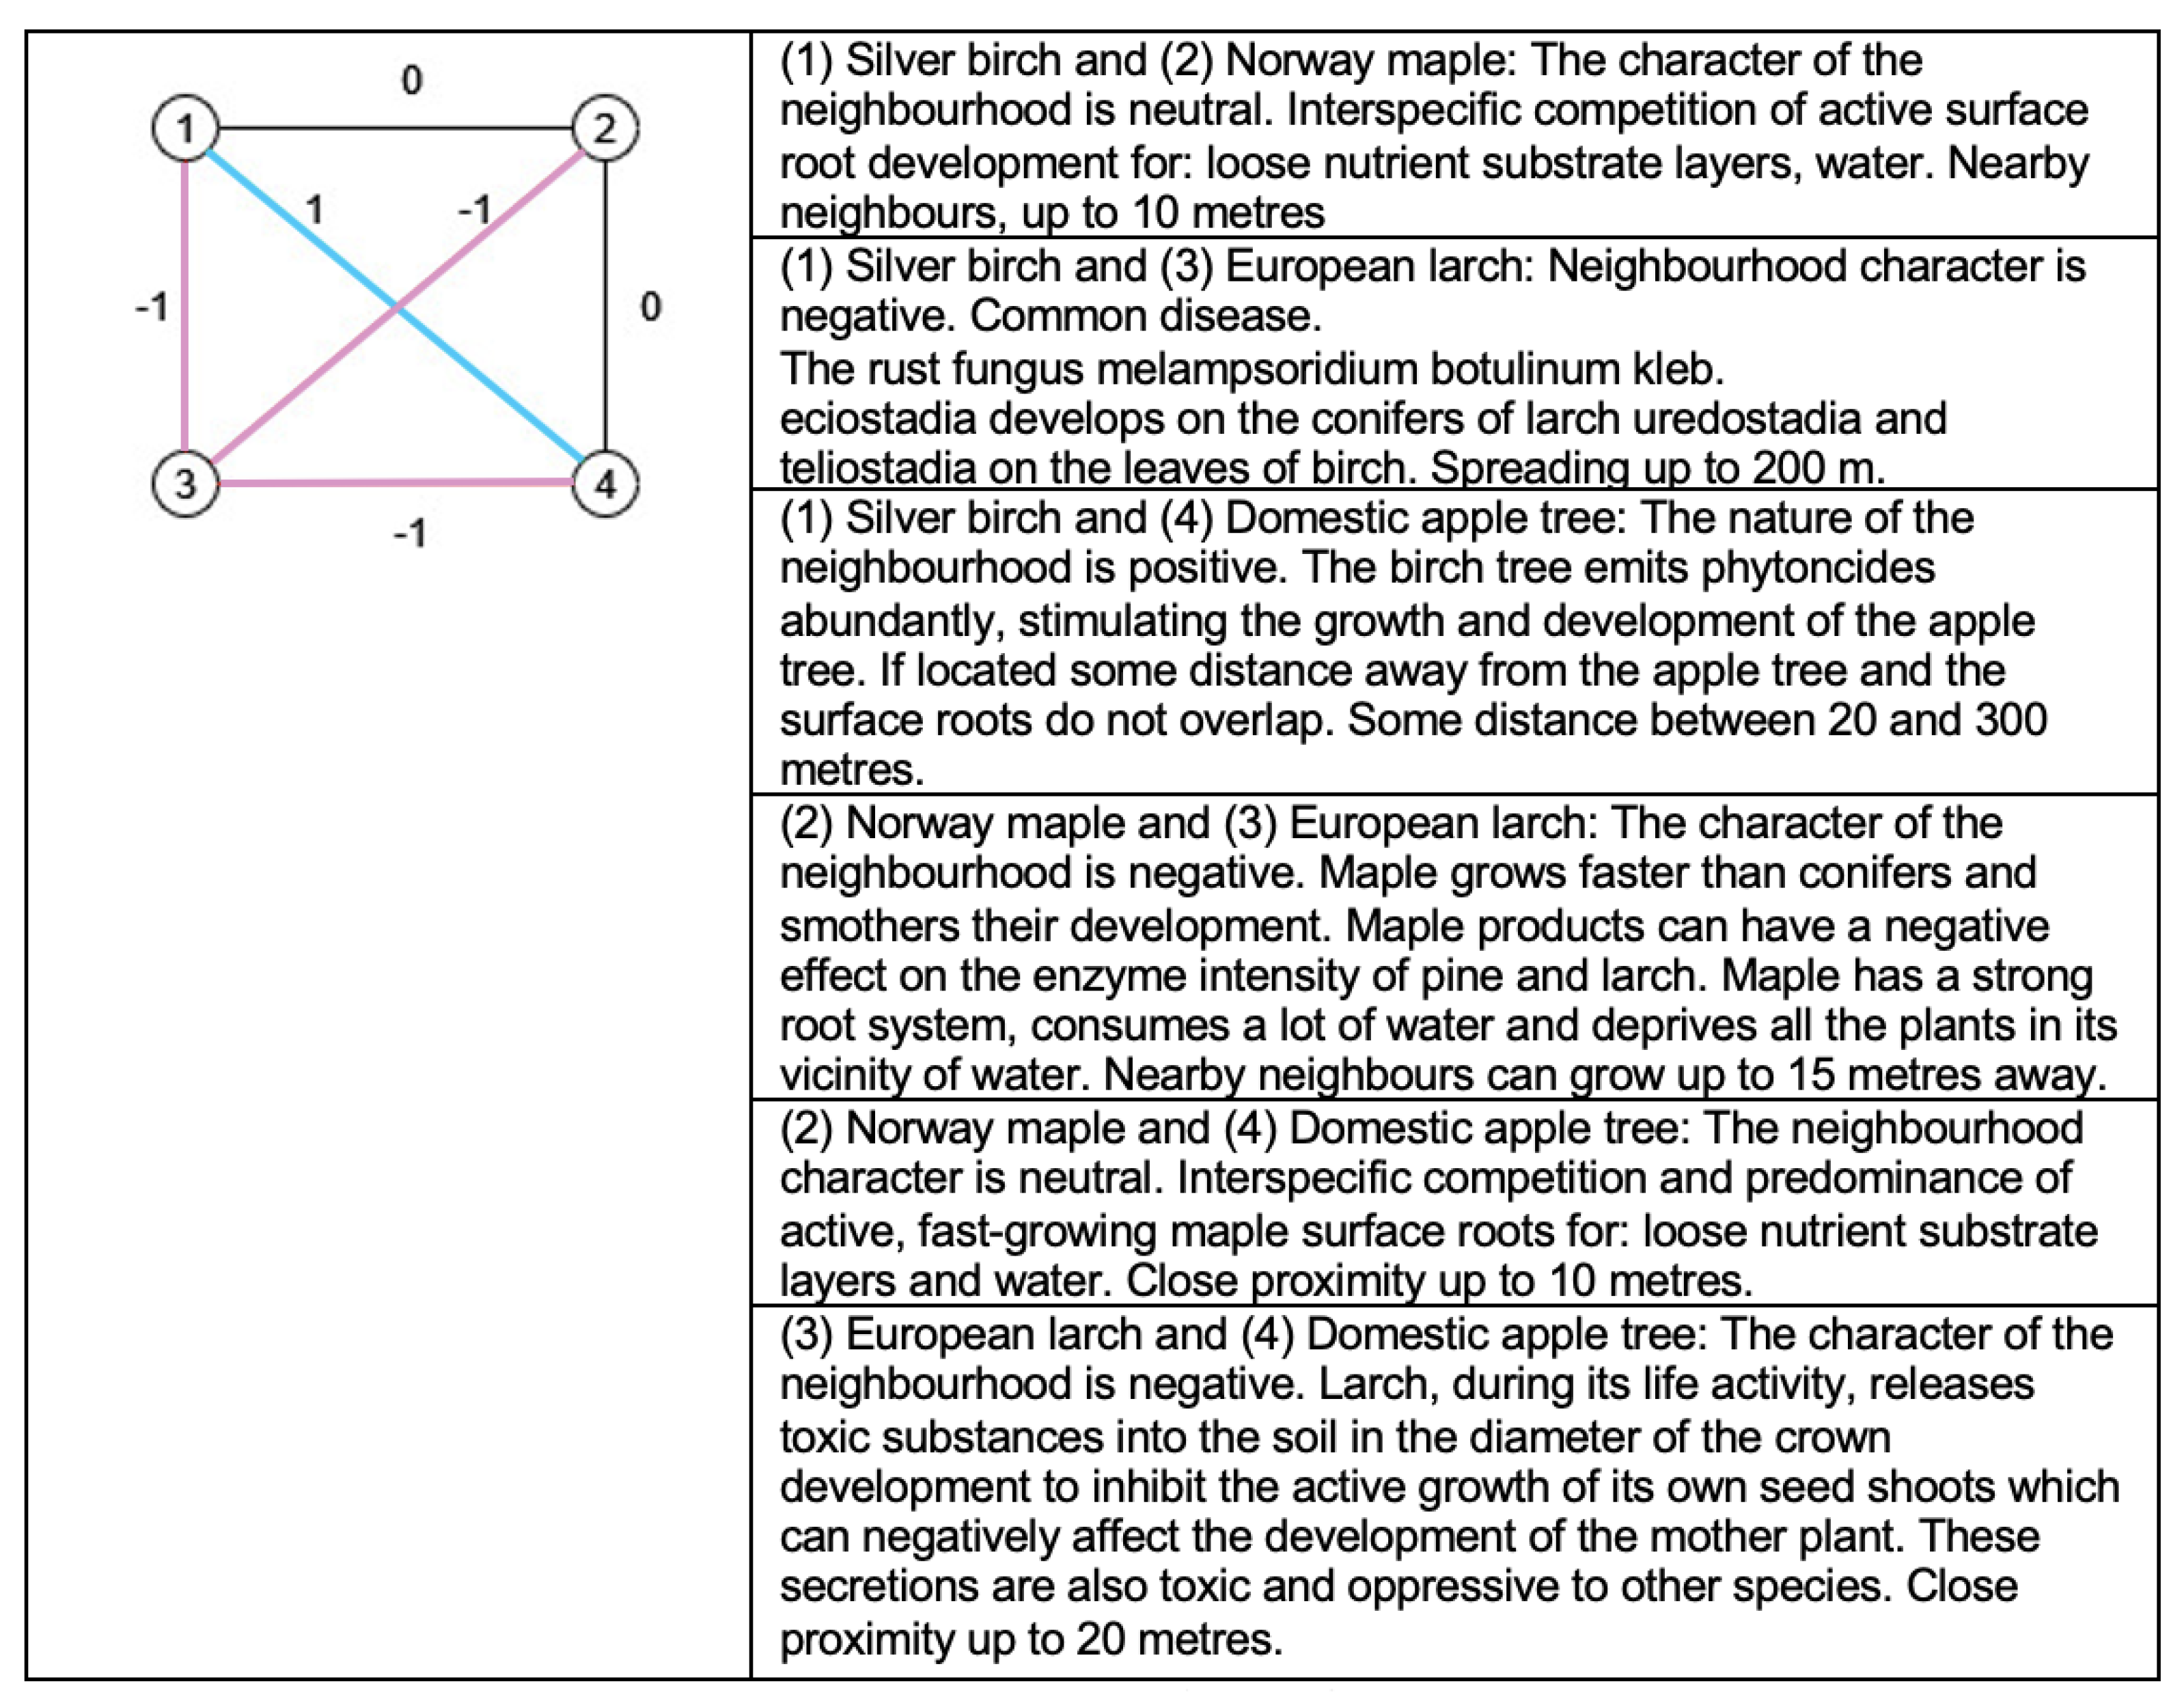
The interactions of four plant species growing in similar natural–climatic and soil–soil conditions are presented. Approximate distances of the distribution of plant influences on each other, depending on individual plant parameters and environmental conditions, are presented. In modeling the factors of mutual influence of plant species, it should be taken into account that for each pair of plant species, it is possible to determine the value of influence and combinability parameters, which can be of the following types: (a) directed positive impact, characterizing the improvement of the plant properties of the respective species in the zone of influence; (b) a directed negative impact, characterizing the oppression of the plants of the respective species in the zone of influence. Obviously, the modeling needs to take into account the zone of influence parameter for each “active” plant species. The modeling of plant species combinations is non-directional and reflects the availability of good practices of co-locating plants of the respective species for compositional or functional purposes. The modeling of the relationship and combination of plant species is performed by forming a matrix of relationship and combination of plant species, a fragment of which is shown in Figure 3.
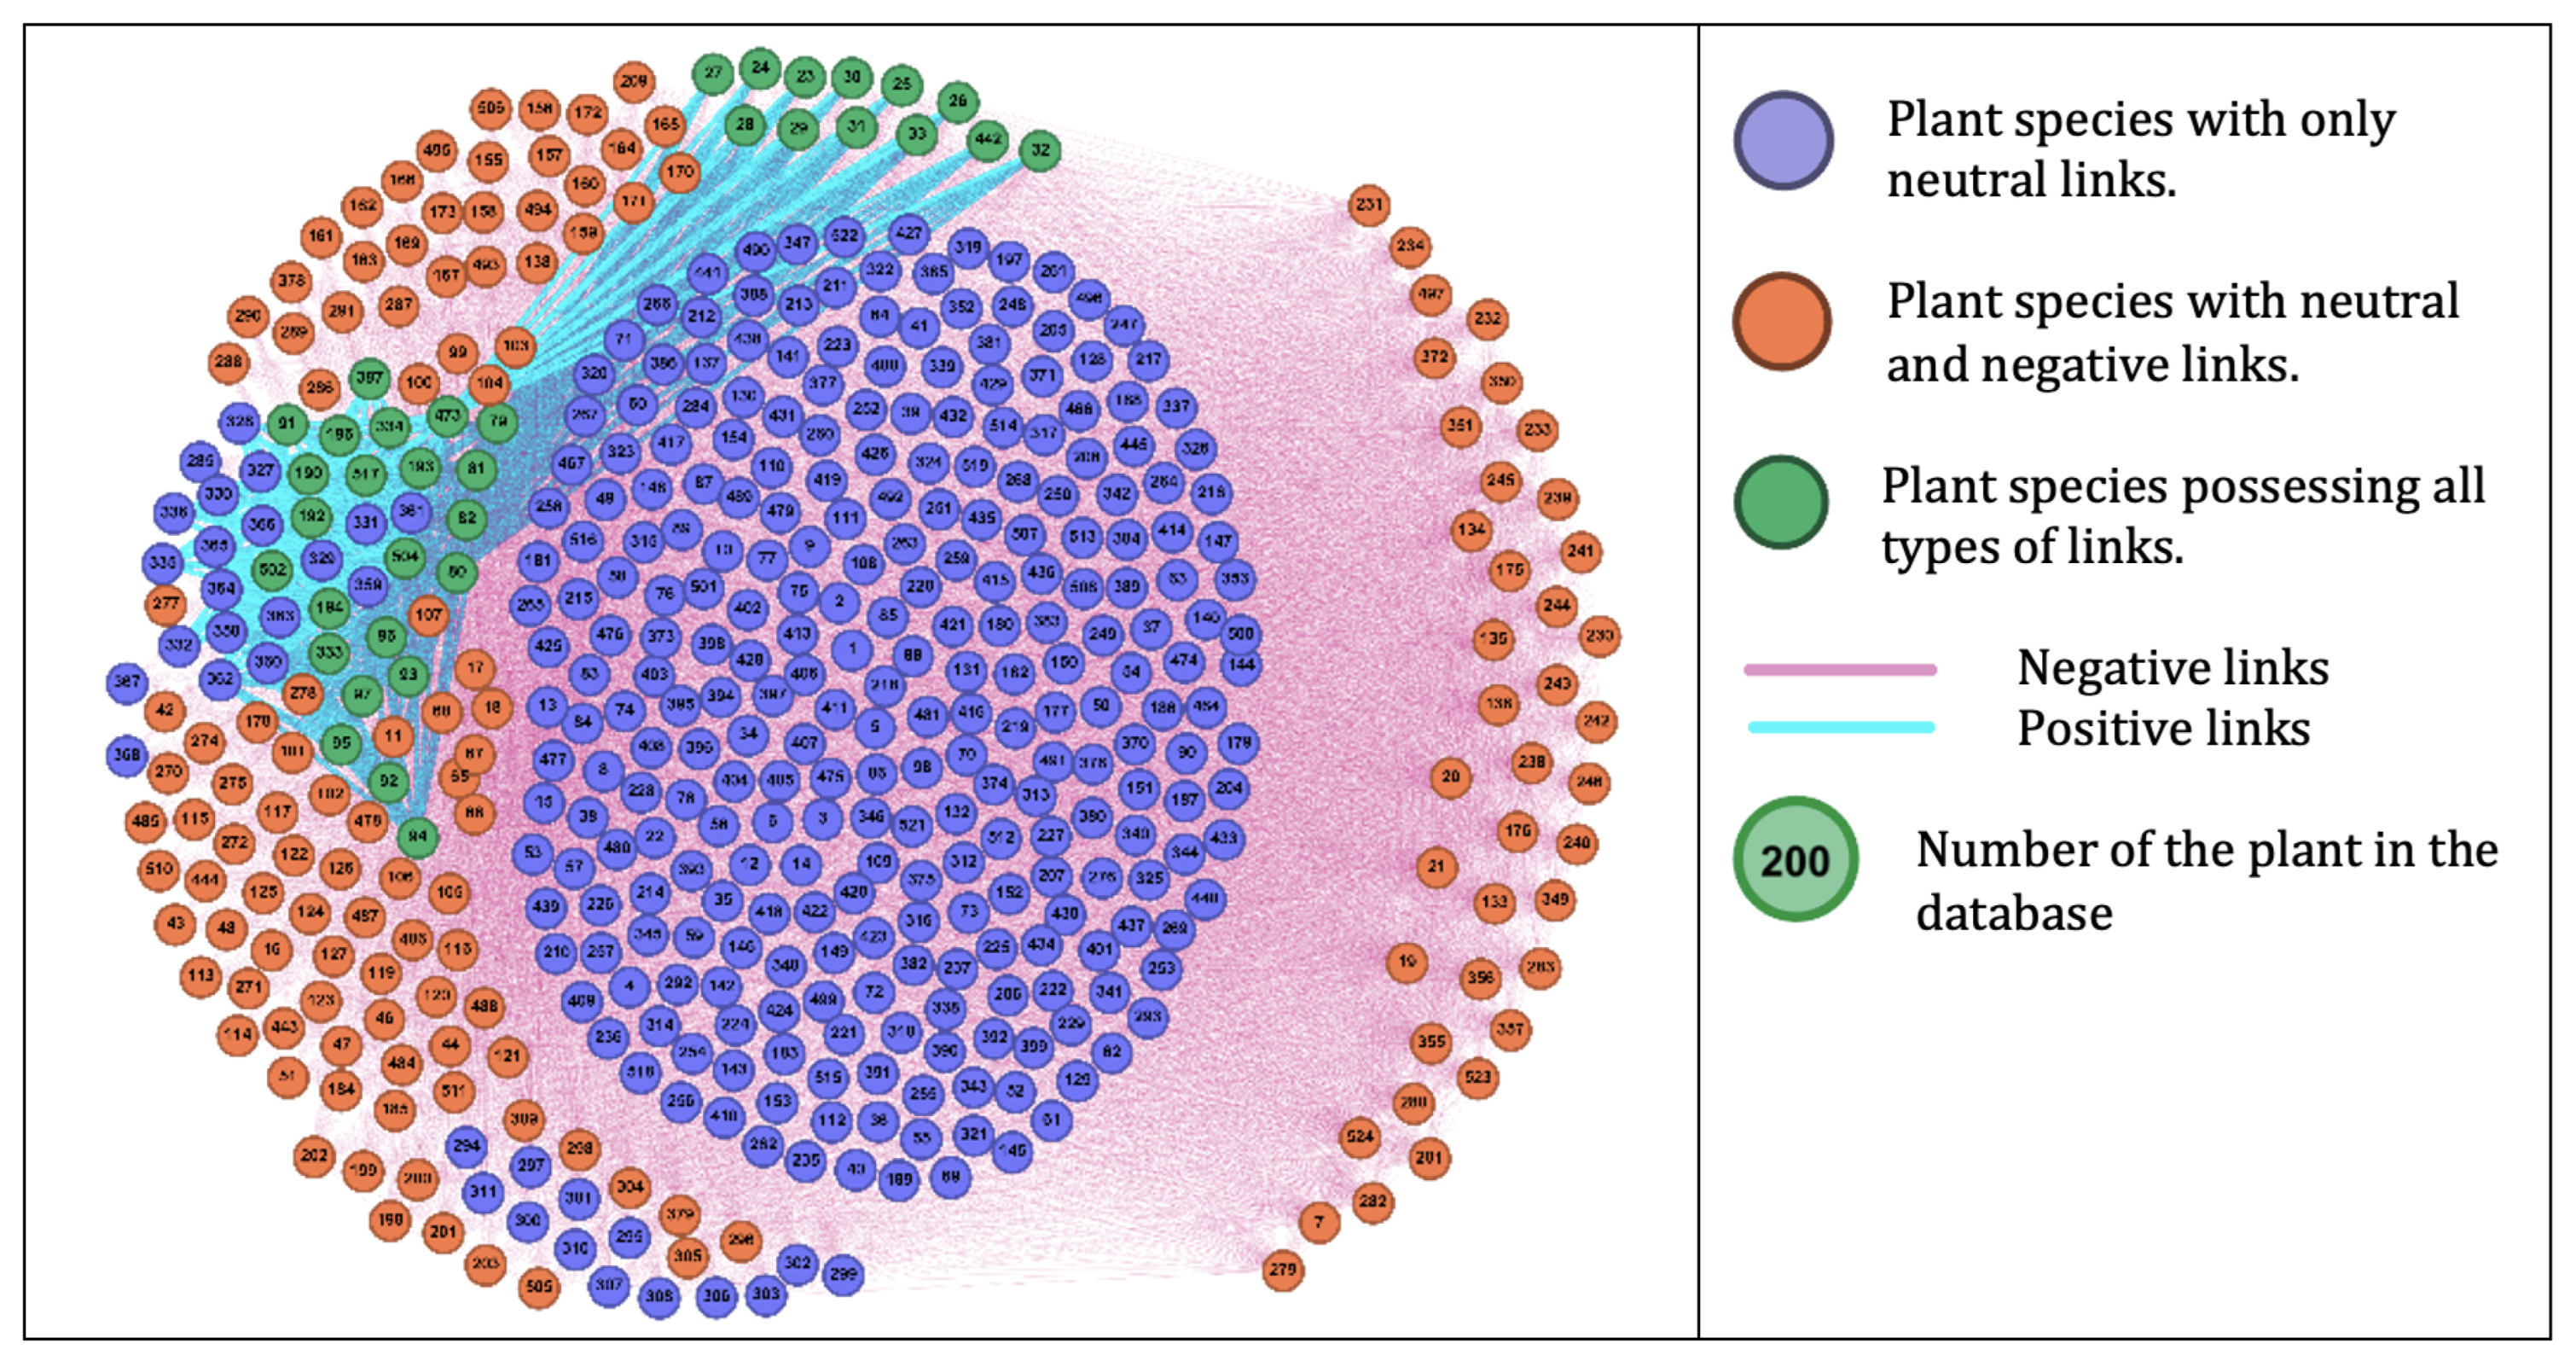
A model of the relationship and combination of species is a graph in which the vertices are plant species and the edges are the links between the types. For the plant species shown in Figure 4, this graph is as shown in Figure 3. Figure 3 shows that the relationships depend on the characteristics of a particular pair of plant species. For example, the birch has both positive and negative and neutral relationships. Negative relationships may be characteristic of particular plant species, for example, European larch has only negative relationships, which is determined by the peculiarities of the development of particular species. The complete graph for all plant species in the database provided in the PlantCompositionPlanning is shown in Figure 4.
Three main groups of plant species can be visually identified in Figure 4: the group on the left of the freestanding species, which have predominantly negative links with other species; the group at the center of the group of plant species with neutral linkages; and the group on the right of the mixed plant species, which includes species with both positive links and negative links, but with proportionally fewer of them compared to neutral links. It can be seen that models of the relationships and combinations of plant species can be quite complex, but it makes it possible to form stable plant assortments for given growing conditions.

3.3. Modeling Urban Greening Precedents in the Region

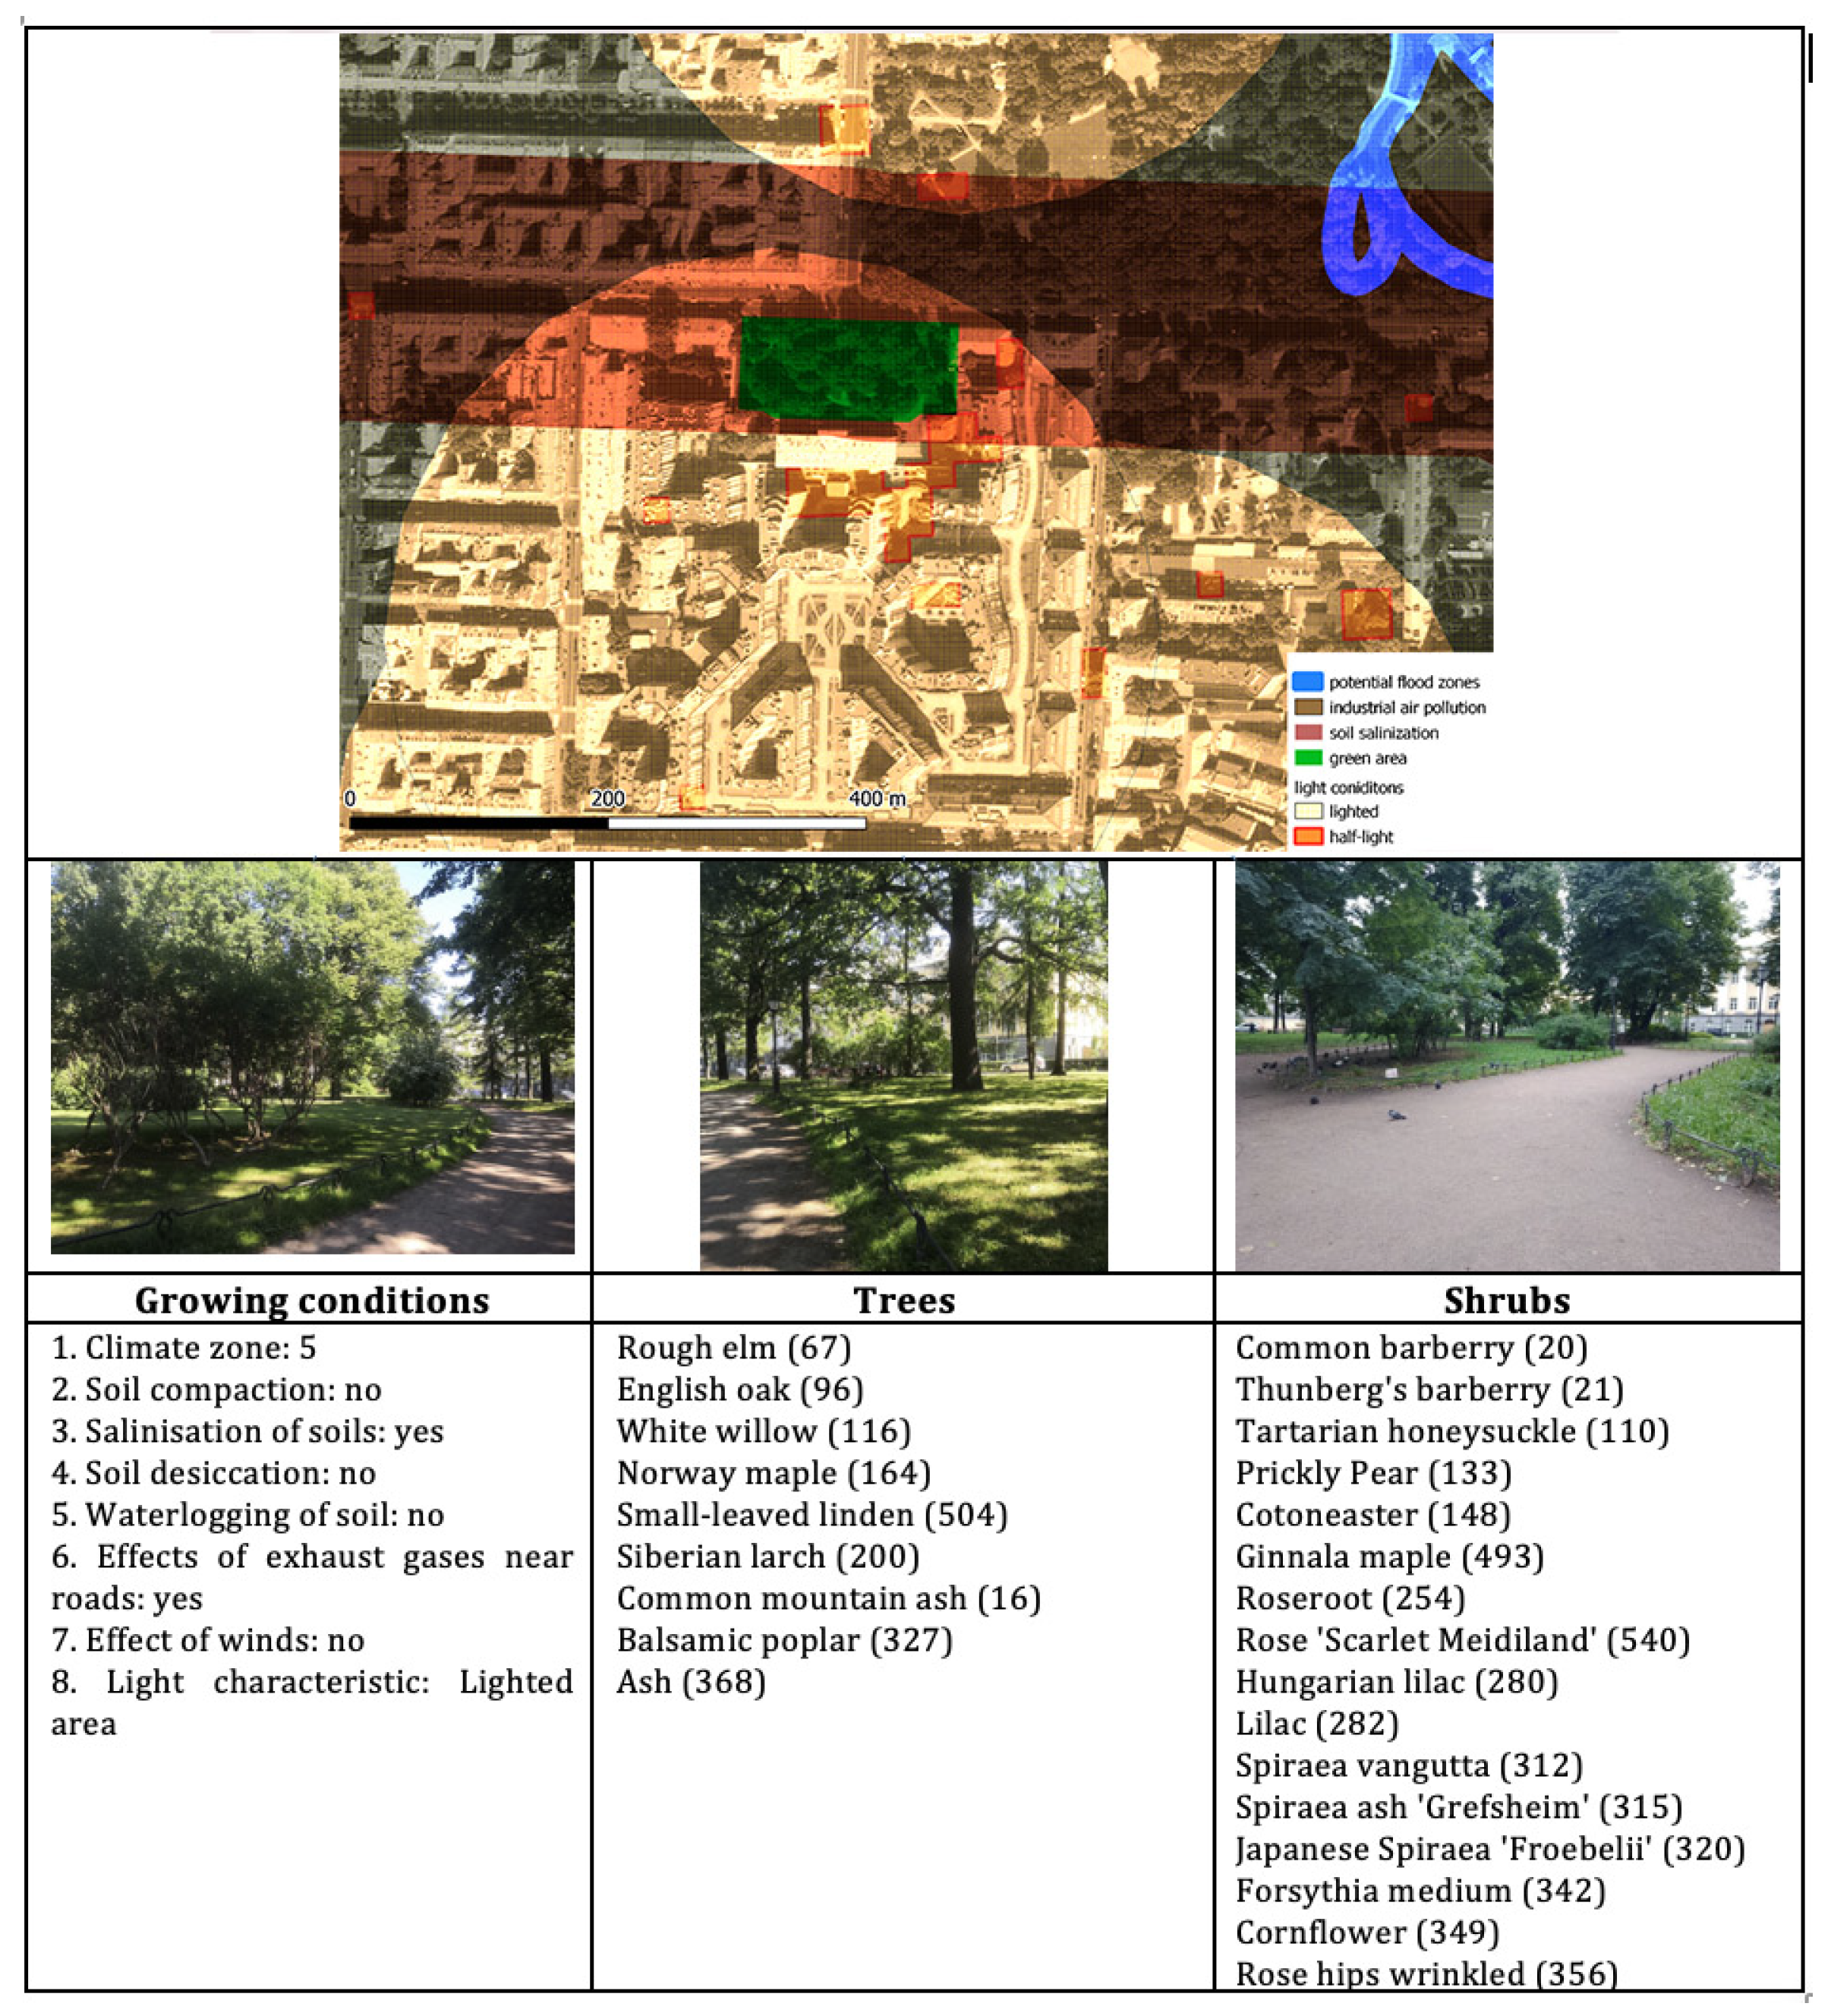
The third step involves taking into account established or successful landscaping practices in the region under consideration. It is based on an inventory of plant species composition in urban green spaces. The unit of modeling in this stage is greenery located in the territory of urban green spaces (parks, squares, boulevards, flower beds, etc.) and having an established or architect-created assortment of plants. The precedent model involves taking into account one or more possible assortments growing in the park and having different conditions. For example, Figure 5 shows the result of an inventory of plant species within Saltykov-Shchedrin Garden in the Central District of St. Petersburg (coordinates). The total area of the garden is 1.01 ha. Tree cover area is 21.8 m2; shrubs 259.16 m2. Group plantings of trees predominate, alternating with open spaces of lawns and group plantings of shrubs. The garden’s area is classified according to the USDA frost-resistance zone classification adopted by the international community to determine the possible range of plant growth. The garden’s frost-resistance zone corresponds to USDA zone 5.
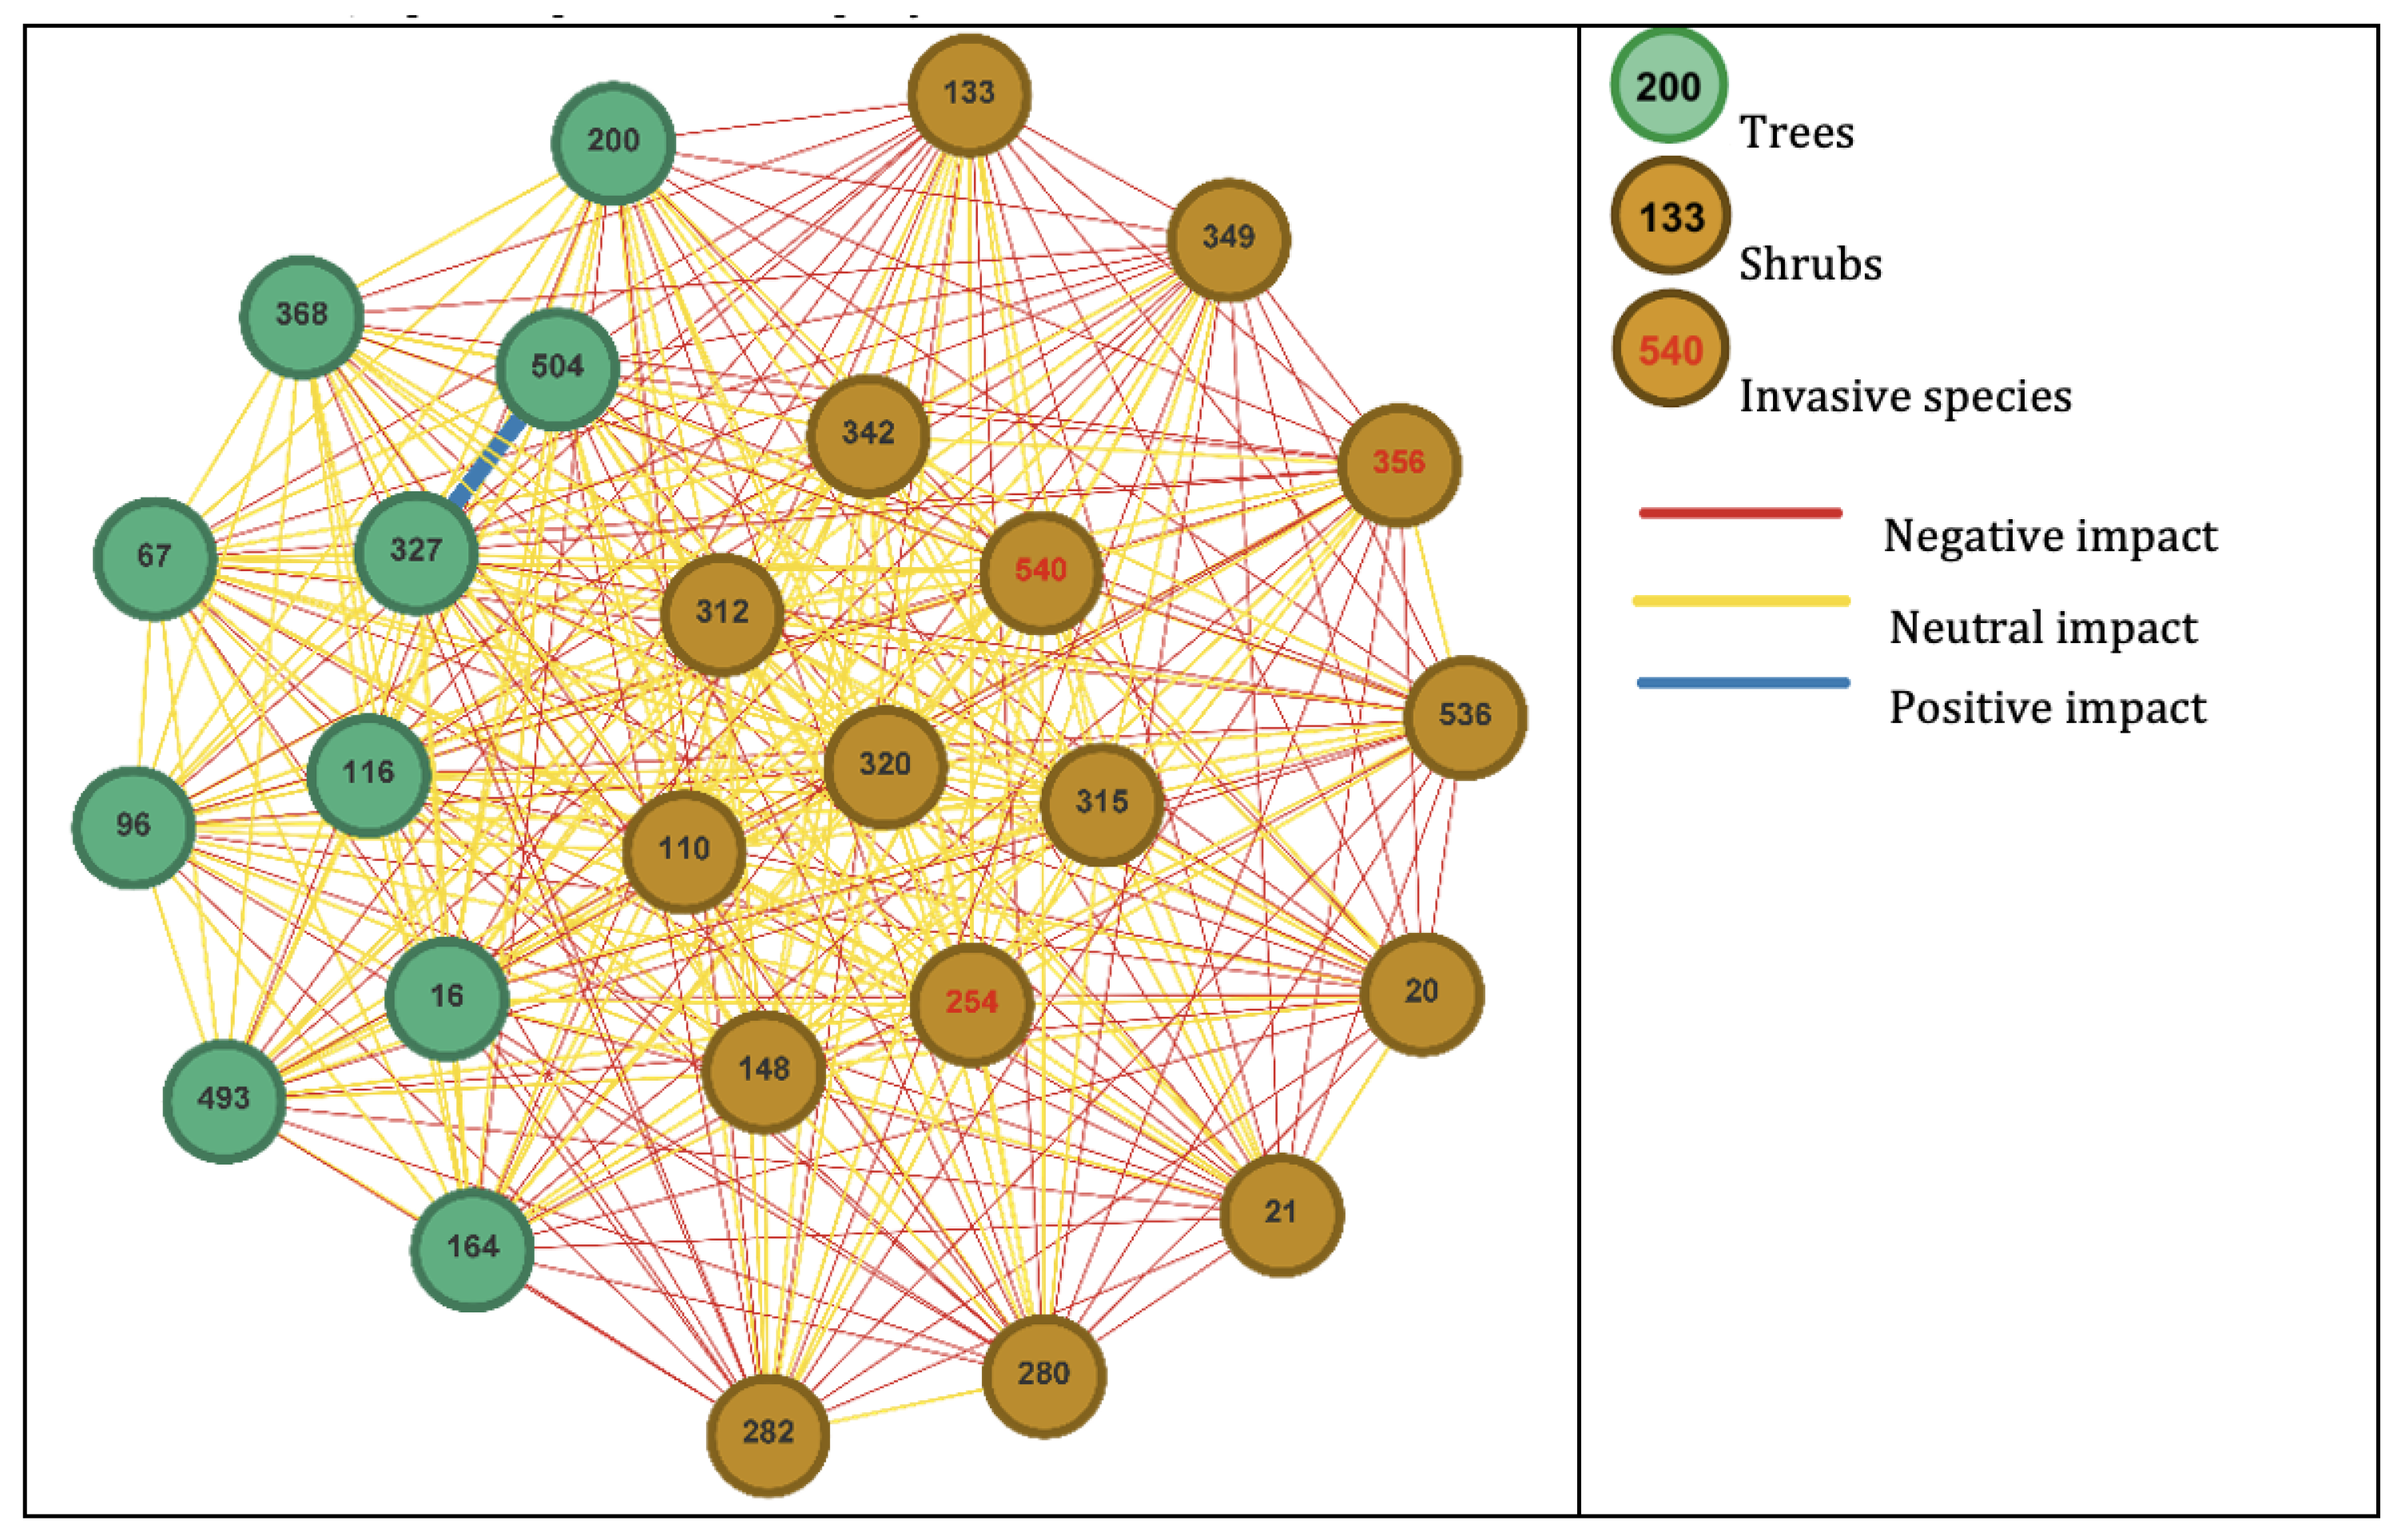
From the point of view of network modeling, the precedents of coexistence of plant species in parks act as new types of relationships between plant species with the parameters of growing conditions and locations. An illustration of the graph formation for the Saltykov-Shchedrin garden species assortment is shown in Figure 6.
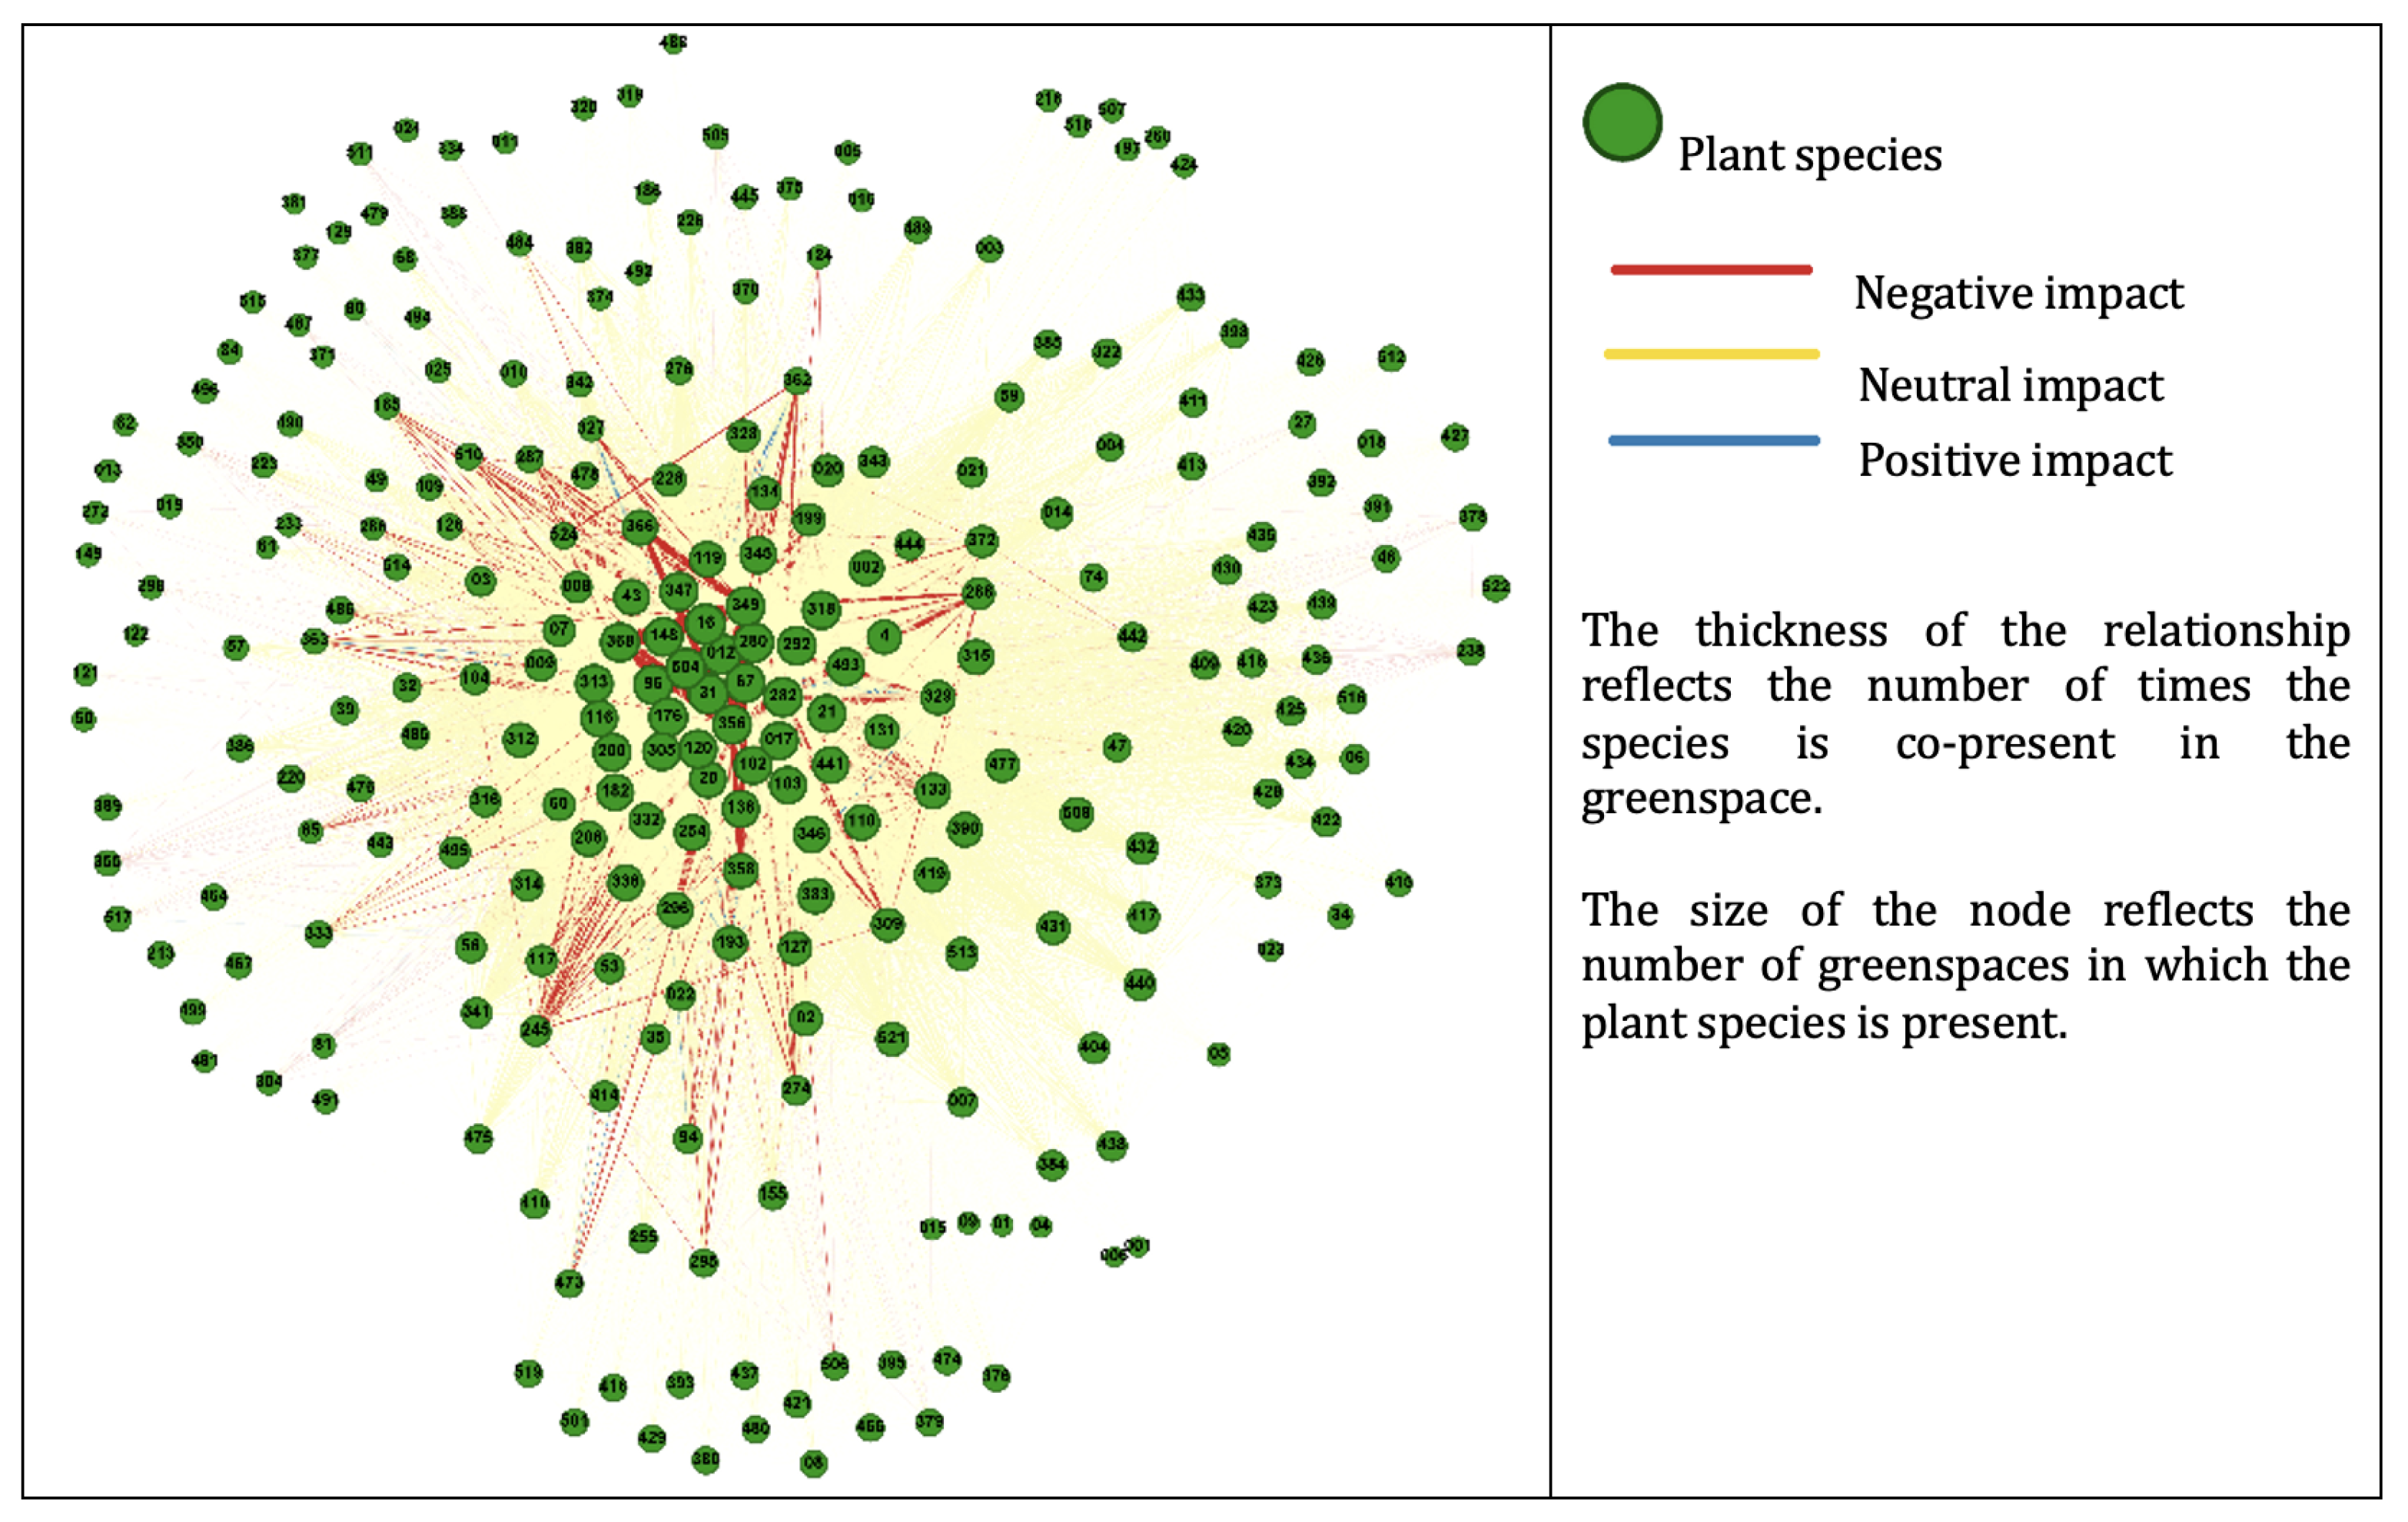
The illustration in Figure 6 makes it clear that on the one hand, invasive species are often found in urban planting due to the nature of urban greening approaches. On the other hand, the reciprocal influence of plants is generally not taken into account, leading to higher maintenance costs for such green spaces. However, the established practices of interdependent planting provide an additional source of data for planning. Figure 7 shows a graph representation of all known precedents for plant species sharing in the database [51] at the time of writing.
Combining the graphs shown in Figure 4 and Figure 7 allows for the formation of a complete model of the relationship between plant species in the city area, taking into account the precedents of use. Figure 8 is an illustration of the complete graph.
The model generated can be used for plant species composition planning in landscaping tasks when the growing conditions are known [52]. This visualization of the results is presented as a graph. Its vertices are distributed over the plant life forms, as can be seen from the legend on the left. The connections between the nodes are correlated according to the classification shown in the legend on the right.

4. Adaptation of Plant Species Composition Planning

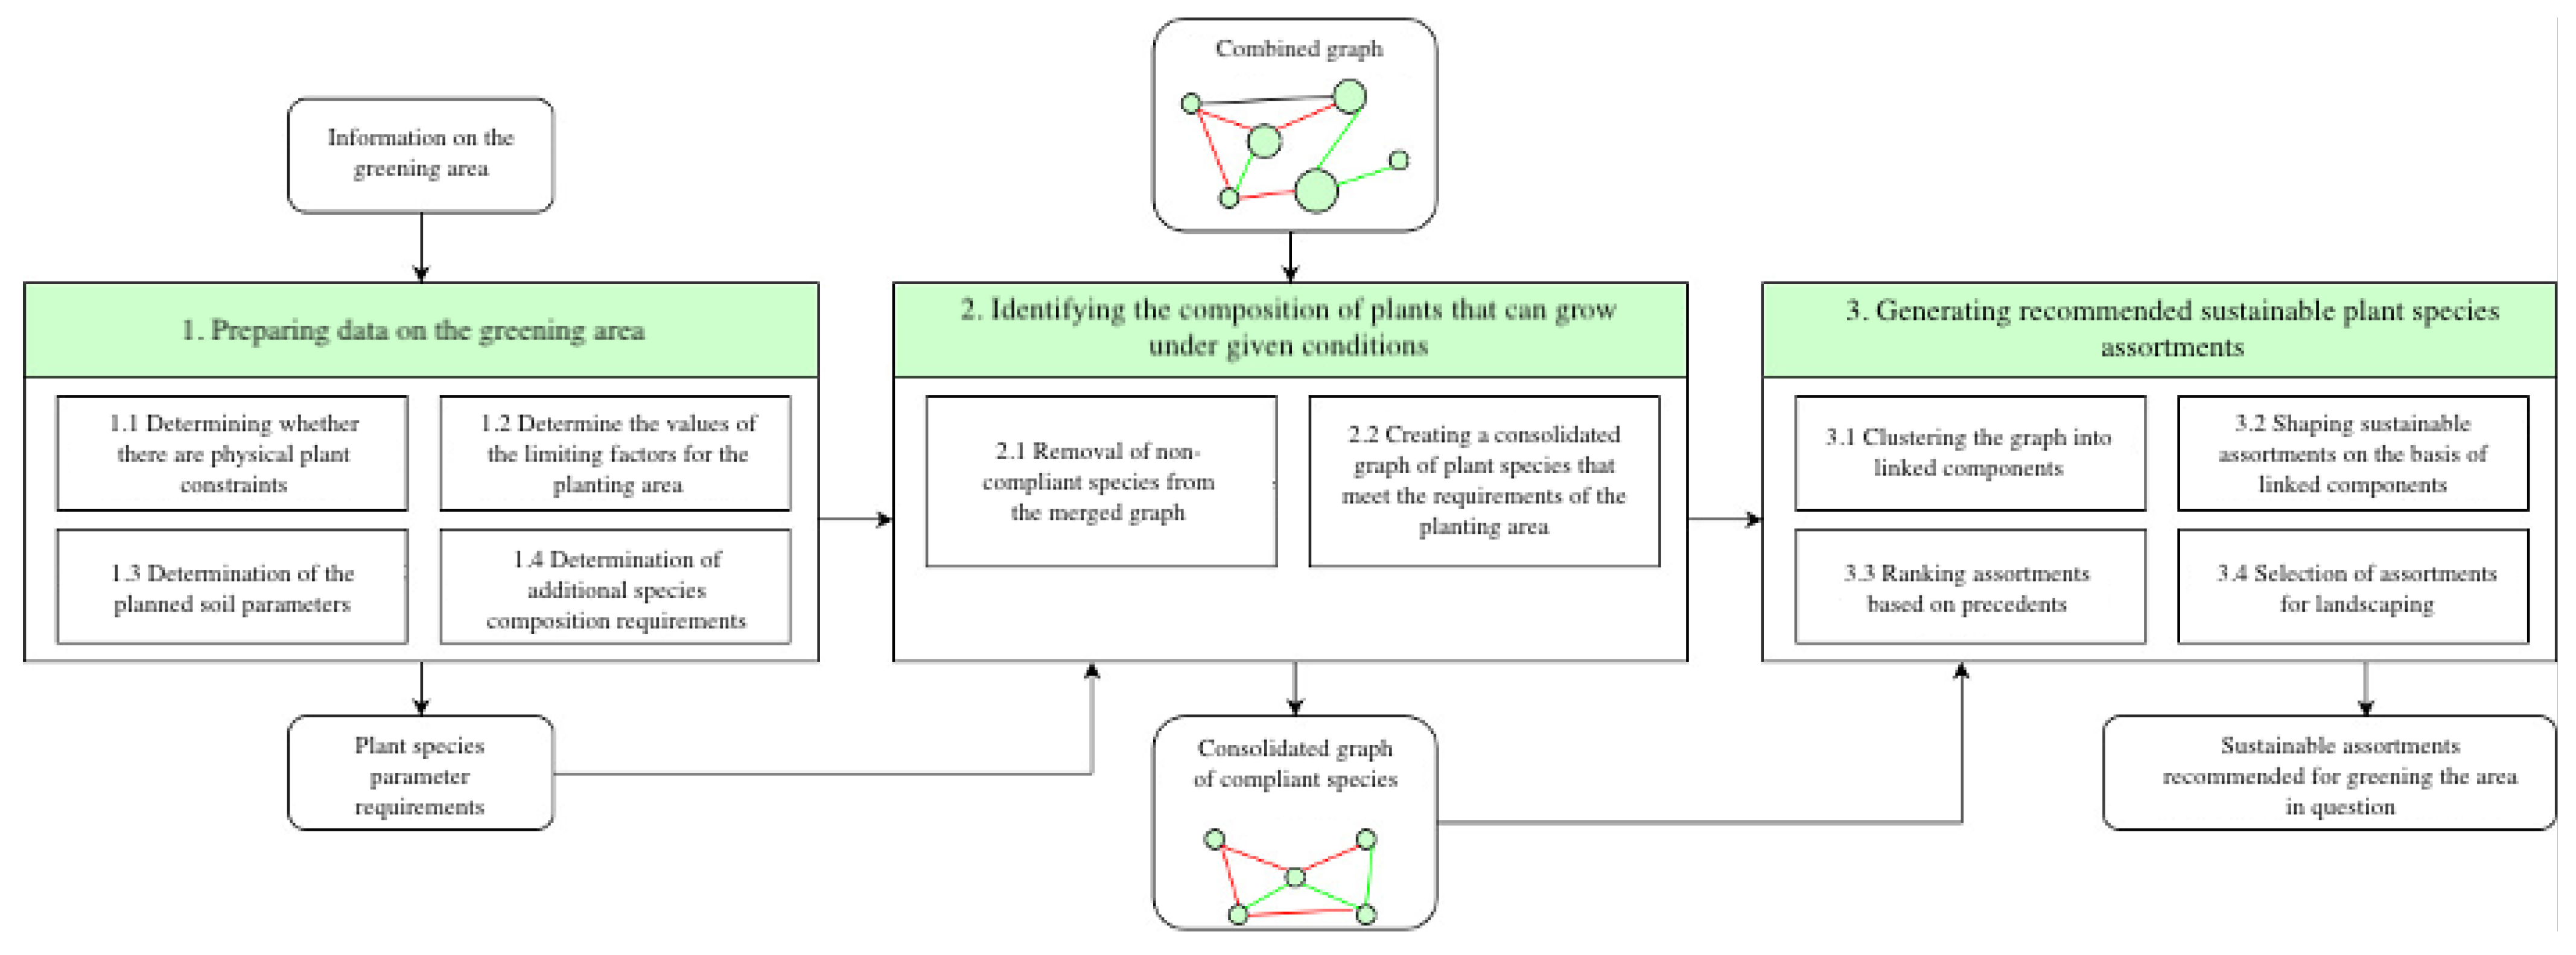
Plant species composition planning is based on a preliminary study of the landscaping area, since it requires information about the growing conditions. The general algorithm for plant species composition planning for a planting area is shown in Figure 9.
The algorithm includes a number of steps. The first is the preparation of baseline data on the growing conditions of the landscaped area.

4.1. Preparing the Data for the Landscaping Area

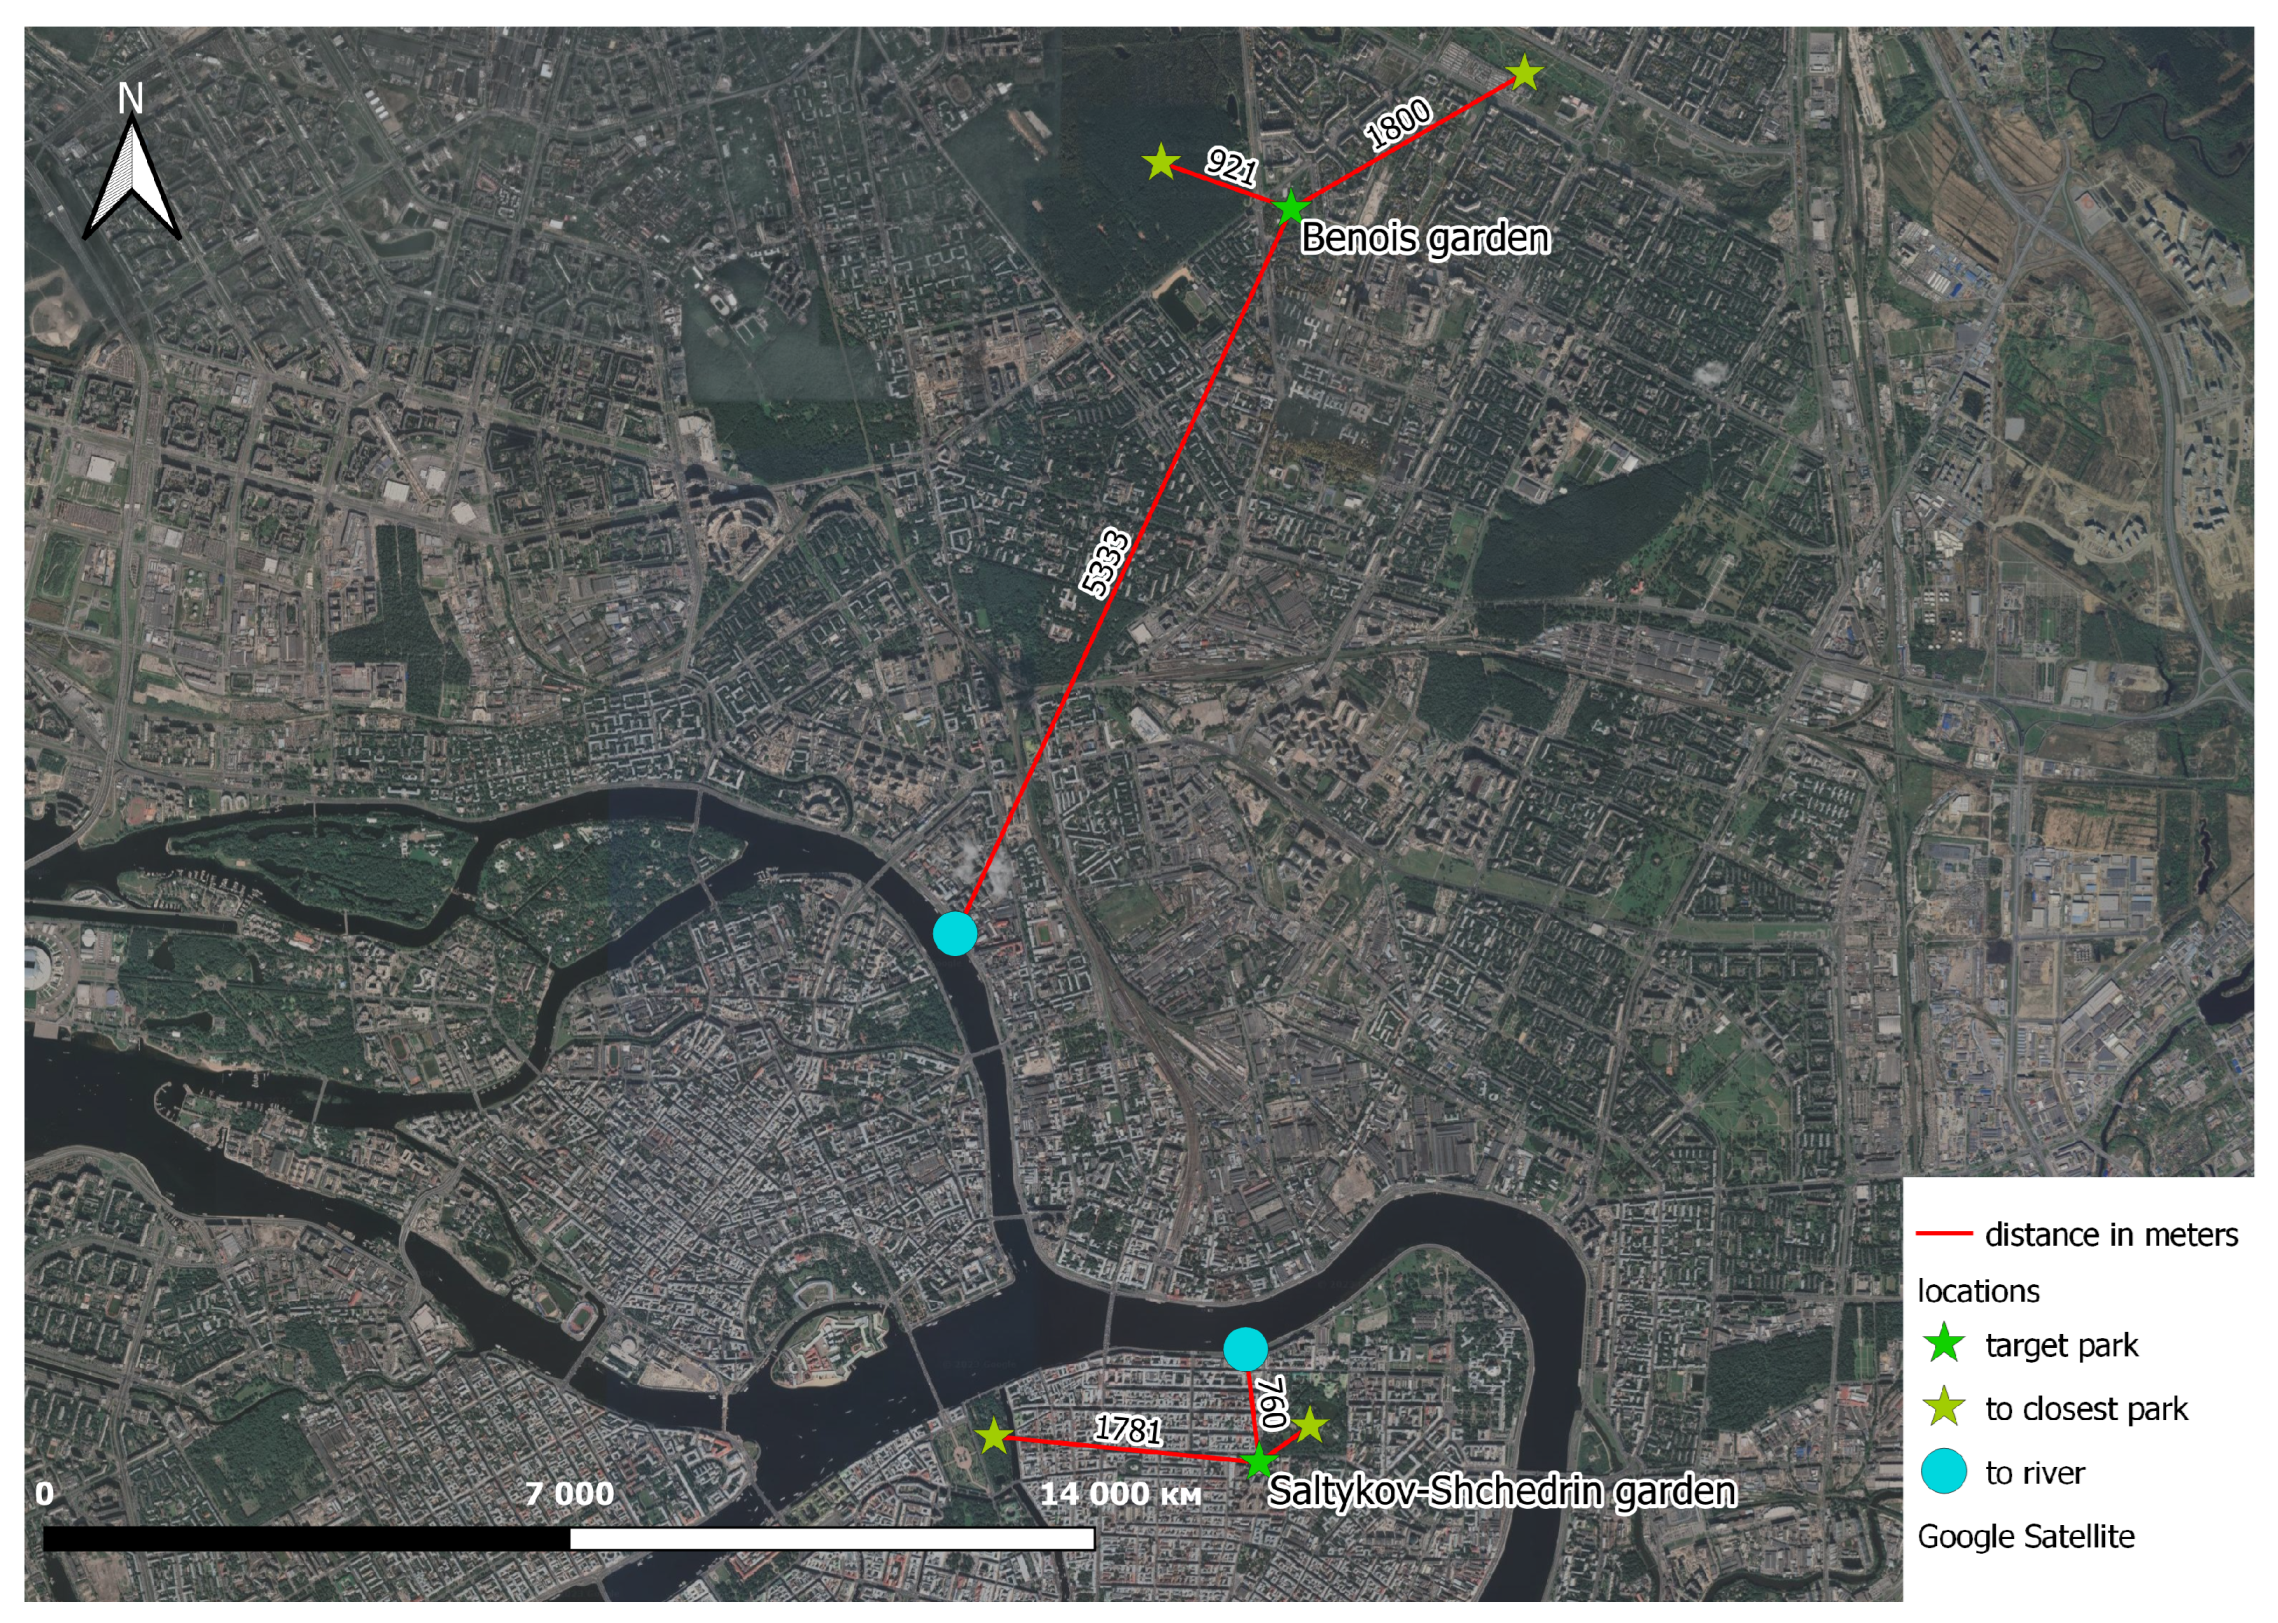
As an example, we consider the two landscaping areas, the Saltykov-Shchedrin Garden, for which the existing range of plant species is shown in Figure 5; and the Benois Garden in the Kalininsky District of St. Petersburg, for which the existing range is also shown for comparison. For the experiment, we use two versions of the algorithm. The first one updates existing plant composition, adding new possible variants of species, and the second one generates new plant composition. These two versions were used for the Saltykov-Shchedrin Garden and Benois Garden accordingly. Locations of these two areas with their proximity to other large green sites and water bodies are shown in Figure 10.
Both zones, which are shown in Figure 11a,b, are classified according to the USDA international classification of climate zones adopted to classify frost-resistant zones according to the boundaries of the range of possible cultivation of plants.
Based on the plant species composition model described in Section 3, the specification of the necessary data is given in Figure 3. The Saltykov-Shchedrin garden has a sufficient number of constraints for plant growth. There is soil salinization and the presence of exhaust gases due to the close proximity to roads. The favorable factors include sufficient lighting, no waterlogging, and at the same time, no soil drying out or compaction. The area is not exposed to winds. Benois Garden has soil salinity, air quality deterioration and wet areas with possible waterlogging, and is subject to soil compaction due to active pedestrian routing. It does not have arid areas and is not exposed to winds. It has adequate light, without significant shading. St. Petersburg is in USDA Climate Zone 5.

4.2. Selecting and Setting Up the Algorithm for Generating the Recommended Sustainable Plant Species Assortments

The second step is to compile a basic list of plant species that can grow under given conditions. The third stage involves creating an assortment of plants for each zone based on their compatibility. Assortments based on the basic set of plant species are formed taking into account the following limitations imposed by the authors:
(a)
The number of negative interactions between plant species should be minimal or absent.
(b)
The compositions shall include as many combinations of plant species as possible in order to maintain diversity in the emerging system.
(c)
The compositions should grow on the same soil types, bearing in mind that urban soils tend to form directly under the planned range of greenery.
The task of the third stage of forming plant assortments includes the stage of selecting and tuning the clustering algorithm for the subgraphs obtained in the previous stage, and the stage of evaluating, interpreting and selecting the assortment.
The choice of the algorithm is made subject to constraints (a)–(c). The formation of assortments based on a basic set of plants can be defined as the identification of a set of strongly connected nodes (plant species), while having weaker connections with other nodes than with each other. To date in the field of network analysis, there is a wide variety of methods for defining communities. The two most common approaches are modularity-based optimization [51] and graph partitioning [52]. The first is based on an optimization problem where the degree of overall modularity of the network needs to be increased with a given resolution, resulting in multiple groups of different sizes. The second involves dividing the network into several segments of equal size with a minimum number of edges between them. Both of these methods cannot detect communities below a certain resolution [53], but this disadvantage is not relevant for our study, as the goal is to find the largest community of plant species represented in the network. The graph partition method also aims for an equal size of communities, which also contradicts the constraint “a”.
Therefore, in this paper, the authors chose the modularity maximization algorithm, in particular, the Clauset–Newman–Moore greedy modularity maximization, whose implementation is presented in the networkx library [54].
The input data are the combinability graph shown in Figure 4. It is filtered according to the external factors present and then passed to the input of the modularity maximization algorithm.
The algorithm chooses the subgraphs of the initial graph G so that the modularity parameter (1) [55] is maximized. The following is a formula for the modularity parameter:
Q ( γ ) = 1 2 m i j ( A i j γ k i k j 2 m ) δ g i g j
where m is the number of edges in the network, k is the degree of nodes i and j accordingly, Aij is the number of edges in the group, δ i j is the Kronecker δ , and γ is the modularity resolution.
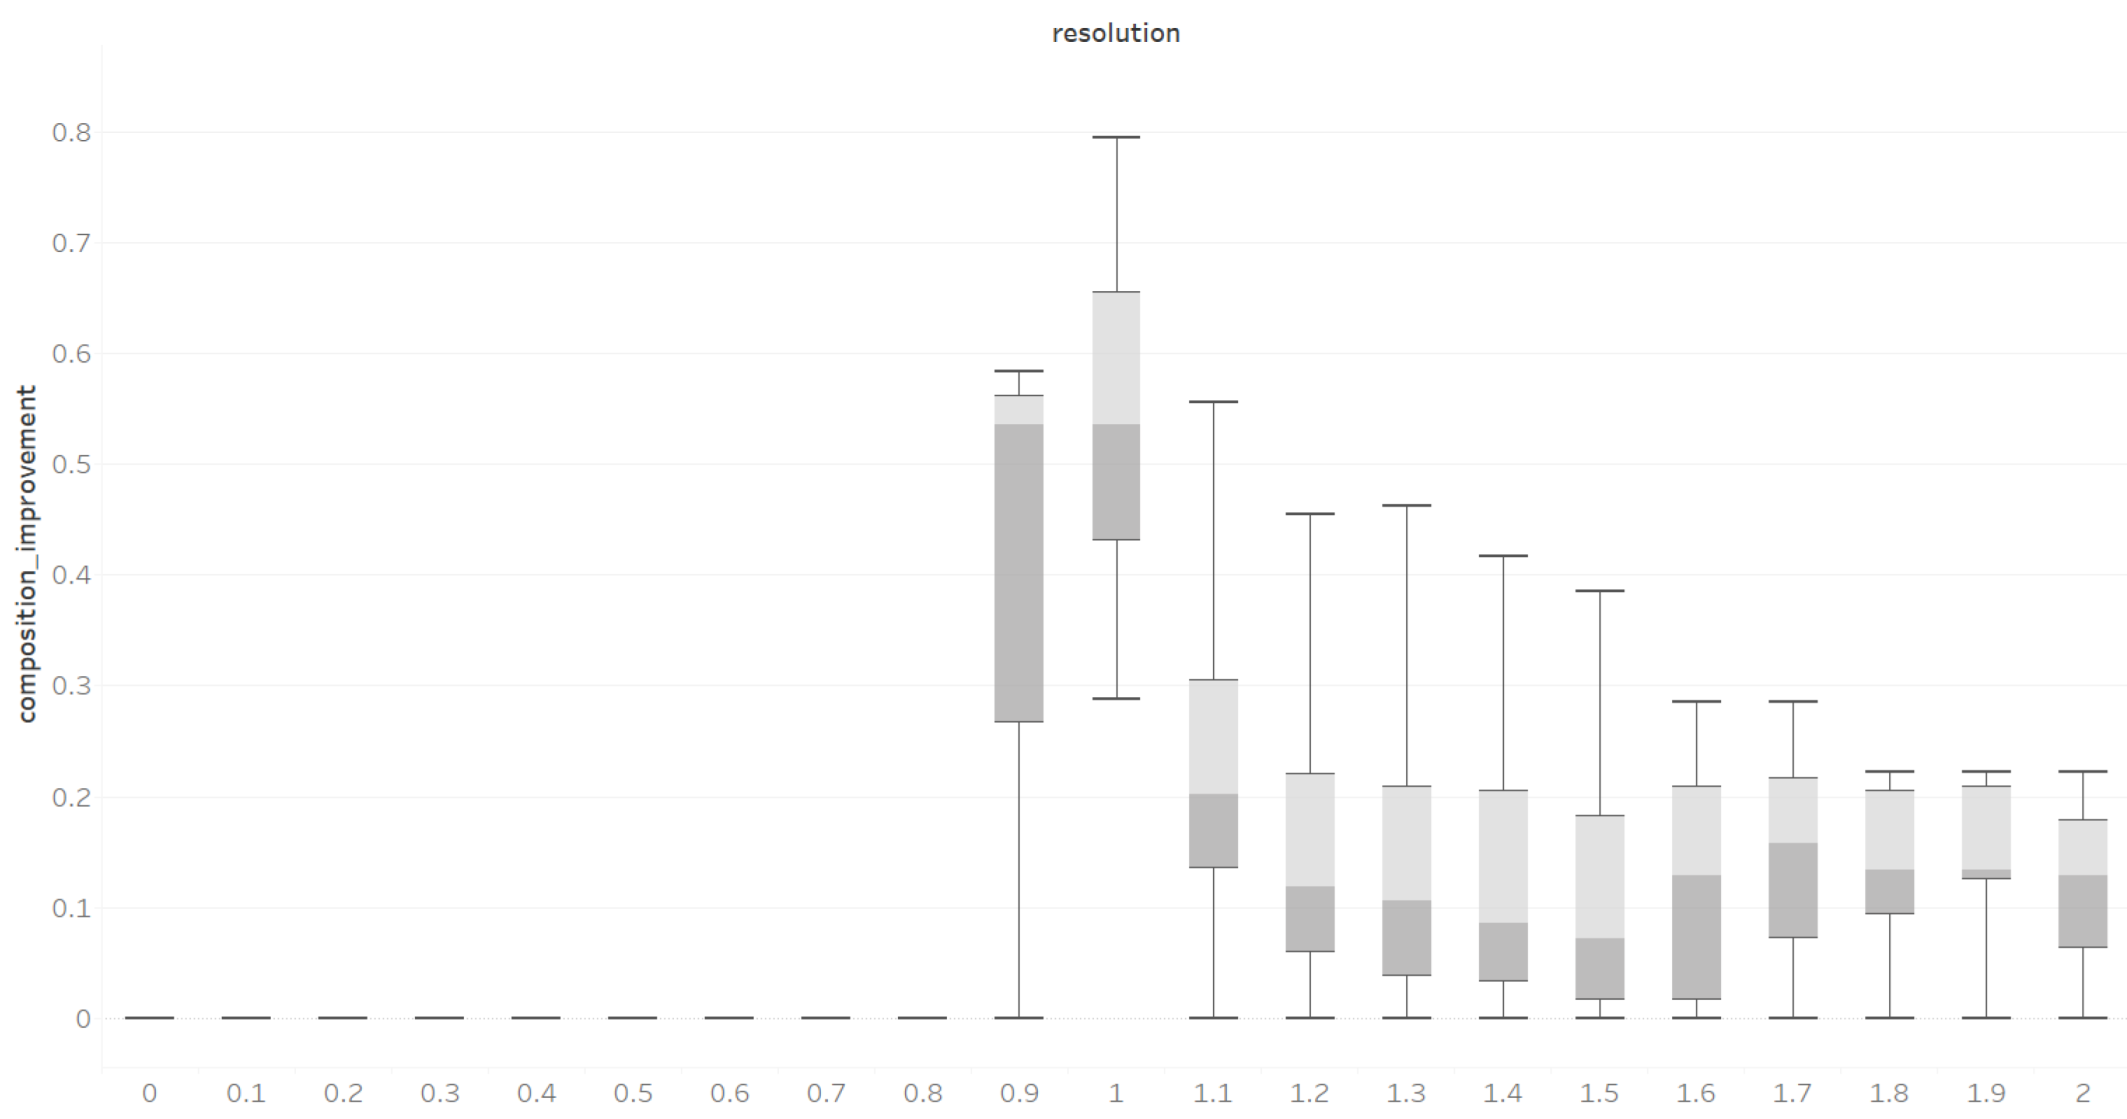
The main adjustable parameter of this algorithm is the resolution parameter γ , the correct choice of which depends on the quality of selection of graph components and respectively formation of assortments. Determination of the optimal value of the resolution parameter was performed experimentally. For this purpose, on the basis of the initial graph of combinability shown in Figure 4, synthetic subgraphs for all possible combinations of limiting factors were formed in an amount of 448 variants. For each option (subgraph), communities were generated using a modularity maximization algorithm with different variants of resolution parameter in the range from 0.1 to 2 with step of 0.1. Comparison of subgraphs for each resolution parameter was based on compositional improvement index (2), the difference between the proportion of nodes retained and the proportion of remaining negative links.
O = n b n a e b e a
where n is the number of nodes; e is the number of negative links; a and b are in the conditions before and after the algorithm, respectively. Results of this comparison are demonstrated in Figure 11.
Based on the results obtained, it can be concluded that on average, the best value of the resolution parameter for all variants of subgraphs is resolution 1.0.

4.3. Generation of Final Assortments Based on the Modularity Maximization Algorithm

The final step is the formation and selection of assortments based on co-occurrence.
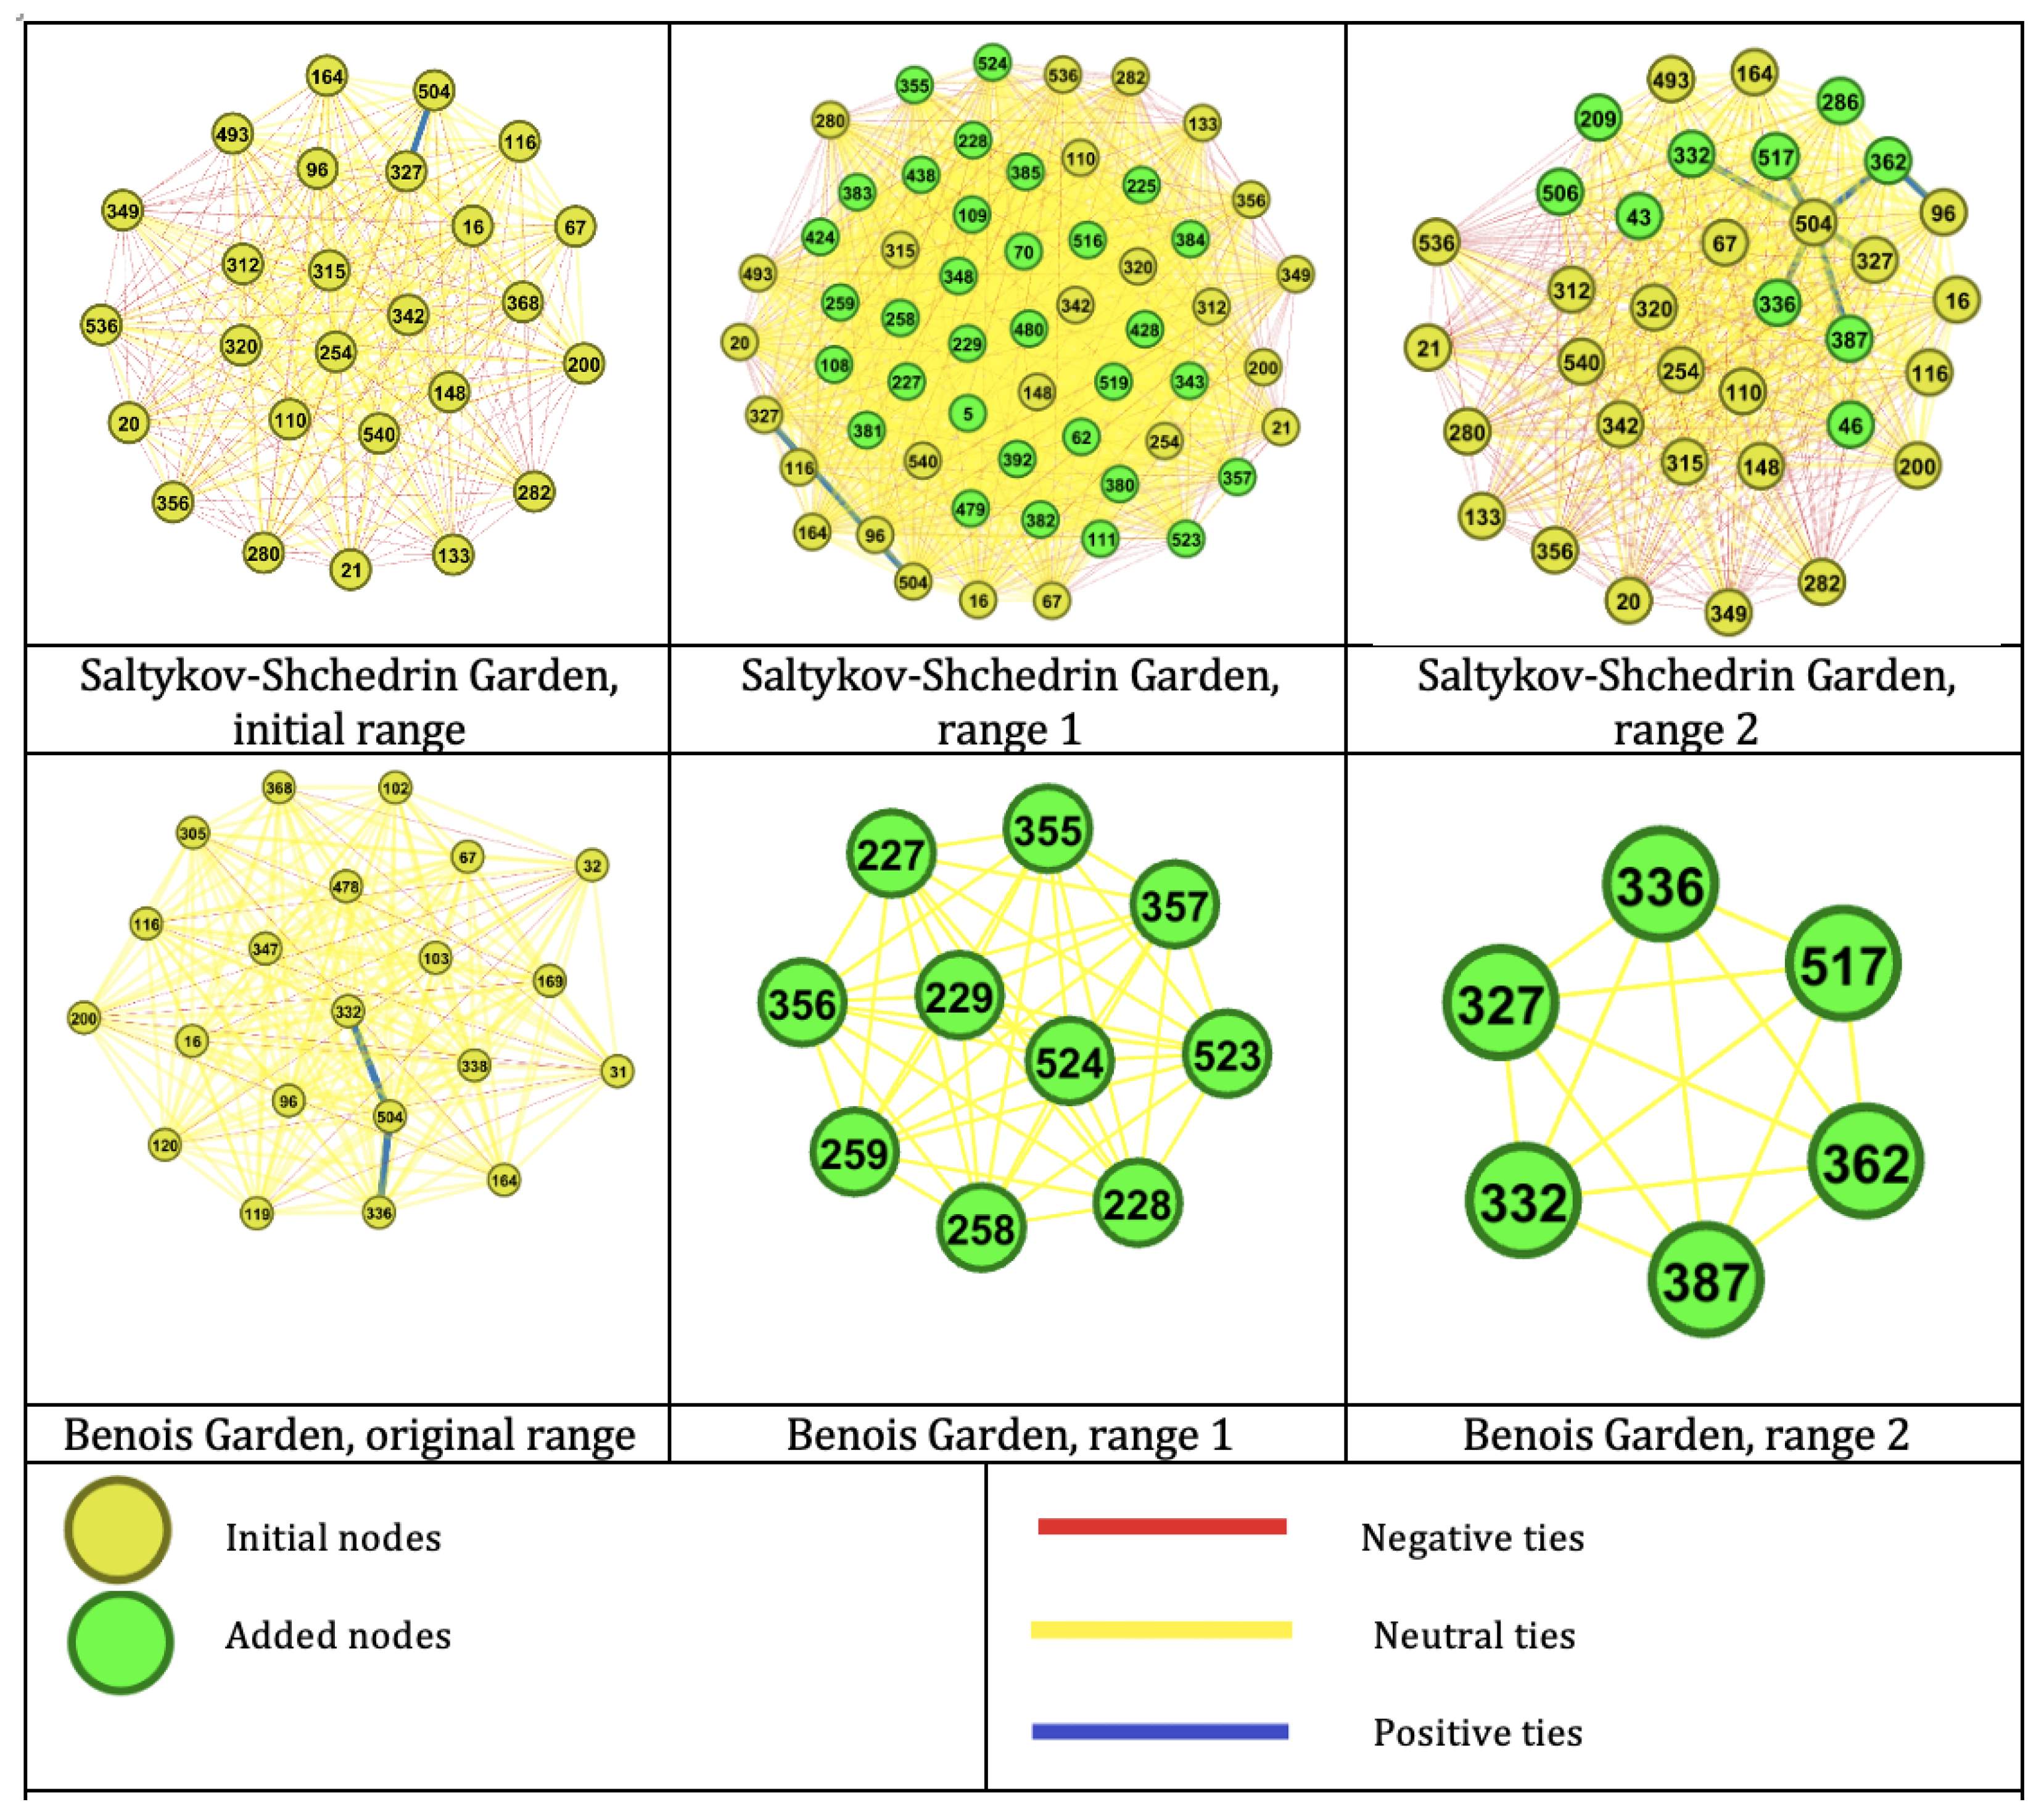
Figure 12 shows the variants of plant species assortments for Saltykov-Shchedrin Garden and Benois Garden. For Saltykov-Shchedrin, in the first variant, most of the augmented species, with the exception of species 355, 357, 523 and 524 (Rosa cinnamomea L., Rosa gallica L., Rosa acicularis Lindl., Rosa canina L., respectively), have no conflicts with already-growing plant species. In the second variant, there is a negative relationship, but a positive relationship is formed between species 504 (Tilia cordata Mill.) and the five augmented species, which can be used by the landscape architect in the formation of the arboretum.
For Benois Garden, the recommended options are smaller, due to the more stringent constraints of the terrain. However, they do not have a negative relationship within the composition, and the former is more varied (50% trees, 30% shrubs and 20% perennial grasses) than the original version (95% trees and 5% shrubs).

5. Discussion

The validation of the algorithm shows that it can be applied in a number of scenarios. They are graded according to the information available for use from a polygon with the boundaries of the area being gardened (in this case, spatial data containing information about some external factors can be generated on the basis of open data) to a complete list of plant species existing on the territory and the factors affecting them.
The novelty of the proposed approach lies in the application of spatial modeling and network analysis methods to generate a list of sustainable plant compositions in the context of St. Petersburg. At the same time, the method is planned to be tested on other urban green spaces in future works. It should be noted that in its current form, the method has a number of limitations. In particular, when applied to an area with an existing set of species, a large number of negative relations are retained. If the method is used for new landscaping, a large number of external limiting factors strongly reduce the final number of suitable species, as can be seen in Figure 13. These problems can be solved by determining the significance of external and internal factors based on experiments with a graph model, further enriched with facts from the scientific literature. Nevertheless, the proposed method can adapt the urban greening management system to the climate change process by better accounting for the influence of external factors (e.g., soil waterlogging or stronger winds) on landscaping and the selection of plant species resistant to these factors. In addition, the method can increase the diversity of species in an area, which also leads to a more resilient urban ecosystem.
It should be noted that the authors see the main value of the tool presented in the article in assisting young architects, as well as in planning landscaping for areas where a landscape architecture specialist would not be involved due to the small scale and specificity of the areas. This applies in particular to boulevards, technical planting areas, and other landscaping areas not traditionally the domain of landscape architects. It should also be noted that the result of forming the assortments of plant species significantly depends on the choice of algorithm for subgraph selection and the choice of initial conditions for this algorithm. In this article, the authors have used one of many possible ways of designing subgraphs. In this regard, the authors would be grateful to all those willing to join this study in terms of conducting experiments on the generated graph of plant species, as well as in supplementing this graph [56]. Another factor that requires a separate discussion is the definition of the type of plant interactions. It should be borne in mind that this is an evolving field, and the presence of plant species interactions is determined by the degree to which the interactions between species have been studied. In this work, where the influence was unknown, it was noted as neutral, which of course has an impact on the final assortments.

6. Conclusions

In the present article, the approach to the automation of the formation of variants of assortments of plant species for territories with known conditions of growth of plants taking into account the mutual influence of plants and existing precedents of joint occurrence of plant species is considered. On the basis of an algorithm, the device for modeling graphs for kinds of plants, which has allowed one to take into account the facts of positive and negative mutual influence of kinds of plants operating with parameters of tops and edges of a graph, is used. The implementation of the approach required the formation of a plant species base, taking into account the growing conditions of species, in addition, taking into account the precedents of species co-occurrence required an inventory of existing greenery plantations. The resulting graph and species database, however, made it possible to implement methods for automatically generating stable assortments of plant species for given areas. The final assortments were generated using a modularity maximization method over the generated plant graph, excluding species unable to grow in the given conditions. The best parameters of the modularity maximization method were determined experimentally and were used to demonstrate the approach in two green areas of St. Petersburg, namely Benois Garden and Saltykov-Shchedrin Garden. The results of applying the method to the areas chosen for the demonstration have shown that it is possible to form both main and complementary plant assortments with no negative relationships or with new positive relationships to existing plant species. This shows the applicability of the method not only for the automatic generation of assortments, but also its usefulness for landscape architects in planning the development of species composition for relatively large landscaping areas 4.

Author Contributions

Conceptualization, S.M. (Sergey Mityagin); Methodology, E.M. and T.C.; Formal analysis, A.A.; Investigation, N.K. and S.M. (Sofia Malysheva); Data curation, A.S.; Writing—original draft, S.M. (Sergey Mityagin) and N.K.; Writing—review & editing, I.A.S. and A.V.B.; Visualization, A.A.; Supervision, N.Z. and S.A.B.; Project administration, S.M. (Sergey Mityagin). All authors have read and agreed to the published version of the manuscript.

Funding

This research was supported by the Priority 2030 Federal Academic Leadership Program.

Institutional Review Board Statement

Not applicable.

Informed Consent Statement

Not applicable.

Data Availability Statement

Publicly available datasets were analyzed in this study. This data can be found here: https://github.com/egov-itmo/derevo.

Conflicts of Interest

The authors declare no conflict of interest. The funders had no role in the design of the study; in the collection, analyses, or interpretation of data; in the writing of the manuscript; or in the decision to publish the results.

References

  1. Yang, T.; Barnett, R.; Fan, Y.; Li, L. The effect of urban green space on uncertainty stress and life stress: A nationwide study of university students in China. Health Place 2019, 59, 102199. [Google Scholar] [CrossRef] [PubMed]
  2. Shmelev, S. (Ed.) Sustainable Cities Reimagined: Multidimensional Assessment And Smart Solutions; Routledge: Abingdon, UK, 2019. [Google Scholar]
  3. Berrone, P.; Ricart, J.E.; Duch, A.; Carrasco, C. IESE cities in motion index 2019. IESE 2019, 5, 2019. [Google Scholar]
  4. European Green Leaf Award. Applying for EU Green Leaf Award. Available online: https://environment.ec.europa.eu/topics/urban-environment/european-green-leaf-award/applying-eu-green-leaf-award_en (accessed on 24 March 2023).
  5. SNiP 2.07.01-89* Urban Planning. Planning and Development of Urban and Rural Settlements. Available online: https://www.minstroyrf.gov.ru/docs/14465/ (accessed on 23 March 2023).
  6. Paithankar, D.N.; Taji, S.G. Investigating the hydrological performance of green roofs using storm water management model. Mater. Today Proc. 2020, 32, 943–950. [Google Scholar] [CrossRef]
  7. Zhang, B.; Cao, D.; Zhu, S. Use of plants to clean polluted air: A potentially effective and low-cost phytoremediation technology. BioResources 2020, 15, 4650–4654. [Google Scholar] [CrossRef]
  8. Nowak, D.J.; Hoehn, R.; Crane, D.E. Oxygen production by urban trees in the United States. Arboric. Urban For. 2007, 33, 220. [Google Scholar] [CrossRef]
  9. Moseley, D.; Marzano, M.; Chetcuti, J.; Watts, K. Green networks for people: Application of a functional approach to support the planning and management of greenspace. Landsc. Urban Plan. 2013, 116, 1–12. [Google Scholar] [CrossRef]
  10. Ahern, J. Green infrastructure for cities: The spatial dimension. Cities Futur. Towards Integr. Sustain. Water Landsc. Manag. 2007, 13, 267–283. [Google Scholar]
  11. Bolund, P.; Hunhammar, S. Ecosystem services in urban areas. Ecol. Econ. 1999, 29, 293–301. [Google Scholar] [CrossRef]
  12. Shmelev, S.E.; Shmeleva, I.A. Sustainable cities: Problems of integrated interdisciplinary research. Int. J. Sustain. Dev. 2009, 12, 4–23. [Google Scholar] [CrossRef]
  13. Gülgün, B.; Güney, M.; Aktaş, E.; Yazici, K. Role of the landscape architecture in interdisciplinary planning of sustainable cities. J. Environ. Protec. Ecol. 2014, 15, 1877–1880. [Google Scholar]
  14. McPherson, E.G. Accounting for benefits and costs of urban greenspace. Landsc. Urban Plan. 1992, 22, 41–51. [Google Scholar] [CrossRef]
  15. Mertens, E.; Stiles, R.; Karadeniz, N. Green May Be Nice, but Infrastructure Is Necessary. Land 2022, 11, 89. [Google Scholar] [CrossRef]
  16. Ambrey, C.; Baker, D.; Byrne, J.; Matthews, T. What Is Green Infrastructure, and How Do We Include It in Urban Planning?—Future of Construction; Springer: Berlin/Heidelberg, Germany, 2016. [Google Scholar]
  17. Asgarzadeh, M.; Vahdati, K.; Lotfi, M.; Arab, M.; Babaei, A.; Naderi, F.; Soufi, M.P.; Rouhani, G. Plant selection method for urban landscapes of semi-arid cities (a case study of Tehran). Urban For. Urban Green. 2014, 13, 450–458. [Google Scholar] [CrossRef]
  18. Leishman, M.R.; Thomson, V.P.; Cooke, J. Native and exotic invasive plants have fundamentally similar carbon capture strategies. J. Ecol. 2010, 98, 28–42. [Google Scholar] [CrossRef]
  19. Air Masses and Atmospheric Fronts. Available online: http://meteocenter.net/meteolib/vm.htm (accessed on 27 March 2023).
  20. USDA Plant Hardiness Zone Map. Available online: https://planthardiness.ars.usda.gov/ (accessed on 27 March 2023).
  21. Trigub, V. Urban Soils as a Special Type of Soil. Sci. Notes Crime. Fed. Univ. Named Vernadsky. Geogr. Geol. 2011, 24, 321–325. [Google Scholar]
  22. Light-Loving and Shade-Tolerant Plants. Available online: http://www.treefolium.ru/articles/svetolyubivye-tenevynoslivye-rasteniya/ (accessed on 27 March 2023).
  23. Nikolayevsky, V.S. Biological Bases of Plant Gas Resistance; Siberian Division: Novosibirsk, Russia, 1979. [Google Scholar]
  24. Hitchmough, J.D. New approaches to ecologically based, designed urban plant communities in Britain: Do these have any relevance in the United States? Cities Environ. 2008, 1, 10. [Google Scholar] [CrossRef]
  25. Dong-sheng, G.; Yu-juan, C. Status of urban vegetation in Guangzhou City. J. For. Res. 2003, 14, 249–252. [Google Scholar] [CrossRef]
  26. Shirgapure, K.; Ghosh, P. Allelopathy a tool for sustainable weed management. Arch. Curr. Res. Int. 2020, 20, 17–25. [Google Scholar] [CrossRef]
  27. Kumar, M.; Garkoti, S.C. Allelopathy effects of invasive alien Ageratina adenophora on native shrub species of chir pine forest in the central Himalaya, India. J. For. Res. 2022, 27, 53–62. [Google Scholar] [CrossRef]
  28. Corina Pindaru, L.; Razvan Nita, M. Methods of Including Invasive Species Research in Urban Planning—A Case Study on Ailanthus altissima. Pol. J. Environ. Stud. 2023, 32, 689–704. [Google Scholar] [CrossRef]
  29. Potgieter, L.J.; Shrestha, N.; Cadotte, M.W. Prioritizing terrestrial invasive alien plant species for management in urban ecosystems. J. Appl. Ecol. 2022, 59, 872–883. [Google Scholar] [CrossRef]
  30. Davidson, A.M.; Jennions, M.; Nicotra, A.B. Do invasive species show higher phenotypic plasticity than native species and, if so, is it adaptive? A meta-analysis. Ecol. Lett. 2011, 14, 419–431. [Google Scholar] [CrossRef] [PubMed]
  31. Godefroid, S.; Koedam, N. Urban plant species patterns are highly driven by density and function of built-up areas. Landsc. Ecol. 2007, 22, 1227–1239. [Google Scholar] [CrossRef]
  32. Talal, M.L.; Santelmann, M.V. Plant community composition and biodiversity patterns in urban parks of Portland, Oregon. Front. Ecol. Evol. 2019, 7, 201. [Google Scholar] [CrossRef]
  33. Chang, C.R.; Chen, M.C.; Su, M.H. Natural versus human drivers of plant diversity in urban parks and the anthropogenic species-area hypotheses. Landsc. Urban Plan. 2021, 208, 104023. [Google Scholar] [CrossRef]
  34. Ramirez, K.S.; Geisen, S.; Morriën, E.; Snoek, B.L.; van der Putten, W.H. Network analyses can advance above-belowground ecology. Trends Plant Sci. 2018, 23, 759–768. [Google Scholar] [CrossRef]
  35. Majdi, N.; Hette-Tronquart, N.; Auclair, E.; Bec, A.; Chouvelon, T.; Cognie, B.; Danger, M.; Decottignies, P.; Dessier, A.; Desvilettes, C.; et al. There’s no harm in having too much: A comprehensive toolbox of methods in trophic ecology. Food Webs 2018, 17, e00100. [Google Scholar] [CrossRef]
  36. Shmeleva, I.A.; Shmelev, S.E. Climate Change Discourse Analysis: The Russian Case. In Sustainability Analysis; Springer: Berlin/Heidelberg, Germany, 2012; pp. 203–253. [Google Scholar]
  37. Barberán, A.; Bates, S.T.; Casamayor, E.O.; Fierer, N. Using network analysis to explore co-occurrence patterns in soil microbial communities. Isme J. 2012, 6, 343–351. [Google Scholar] [CrossRef]
  38. Encinas-Viso, F.; Alonso, D.; Klironomos, J.N.; Etienne, R.S.; Chang, E.R. Plant–mycorrhizal fungus co-occurrence network lacks substantial structure. Oikos 2016, 125, 457–467. [Google Scholar] [CrossRef]
  39. Baiser, B.; Elhesha, R.; Kahveci, T. Motifs in the assembly of food web networks. Oikos 2016, 125, 480–491. [Google Scholar] [CrossRef]
  40. Cai, W.; Snyder, J.; Hastings, A.; D’Souza, R.M. Mutualistic networks emerging from adaptive niche-based interactions. Nat. Commun. 2020, 11, 5470. [Google Scholar] [CrossRef] [PubMed]
  41. Ponisio, L.C.; Valdovinos, F.S.; Allhoff, K.T.; Gaiarsa, M.P.; Barner, A.; Guimarães Jr, P.R.; Hembry, D.H.; Morrison, B.; Gillespie, R. A network perspective for community assembly. Front. Ecol. Evol. 2019, 7, 103. [Google Scholar] [CrossRef]
  42. Sargent, R.D.; Ackerly, D.D. Plant–pollinator interactions and the assembly of plant communities. Trends Ecol. Evol. 2008, 23, 123–130. [Google Scholar] [CrossRef]
  43. Campbell, C.; Yang, S.; Albert, R.; Shea, K. A network model for plant–pollinator community assembly. Proc. Natl. Acad. Sci. USA 2011, 108, 197–202. [Google Scholar] [CrossRef] [PubMed]
  44. Blüthgen, N. Why network analysis is often disconnected from community ecology: A critique and an ecologist’s guide. Basic Appl. Ecol. 2010, 11, 185–195. [Google Scholar] [CrossRef]
  45. Singh, G.; Papoutsoglou, E.A.; Keijts-Lalleman, F.; Vencheva, B.; Rice, M.; Visser, R.G.; Bachem, C.W.; Finkers, R. Extracting knowledge networks from plant scientific literature: Potato tuber flesh color as an exemplary trait. BMC Plant Biol. 2021, 21, 1–14. [Google Scholar] [CrossRef]
  46. Online Plant Identifier. Available online: https://www.plantarium.ru (accessed on 27 March 2023).
  47. The World Flora Online. Available online: http://www.worldfloraonline.org (accessed on 27 March 2023).
  48. Savvateev Nursery. Available online: https://www.drevo-spas.ru (accessed on 27 March 2023).
  49. Sale of Plants Landscape Design. Available online: https://www.martin-sad.ru (accessed on 27 March 2023).
  50. Lorberg Plant Nursery. Available online: https://www.lorberg.com/de/ (accessed on 27 March 2023).
  51. Plant Database. Available online: https://github.com/iduprojects/PlantCompositionPlanning/tree/main/backend (accessed on 27 March 2023).
  52. PlantCompositionPlanning Graphs. Available online: https://github.com/iduprojects/PlantCompositionPlanning/blob/main/graphs/combined_graph.gexf (accessed on 25 March 2023).
  53. Zhu, J.; Chen, B.; Zeng, Y. Community detection based on modularity and k-plexes. Inf. Sci. 2020, 513, 127–142. [Google Scholar] [CrossRef]
  54. Network Analysis in Python. Available online: https://networkx.org (accessed on 24 March 2023).
  55. Newman, M.E. Equivalence between modularity optimization and maximum likelihood methods for community detection. Phys. Rev. E 2016, 94, 052315. [Google Scholar] [CrossRef]
  56. PlantCompositionPlanning. Available online: https://github.com/iduprojects/PlantCompositionPlanning (accessed on 25 March 2023).
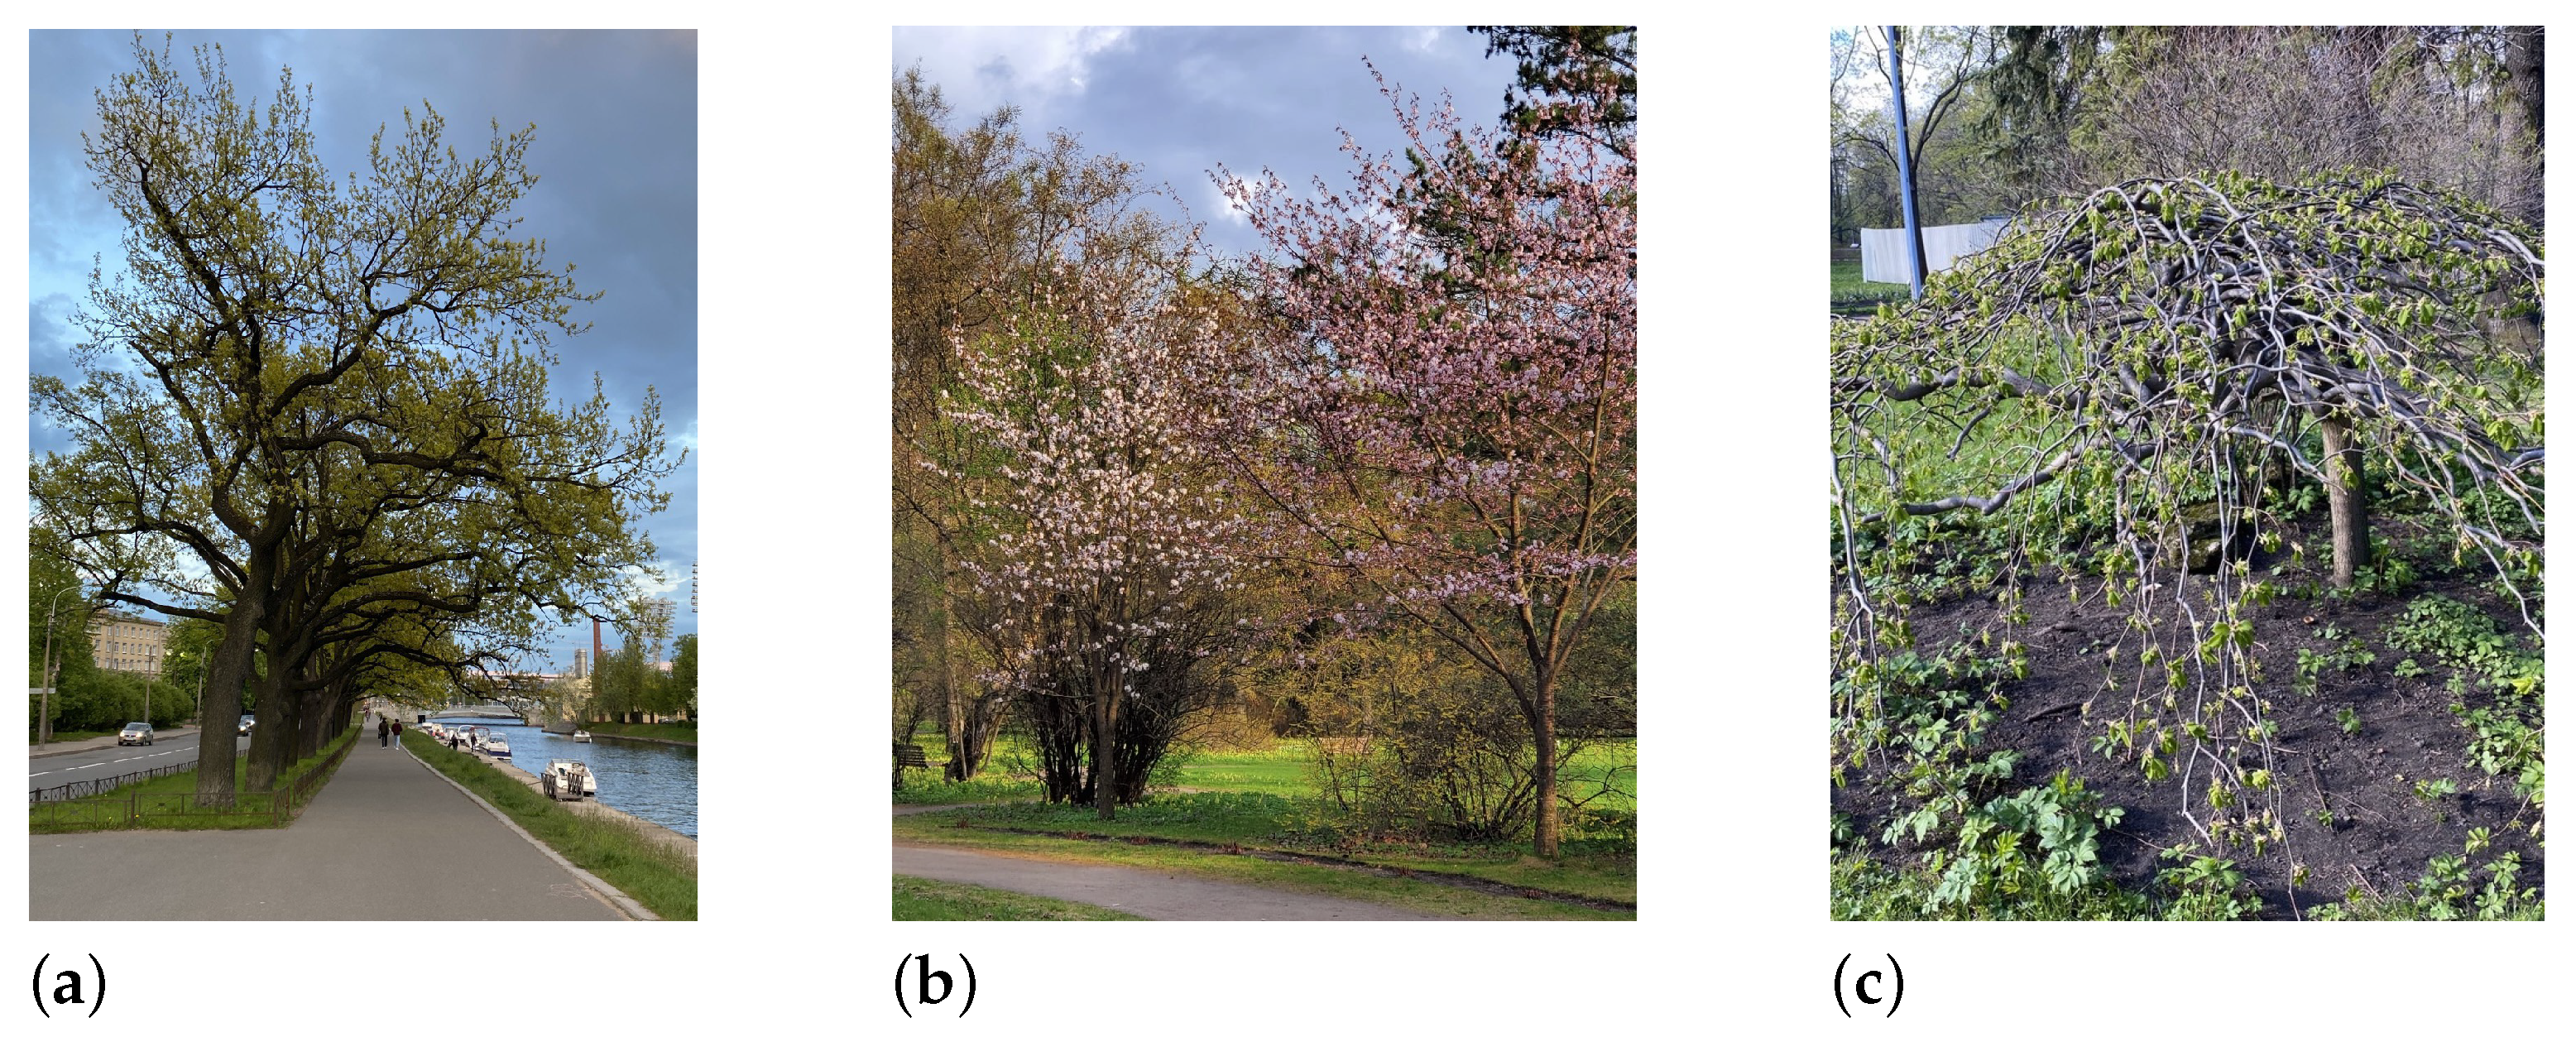
Figure 1. An example of the formation of green areas based on plants of the basic, additional and limited assortment. (a) Row planting of Quercus Robur on Zhdanovskaya Embankment in Saint Petersburg. (b) Prunus serrula in the park of the St. Petersburg Forest Technical University. (c) Ulmus glabra f. pendula in the Kirov Central Park on Yelagin Island in Saint Petersburg.
Sustainability 15 14905 g001
Figure 2. Procedure for modeling plant species composition.
Sustainability 15 14905 g002
Figure 3. Fragment of a matrix of relationships and combinations of plant species.
Sustainability 15 14905 g003
Figure 4. A complete graph of the relationships and combinations of plant species.
Sustainability 15 14905 g004
Figure 5. An illustration of an account of the range of plants growing in Saltykov-Shchedrin garden in Saint Petersburg, Russia.
Sustainability 15 14905 g005
Figure 6. An illustration of the compatibility of the plants growing in Saltykov-Shchedrin garden.
Sustainability 15 14905 g006
Figure 7. Illustration of a network model of plant species, taking into account co-growth precedents.
Sustainability 15 14905 g007
Figure 8. Visualization of plant compatibility. Correlations with plant life forms.
Sustainability 15 14905 g008
Figure 9. Algorithm for the application of a plant species model for the planning of urban green areas.
Sustainability 15 14905 g009
Figure 10. Locations of green areas.
Sustainability 15 14905 g010
Figure 11. Landscaped areas and vegetation factors.
Sustainability 15 14905 g011
Figure 12. Distribution of compositional improvement index values for all subgraph variants within the selected range of variation of the resolution parameter.
Sustainability 15 14905 g012
Figure 13. Recommended range of plant species for Saltykov-Shchedrin Garden and Benois Garden.
Sustainability 15 14905 g013
Table 1. The parameters and characteristics of the plants collected in the database.
DesignationParameterValue RangeDescription
1. Physical parameters of plants (P)
P1Crown sizeMetersAverage diameter of the crown
of an adult plant
P2HeightMetersAverage adult plant
2. Limiting factors (F)
F1USDA
Climate Zone
Number
of zone (1–8)
Each zone is defined by
temperature readings
F2Relation to
overcompaction
of soil
‘1’—carries
‘0’—can tolerate
‘−1’—does not tolerate
Resistance of plant species to growing
in soils subject to compaction due
to active movement of people
F3Relation to
soil salinization
‘1’—carries
‘0’—can tolerate
‘−1’—does not tolerate
Resistance of plant species to growing
in soils prone to pollution, excessive
salt content near roads treated with chemicals
F4Relation to soil
desiccation
‘1’—carries
‘0’—can tolerate
‘−1’—does not tolerate
Resistance of plant species to growing
in soils whose temporary condition
may be waterless and arid
F5Resistance to
waterlogging
‘1’—carries
‘0’—can tolerate
‘−1’—does not tolerate
Resistance of plant species to growing
in soils subject to temporary or spontaneous
retention of large quantities of water
in their composition
F6Smoke and
gas resistance
‘1’—carries
‘0’—can tolerate
‘−1’—does not tolerate
The ability of a plant to survive in
conditions of maximum air pollution
F7Wind resistance‘1’—carries
‘0’—can tolerate
‘−1’—does not tolerate
Ability to stay in open leeward spaces
F8Environmental group
in relation to moisture
1—xerophytes
2—mesophytes
3—hygrophytes
-
3. Soil parameters (S)
S1Soil acidity‘1’—prefers
‘0’—can tolerate
‘−1’—does not tolerate
Plant’s attitude to different acidic
compositions of soils: strongly acidic, acidic,
weakly acidic, neutral, weakly alkaline,
alkaline, strongly alkaline
S2Soil fertility‘1’—prefers
‘0’—can tolerate
‘−1’—does not tolerate
Plant’s relationship to soil fertility:
fertile, medium fertile, poor
S3Mechanical
composition of soil
‘1’—prefers
‘0’—can tolerate
‘−1’—does not tolerate
Relation of the plant to the type of soil:
sandy, sandy loam, loam, clay, stony,
rubbly, heavy, well-drained
4. Propagation intensity parameters (I)
I1Aggressiveness
of plant growth
‘1’—high
‘0’—medium
‘−1’—low
How actively the plant is able to spread
under normal growing conditions
I2Vitality‘1’—high
‘0’—medium
‘−1’—low
The ability of the plant to recover from
pruning, damage, fractures
I3Invasive1—is invasive
0—is not
-
5. Parameters of light conditions (L)
L1Relation to light‘1’—prefers
‘0’—can tolerate
‘−1’—does not tolerate
The ability of the plant to grow in varying
degrees of light in places with full light,
penumbra, shaded areas.
Table 2. An example of filling the database.
ParametersSilver BirchNorway MapleEuropean LarchDomestic Apple Tree
Sustainability 15 14905 i001Sustainability 15 14905 i002Sustainability 15 14905 i003Sustainability 15 14905 i004
Latin name:Betula pendula RothAcer platanoides L.Larix decidua MillMalus domestica
(Suckow) Borkh
Crown size7 m15 m12 m3 m
Height20 m30 m25 m5 m
USDA
Climate zone
3434
Relation to
overcompaction
of soil
−1−1−10
Relation to
soil salinization
−1−10−1
Relation to soil
desiccation
10−11
Resistance to
waterlogging
1−1−1−1
Smoke and
gas resistance
−1111
Wind resistance1111
Environmental group
in relation to moisture
MesophyteMesophyteMesophyteMesophyte
Soil acidityNeutral-alkaline
soils
Slightly
acidic-alkaline soils
Slightly
acidic-neutral soils
Neutral soils
Soil fertilityMedium-FertileFertileFertile
Medium-Fertile
Fertile
Medium-Fertile
Mechanical
composition of soil
Sandy loam, loamySandy loam, loamySandy loam, loamySandy loam, loamy
Aggressiveness
of plant growth
0100
Vitality11−11
Invasiveness
in northwest Russia
00, but has aggressive
propagation of
plants by seeds
00
Relation to lightFull light,
half shade
Full light,
half shade
Full lightFull light
Disclaimer/Publisher’s Note: The statements, opinions and data contained in all publications are solely those of the individual author(s) and contributor(s) and not of MDPI and/or the editor(s). MDPI and/or the editor(s) disclaim responsibility for any injury to people or property resulting from any ideas, methods, instructions or products referred to in the content.