Abstract
Increasing concentrations of atmospheric particulate matter (PM) can cause a serious threat to urban air quality and human health. To reduce PM pollution in urban environments, pragmatic screening and planting of tolerant tree species can be effective and sustainable ways. However, our understanding of the effects of the capture ability of PM2.5 on plant tolerance, and efforts to devise explicit assessment tools for suitability analysis for urban green belt plantations, are still inadequate. In this study, six common green tree species (Pinus tabuliformis, Abies holophylla, Juniperus chinensis, Salix babylonica, Robinia pseudoacacia, and Populus alba) from three pollution sites in Shenyang City, China, were collected in order to assess their PM2.5 capture ability, biochemical characteristics, leaf microstructures, and air pollution tolerance index (APTI). The results revealed that different sites and tested plant species can significantly affect the amount of PM2.5 retained by leaf surfaces. The PM2.5 retention amount of Abies holophylla was the highest at the SFH site and 1.41–8.89 times that of other tested species (p < 0.05). Morphological plant attributes, such as leaf surface roughness (r = 0.52 **) and contact angle (r = −0.57 **), were strongly related to the PM2.5 retention amount. The PM2.5 retention amount per unit leaf area had the strongest and most significant negative influence on total chlorophyll content (r = −0.743 **), indicating that the accumulation of leaf PM2.5 reduced the photosynthetic efficiency of the plants. Among the tested plants, Robinia pseudoacacia had the highest APTI value and was identified as the most resilient plant at all three sites, whereas Juniperus chinensis had the lowest APTI at all study sites. However, the integration of PM2.5 capture ability with APTI showed Pinus tabuliformis to be the best species for the construction of urban green belts in Shenyang City.
1. Introduction
Unplanned urbanization and rapid industrialization have significantly escalated atmospheric pollution, warranting nature-based solutions for sustainable urban environmental management [1]. Particulate matter (PM) pollution is widely recognized as an urban environment problem, especially in extensively populated developing countries [2,3]. The adverse effects of PM, especially PM2.5 (with a size less than 2.5 μm), on human health have been well-documented in the literature [4,5,6]. PM2.5 can penetrate the lungs and reach the alveolar space, causing severe damage to the normal functioning of the respiratory system [7]. As per previous data, PM2.5 pollution has resulted in the premature death of about 3.3 million people annually, which is considered the 13th leading cause of global human mortality [8].
Urban trees act as important sinks for PM, and using plants to ameliorate PM pollution has been widely identified as an environmentally friendly and sustainable approach [5,9,10]. Tree canopies can play a role in preventing the diffusion of PM by reducing wind speeds and PM mobility [11]. In addition, bark, branches, and especially leaves are the main carriers of PM retained by trees in the surrounding atmosphere [12,13,14]. PM arrives and is retained on the leaves’ surfaces through wet or dry deposition [13,15]. However, the PM retention efficiency of leaf surfaces can be influenced by the leaf microstructure (e.g., stomata, grooves, wettability, and trichomes) and structural features (e.g., surface roughness and size of waxy layers) [3]. For example, leaves with a rough surface, high stomatal density, leaf wettability, and wax content can minimize PM resuspension and increase PM’s accumulation efficiency [16].
However, plant growth can also be affected by the accumulation of PM on leaf surfaces [17]. At the morphological level, PM may lead to leaf necrosis, irregular cell border fusion, stomatal margin fuzziness, and increased wax volume [18,19]. At the physiological level, PM can adversely influence photosynthetic systems and gas exchange in plants by shading the foliage and blocking stomata [9,20,21]. In addition, PM enters the leaf through the stomata, and its chemical composition directly affects the physiological traits of the leaf. As reported by Giri et al. [22], exposure to cement dust leads to a rise in the pH of leaves, which in turn leads to degradation of the chlorophyll content. However, different plants also exhibit varying physiological responses toward the stress of PM pollutants [18,19]. Plants around the factories and alongside the streets can, therefore, be identified or screened as bio-monitors to provide a cost-effective and enviro-friendly technology to reduce air (PM) pollution and beautify the urban environment.
The air pollution tolerance index (APTI) is widely considered as an efficient tool for evaluating the resistance of plant species to air pollutants [6,16,17]. Four biochemical parameters, including ascorbic acid content, total chlorophyll content, leaf extract pH, and relative water content, can be used to assess APTI. Plants with higher APTI values are tolerant and act as air pollution sinks, and can therefore be preferred for green belt development. In contrast, tree species with lower APTI values are considered sensitive and act as bio-monitors of air pollution [23]. In order to better understand the tolerance of plants to pollutants, a more comprehensive index called the Anticipated Performance Index (API) had been developed to evaluate the overall influence of air pollutants on plants [24,25]. The API mainly includes the values of plants with biological, morphological, and socioeconomic characteristics, such as plant habits, leaf structure, and economic value [6,19]. Several studies have advocated for API as the preferred tool for the holistic assessment of tree species in terms of suitability for urban green-belt plantations [1,16,25]. However, previous studies have rarely considered PM’s capture ability when using API to assess plant suitability. Therefore, for better selection of urban greening tree species, it is necessary to propose a new method based on API that combines plant tolerance with PM’s capture ability at the leaf scale.
To fill these gaps, our study aimed to (1) analyze the leaf PM2.5 capture ability of the tested tree species; (2) assess the impact of PM2.5 load on the biochemical parameters of different tested plant species; and (3) combine the PM2.5 capture ability and APTI to estimate the suitability of the tested species to grow at selected sites. This study provides suggestions and references for the selection of green tree species in Shenyang, China, which can also be extrapolated to improve air quality in other similar urban areas.
2. Methods
2.1. Study Sites
Shenyang Agricultural University (SAU), Shenfu Highway (SFH), and Xinbei Thermal Power Plant (XBP) in Shenyang City, China, were chosen as the sampling sites (Figure 1). The sampling sites were as follows: (i) a campus green space as a control site (SAU), (ii) a busy road with high traffic flow and serious traffic pollution (SFH), and (iii) an industrial site in the urban center where the sources of pollution were dominated by industrial emissions (XBP).
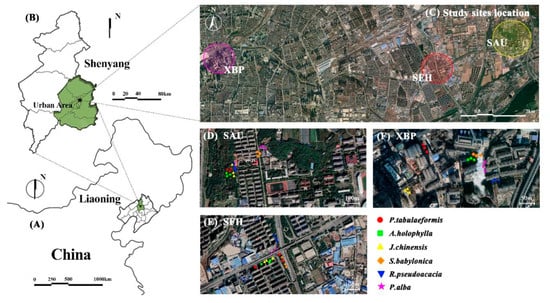
Figure 1.
Locations of study sites and sampled tree species. (A) Liaoning Province in China. (B) Shenyang. (C) The three study sites. (D) Shenyang Agricultural University (SAU). (E) Shenfu Highway (SFH). (F) Xinbei Thermal Power Plant (XBP).
2.2. Leaf Sample Collection
Six urban roadside plant species, Pinus tabuliformis Carr., Abies holophylla Maxim., Juniperus chinensis L, Salix babylonica L., Robinia pseudoacacia L., and Populus alba L., which are common to all three study sites, were selected for this study (Table S1). Leaf samples were collected in June and August 2022 to assess their PM deposition potential and subsequent effects on biochemical studies.
Sampling was generally performed on at least five dry days after the last rain. Healthy plant leaves (50 g) were randomly picked from 1.0 m to 3.0 m above the ground and immediately transferred to the lab without significant vibration to avoid PM dropping off the leaf surfaces. Finally, all samples were analyzed in the laboratory within 24 h of collection.
2.3. Amount of PM2.5 on Leaves
An improved weight difference method was used to directly quantify the amount of PM2.5 [2,23] (Figure 2). In this context, 500–600 cm2 of leaves were placed in a beaker, and 400 mL of distilled water was added to wash and soak the suspended particles. Furthermore, the washed suspension was stirred fully and transferred to filter papers, whose bore diameter was 2.5 µm, by using an extraction filtration apparatus. Finally, the mass of the suspension (dp < 2.5 µm) was dried in a hot oven at 80 °C. The filter was weighed using a precision balance (i-Quip-E6315; Aladdin, Shanghai, China) to calculate the quality of PM2.5 quality (m). To provide credible experimental results, the particle amount measurements for each replicate were performed at least three times.
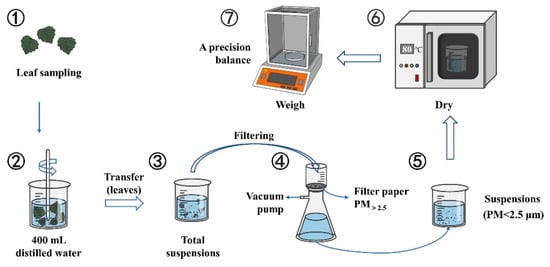
Figure 2.
Flowchart for measuring the PM amount accumulated on leaf surfaces.
The total leaf area for each sample (s) was calculated by scanning the leaves into black-and-white images using ImageJ software (1.52v; National Institutes of Health, Bethesda, MD, USA).
The PM2.5 amount per unit leaf area was calculated using the following formula:
where M is the weight of PM2.5 per unit leaf area, MPM2.5 is the total weight of PM2.5 in suspension, and S is the total sampled leaf area, respectively.
2.4. Leaf Microstructures
Four key leaf microstructures were considered in this study: surface roughness, contact angle, stomatal density, and groove width. Overall, these parameters describe the variation in leaf surface characteristics.
2.4.1. Leaf Surface Roughness
Atomic force microscopy (AFM; Dimension Icon, Bruker, Billerica, MA, USA) was used to quantify the leaf surface roughness. A square piece of leaf (5 × 5 mm2) was collected from each leaf sample and fixed on a metal disc. A probe with a maximum scanning area of 20 × 20 μm2, a 0.5 Hz scanning frequency, a 0.2 nm lateral resolution, and a 0.01 nm vertical resolution was focused at the center of the piece for scanning and photography. Two and three-dimensional image profiles of the leaf surface were then obtained. The arithmetic average leaf height was analyzed using the NanoScope analysis program and was then used as a proxy for surface roughness (Figure S1).
2.4.2. Contact Angle
The wettability of the leaf samples was characterized by the static contact angle. The relationship between wettability and contact angle is shown in Table S3. The contact angle was measured using a jc2000c1 static drop contact angle meter (Shanghai Zhongshan, China) and calculated using ImageJ software (1.52v; National Institutes of Health, Bethesda, MD, USA) (Figure S2). The detailed measurement methods were obtained from Zhang et al. [3].
2.4.3. Stomatal Density and Groove Width
The grooves and stomata on the leaf surfaces were characterized by scanning electron microscopy (SEM). The detailed measurement methods were obtained from Zhang et al. [3]. The stomatal density was evaluated according to the count of the number of stomata per unit leaf surface area. The groove width was quantified by measuring the average wrinkle width of the leaf samples using ImageJ software (1.52v; National Institutes of Health, Bethesda, MD, USA) (Figure S3).
2.5. Biochemical Parameters
2.5.1. Relative water content (RWC)
RWC was calculated by the following formulas:
where FW is the weight of fresh sampled leaves (g), TW is the weight of sampled leaves after soaking in deionized water overnight (g), and DW is the dry weight of sampled leaves (g).
2.5.2. pH of Leaf Extract (pH)
The pH was determined by homogenizing fresh leaf samples (2.5 g) in 25 mL of deionized water and measuring them using a pH meter.
2.5.3. Ascorbic Acid Content (AAC)
The 2,6-dichlorophenol indophenol method was used to calculate AAC [26]. One gram of each sample was extracted in 4% oxalic acid and diluted to 20 mL. The sample was then centrifuged for 5 min at 4500 rpm. After pipetting 5 mL of the supernatant, 10 mL of oxalic acid was added, and the mixture was titrated against the dye until it turned pink.
2.5.4. Total Chlorophyll Content (TCC)
Chlorophyll was extracted from 0.2 g of fresh leaf tissue using 10 mL 95% ethanol. The absorbance of the supernatant was read at 649 and 665 nm using a UV spectrophotometer (UV-4802H; UNICO, Franksville, WI, USA), and TCC was calculated using the following formula:
where A649 and A665 are the absorbances at 649 and 665 nm, respectively, m is the leaf sample quantity (g), and V is the volume of the leaf extract (L).
2.6. Air Pollution Tolerance Index (APTI)
The APTI values were calculated using RWC, pH, TCC, and AAC [27]:
where A is the AAC level (mg·g−1), T is the TCC level (mg·g−1), P is the pH level, and R is the RWC level (%).
Plant tolerance was classified according to the evaluation criteria of Ogunkunle et al. [28] (Table 1).

Table 1.
Categories of plant species based on air pollution tolerance index (APTI).
2.7. New Anticipated Performance Index (NAPI)
The New Anticipated Performance Index (NAPI) evaluation standards were determined based on the Anticipated Performance Index (API), which was used by Prajapati et al. [10] and improved for local climatic conditions. The parameters included plant tolerance, PM2.5 capture ability, and biological and socioeconomic characteristics, mainly including the landscape value of trees and the economic value of woods [19]. In this approach, to harmonize with biochemical parameters, we used PM2.5 retention per unit of leaf area to measure the PM capture ability of plants. Different grades (+ or −) were assigned to the plants based on their characteristics (Table 2) according to the evaluation criteria described in references [10,19,24].
Table 2.
Grading the suitability of plant species (+ or −) according to tolerance, ecological benefits, and biological and socio-economic characteristics.
The NAPI value was considered using the percentage score of each species. Each tree species received an NAPI value based on the percentage score, which was then used to group the plant species into categories ranging from “not recommended” to “best” (Table S4). The formula used to calculate the scores (%) was as follows:
2.8. Statistical Analysis
Microsoft Excel 2020, IBM SPSS 26.0, and Origin2022b were used for all statistical analyses. After confirmation of normality using the Shapiro–Wilk test, the variability of biochemical parameters, the amount of PM2.5, and leaf surface microstructures from different species and sites were analyzed using one-way ANOVA. Spearman correlation analysis was used to assess the relationships between APTI, PM2.5, and the biochemical parameters of the tested plants.
3. Results
3.1. The Captured PM2.5 Amounts of the Tested Tree Species
The PM2.5 amounts per unit leaf area in the six tested species are shown in Figure 3. The retained amounts of PM2.5 between the tested species and the different sites exhibited significant differences. The PM2.5 retention amount of the six tested species ranged from 35.38 μg·cm−2 to 314.40 μg·cm−2. A. holophylla had the highest PM2.5 retention amount at the SFH site, which was 1.41–8.89 times higher than the other tested species (p < 0.05). The captured PM2.5 depicted a decreasing trend among selected plants, i.e., A. holophylla (242.50 ± 119.63 μg·cm−2) > P. tabulaeformis (182.66 ± 78.37 μg·cm−2) > J. chinensis (150.43 ± 70.77 μg·cm−2) > P. alba (89.91 ± 44.88 μg·cm−2) > S. babylonica (72.09 ± 36.91 μg·cm−2) > R. pseudoacacia (45.39 ± 28.06 μg·cm−2). The average value of PM2.5 captured on the leaf surfaces of coniferous species (P. tabulaeformis, A. holophylla, and J. chinensis) was measured to be 2.78 times that of broad-leaved species (S. babylonica, R. pseudoacacia, and P. alba) (p<0.05). The average PM2.5 amount was the highest at the SFH site (165.34 ± 117.56 μg·cm−2) and the lowest (94.37 ± 61.08 μg·cm−2) at the SAU site.
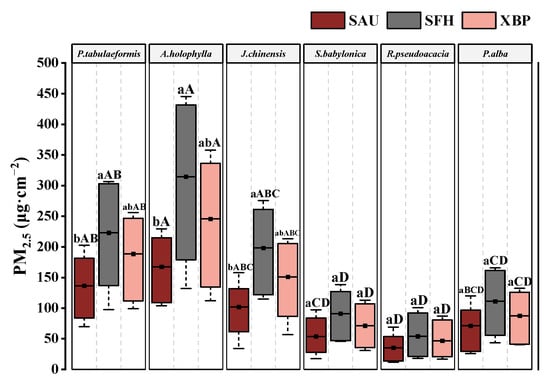
Figure 3.
The PM2.5 amounts of six tested species at the three sites. Data are presented as mean ± SE, n = 9. The amount of PM2.5 captured from different species and sites was analyzed by one-way ANOVA. Different lowercase letters show significant differences among different sites for the same tree species at p < 0.05; different capital letters show significant differences among different species for the same site at p < 0.05; and the same letters show no significant difference.
3.2. Relationship between Leaf Traits and PM2.5 Capture Ability
Significant variations in the leaf microstructure values were observed among the plant species and study sites (Table 3). P. tabuliformis had the highest roughness value (410.60 ± 20.11 nm) at the XBP site. On the contrary, the roughness value of S. babylonica was recorded at its lowest (75.47 ± 4.78 nm) at the SAU site, indicating that the leaf surfaces were relatively smooth. Among all tested species, the average contact angle values were calculated as the maximum (128.35° ± 4.47°) in the case of R. pseudoacacia at all three sites, thereby indicating that the leaf surface was hydrophobic or “non-wettable”. The leaf surfaces of A. holophylla and P. tabuliformis were wettable, with contact angle values ranging between 60° and 80° at all three sites. The stomatal density of the leaf surfaces exhibited considerable variation among different species and sites. R. pseudoacacia showed the highest stomatal density (194.9 ± 11.58 a·mm−2) at the XBP site, followed by P. alba (183.62 ± 17.67 a·mm−2) at the XBP site. The lowest values of stomatal density were observed in J. chinensis (34.27 ± 6.60 a·mm−2) at the SAU site. The stomatal density at different sites decreased in the order of XBP > SFH > SAU. Significant variations in the groove widths of the leaf surfaces were observed among the tested species. A. holophylla (16.7 ± 1.61 μm) had a mean groove width that was higher, 2.01 times than that of P. alba (8.32 ± 0.7 μm).
Table 3.
Leaf microstructures of the tested species. Data is represented as mean ± SE.
3.3. Biochemical Parameters of Each Species
The RWC, pH, TCC, and AAC of the tested species differed between the three sites (Figure 4). As shown in Figure 4A, J. chinensis (76.20 ± 4.15%) had a significantly lower RWC value than other species (p < 0.05), while S. babylonica (90.11 ± 3.03%) and R. pseudoacacia (88.26 ± 5.80%) exhibited significantly higher RWC values than other species (p < 0.05). The trends in pH and total chlorophyll content (TCC) values were similar among species (Figure 4B,C). R. pseudoacacia at the SAU site showed the highest values of pH (6.50 ± 0.18) and TCC (2.90 ± 0.32 mg·g−1), while P. tabulaeformis at the SFH site showed the lowest pH (3.43 ± 0.14) and TCC (0.47 ± 0.22 mg·g−1). Overall, the broadleaved species (S. babylonica, R. pseudoacacia, and P. alba) had higher pH and TCC values than the coniferous species (P. tabuliformis, A. holophylla and J. chinensis). The pH and TCC values gradually decreased at the polluted sites compared to those at the control sites. The maximum decreases in pH and TCC were observed in A. holophylla at the SFH site, with an 11.21% decrease in pH and 50% decrease in TCC. As shown in Figure 4D, R. pseudoacacia at the SAU site had the highest value of AAC (8.25 ± 2.17 mg·g−1), 3.49 times higher than J. chinensis at the XBP site, which was the lowest value (2.10 ± 0.56 mg·g−1).
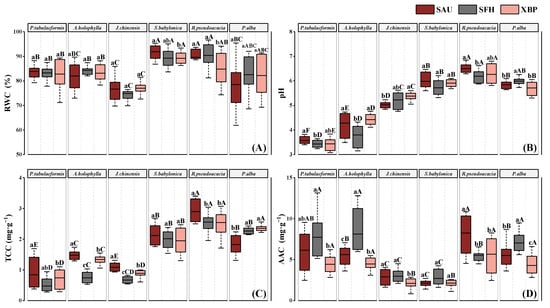
Figure 4.
The relative water content (RWC) (A), pH of Leaf Extract (pH) (B), total chlorophyll content (TCC) (C), and ascorbic acid content (AAC) (D) of the six species at the three study sites. Data are the mean ± SE, n = 9. Significant differences were analyzed using one-way ANOVA. Different lowercase letters show significant differences among different sites for the same tree species at p < 0.05; different capital letters show significant differences among different species for the same site at p < 0.05; and the same letters show no significant difference.
3.4. Differences in APTI Values
Figure 5 shows significant differences in the APTI values among the tested species (p < 0.05). R. pseudoacacia at the SAU site exhibited the highest APTI (16.73 ± 1.97), followed by P. alba at the SFH site (14.09 ± 1.49). J. chinensis had the lowest APTI value at all sites (9.24 ± 0.72). As shown in Figure 5, the APTI of the tested species was significantly different among three sampling sites (p < 0.05), and the tested species usually exhibited higher APTI at the SFH site (11.96 ± 1.96).
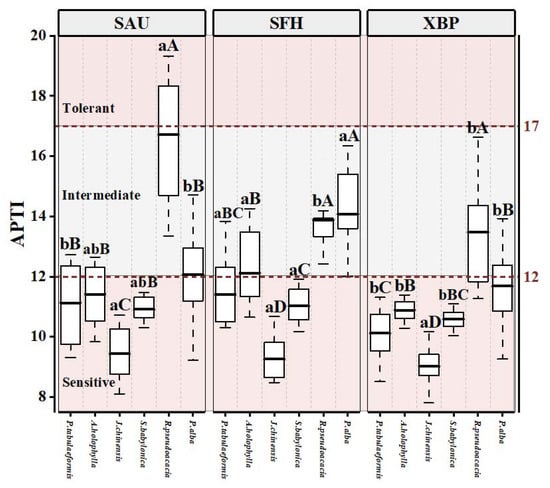
Figure 5.
APTI for six tree species at the three sampling sites (SAU: Shenyang Agricultural University; SFH: Shenfu Highway; XBP: Xinbei Thermal Power Plant). Different lowercase letters show significant differences among different sites for the same tree species at p < 0.05; different capital letters show significant differences among different species for the same site at p < 0.05; and the same letters show no significant difference.
3.5. Relationship between APTI and PM2.5
Figure 6 shows the correlations between the biochemical parameters, PM2.5, and APTI. An extremely significant positive correlation between APTI and the biochemical parameters was found (p < 0.01). In this respect, APTI showed the strongest correlation with AAC (r = 0.76, R2 = 0.56). However, APTI was negatively correlated with PM2.5 load in all tree species (r = 0.375, p < 0.01).
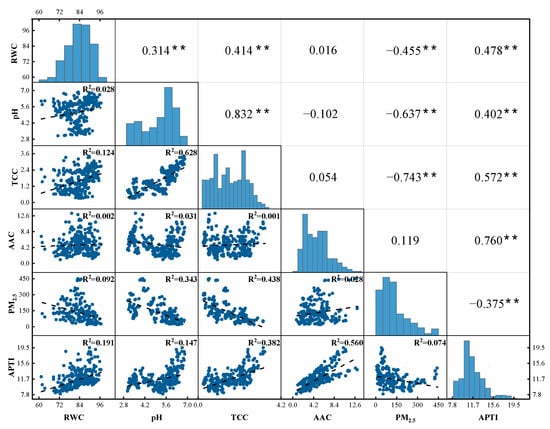
Figure 6.
Correlation coefficient among biochemical parameters (RWC, pH, TCC, and AAC), PM2.5 amount, and APTI. (**: p < 0.01).
Significant correlations were also discovered between the leaf PM2.5 amount and biochemical parameters (p < 0.01). For example, there was a weak negative relationship (r = −0.455) between leaf PM2.5 amount and RWC, and a stronger negative correlation with pH (r = −0.637 **) and TCC (r = −0.743 **). In contrast, no significant correlation was noted between AAC and the amount of PM2.5 (p > 0.05).
4. Discussion
4.1. PM2.5 Retention Ability between Tested Species
Plants can mitigate PM pollution through diffusion, interception, deposition, and combinations of these mechanisms [29], which play a key role in improving air quality in urban landscapes [30,31]. In this study, we found that different tree species and pollution sites significantly influenced the PM2.5 retention amount (Figure 2). Coniferous species had significantly higher capture capacities than broad-leaved species, which is consistent with previous studies [2,13,14]. Variations in leaf surface characteristics are important in determining the PM retention ability of plants [32]. Linear regression analysis (Figure 7) revealed that groove width and surface roughness had significant positive relationships with leaf surface PM accumulation (p < 0.05), whereas the contact angle and stomatal density exhibited significant negative correlations. These findings have been demonstrated in numerous studies [33,34]: for example, R. pseudoacacia had the highest stomatal density; however, the average PM2.5 captured by R. pseudoacacia was the lowest among the tested tree species. It is possible to calculate the front–back leaf stomatal density values. However, the majority of PM in R. pseudoacacia was discovered on the front–back side leaves, as opposed to the backside leaves. Consequently, the link between stomatal density and PM retention on the leaf surface remains ambiguous.
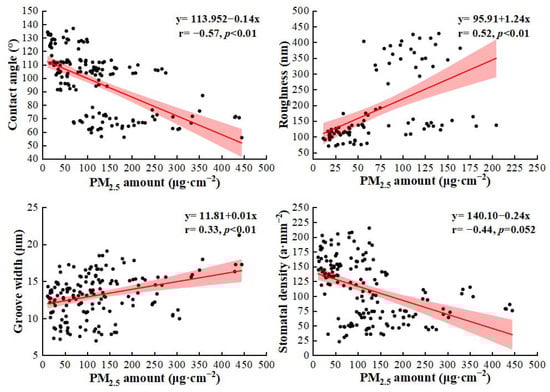
Figure 7.
Linear regression analysis between PM2.5 accumulation amount and leaf microstructures.
For all tested tree species, the highest PM2.5 amounts were found at the SFH site. The PM2.5 amount of J. chinensis captured on the leaf surface exhibited the greatest difference between sites and was 1.94 times higher at the SFH than at the SAU site. Overall, plants at the SFH and XBP sites had higher leaf PM capture abilities. This may be due to higher atmospheric PM concentrations at the SFH and XBP than at the SAU site. The SFH and XBP sites are close to traffic and industrial pollution sources. Molnar et al. [35] have reported traffic and industrial areas to have more human activity, and this can lead to unstable aerodynamic conditions that promote PM deposition on leaf surfaces. Increasing concentrations of airborne PM are more likely to be deposited on plant leaves [36], and a positive correlation between the PM2.5 retention ability of leaf surfaces and ambient PM2.5 concentration has also been reported in previous studies [37]. Although not mentioned in this study, these findings certainly emphasize the influence of environmental factors (including atmospheric PM concentrations and wind activity) on the ability of plants to capture PM, which should be the focus of future studies.
4.2. Effect of Biochemical Characteristics on APTI
The APTI represents the tolerance of tree species to atmospheric pollution, and a higher APTI value indicates greater tolerance to atmospheric pollution. According to the APTI grading evaluation standard (Table 1), all tested tree species were either sensitive or showed intermediate tolerance towards air pollution.
Significant differences were noted in APTI among the species, which may be due to the different biochemical defense mechanisms of the respective plants [38]. In the present study, R. pseudoacacia had the highest AAC values and was the most tolerant species. Correlation analysis showed that AAC was the most significant biochemical parameter for determining APTI in plants (Figure 6), which is consistent with other studies [25,39]. AAC is a natural antioxidant found in plants that reduces the toxicity of air pollutants [40]. AAC plays a key role in response to photosynthetic light and activates defense mechanisms [4]. Therefore, plants with high AAC levels are typically more tolerant [26].
The TCC also had a strong influence on APTI in this study. Chlorophyll affects plant metabolism, and a decrease in chlorophyll concentration directly corresponds to a decrease in plant growth, whereas high TCC concentrations facilitate the plant’s anti-pollution function [1,41]. R. pseudoacacia, a highly tolerant plant to PM pollution, was also observed to have the highest TCC among all the tested tree species. The TCC values of broad-leaved species were higher than those of coniferous species, which is probably associated with a low PM2.5 amount accumulated on the leaf surface [1] (Figure 6).
In addition, variation in leaf pH might also affect stomatal sensitivity [4]. High pH can enhance the effectiveness of the conversion of hexose sugars to ascorbic acid, thus improving plant tolerance to air pollution [42]. Conversely, leaves with lower pH values are more sensitive to PM pollution [16,41], such as P. tabulaeformis. RWC indicates the balance between water absorption and release in plants, which can contribute to the maintenance of physiological equilibrium under stressful conditions [28]. In general, plant species with higher RWC can better maintain plant physiological equilibrium and are more tolerant towards exposure to air pollutants, and vice versa [1]. Consequently, the significantly lower RWC of J. chinensis categorizes it as a species sensitive to air pollution. In the present study, we found that APTI values for plants varied at different sites. Several studies have reported that higher ambient PM pollution concentrations in the atmosphere, such as at the SFH site (a heavily traffic-polluted site), can lead to increased APTI values [43].
4.3. Impact of PM2.5 Capture Ability on NAPI
Plants with high NAPI values are often appropriate for use in urban areas or green belts. In this study, P. tabuliformis had the highest NAPI value and was the most appropriate for planting (Figure 8 and Table S5). PM can affect biochemical parameters [35], and the results showed that the amount of PM2.5 retained on the leaf surfaces had a significant negative effect on TCC, pH, and RWC (Figure 6). It has been observed that PM deposited on the leaf surface leads to water loss in the leaves and restricts chlorophyll production by reducing the photosynthetic area, blocking stomata, and altering cell membrane permeability [20,21]. When interacting with moisture, the acidic components of PM and gaseous pollutants lead to a decrease in the pH of the leaves [26]. Additionally, PM includes various oxidizing and reducing compounds that can influence the cellular metabolism by producing harmful free radicals, such as superoxide anions (O2−) and hydrogen peroxide (H2O2) [44].
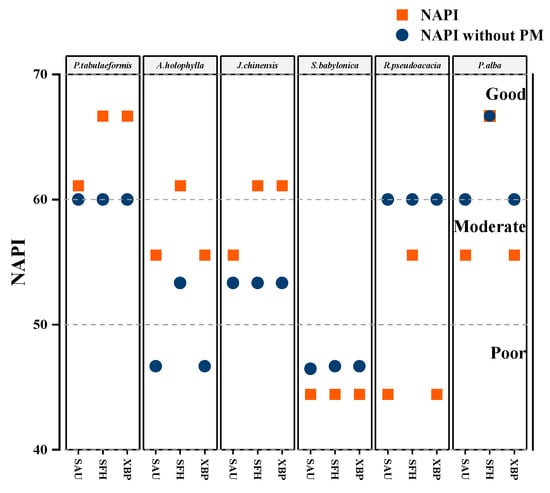
Figure 8.
Evaluation of the suitability of the tested tree species using two methods. One is the NAPI evaluation method used in this experiment, and the other is the evaluation method that removes the PM capture ability factor (NAPI without PM).
There was a significant negative correlation between the amount of PM2.5 and APTI (Figure 6), which could be the result of ascorbic acid being depleted in the process of scavenging cytotoxic free radicals generated in the chain reaction as oxidized contaminants penetrated the foliar tissue [41]. In this study, we also confirmed that PM2.5 capture ability has a critical effect on plant suitability (Figure 8). We suggest that tree species be planted in green belts after a combined assessment of PM2.5 capture ability and APTI, which would better ameliorate air (PM) pollution and sustain urban greenery.
4.4. Limitations and Future Directions
In this study, we determined the effect of PM2.5 on plant tolerance to pollution. However, due to the heterogeneous composition of PM, it is common to also include PM10 (coarse particles) and PM0.1 (ultrafine particles) [32,33]. Atmospheric polluting gases such as nitrogen oxides, ozone, and sulfur dioxide can also play very important roles in affecting plant growth [1,21]. For example, ozone and sulfur dioxide can enter into leaves through the stomata, and the process can cause stomatal closure and destroy chloroplasts, which curtail transpiration and photosynthesis [30]. In addition, various chemicals carried in PM, such as polycyclic aromatic hydrocarbons (PAHs), metals (Table S6), silica, and biological materials, may affect plant sensitivity and response [18,35]. The study area for this paper was established at three sites with different pollution levels, and the composition of PM and gas-phase pollutants generally differed between sites [3,24]. Therefore, the results of the comparison based only on the physics of PM (mainly the PM quality) in this study are very limited. Consequently, future studies should focus on the overall effects of gas-phase pollutants, PM size, and PM chemical composition of plants in order to better select urban greening species under the stress of air pollution.
5. Conclusions
Plant morphological attributes and leaf microstructures in ambient environments, especially leaf roughness and contact angle, are strongly related to PM2.5 capture ability. The amount of PM2.5 retention on leaf surfaces can significantly influence the leaf chlorophyll content, pH, and RWC. In the present context, A. holophylla and P. tabuliformis showed the greatest ability to capture PM2.5 among all tested plants, while the most ineffective species were R. pseudoacacia and S. babylonica. R. pseudoacacia exhibited the highest APTI value at the SAU site, followed by P. alba at the SFH site; conversely, the species with the lowest APTI was J. chinensis. According to the APTI and PM2.5 capture ability, P. tabuliformis had the highest NAPI value, indicating that it is the most suitable tree species for planting in the green belt. The plantation of tolerant tree species in green/shelter belts, through pragmatic assessment of PM2.5 capture ability coupled with APTI, can ameliorate air (PM) pollution and sustain urban greenery.
Supplementary Materials
The following supporting information can be downloaded at: https://www.mdpi.com/article/10.3390/su152014744/s1, Figure S1: The atomic force microscopy (AFM) images of leaf surfaces; Figure S2: Measurement image of leaf surface contact angle; Figure S3: Scanning electron microscope images of different tree species; Table S1: Basic growth condition of each tree species; Table S2: APTI values among different species and sites; Table S3: Relationship between contact angle and wettability; Table S4: API score, grade, and category for plant species; Table S5: New Anticipated Performance Index (NAPI) calculated by the PM2.5 capture capacity and APTI; Table S6: Pearson correlation coefficient between metal element content in PM and plant biochemical parameters, the amount of PM2.5 capture and APTI.
Author Contributions
Z.Z.: funding acquisition, supervision, project administration. M.L.: investigation, resources, software, data curation. P.K.R.: writing—review and editing, validation. Y.L.: software, data curation. P.T.: investigation, resources. W.Z.: conceptualization, methodology, formal analysis, data curation, writing—original draft, writing—review and editing. T.Z.: validation, formal analysis. H.M.: data curation, software. All authors have read and agreed to the published version of the manuscript.
Funding
This work was supported by the the Educational Department of Liaoning Province (01052922005); the National Science Foundation of China (31901361).
Institutional Review Board Statement
Not applicable.
Informed Consent Statement
Not applicable.
Data Availability Statement
All data generated or analyzed during this study are included in this published article and its Supplementary Information Files.
Conflicts of Interest
The authors declare no conflict of interest.
References
- Alotaibi, M.D.; Alharbi, B.H.; Al-Shamsi, M.A.; Alshahrani, T.S.; Al-Namazi, A.A.; Alharbi, S.F.; Alotaibi, F.S.; Qian, Y. Assessing the response of five tree species to air pollution in Riyadh City, Saudi Arabia, for potential green belt application. Environ. Sci. Pollut. Res. Int. 2020, 27, 29156–29170. [Google Scholar] [CrossRef] [PubMed]
- He, C.; Qiu, K.; Pott, R. Reduction of urban traffic-related particulate matter-leaf trait matters. Environ. Sci. Pollut. Res. Int. 2020, 27, 5825–5844. [Google Scholar] [CrossRef]
- Zhang, Z.; Gong, J.; Li, Y.; Zhang, W.; Zhang, T.; Meng, H.; Liu, X. Analysis of the influencing factors of atmospheric particulate matter accumulation on coniferous species: Measurement methods, pollution level, and leaf traits. Environ. Sci. Pollut. Res. Int. 2022, 29, 62299–62311. [Google Scholar] [CrossRef]
- Rai, P.K. Impacts of particulate matter pollution on plants: Implications for environmental biomonitoring. Ecotoxicol. Environ. Saf. 2016, 129, 120–136. [Google Scholar] [CrossRef] [PubMed]
- Nowak, D.J.; Hirabayashi, S.; Bodine, A.; Hoehn, R. Modeled PM2.5 removal by trees in ten U.S. cities and associated health effects. Environ. Pollut. 2013, 178, 395–402. [Google Scholar] [CrossRef] [PubMed]
- Pandey, A.K.; Pandey, M.; Mishra, A.; Tiwary, S.M.; Tripathi, B.D. Air pollution tolerance index and anticipated performance index of some plant species for development of urban forest. Urban For. Urban Green. 2015, 14, 866–871. [Google Scholar] [CrossRef]
- Guarnieri, M.; Balmes, J.R. Outdoor air pollution and asthma. Lancet 2014, 383, 1581–1592. [Google Scholar] [CrossRef] [PubMed]
- Lelieveld, J.; Evans, J.S.; Fnais, M.; Giannadaki, D.; Pozzer, A. The contribution of outdoor air pollution sources to premature mortality on a global scale. Nature 2015, 525, 367–371. [Google Scholar] [CrossRef] [PubMed]
- Kapoor, C.S.; Bamniya, B.R.; Kapoor, K. Efficient control of air pollution through plants, a cost-effective alternative: Studies on Dalbergia sissoo Roxb. Environ. Monit Assess 2013, 185, 7565–7580. [Google Scholar] [CrossRef]
- Prajapati, S.K.; Tripathi, B.D. Anticipated Performance Index of some tree species considered for green belt development in and around an urban area: A case study of Varanasi city, India. J. Environ. Manag. 2008, 88, 1343–1349. [Google Scholar] [CrossRef]
- Tong, Z.; Baldauf, R.W.; Isakov, V.; Deshmukh, P.; Zhang, K.M. Roadside vegetation barrier designs to mitigate near-road air pollution impacts. Sci. Total Environ. 2016, 541, 920–927. [Google Scholar] [CrossRef]
- Dzierzanowski, K.; Popek, R.; Gawronska, H.; Saebo, A.; Gawronski, S.W. Deposition of particulate matter of different size fractions on leaf surfaces and in waxes of urban forest species. Int. J. Phytoremediat. 2011, 13, 1037–1046. [Google Scholar] [CrossRef]
- Vigevani, I.; Corsini, D.; Mori, J.; Pasquinelli, A.; Gibin, M.; Comin, S.; Szwałko, P.; Cagnolati, E.; Ferrini, F.; Fini, A. Particulate Pollution Capture by Seventeen Woody Species Growing in Parks or along Roads in Two European Cities. Sustainability 2022, 14, 1113. [Google Scholar] [CrossRef]
- Li, Y.; Zhang, X.; Li, M.; Yin, S.; Zhang, Z.; Zhang, T.; Meng, H.; Gong, J.; Zhang, W. Particle resuspension from leaf surfaces: Effect of species, leaf traits and wind speed. Urban For. Urban Green. 2022, 77, 127740. [Google Scholar] [CrossRef]
- Chávez-García, E.; González-Méndez, B. Particulate matter and foliar retention: Current knowledge and implications for urban greening. Air Qual. Atmos. Health 2021, 14, 1433–1454. [Google Scholar] [CrossRef]
- Rai, P.K.; Panda, L.L.S. Dust capturing potential and air pollution tolerance index (APTI) of some road side tree vegetation in Aizawl, Mizoram, India: An Indo-Burma hot spot region. Air Qual. Atmos. Health 2014, 7, 93–101. [Google Scholar] [CrossRef]
- Gupta, G.P.; Kumar, B.; Kulshrestha, U.C. Impact and pollution indices of urban dust on selected plant species for green belt development: Mitigation of the air pollution in NCR Delhi, India. Arab. J. Geosci. 2016, 9, 1–15. [Google Scholar] [CrossRef]
- Banerjee, S.; Banerjee, A.; Palit, D. Morphological and biochemical study of plant species- a quick tool for assessing the impact of air pollution. J. Clean. Prod. 2022, 339, 130647. [Google Scholar] [CrossRef]
- Bui, H.-T.; Odsuren, U.; Kwon, K.-J.; Kim, S.-Y.; Yang, J.-C.; Jeong, N.-R.; Park, B.-J. Assessment of Air Pollution Tolerance and Particulate Matter Accumulation of 11 Woody Plant Species. Atmosphere 2021, 12, 1067. [Google Scholar] [CrossRef]
- Popek, R.; Przybysz, A.; Gawrońska, H.; Klamkowski, K.; Gawroński, S.W. Impact of particulate matter accumulation on the photosynthetic apparatus of roadside woody plants growing in the urban conditions. Ecotoxicol. Environ. Saf. 2018, 163, 56–62. [Google Scholar] [CrossRef]
- Masuch, G.; Kicinski, H.G.; Kettrup, A.; Boos, K.S. Single and Combined Effects of Continuous and Discontinuous O3 and SO2 Immission on Norway Spruce Needles: I. Histological and Cytological Changes. Int. J. Environ. Anal. Chem. 1988, 32, 187–212. [Google Scholar] [CrossRef]
- Giri, S.; Shrivastava, D.; Deshmukh, K.; Dubey, P. Effect of Air Pollution on Chlorophyll Content of Leaves. Curr. Agric. Res. J. 2013, 1, 93–98. [Google Scholar] [CrossRef]
- Simon, E.; Molnar, V.E.; Lajtos, D.; Bibi, D.; Tothmeresz, B.; Szabo, S. Usefulness of Tree Species as Urban Health Indicators. Plants 2021, 10, 2797. [Google Scholar] [CrossRef] [PubMed]
- Correa-Ochoa, M.; Mejia-Sepulveda, J.; Saldarriaga-Molina, J.; Castro-Jimenez, C.; Aguiar-Gil, D. Evaluation of air pollution tolerance index and anticipated performance index of six plant species, in an urban tropical valley: Medellin, Colombia. Environ. Sci. Pollut Res. Int. 2021, 29, 7952–7971. [Google Scholar] [CrossRef]
- Kaur, M.; Nagpal, A.K. Evaluation of air pollution tolerance index and anticipated performance index of plants and their application in development of green space along the urban areas. Environ. Sci. Pollut Res. Int. 2017, 24, 18881–18895. [Google Scholar] [CrossRef]
- Roy, A.; Bhattacharya, T.; Kumari, M. Air pollution tolerance, metal accumulation and dust capturing capacity of common tropical trees in commercial and industrial sites. Sci. Total Environ. 2020, 722, 137622. [Google Scholar] [CrossRef]
- Singh, S.K.; Rao, D.N.; Agrawal, M.; Pandey, J.; Naryan, D. Air pollution tolerance index of plants. J. Environ. Manag. 1991, 32, 45–55. [Google Scholar] [CrossRef]
- Ogunkunle, C.O.; Suleiman, L.B.; Oyedeji, S.; Awotoye, O.O.; Fatoba, P.O. Assessing the air pollution tolerance index and anticipated performance index of some tree species for biomonitoring environmental health. Agrofor. Syst. 2015, 89, 447–454. [Google Scholar] [CrossRef]
- Beckett, K.P.; Freer-Smith, P.; Taylor, G. Particulate pollution capture by urban trees: Effect of species and windspeed. Glob. Change Biol. 2000, 6, 995–1003. [Google Scholar] [CrossRef]
- Han, Y.; Lee, J.; Haiping, G.; Kim, K.-H.; Wanxi, P.; Bhardwaj, N.; Oh, J.-M.; Brown, R.J.C. Plant-based remediation of air pollution: A review. J. Environ. Manag. 2022, 301, 113860. [Google Scholar] [CrossRef]
- Xu, X.; Xia, J.; Gao, Y.; Zheng, W. Additional focus on particulate matter wash-off events from leaves is required: A review of studies of urban plants used to reduce airborne particulate matter pollution. Urban For. Urban Green. 2020, 48, 126559. [Google Scholar] [CrossRef]
- Weerakkody, U.; Dover, J.W.; Mitchell, P.; Reiling, K. Evaluating the impact of individual leaf traits on atmospheric particulate matter accumulation using natural and synthetic leaves. Urban For. Urban Green. 2018, 30, 98–107. [Google Scholar] [CrossRef]
- Wang, H.; Shi, H. Particle Retention Capacity, Efficiency, and Mechanism of Selected Plant Species: Implications for Urban Planting for Improving Urban Air Quality. Plants 2021, 10, 2109. [Google Scholar] [CrossRef]
- Wang, H.; Xing, Y.; Yang, J.; Xie, B.; Shi, H.; Wang, Y. The Nature and Size Fractions of Particulate Matter Deposited on Leaves of Four Tree Species in Beijing, China. Forests 2022, 13, 316. [Google Scholar] [CrossRef]
- Molnar, V.E.; Tozser, D.; Szabo, S.; Tothmeresz, B.; Simon, E. Use of Leaves as Bioindicator to Assess Air Pollution Based on Composite Proxy Measure (APTI), Dust Amount and Elemental Concentration of Metals. Plants 2020, 9, 1743. [Google Scholar] [CrossRef]
- Janhäll, S. Review on urban vegetation and particle air pollution–Deposition and dispersion. Atmos. Environ. 2015, 105, 130–137. [Google Scholar] [CrossRef]
- Li, Y.; Wang, S.; Chen, Q. Potential of Thirteen Urban Greening Plants to Capture Particulate Matter on Leaf Surfaces across Three Levels of Ambient Atmospheric Pollution. Int. J. Environ. Res. Public Health 2019, 16, 402. [Google Scholar] [CrossRef]
- Pandey, J.; Agrawal, M. Evaluation of air pollution phytotoxicity in a seasonally dry tropical urban environment using three woody perennials. New Phytol. 1994, 126, 53–61. [Google Scholar] [CrossRef]
- Zhang, W.; Zhang, Y.; Gong, J.; Yang, B.; Zhang, Z.; Wang, B.; Zhu, C.; Shi, J.; Yue, K. Comparison of the suitability of plant species for greenbelt construction based on particulate matter capture capacity, air pollution tolerance index, and antioxidant system. Environ. Pollut. 2020, 263, 114615. [Google Scholar] [CrossRef]
- Keller, T.; Schwager, H. Air pollution and ascorbic acid. Eur. J. For. Pathol. 1977, 7, 338–350. [Google Scholar] [CrossRef]
- Malav, L.C.; Kumar, S.; Islam, S.; Chaudhary, P.; Khan, S.A. Assessing the environmental impact of air pollution on crops by monitoring air pollution tolerance index (APTI) and anticipated performance index (API). Environ. Sci. Pollut Res. Int. 2022, 29, 50427–50442. [Google Scholar] [CrossRef] [PubMed]
- Singh, S.; Verma, A. Phytoremediation of air pollutants: A review. In Environmental Bioremediation Technologies; Springer: Berlin/Heidelberg, Germany, 2007; pp. 293–314. [Google Scholar] [CrossRef]
- Singh, S.; Pandey, B.; Roy, L.B.; Shekhar, S.; Singh, R.K. Tree responses to foliar dust deposition and gradient of air pollution around opencast coal mines of Jharia coalfield, India: Gas exchange, antioxidative potential and tolerance level. Environ. Sci. Pollut Res. Int. 2021, 28, 8637–8651. [Google Scholar] [CrossRef] [PubMed]
- Thompson, J.E. Airborne Particulate Matter. J. Occup. Environ. Med. 2018, 60, 392–423. [Google Scholar] [CrossRef] [PubMed]
Disclaimer/Publisher’s Note: The statements, opinions and data contained in all publications are solely those of the individual author(s) and contributor(s) and not of MDPI and/or the editor(s). MDPI and/or the editor(s) disclaim responsibility for any injury to people or property resulting from any ideas, methods, instructions or products referred to in the content. |
© 2023 by the authors. Licensee MDPI, Basel, Switzerland. This article is an open access article distributed under the terms and conditions of the Creative Commons Attribution (CC BY) license (https://creativecommons.org/licenses/by/4.0/).