Article

Predictive Analytics for Sustainable E-Learning: Tracking Student Behaviors

by
Naif Al Mudawi
1,
Mahwish Pervaiz
2,
Bayan Ibrahimm Alabduallah
3,*,
Abdulwahab Alazeb
1,
Abdullah Alshahrani
4,
Saud S. Alotaibi
5 and
Ahmad Jalal
6,*
1
Department of Computer Science, College of Computer Science and Information Systems, Najran University, Najran 55461, Saudi Arabia
2
Department of Computer Science, Bahria University, Islamabad 44000, Pakistan
3
Department of Information Systems, College of Computer and Information Sciences, Princess Nourah bint Abdulrahman University, Riyadh 11671, Saudi Arabia
4
Department of Computer Science and Artificial Intelligence, College of Computer Science and Engineering, University of Jeddah, Jeddah 21959, Saudi Arabia
5
Information Systems Department, Umm Al-Qura University, Makkah 24382, Saudi Arabia
6
Department of Computer Science, Air University, E-9, Islamabad 44000, Pakistan
*
Authors to whom correspondence should be addressed.
Sustainability 2023, 15(20), 14780; https://doi.org/10.3390/su152014780
Submission received: 23 June 2023 / Revised: 3 October 2023 / Accepted: 6 October 2023 / Published: 12 October 2023

Abstract

:
The COVID-19 pandemic has sped up the acceptance of online education as a substitute for conventional classroom instruction. E-Learning emerged as an instant solution to avoid academic loss for students. As a result, educators and academics are becoming more and more interested in comprehending how students behave in e-learning settings. Behavior analysis of students in an e-learning environment can provide vision and influential factors that can improve learning outcomes and guide the creation of efficient interventions. The main objective of this work is to provide a system that analyzes the behavior and actions of students during e-learning which can help instructors to identify and track student attention levels so that they can design their content accordingly. This study has presented a fresh method for examining student behavior. Viola–Jones was used to recognize the student using the object’s movement factor, and a region-shrinking technique was used to isolate occluded items. Each object has been checked by a human using a template-matching approach, and for each object that has been confirmed, features are computed at the skeleton and silhouette levels. A genetic algorithm was used to categorize the behavior. Using this system, instructors can spot kids who might be failing or uninterested in learning and offer them specific interventions to enhance their learning environment. The average attained accuracy for the MED and Edu-Net datasets are 90.5% and 85.7%, respectively. These results are more accurate when compared to other methods currently in use.

1. Introduction

Internet usage has rapidly increased during the last ten years. People are constantly using the Internet to carry out a variety of tasks, including studying, commerce, and research. The old classroom setting has given way to the new digital phenomena where computers aid in teaching [1,2,3,4]. Today, the Internet is a great resource for finding courses, seminars, credentials, and other educational activities. The efficiency of the traditional educational strategy still used at universities and other educational institutions has been called into question by this wave of instructional materials and e-learning [5,6]. As a result, these institutions are finding it difficult to redefine and restructure their approaches to offering information and education (Association of European Universities, 1996) [7]. Given the current student population, educational institutions are scrambling to develop online learning resources that will enable computer-assisted instruction in the classroom. There appear to be two main research areas in e-learning [8], one of which focuses on the creation of effective designs and the other on the evaluation of student satisfaction and behavior in relation [9] to the course as compared to a conventional face-to-face course.
E-learning has become a necessary and timely solution, as the global COVID-19 pandemic has particularly shown [10]. The COVID-19 pandemic caused global traditional education systems to experience formerly unprecedented disturbances. At the height of the pandemic, 195 nations and more than 1.5 billion students were affected by school closings, according to UNESCO [11]. Millions of students were affected by prolonged closures of schools and colleges to stop the spread of viruses [12].
E-learning quickly emerged as a vital resource to guarantee educational continuity during this crisis [13]. Technology-driven learning platforms helped educational institutions to adapt and offer remote learning possibilities as physical classrooms became inaccessible. The availability of a variety of courses and materials on e-learning platforms ensured that learning could continue despite the restrictions put in place by the pandemic [14].
We suggested a useful approach to evaluate human behavior during e-Learning, whether in a classroom or any public area setting, which was motivated by the importance of the engagement of learners in an e-learning environment. This system’s objective is to find anomalous behaviors [15] that are prohibited in educational settings. For instance, in any educational setting, sitting or standing and writing on a notebook or board are all permissible activities, but throwing objects, slapping, kicking, and taking naps are not. Any sort of e-learning environment should be able to use the suggested system to monitor and evaluate student behavior [16].
On the foundation of this idea, we offered a sophisticated predictive analytic system that can monitor and forecast student behavior in an online learning environment. The main contribution of this work is a fresh approach to analyzing and tracking the behavior of students during e-learning using a multimodal approach of feature extraction. To boost the accuracy of our system as compared to other state-of-the-art methods, we extracted features of objects with two different approaches, one at object level and one using a stick model [17] extracted from objects. Moreover, we tested our system using two different settings, one with emotion-based data and the other with action-based data.
With a focus on sustainable practices [18], this study aims to investigate and demonstrate the potential of these predictive analytics systems in e-learning environments. We intend to contribute to the long-term success of online education initiatives by focusing on the sustainability of e-learning and therefore providing a rich learning environment that may efficiently augment, and in some circumstances, replace traditional face-to-face education.
The identification of motion-based [19] elements that can be used to accurately detect pedestrian behavior is the key contribution to this research. The occlusion removal procedure is the other crucial component of this effort. If an occlusion [20] was discovered, we used the Hough transform [21] with a semi-circle to determine the pedestrian’s head parts, and then we used body parts estimation [22] to roughly determine how the silhouettes were laid out. Then, approximated zones were separated and occlusion was removed.
The article’s remaining sections are organized as follows: Section 2 presents related work; Section 3 covers the detailed methodology of the system followed by Section 4, where the experimental results are reported together with a comparison to comparable state-of-the-art HAR systems. Discussion on the pros and cons of the system has been presented in Section 5 and the paper is concluded in Section 6.

2. Related Work

The COVID-19 pandemic has accelerated the adoption of e-learning as an alternative to traditional classroom education [23]. As a result, educators and researchers are increasingly interested in understanding the behavior of students in e-learning environments [24]. Behavior analysis is a useful approach for studying student behavior in e-learning, as it can provide insights into factors that influence learning outcomes and inform the design of effective interventions [25]. Behavior analysis has been utilized in several types of research to look into how students behave in e-learning settings. The behavior of pupils during a computer-based training program, for instance, was examined by Kun et al. [26] using a microanalytic technique. They discovered that students who exhibited more active learning behaviors, such as taking notes and asking questions, outperformed passive learners in terms of their learning results. Similarly, Liu et al. [27] examined student behavior in a massive open online course (MOOC) using data mining tools. They discovered that students were more likely to finish the course and receive higher scores if they participated in more discussion forums and course activities. Some more research contributions are summarized in Table 1.
Most of the studies investigated in the literature focused on derived parameters like eye movement ratio, screen activity monitoring through their screen recording, and their interaction with the system but not on the real actions and emotions of students. This can predict their engagement level but not their real feelings and involvement in the subject. In this study, we take into account the conclusions of other scholars and suggest an efficient approach to examine student behavior during online learning. The basic motivation behind this work is to use the emotions and actions of students to analyze their behavior and identify prohibited actions during the class. Also, we have taken into account the variability in their behavior and have used several datasets containing a variety of activities taken in different settings to train our system to handle a variety of behaviors.

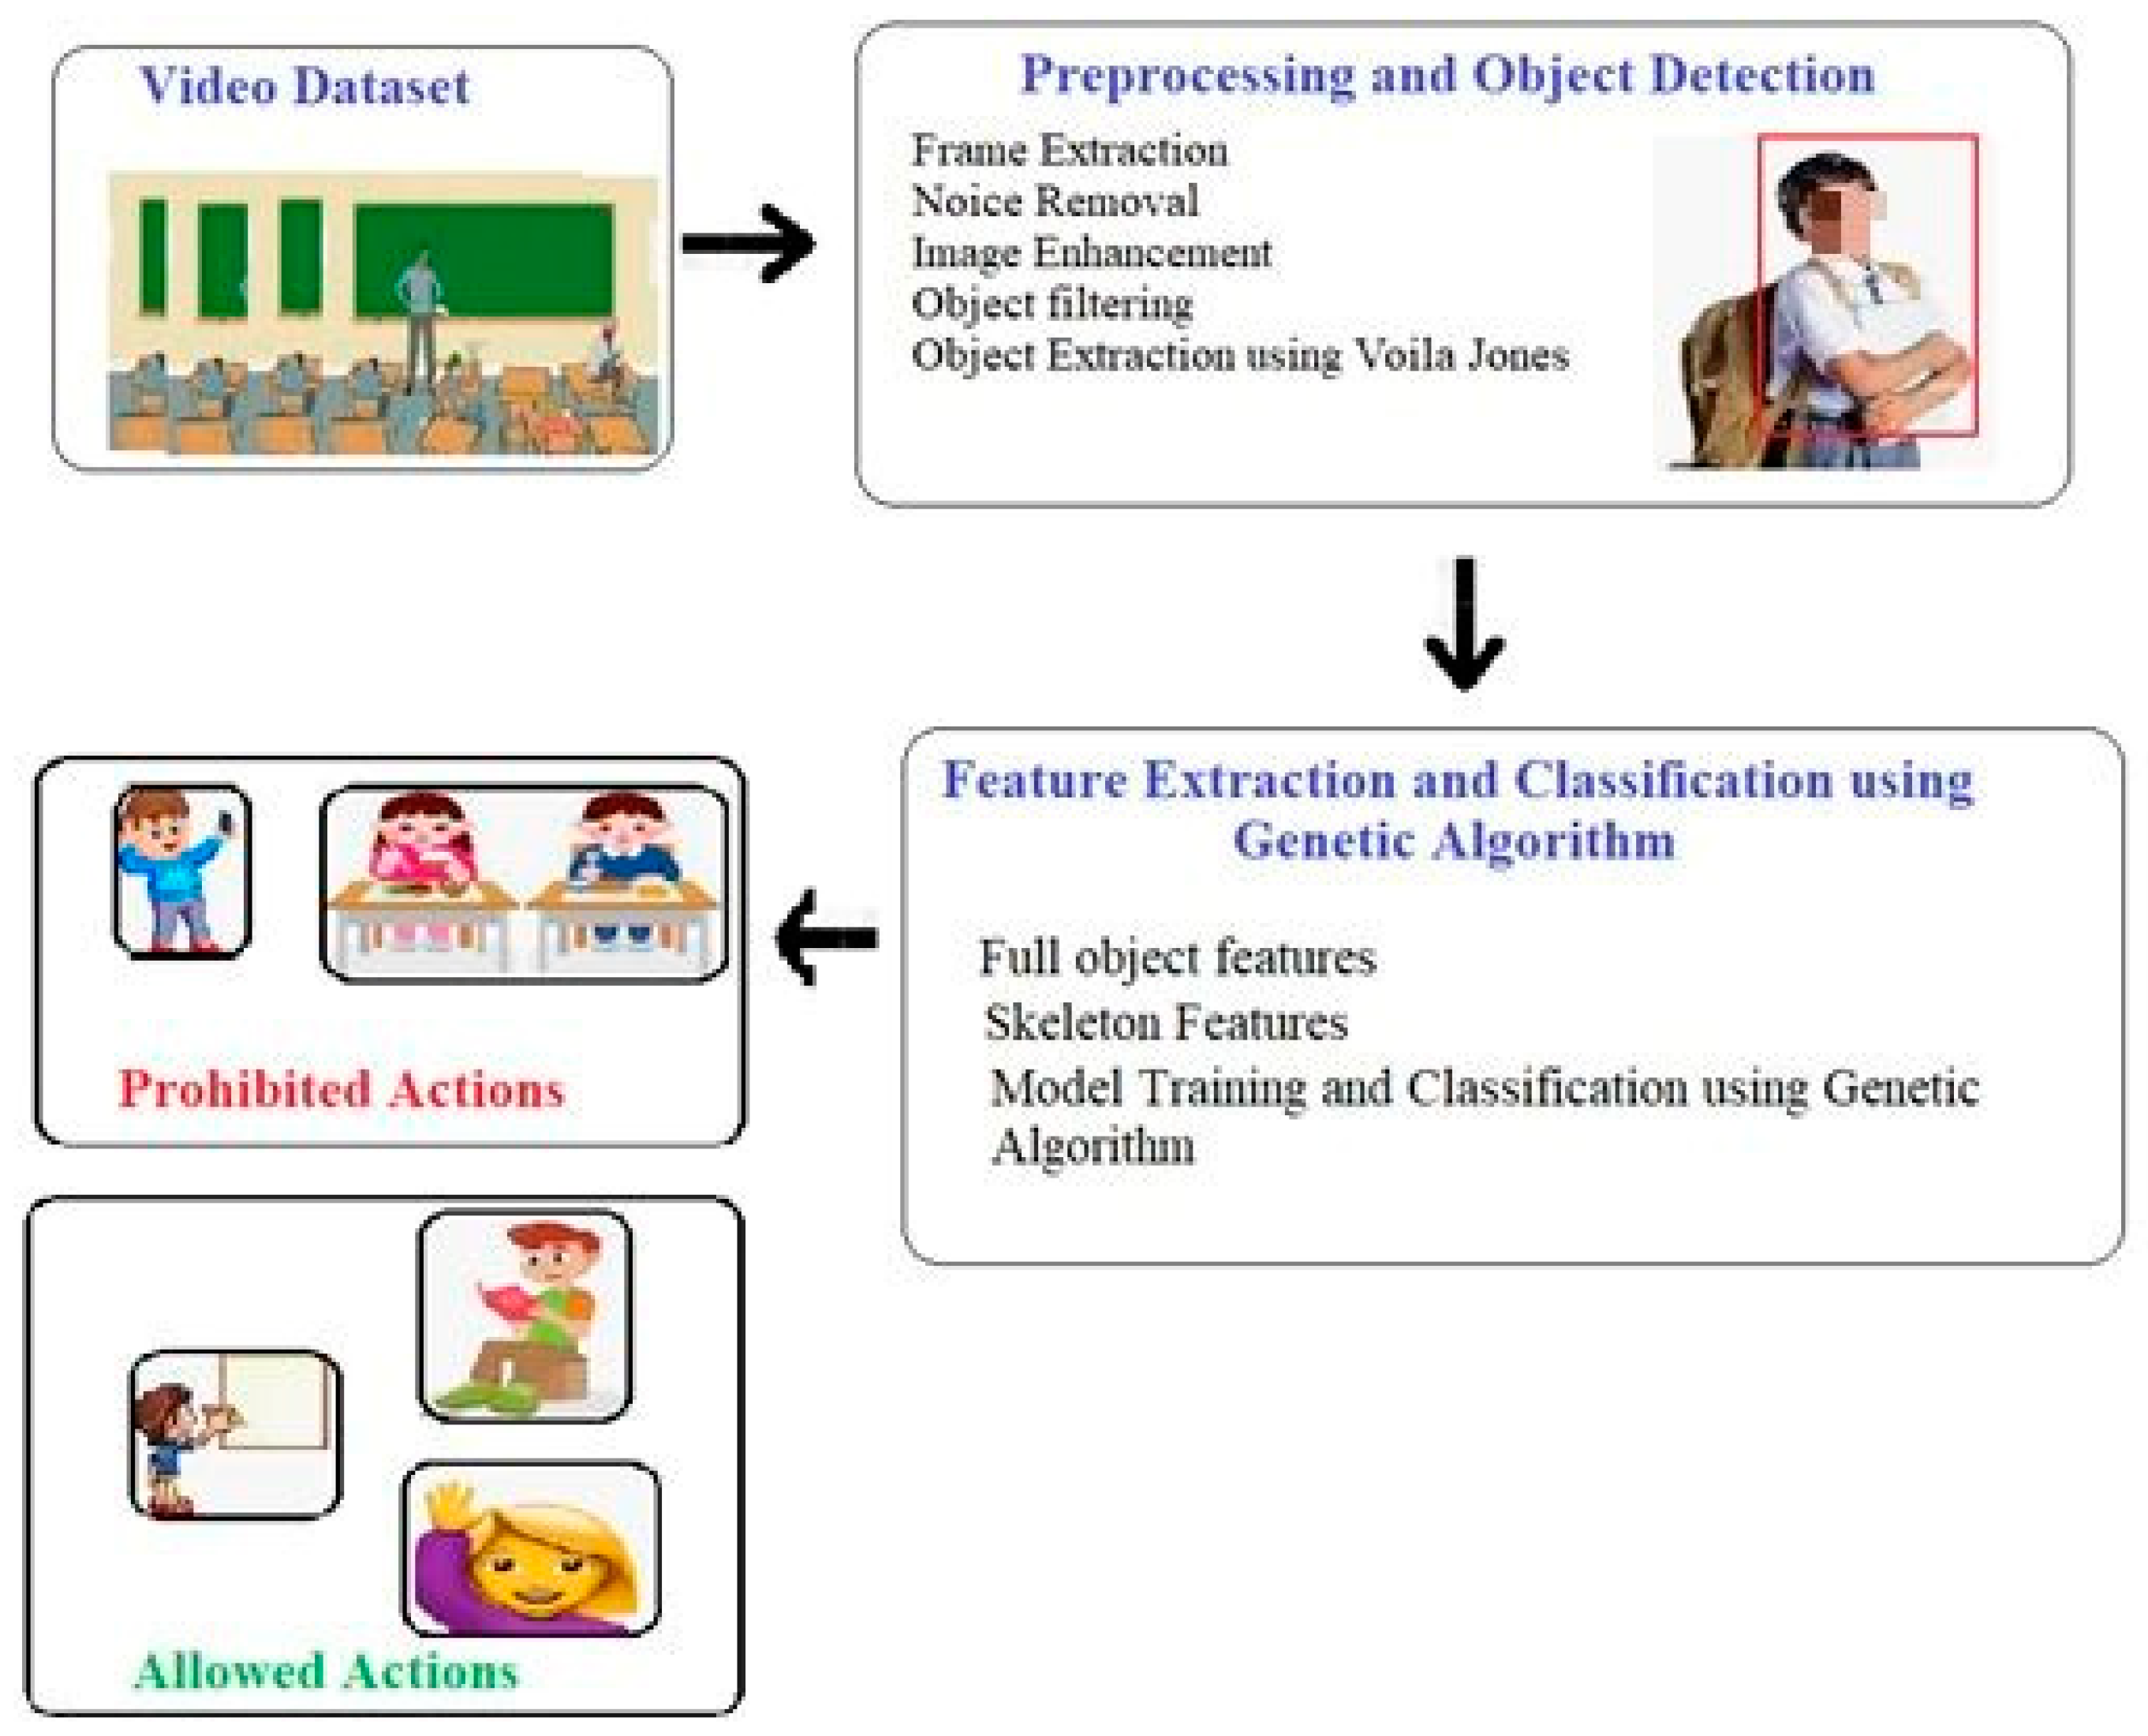
3. Proposed System Methodology

In this part, the suggested system methodology is explained. The entire workflow of the system is shown in Figure 1. The Motion Emotion Dataset (MED) [38] and Edu-Net datasets [39] have been chosen to assess the efficacy of the proposed technique in both indoor and outdoor settings, respectively. Six elements make up the system used to assess how well students behaved in an online learning environment. The complete algorithm has been presented in Algorithm 1.
Algorithm 1 Multistage processing to detect students’ behavior in e-Learning.
Input: Image (1)
Step 1: Preprocessing Phase
    1.1 Apply Noise Removal Techniques
       1_{denoised} = Denoise(l)
    1.2 Perform Image Enhancement
       I_{enhanced) = Enhance(l_{denoised})
    1.3 Apply Object Filtering
        I_{filtered) = Filter(I_{enhanced})
Step 2: Object Extraction
    2.1 Use Viola Jones Object Detection
        Detected_Objects = ViolaJones(l_{filtered})
Step 3: Feature Extraction
    3.1 Extract Full Object Features
       Full_Object_Features = CalculateStatistics(Detected_Objects)
    3.2 Generate Stick Model Skeleton
       Skeletons = ExtractSkeletons(Detected_Objects)
    3.3 Extract Skeleton Features
       Skeleton_Features = Measure Skeleton Attributes(Skeletons)
Step 4: Training and Classification using Genetic Algorithm
    4.1 Define Genetic Algorithm Parameters
       Parameters = DefineParameters()
    4.2 Initialize Population
       Population = InitializePopulation(Parameters)
    4.3 Evaluate Fitness
       Fitness_Values = EvaluateFitness(Population)
    4.4 Genetic Operations
       New:_Population = ApplyGeneticOperators(Population, Fitness_Values)
    4.5 Replace Population
       Population = New_Population
    4.6 Termination Criterion
       Termination = CheckTerminationCriterion()
Step 5: Classification and Result Analysis
    5.1 Select Best Features
       Best_Features = SelectBestFeatures(Population)
    5.2 Train Classifier
       Classifier = TrainClassifier(Best_Features)
    5.3 Perform Classification
       Classification_Results = Classifylmage(l, Classifier)
    5.4 Analyze Results
       Analysis_Metrics = Analyze ClassificationResults(Classification_Results)
Output: Behavior Type[Classification_Results]
End Algorithm
To achieve accurate and successful outcomes, a strong and multifaceted technique was used in the development of our system for monitoring student behaviors in the classroom. Preprocessing was the first phase of this procedure, which was performed to isolate important classroom items and remove background noise. Objects outside of the established threshold range were eliminated, leaving just the characteristic human layout. Our dataset contains a variety of outdoor locations and objects that may have difficult shadows; thus, an additional step was included to improve the quality of the human silhouettes. In order to show human forms more accurately and clearly, shadows had to be found and then eliminated [40].
We employed the template matching technique [41] to extract exclusively human data from the image data in order to improve the accuracy of our system. These steps came together to isolate and extract human silhouettes, which served as the basis for further analysis.
Continuing with our methodology, the next critical phase involved the extraction of features from the human silhouettes utilizing conditional random fields. This step allowed for a more comprehensive understanding of the various aspects of human behavior and posture within the classroom setting. To classify the activities performed by students as either allowed or prohibited, we employed a genetic algorithm [42]. This sophisticated algorithm played a pivotal role in categorizing and analyzing student behaviors, offering a dynamic and adaptive approach to the assessment of classroom activities. By integrating these various techniques and algorithms, our system was well equipped to accurately and efficiently track and categorize student behaviors, providing educators with valuable insights and tools for maintaining a conducive and productive learning environment.

3.1. Image Preprocessing

Our dataset was in the form of videos. The next step we performed was frame extraction from the video, and then we utilized each frame to preprocess the image. As seen in Equation (1), a special median filter has been used to remove noise and smooth the video frame images that were retrieved. Then, the foreground objects’ appearance was improved using image enhancement as shown in Figure 2.
The median filter opted to remove the noise from the frames extracted from video data according to Equation (1).
( u ,   v ) =   m { i ( u   +   i ,   v   +   j ) | ( u ,   v )     R }
In the following stage, we used gamma correction as provided in Equation (2) to enhance the brightness of the image. Results from the preprocessing step are shown in Figure 3.
( c ) =   I _ out   =   I _ in ^ γ

3.2. Object Extraction

Object extraction was performed using the Viola–Jones algorithm which involves Haar-like features extraction, Adaboost [43] training, and a cascade of classifier. The decision to use the Viola–Jones algorithm for human detection in the context of our research on monitoring student behaviors in the classroom was carefully examined and was influenced by a number of variables. We chose the Viola–Jones algorithm due to the specific benefits it offers within the scope of our project, despite the fact that deep learning-based algorithms have acquired significant popularity in recent years for their outstanding capabilities in object detection and categorization. The Viola–Jones technique is computationally effective and substantially faster than deep learning-based approaches. We were able to monitor and analyze student behaviors in a timely manner without adding a lot of latency due to its capacity to achieve real-time performance, even on hardware with constrained computational capabilities.
In comparison to deep learning-based techniques, the Viola–Jones algorithm also needs less training data. It can be difficult and time-consuming to gather a sizable dataset for deep learning models in a real-world classroom setting. The Viola–Jones method was a practical choice for our research because of its propensity to perform well with small datasets. Nextstep includes a set of rectangular Haar-like features defined to capture the difference between the object and background regions. Each feature was represented as the difference between the sum of pixel intensities in two rectangular regions. Using the Adaboost approach, a set of weak classifiers were trained on a set of positive and negative examples. Each weak classifier was trained to classify an image patch as containing the object or not based on a selected Haar-like feature [44], and then classifiers were combined into a cascade of strong classifiers. Each weak classifier in a strong classifier was trained to pass the positive data to the next stage while highly likely rejecting the background samples. The cascade of classifiers was applied to the input video frames by sliding a window over each frame and evaluating the objectness score for each window. The results are shown in Figure 4.
O ( x , y ) = i   α iT _ i ( f _ i ( x , y ) )

3.3. Feature Extraction

The feature extraction procedure for human silhouettes discovered by the layout verification module is described in this section. Full human silhouettes’ features were extracted, as well as the skeleton against each silhouette [45]. The features extraction outline is presented in Figure 5 and is divided into two directions.

3.3.1. Full Silhouette Features

The positions of each human silhouette in the current frame and the frame before it were obtained, as illustrated in Equation (4), and they were regarded as separate objects.
P ( I o , f ) = I x , y   O
where the current frame is represented by f and the current silhouette by o. Movement of centroid among successive frames concerning time was used to determine the distance for each silhouette using Equation (5).
d = ( x 2 x 1 ) 2 + ( y 2 y 1 ) 2
v e l o c i t y = d u d t
Then, the velocity [46] of each object was computed using Equation (6) and the distance was calculated using Equation (7); these factors were then used to distinguish between the allowed actions and prohibited actions.
θ = t a n 1 ( y x )
We first selected random points of the complete silhouette to describe the structure of the object, using Principal Component Analysis (PCA) [47] to determine the orientation of the object. The coordinates or position of the object should be disclosed for each data point. The dataset’s covariance matrix, which illustrates the connections between various dimensions of the data points, was then computed. The principle components were then obtained by applying PCA to the dataset. These elements were eigenvectors that showed where the data’s greatest variance occurs. We may determine the object’s fundamental orientation by examining the first principal component, which captures the most significant change. The orientation of the object can be inferred from the first principal component’s direction (See Figure 6).

3.3.2. Stick Model Features

Stick models were used to extract the features at the micro level. The human silhouette’s skeleton was first removed, and endpoints and junction nodes were located. Endpoints and junction points were utilized to draw the stick model in Figure 7 to demonstrate it. To connect the nodes, we employed the optical flow [33,34] of each node presenting the model, as well as the distance and angle between the slants.

3.4. Feature Optimization and Classification

The genetic algorithm [48] was utilized as a classifier, with each data point assigned to one of several predefined categories based on its features or attributes. To achieve this, the GA creates a set of candidate classifiers, each represented by a set of parameters that define its decision boundary [49]. The fitness of each classifier is evaluated by its ability to correctly classify a set of training data, and the GA evolves the population of classifiers by selecting the fittest ones and generating new ones through crossover and mutation operations. The process continues until satisfactory classification accuracy is achieved on the training data, and the final classifier can then be used to classify new, unseen data.
The main reason for using the GA for classification is that it can search a large solution space and discover complex decision boundaries that may be difficult to find using other methods. However, the effectiveness of the GA depends on various factors such as the quality of the training data, the choice of genetic operators, and the number of parameters in the classifier. Nonetheless, the GA remains a popular and powerful technique for data classification in various domains such as image recognition and bioinformatics. The general architecture of the genetic algorithm is displayed in Figure 8. Initially, a population of the potential solution was created, where each individual represents a solution and is evaluated by the fitness function. The solution with a higher fitness value was chosen to become a parent for the next generation and parents were combined to generate a new population; mutation was performed to avoid premature convergence. The cycle repeated until a satisfactory fitness level was achieved. Once it was terminated, the individual with the highest fitness value was considered as the best solution.

4. Experiments and Results

This section discusses the dataset and the specifics of the research, such as the experimental setup, the performance of the suggested system, and a comparison analysis with cutting-edge techniques.

4.1. Dataset

Two different datasets were used to evaluate the performance of the system in different environments and had different actions performed by multiple persons. The first dataset is made up of around 44,000 normal and abnormal video clips divided across 31 video sequences. The videos are 554 × 235 in resolution and were recorded at 30 frames per second using a fixed video camera that was raised above and looked down on specific paths. We only selected sample data having videos annotated with human emotions. Other datasets were collected from YouTube videos and recordings from actual classrooms in a range of settings, including those with different age ranges, class standards, and rural and urban settings. There are 200 video clips in each activity category within the 7851 total video clips that make up the produced dataset. Each video clip lasts between 3 and 12 s. The video lasts for about 12 h in total. The collection comprises recordings from actual classrooms as well as real videos from YouTube that have been uploaded by users from around the world. We chose videos recorded in the actual classroom environment as our sample data. We separated the samples of each class randomly into a training set, validation set, and test set, with a ratio of 80%, 10%, and 10%, according to the established dataset division rules [50]. Complete details of both datasets are given as follows.

4.1.1. MED (Motion Emotion Dataset)

Two significant segments in various indoor-outdoor situations can be found in the MED dataset [51]. One section includes video clips that demonstrate five distinct behaviors: panic, fighting, congested area, obstacle or strange object, and neutral. The other section, on the other hand, is made up of various video sequences that provide information on six distinct emotions: anger, happiness, excitement, fear, sadness, and neutrality.
31 actor-filled video clips make up the videos, and the dataset also includes numerous motorbikes and bicycles that behave as obstacles. The remaining 40% of the dataset is utilized for testing, with the remaining 60% used for training. Figure 9 displays a few instances of MED sceneries. We have combined these emotions in two classes and categorized all emotions and behavioral videos into allowed and prohibited behavior categories.

4.1.2. Edu Net Dataset

There are several videos of various e-learning-related acts on EduNet [52]. The dataset, which includes several teachers and pupils, was obtained from a classroom setting. Videos show a variety of permitted classroom behaviors, such as standing, writing on the board, raising hands, and maintaining a book in hand. Prohibited behaviors include eating, using a phone, and bouncing around during class. Figure 10 shows some examples of the EduNet dataset having multiple allowed and not allowed actions.

4.2. Performance Metric and Experimental Outcome

Precision [53] was chosen as the performance metric for our system evaluation to assess its effectiveness. Equation (8) was used to calculate precision [54],
Precision = t c ( t c + f c   ) ,
where tc represents the total number of prohibited actions classified correctly and fc represents the total number of false detected actions. The results of the MED and Edu-Net datasets are shown in Table 2. Classes are categorized into allowed and prohibited behavior and each subcategory has been evaluated.
The statistical analysis discussed in the preceding sections offers important insights into how well the suggested system performs in identifying and categorizing both permitted and forbidden behaviors in the MED and Edu-Net datasets. The performance metric of precision shows how well the system performs in correctly identifying actions while reducing false detections. A great overall performance is indicated by the average accuracy values for both datasets, which vary from 85.75% to 90.5%.
To visualize the results in more detail, those for each dataset are displayed separately in Figure 11 and Figure 12. The name of each subcategory that is used to evaluate the behavior is displayed on the X-axis, while the accuracy of each behavior is displayed on the Y-axis.
The area under the curve (AUC) [55], error equivalence rate (EER) [56], and decidability [57] are used to assess the performance across both datasets in greater detail. Figure 13 shows the combined performance of the two datasets. Additionally, the study is further enhanced by the use of additional performance indicators including AUC [55], EER [56], and decidability. AUC provides total performance measurements over all possible classification criteria [58]. The value of AUC might be between 0 and 1 [59]. EER is employed as a threshold parameter to indicate false acceptance and false rejection rates [60]. These metrics offer a thorough evaluation of the system’s capability to distinguish between permitted and unacceptable behavior while taking into account the trade-off between erroneous acceptances and false denials. A comprehensive assessment of the system’s capabilities across both datasets is provided by the combined performance measures shown in Figure 13.
The comparison with current cutting-edge approaches also reveals the advantages of the proposed technology. It performs better than conventional techniques in terms of precision and accuracy, demonstrating its promise as a cutting-edge approach to behavior identification in academic and practical settings. The significance of the study and its possible effects on enhancing security and monitoring in educational settings are highlighted by this comparison. Comparative analysis of the suggested approach and the existing method, which both used the same assessment datasets, was performed (See Table 3). Compared to other state-of-the-art methods, the proposed system performs admirably.

5. Discussion

Access to educational opportunities has been made simpler due to the growth of e-learning. However, concerns about student misconduct and reduced engagement have also arisen as a result of the increased use of e-learning platforms. A mechanism has been developed in place to solve this problem that looks at visual data to find students practicing unauthorized behaviors during online learning. This article offers a comprehensive overview of the system, its elements, and its functionality.
The preprocessing stage of the system, which aims to lower noise and improve image quality, is the first stage. The Viola–Jones technique [62] is then used for object detection to determine whether a person is present in the frame. By using template matching, it is possible to confirm that the identified object is a human. Each silhouette is subjected to skeleton extraction, and feature extraction is conducted for both skeleton points and human silhouettes. A genetic algorithm is then used for classification.
The system was assessed using a collection of videos of students engaging in online learning activities. The algorithm accurately identified 90.5% of the prohibited actions, including talking, using a phone, standing on a chair, and sleeping. The system’s performance was also assessed in terms of detection time, and it was found that it ran in real time with a frame rate of 30 frames per second.
An important area of interest in the realm of education is the assessment of student behaviors in e-learning. Understanding and observing student behavior has become essential for teachers and educational institutions to effectively help students and improve learning outcomes as a result of the rising popularity of online learning platforms. The objective of this discussion is to critically examine student behavior assessment in online learning and its implications for educational practices.
There is a potential connection between HAR outcomes and e-learning. HAR technology could be used to track student involvement and engagement in online learning. Educational systems could assess students’ levels of engagement, interaction, and participation by examining video feeds from online classes. With the help of this data, instructional strategies might be customized, and online learning could be made better overall. Gaining insights into students’ involvement, participation, and learning progress is one of the main benefits of evaluating student actions in e-learning. Using this data, instructors can identify children who might be failing or uninterested in learning and offer them specific interventions to enhance their learning environment.
Additionally, e-learning assessments of student behavior enable personalized and adaptive learning processes. Educational platforms can produce data-driven recommendations and personalized feedback based on the behaviors and preferences of individual students by utilizing predictive analytics and machine learning algorithms. This tailored strategy improves learning outcomes by making sure that resources and activities are tailored to the individual needs of the students while also increasing their enthusiasm to learn.
The evaluation of student behavior in e-learning does not, however, come without difficulties and restrictions. When gathering and examining student data, privacy issues and ethical problems must be carefully considered. Educational organizations must make sure that data collecting procedures are open and that they seek student consent while protecting the security and confidentiality of the data collected. Additionally, there is a danger of placing an undue reliance on quantitative behavioral measurements, which could mean ignoring the qualitative components of student engagement and learning. To fully understand student behaviors in e-learning, a balanced strategy combining quantitative and qualitative assessment methodologies is required.
With an emphasis on sustainability, the blending technologies of AI, digital transformation, IoT, and edge computing show enormous potential in transforming the landscape of e-learning. Educational institutions can use the potential of data-driven insights to customize learning experiences for specific students by integrating AI into e-learning. This includes fast feedback, automated grading, and recommendations for tailored material. In addition, interactive components like virtual labs, simulations, and AR/VR applications can be incorporated into the digital transformation process to go beyond the limitations of traditional online lectures. These developments encourage increased comprehension and involvement among students, converting inactive learning into active participation.
Alongside these developments, the Internet of Things (IoT) can make real-time data collecting easier and provide educators with insightful data on student behavior, preferences, and performance. This data can be handled locally when used in conjunction with edge computing, allowing for quick answers and fluid communication in the e-learning environment. By minimizing the environmental impact connected with physical infrastructure and travel-related emissions, e-Learning links education with sustainability aims. In addition to revolutionizing e-learning, this comprehensive integration of technology demonstrates a dedication to open, individualized, and environmentally responsible education.
In conclusion, there are many important benefits of using predictive analytics to monitor student behavior in sustainable e-learning. First of all, it enables educators to monitor student engagement, involvement, and performance in real-time, allowing them to quickly identify at-risk pupils and step in to intervene and give the required support. Second, the approach provides students with a personalized learning experience by adapting interventions and content to their unique behaviors and requirements. This not only improves the quality of learning overall but also increases the retention of students. Additionally, predictive analytics can offer insightful data on the efficiency of different teaching methods and materials, assisting in curriculum optimization and ongoing curriculum improvement. Additionally, it lessens resource waste and dropout rates, which contribute to the sustainability of e-learning and make it an important tool in the changing environment.
Although predictive analytics in sustainable e-learning has a lot of potential, it is not without difficulties and drawbacks. The ethical use of data is one important worry, as tracking and analyzing student behavior can lead to privacy concerns, if not handled appropriately. It is essential to make sure that data are secure and anonymous. Additionally, the quantity and quality of data obtained, which can occasionally be constrained or biased, have a significant impact on how accurate predictive models are. Additionally, there is a chance that an excessive dependence on algorithms and statistics will lead to a potential disregard for the value of qualitative insights and human contact in education. The use of data-driven decision making and instructional knowledge should be balanced by educators.
Despite these obstacles, the proposed approach’s importance to the area of study cannot be emphasized enough because it provides a potent instrument for improving student performance and institutional advancement while enhancing the sustainability and effectiveness of e-learning. Future research should concentrate on improving the system’s flaws to boost performance. If you want to increase system coverage and decrease the effects of occlusion, think about using multiple cameras to increase the system’s accuracy in detecting illicit activities. Researchers are also looking into the use of additional sensors, such as microphones. Additional research can examine the incorporation of machine learning methods like deep learning to boost the system’s accuracy and detection speed.
Additionally, it is critical to recognize that the application of predictive analytics and monitoring systems for sustainable e-learning is an area that is always changing. New opportunities and difficulties will arise as technology develops and our comprehension of student behavior grows. To expand and improve these systems and guarantee their continued efficacy and morality, ongoing research and development are required. Additionally, the research of multisensor techniques and the incorporation of cutting-edge technologies like deep learning will probably improve the precision and thoroughness of these systems. The sustained success of these projects will also depend on creating a collaborative atmosphere where educators, data scientists, and policy makers can cooperate to find the ideal balance between data-driven decision making and the human aspect in education. In the end, predictive analytics has the potential to provide sustainable e-learning, but to fully realize its potential while resolving its drawbacks, constant diligence and innovation are needed.

6. Conclusions

E-learning is the top trending source of education in this era especially after the COVID-19 pandemic. Educators and researchers are paying more attention to improving e-learning systems. The behavior of students and their engagement level is the most important factor of the e-learning system. This system was implemented to identify the behavior of students in an e-learning environment. Multiple datasets were used to evaluate the performance of this system. Videos were converted into frames and then objects were segmented to narrow down the region of interest. Features for each object and its skeleton models were used to characterize the behavior of students. Datasets were divided into allowed and prohibited behaviors. Experiments were performed and an average accuracy of 89% and 85.5% was achieved on both datasets.

Author Contributions

Validation, M.P. and N.A.M.; Formal analysis, N.A.M., M.P. and A.A. (Abdulwahab Alazeb); Investigation, B.I.A.; Resources, B.I.A. and A.A. (Abdullah Alshahrani); Data curation, N.A.M.; System Implementation ,Writing—original draft, M.P .(Mahwish Pervaiz); Writing—review & editing, A.A. (Abdulwahab Alazeb), A.A. (Abdullah Alshahrani) and S.S.A.; Supervision, A.J. All authors have read and agreed to the published version of the manuscript.

Funding

Princess Nourah bint Abdulrahman University Researchers Supporting Project number (PNURSP2023R440), Princess Nourah bint Abdulrahman University, Riyadh, Saudi Arabia. The authors are thankful to the Deanship of Scientific Research at Najran University for funding this work under the Research Group Funding program grant code (NU/RG/SERC/12/6).

Acknowledgments

Princess Nourah bint Abdulrahman University Researchers Supporting Project Number (PNURSP2023R440), Princess Nourah bint Abdulrahman University, Riyadh, Saudi Arabia.

Conflicts of Interest

The authors declare that they have no conflict of interest to report regarding the present study.

References

  1. James, R.J.E.; Tunney, R.J. The need for a behavioral analysis of behavioral addiction. Clin. Psychol. Rev. 2017, 52, 69–76. [Google Scholar] [CrossRef] [PubMed]
  2. Miah, S.J.; Vu, H.Q.; Gammack, J.; McGrath, M. A big data analytics method for tourist behaviour analysis. Inf. Manag. 2017, 54, 771–785. [Google Scholar] [CrossRef]
  3. Zhang, X.; Wen, S.; Yan, L.; Feng, J.; Xia, Y. A Hybrid-Convolution Spatial–Temporal Recurrent Network for Traffic Flow Prediction. Comput. J. 2022, bxac171. [Google Scholar] [CrossRef]
  4. Li, B.; Tan, Y.; Wu, A.; Duan, G. A distributionally robust optimization based method for stochastic model predictive control. IEEE Trans. Autom. Control. 2021, 67, 5762–5776. [Google Scholar] [CrossRef]
  5. Matthew, T.; Banhazi, T.M. A brief review of the application of machine vision in livestock behavior analysis. Agrárinform./J. Agric. Inform. 2016, 7, 23–42. [Google Scholar]
  6. Jaganeshwari, K.; Djodilatchoumy, S. An Automated Testing Tool Based on Graphical User Interface with Exploratory Behavioural Analysis. J. Theor. Appl. Inf. Technol. 2022, 22, 6657–6666. [Google Scholar]
  7. Michalis, V.; Nikou, C.; Kakadiaris, I.A. A review of human activity recognition methods. Front. Robot. AI 2015, 2, 28. [Google Scholar]
  8. Qian, L.; Zheng, Y.; Li, L.; Ma, Y.; Zhou, C.; Zhang, D. A New Method of Inland Water Ship Trajectory Prediction Based on Long Short-Term Memory Network Optimized by Genetic Algorithm. Appl. Sci. 2022, 12, 4073. [Google Scholar] [CrossRef]
  9. Guo, F.; Zhou, W.; Lu, Q.; Zhang, C. Path extension similarity link prediction method based on matrix algebra in directed networks. Comput. Commun. 2022, 187, 83–92. [Google Scholar] [CrossRef]
  10. Ferhat, A.; Mohammed, S.; Dedabrishvili, M.; Chamroukhi, F.; Oukhellou, L.; Amirat, Y. Physical human activity recognition using wearable sensors. Sensors 2015, 15, 31314–31338. [Google Scholar]
  11. Xie, X.; Xie, B.; Cheng, J.; Chu, Q.; Dooling, T. A simple Monte Carlo method for estimating the chance of a cyclone impact. Nat. Hazards 2021, 107, 2573–2582. [Google Scholar] [CrossRef]
  12. Gupta, N.; Gupta, S.K.; Pathak, R.K.; Jain, V.; Rashidi, P.; Suri, J.S. Human activity recognition in artificial intelligence framework: A narrative review. Artif. Intell. Rev. 2022, 55, 4755–4808. [Google Scholar] [PubMed]
  13. Jiang, H.; Wang, M.; Zhao, P.; Xiao, Z.; Dustdar, S. A Utility-Aware General Framework With Quantifiable Privacy Preservation for Destination Prediction in LBSs. IEEE/ACM Trans. Netw. 2021, 29, 2228–2241. [Google Scholar] [CrossRef]
  14. Long, W.; Xiao, Z.; Wang, D.; Jiang, H.; Chen, J.; Li, Y.; Alazab, M. Unified Spatial-Temporal Neighbor Attention Network for Dynamic Traffic Prediction. IEEE Trans. Veh. Technol. 2023, 72, 1515–1529. [Google Scholar] [CrossRef]
  15. Xiao, Z.; Li, H.; Jiang, H.; Li, Y.; Alazab, M.; Zhu, Y.; Dustdar, S. Predicting Urban Region Heat via Learning Arrive-Stay-Leave Behaviors of Private Cars. IEEE Trans. Intell. Transp. Syst. 2023, 24, 10843–10856. [Google Scholar] [CrossRef]
  16. Wang, W.; Liu, A.X.; Shahzad, M.; Ling, K.; Lu, S. Understanding and modeling of wifi signal based human activity recognition. In Proceedings of the 21st Annual International Conference on Mobile Computing and Networking, Paris, France, 7–11 September 2015; pp. 65–76. [Google Scholar]
  17. Abdulmajid, M.; Pyun, J.-Y. Deep recurrent neural networks for human activity recognition. Sensors 2017, 17, 2556. [Google Scholar]
  18. Ortiz, R.; Jorge, L.; Oneto, L.; Samà, A.; Parra, X.; Anguita, D. Transition-aware human activity recognition using smartphones. Neurocomputing 2016, 171, 754–767. [Google Scholar] [CrossRef]
  19. Chen, G.; Chen, P.; Huang, W.; Zhai, J. Continuance Intention Mechanism of Middle School Student Users on Online Learning Platform Based on Qualitative Comparative Analysis Method. Math. Probl. Eng. 2022, 2022, 3215337. [Google Scholar] [CrossRef]
  20. Xiong, Z.; Liu, Q.; Huang, X. The influence of digital educational games on preschool Children’s creative thinking. Comput. Educ. 2022, 189, 104578. [Google Scholar] [CrossRef]
  21. Lu, S.; Liu, M.; Yin, L.; Yin, Z.; Liu, X.; Zheng, W.; Kong, X. The multi-modal fusion in visual question answering: A review of attention mechanisms. PeerJ Comput. Sci. 2023, 9, e1400. [Google Scholar] [CrossRef] [PubMed]
  22. Ann, R.C.; Cho, S.B. Human activity recognition with smartphone sensors using deep learning neural networks. Expert Syst. Appl. 2016, 59, 235–244. [Google Scholar]
  23. Chen, K.; Zhang, D.; Yao, L.; Guo, B.; Yu, Z.; Liu, Y. Deep learning for sensor-based human activity recognition: Overview, challenges, and opportunities. ACM Comput. Surv. CSUR 2021, 54, 1–40. [Google Scholar] [CrossRef]
  24. Qiu, S.; Zhao, H.; Jiang, N.; Wang, Z.; Liu, L.; An, Y.; Fortino, G. Multi-sensor information fusion based on machine learning for real applications in human activity recognition: State-of-the-art and research challenges. Inf. Fusion 2022, 80, 241–265. [Google Scholar] [CrossRef]
  25. Li, Y.; Yang, G.; Su, Z.; Li, S.; Wang, Y. Human activity recognition based on multi-environment sensor data. Inf. Fusion 2023, 91, 47–63. [Google Scholar] [CrossRef]
  26. Kun, X.; Huang, J.; Wang, H. LSTM-CNN architecture for human activity recognition. IEEE Access 2020, 8, 56855–56866. [Google Scholar]
  27. Liu, X.; Shi, T.; Zhou, G.; Liu, M.; Yin, Z.; Yin, L.; Zheng, W. Emotion classification for short texts: An improved multi-label method. Humanit. Soc. Sci. Commun. 2023, 10, 306. [Google Scholar] [CrossRef]
  28. Feng, W.; Hannafin, J. Design-based research and technology-enhanced learning environments. Educ. Technol. Res. Dev. 2005, 53, 5–23. [Google Scholar]
  29. Liu, X.; Zhou, G.; Kong, M.; Yin, Z.; Li, X.; Yin, L.; Zheng, W. Developing Multi-Labelled Corpus of Twitter Short Texts: A Semi-Automatic Method. Systems 2023, 11, 390. [Google Scholar] [CrossRef]
  30. Lu, C.; Shi, J.; Jia, J. Abnormal event detection at 150 fps in Matlab. In Proceedings of the IEEE International Conference on Computer Vision, Sydney, NSW, Australia, 1–8 December 2013. [Google Scholar]
  31. Degardin, B.; Proença, H. Human Activity Analysis: Iterative Weak/Self-Supervised Learning Frameworks for Detecting Abnormal Events. In Proceedings of the IEEE International Joint Conference on Biometrics (IJCB), Houston, TX, USA, 28 September–1 October 2020. [Google Scholar]
  32. Merad, D.; Drap, P. Tracking multiple persons under partial and global occlusions: Application to customers’ behavior analysis. Pattern Recognit. Lett. 2016, 81, 11–20. [Google Scholar] [CrossRef]
  33. Chen, T.; Chen, H. Anomaly detection in crowded scenes using motion energy model. Multimed. Tools Appl. 2018, 77, 14137–14152. [Google Scholar] [CrossRef]
  34. Klingner, J. The pupillometric precision of a remote video eye tracker. In Proceedings of the ETRA 2010 (Eye Tracking Research and Applications Symposium), Austin, TX, USA, 22–24 March 2010; pp. 259–262. [Google Scholar]
  35. Srichanyachon, N. EFL Learners’ Perceptions of Using LMS. TOJET Turk. Online J. Educ. Technol. 2014, 13, 30–35. [Google Scholar]
  36. Liang, M.; Hu, X. Recurrent Convolutional Neural Network for Object Recognition. In Proceedings of the IEEE Conference on Computer Vision and Pattern Recognition, Boston, MA, USA, 7–12 June 2015; pp. 3367–3375. [Google Scholar]
  37. Jalal, A.; Mahmood, M.; Siddiqi, M.A. Robust spatiotemporal features for human interaction recognition via an artificial neural network. In Proceedings of the IEEE Conference on International Conference on Frontiers of Information Technology, Islamabad, Pakistan, 17–19 December 2018. [Google Scholar]
  38. Jalal, A.; Quaid, M.A.K.; Sidduqi, M.A. A Triaxial acceleration-based human motion detection for an ambient smart home system. In Proceedings of the IEEE International Conference on Applied Sciences and Technology, Islamabad, Pakistan, 8–12 January 2019. [Google Scholar]
  39. Dahlstrom, E.; Brooks, D.C.; Bichsel, J. The Current Ecosystem of Learning Management Systems in Higher Education: Student, Faculty, and IT Perspectives; Educause: Boulder, CO, USA, 2014. [Google Scholar]
  40. Nawaratne, R.; Yu, X. Spatiotemporal anomaly detection using deep learning for real-time video surveillance. IEEE Trans. Ind. Inform. 2019, 16, 393–402. [Google Scholar] [CrossRef]
  41. Oliveira, P.C.D.; Cunha, C.; Nakayama, M.K. Learning Management Systems (LMS) and e-learning management: An integrative review and research agenda. JISTEM-J. Inf. Syst. Technol. Manag. 2016, 13, 157–180. [Google Scholar] [CrossRef]
  42. Ahmad, F. Deep image retrieval using artificial neural network interpolation and indexing based on similarity measurement. CAAI Trans. Intell. Technol. 2022, 7, 200–218. [Google Scholar] [CrossRef]
  43. Hassan, F.S.; Gutub, A. Improving data hiding within color images using hue component of HSV colour space. CAAI Trans. Intell. Technol. 2022, 7, 56–68. [Google Scholar] [CrossRef]
  44. Quaid, M.A.K.; Jalal, A. Wearable sensors based human behavioral pattern recognition using statistical features and reweighted genetic algorithm. Multimed. Tools Appl. 2019, 79, 6061–6083. [Google Scholar] [CrossRef]
  45. Nadeem, A.; Jalal, A.; Kim, K. Human actions tracking and recognition based on body parts detection via an artificial neural network. In Proceedings of the IEEE International Conference on Advancements in Computational Sciences, Lahore, Pakistan, 17–19 February 2020. [Google Scholar]
  46. Golestani, N.; Moghaddam, M. Human activity recognition using magnetic induction-based motion signals and deep recurrent neural networks. Nat. Commun. 2020, 11, 1551. [Google Scholar] [CrossRef] [PubMed]
  47. Liu, X.; Song, M.; Tao, D.; Bu, J.; Chen, C. Random Geometric Prior Forest for Multiclass Object Segmentation. IEEE Trans. Image Process. 2015, 24, 3060–3070. [Google Scholar] [PubMed]
  48. Jalal, A.; Khalid, N.; Kim, K. Automatic recognition of human interaction via hybrid descriptors and maximum entropy Markov model using depth sensors. Entropy 2020, 22, 817. [Google Scholar] [CrossRef] [PubMed]
  49. Rafique, A.; Ahmad, J.; Kim, K. Automated sustainable multi-object segmentation and recognition via modified sampling consensus and kernel sliding perceptron. Symmetry 2020, 13, 1928. [Google Scholar] [CrossRef]
  50. Zhang, J.; Ye, G.; Tu, Z.; Qin, Y.; Qin, Q.; Zhang, J.; Liu, J. A spatial attentive and temporal dilated (SATD) GCN for skeleton-based action recognition. CAAI Trans. Intell. Technol. 2022, 7, 46–55. [Google Scholar] [CrossRef]
  51. Pervaiz, M.; Jalal, A.; Kim, K. Hybrid algorithm for multi-people counting and tracking for smart surveillance. In Proceedings of the IEEE 2021 International Bhurban Conference on Applied Sciences and Technologies (IBCAST), Islamabad, Pakistan, 12–16 January 2021. [Google Scholar]
  52. Khalid, N.; Gochoo, M.; Jalal, A.; Kim, K. Modeling two-person segmentation and locomotion for stereoscopic action identification: A sustainable video surveillance system. Sustainability 2021, 12, 970. [Google Scholar] [CrossRef]
  53. Cong, R.; Lei, J.; Fu, H.; Cheng, M.-M.; Lin, W.; Huang, Q. Review of Visual Saliency Detection with Comprehensive Information. IEEE Trans. Circuits Syst. Video Technol. 2018, 29, 2941–2959. [Google Scholar] [CrossRef]
  54. Nadeem, A.; Jalal, A.; Kim, K. Automatic human posture estimation for sports activity recognition with robust body parts detection and entropy Markov model. Multimed. Tools Appl. 2021, 80, 21465–21498. [Google Scholar] [CrossRef]
  55. Meng, J.; Li, Y.; Liang, H.; Ma, Y. Single-image Dehazing based on two-stream convolutional neural network. J. Artif. Intell. Technol. 2022, 2, 100–110. [Google Scholar] [CrossRef]
  56. Liu, Y.; Wang, K.; Liu, L.; Lan, H.; Lin, L. Tcgl: Temporal contrastive graph for self-supervised video representation learning. IEEE Trans. Image Process. 2022, 31, 1978–1993. [Google Scholar] [CrossRef] [PubMed]
  57. Zheng, M.; Zhi, K.; Zeng, J.; Tian, C.; You, L. A hybrid CNN for image denoising. J. Artif. Intell. Technol. 2022, 2, 93–99. [Google Scholar] [CrossRef]
  58. Hu, X.; Kuang, Q.; Cai, Q.; Xue, Y.; Zhou, W.; Li, Y. A Coherent Pattern Mining Algorithm Based on All Contiguous Column Bicluster. J. Artif. Intell. Technol. 2022, 2, 80–92. [Google Scholar] [CrossRef]
  59. Alberto, R.; Briones, A.; Hernandez, G.; Prieto, J.; Chamoso, P. Artificial neural network analysis of the academic performance of students in virtual learning environments. Neurocomputing 2021, 423, 713–720. [Google Scholar]
  60. Rawashdeh, A.; Zuhir, A.; Mohammed, E.Y.; Al Arab, A.R.; Alara, M.; Al-Rawashdeh, B. Advantages and disadvantages of using e-learning in university education: Analyzing students’ perspectives. Electron. J. E-Learn. 2021, 19, 107–117. [Google Scholar] [CrossRef]
  61. Fuady, I.; Sutarjo, M.A.S.; Ernawati, E. Analysis of students’ perceptions of online learning media during the COVID-19 pandemic Study of e-learning media: Zoom, Google Meet, Google Classroom, and LMS. Randwick Int. Soc. Sci. J. 2021, 2, 51–56. [Google Scholar] [CrossRef]
  62. Li, T.; Fan, Y.; Li, Y.; Tarkoma, S.; Hui, P. Understanding the Long-Term Evolution of Mobile App Usage. IEEE Trans. Mob. Comput. 2023, 22, 1213–1230. [Google Scholar] [CrossRef]
Figure 1. Proposed methodology to detect learner behavior.
Sustainability 15 14780 g001
Figure 2. The process used to extract objects of interest in the image.
Sustainability 15 14780 g002
Figure 3. Preprocessing. (a) Original image, (b) noise removed, and (c) image enhancement.
Sustainability 15 14780 g003
Figure 4. Object detection using Viola–Jones. (a) Original image and (b) object detection using Viola–Jones.
Sustainability 15 14780 g004
Figure 5. Features extraction for full body and skeleton levels.
Sustainability 15 14780 g005
Figure 6. PCA to compute the orientation of the object.
Sustainability 15 14780 g006
Figure 7. Stick model presentation of human silhouettes detected. (a) Humans detected, and (b) Stick Model for each detected human.
Sustainability 15 14780 g007
Figure 8. The architecture of the genetic algorithm with population distribution and selection.
Sustainability 15 14780 g008
Figure 9. Examples of different scenes of the MED dataset.
Sustainability 15 14780 g009
Figure 10. Allowed and prohibited behavior of the Edu-net dataset.
Sustainability 15 14780 g010
Figure 11. Results of behavior detection with MED dataset.
Sustainability 15 14780 g011
Figure 12. Results of behavior detection with Edu-Net dataset.
Sustainability 15 14780 g012
Figure 13. Performance measures of both datasets were used to evaluate the system.
Sustainability 15 14780 g013
Table 1. Summary of state-of-the-art methods.
ReferenceObjectivesAdvantagesDisadvantages
[28]Early exploration of e-learning behavior tracking. Established the importance of engagement metrics. Paved the way for future research.Lack of real-time monitoring,
Limited emphasis on individualized feedback.
[29]Focus on learner-centered tracking using a mixed methods approach, including surveys and behavioral analysis.Enhanced understanding of self-regulation.Time-consuming data analysis and difficulties in measuring subjective behaviors.
[30]Use of predictive modeling for retention. Used method of longitudinal data collection and machine learning techniques.Informed personalized interventions. Highlighted the role of social interaction.Challenges in predicting non-academic behaviors and privacy concerns.
[31]Application of data mining techniques. Performed analysis of large-scale learning data using data mining algorithms.Insights into collaborative learning behaviors and identification of factors affecting performance.Ethical considerations, resource-intensive data collection, and limited explanation of causality.
[32]Integration of multimodal data sources. Data fusion of various sources, including clickstream and biometric data.Comprehensive learner profile generation and personalized learning pathway recommendations.Technical challenges in data fusion and limited generalizability. Privacy and security concerns.
[33]Explore tracking student engagement. Performed surveys, interviews, and behavioral data analysis and identified factors influencing online behaviors.Established the importance of engagement metrics. Informative for instructional design.Limited sample size, lack of long-term data, and dependency on self-reported data.
[34]Investigate social network influence using social network analysis and content analysis.Provide insights into collaborative learning dynamics. Integration of social network analysis.Limited focus on non-cognitive behaviors, ethical considerations, and incomplete data from private groups.
[35]Examine online procrastination using surveys and analysis of online procrastination behaviors. Proposed strategies for reducing procrastination.Implications for time management in e-learning.Limited generalizability, self-reporting bias, and limited consideration of other behaviors.
[36]Developed a system for giving students immediate feedback throughout an online course using a behavior analytic approach.Identified effect of individual differences on students behavior in e-learning settings.Results can be biased based on false feedback.
[37]Discovered that students who had high levels of motivation and self-efficacy were more likely to participate in active learning strategies.Suggest parameters that will increase student performance and engagement in e-learning.Motivation level is a derived parameter that cannot be measured accurately; it can affect performance of the system.
Table 2. The experimental outcome of MED and Edu-Net dataset.
DataSetMED Dataset
ActivityAllowed BehaviorsProhibited Behavior
ActionsHappySadExcitedNeutralPanicFightScaredAngry
Accuracy89%86%89%82%92%94%89%87%
Average Accuracy85.75%90.5%
DatasetEdu-Net Dataset
ActivityAllowed BehaviorsProhibited Behaviors
ActionWriting on BoardWriting on BookReading BookHand RaiseSleeping on ChairEating FoodHolding Mobile PhoneFighting
Accuracy83%85%89%82%83%84%89%87%
Average85%86%
Table 3. Comparison of the stated system with other contemporary methods.
DatasetMethodsAccuracy (%)MethodsAccuracyMethodsAccuracy
MED Khalid [52]84.9Alberto et al. [59]87.4Proposed Method89.2
Edu-NetRawashdeh et al. [60]80.3Fuady et al. [61]82.2Proposed Method85.5
Disclaimer/Publisher’s Note: The statements, opinions and data contained in all publications are solely those of the individual author(s) and contributor(s) and not of MDPI and/or the editor(s). MDPI and/or the editor(s) disclaim responsibility for any injury to people or property resulting from any ideas, methods, instructions or products referred to in the content.

