
Experimental and Modeled Results Describing the Low-Concentration Acetone Adsorption onto Coconut Shell Activated Carbon

Abstract
:1. Introduction
2. Experiment
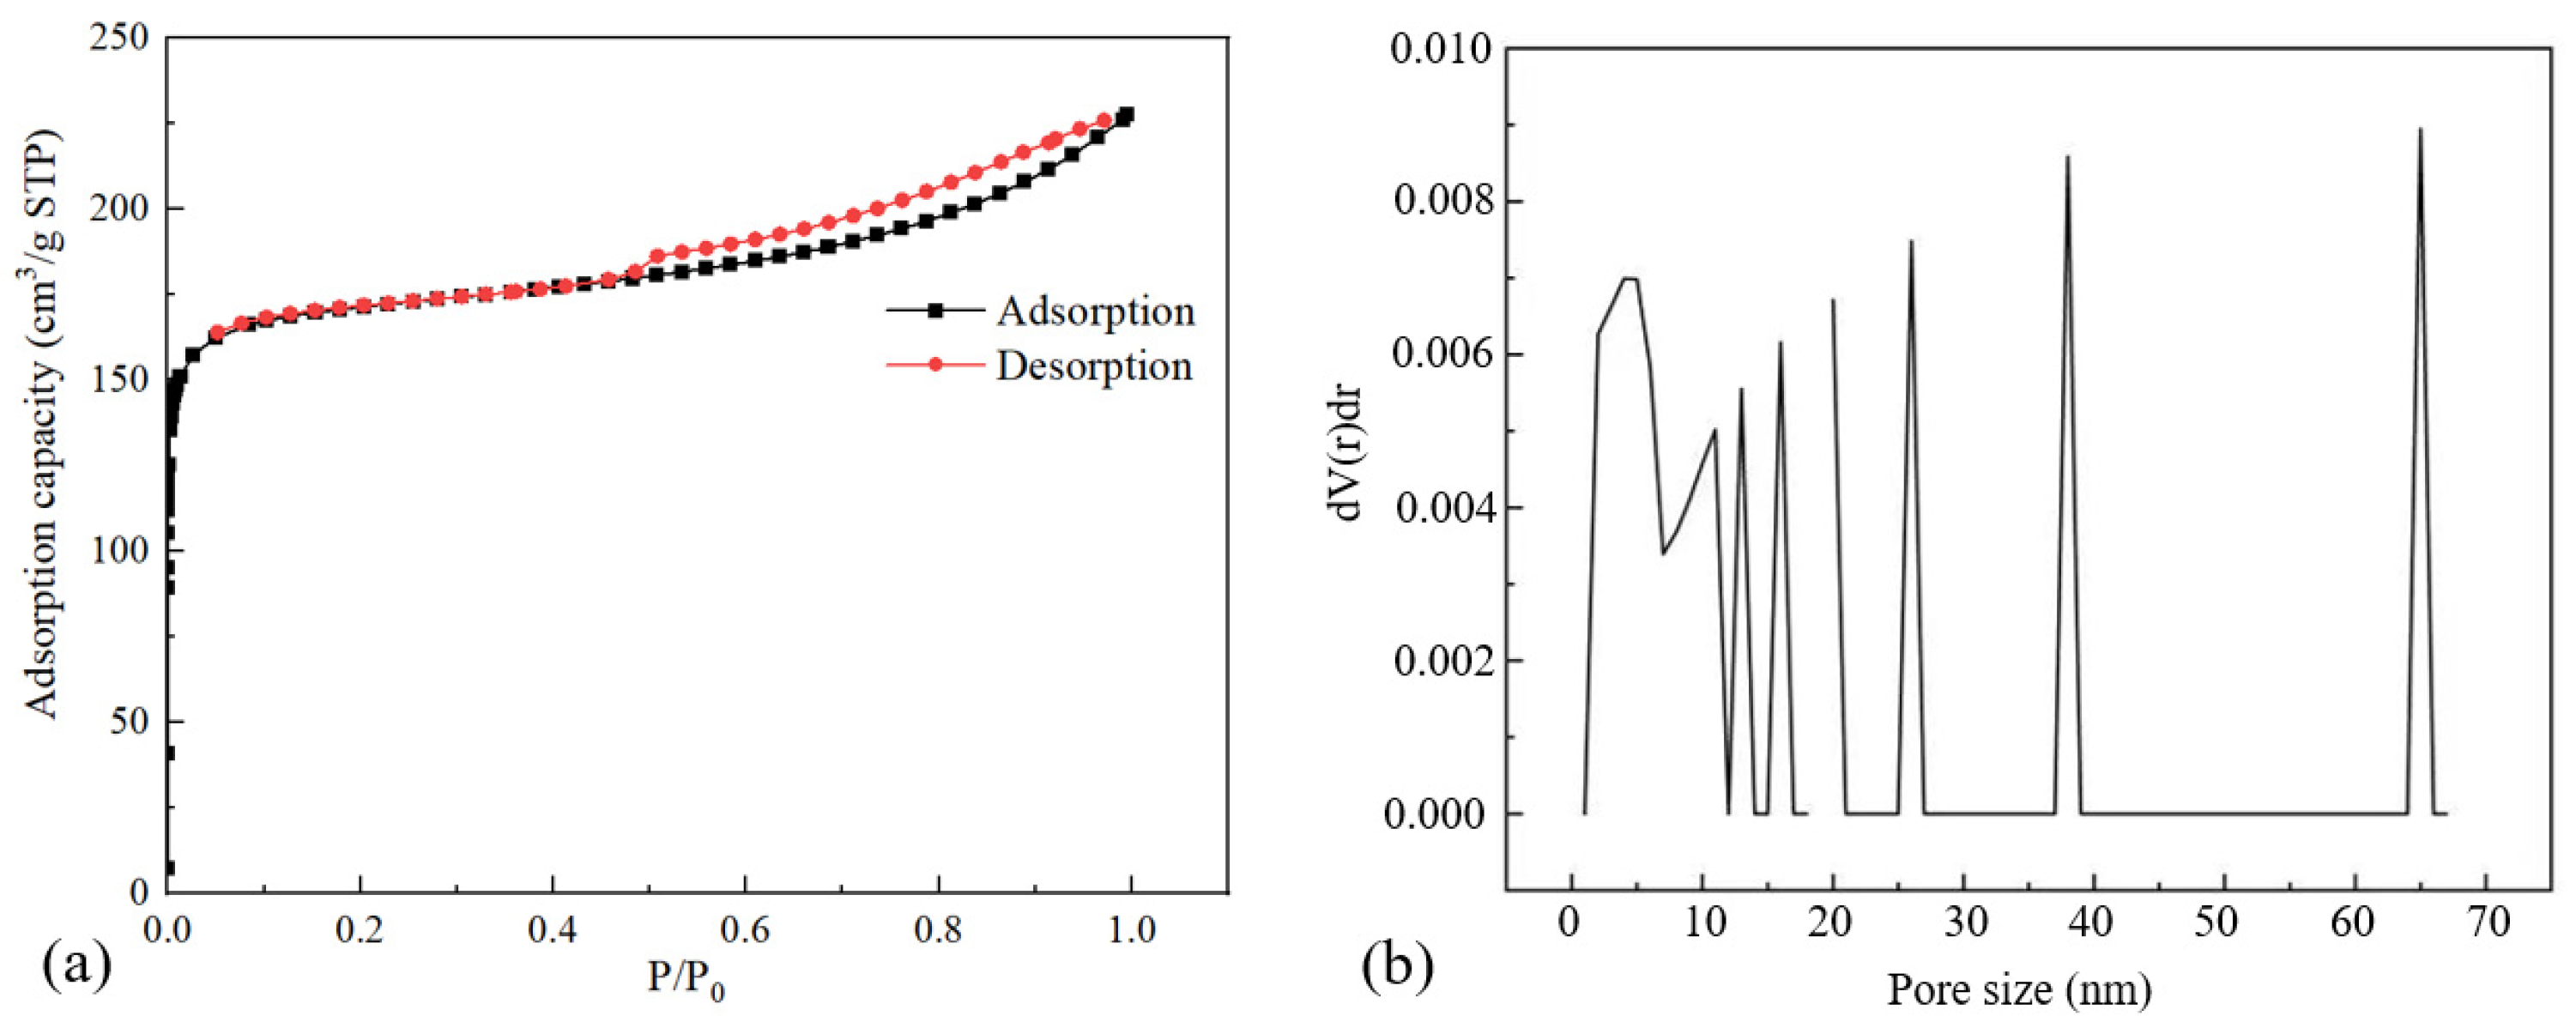
2.1. Materials
2.2. Test Facility
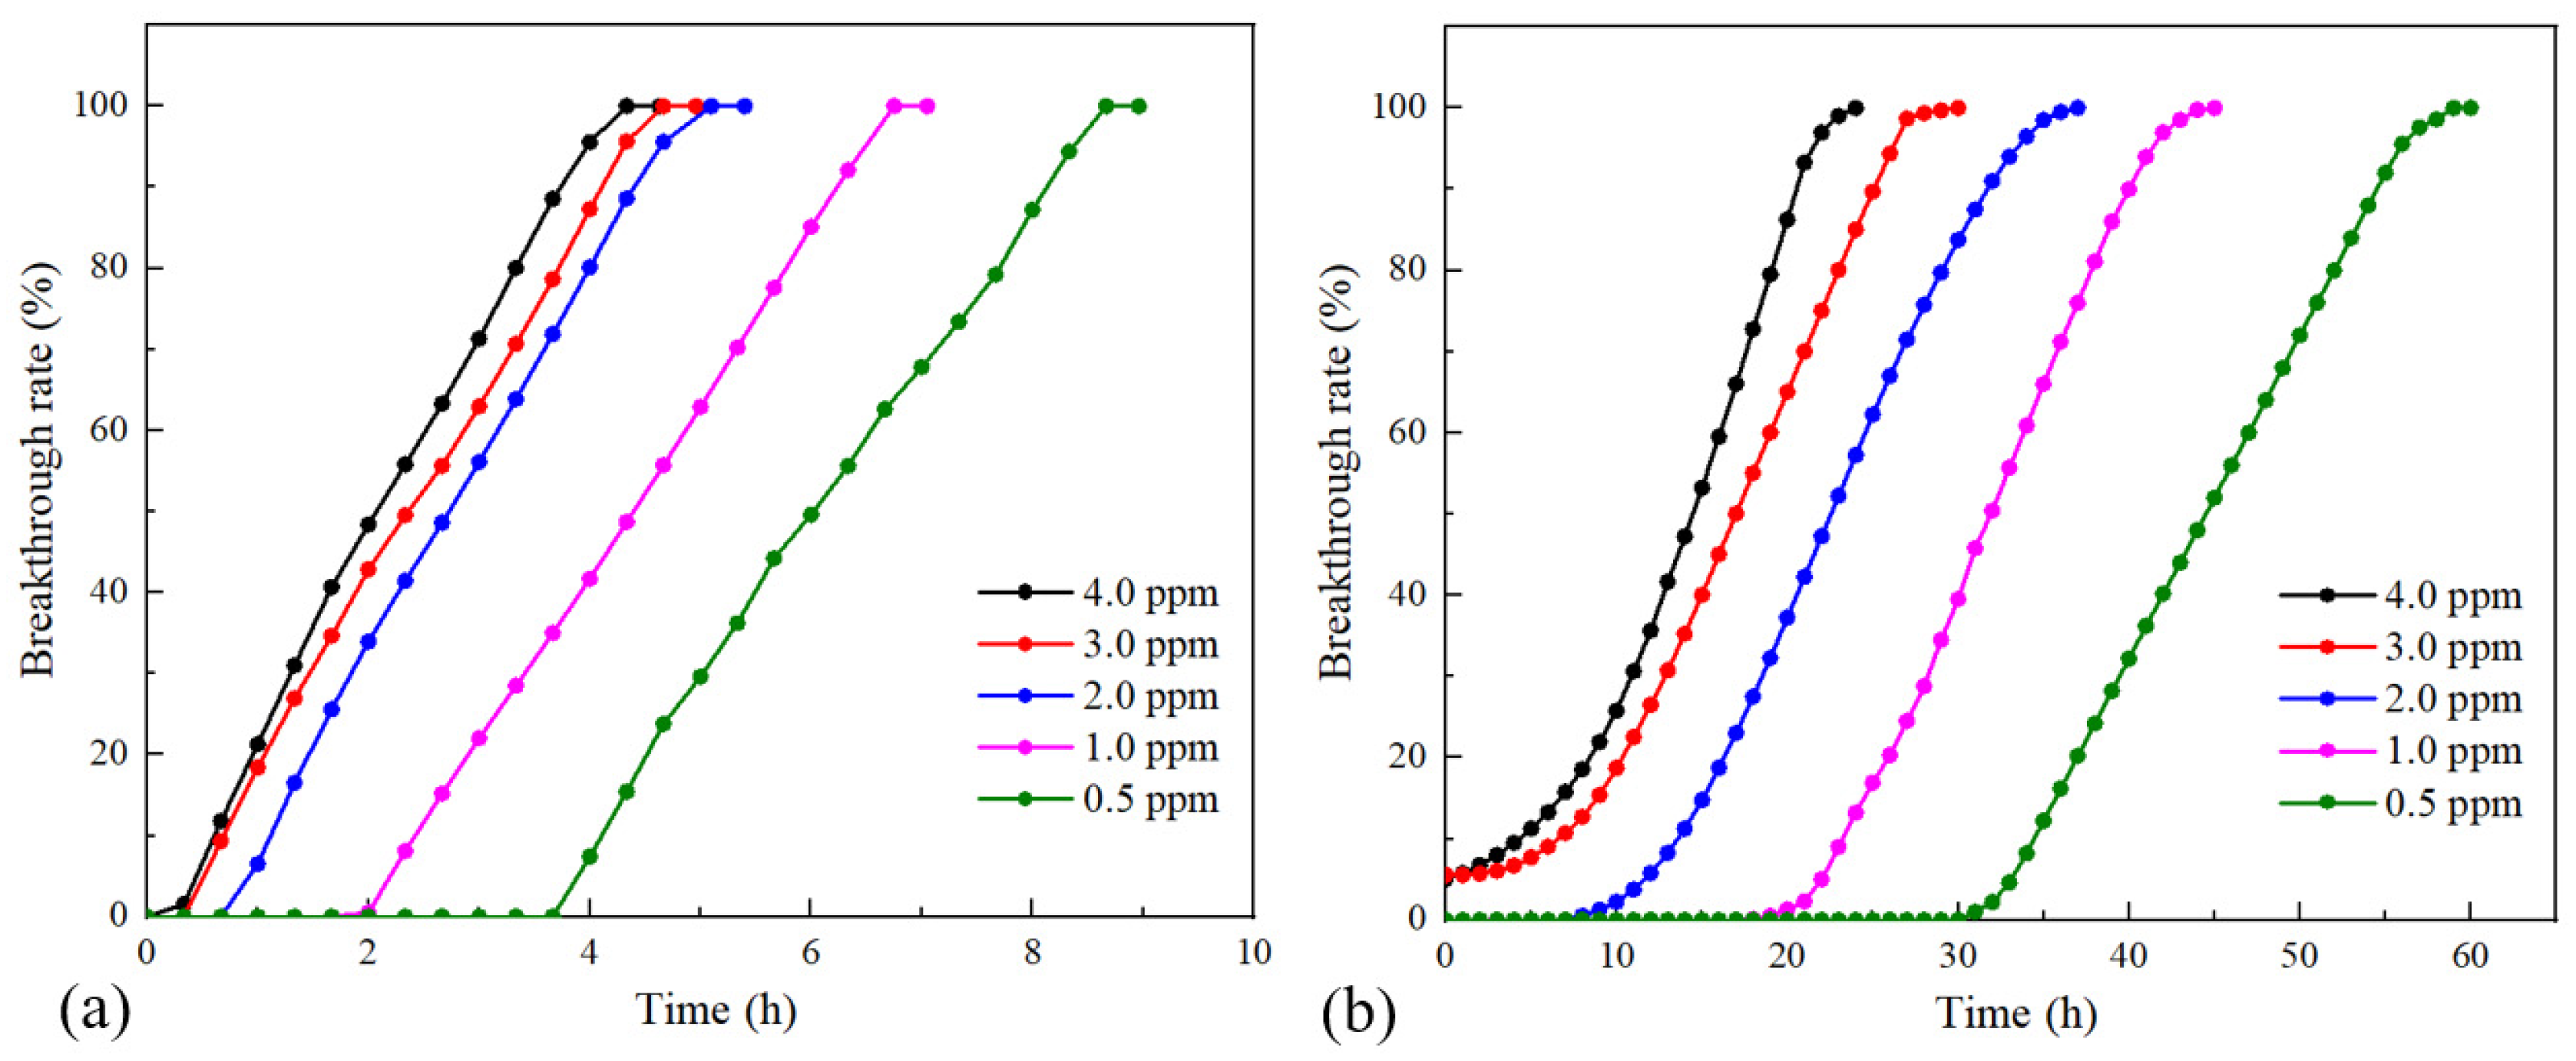
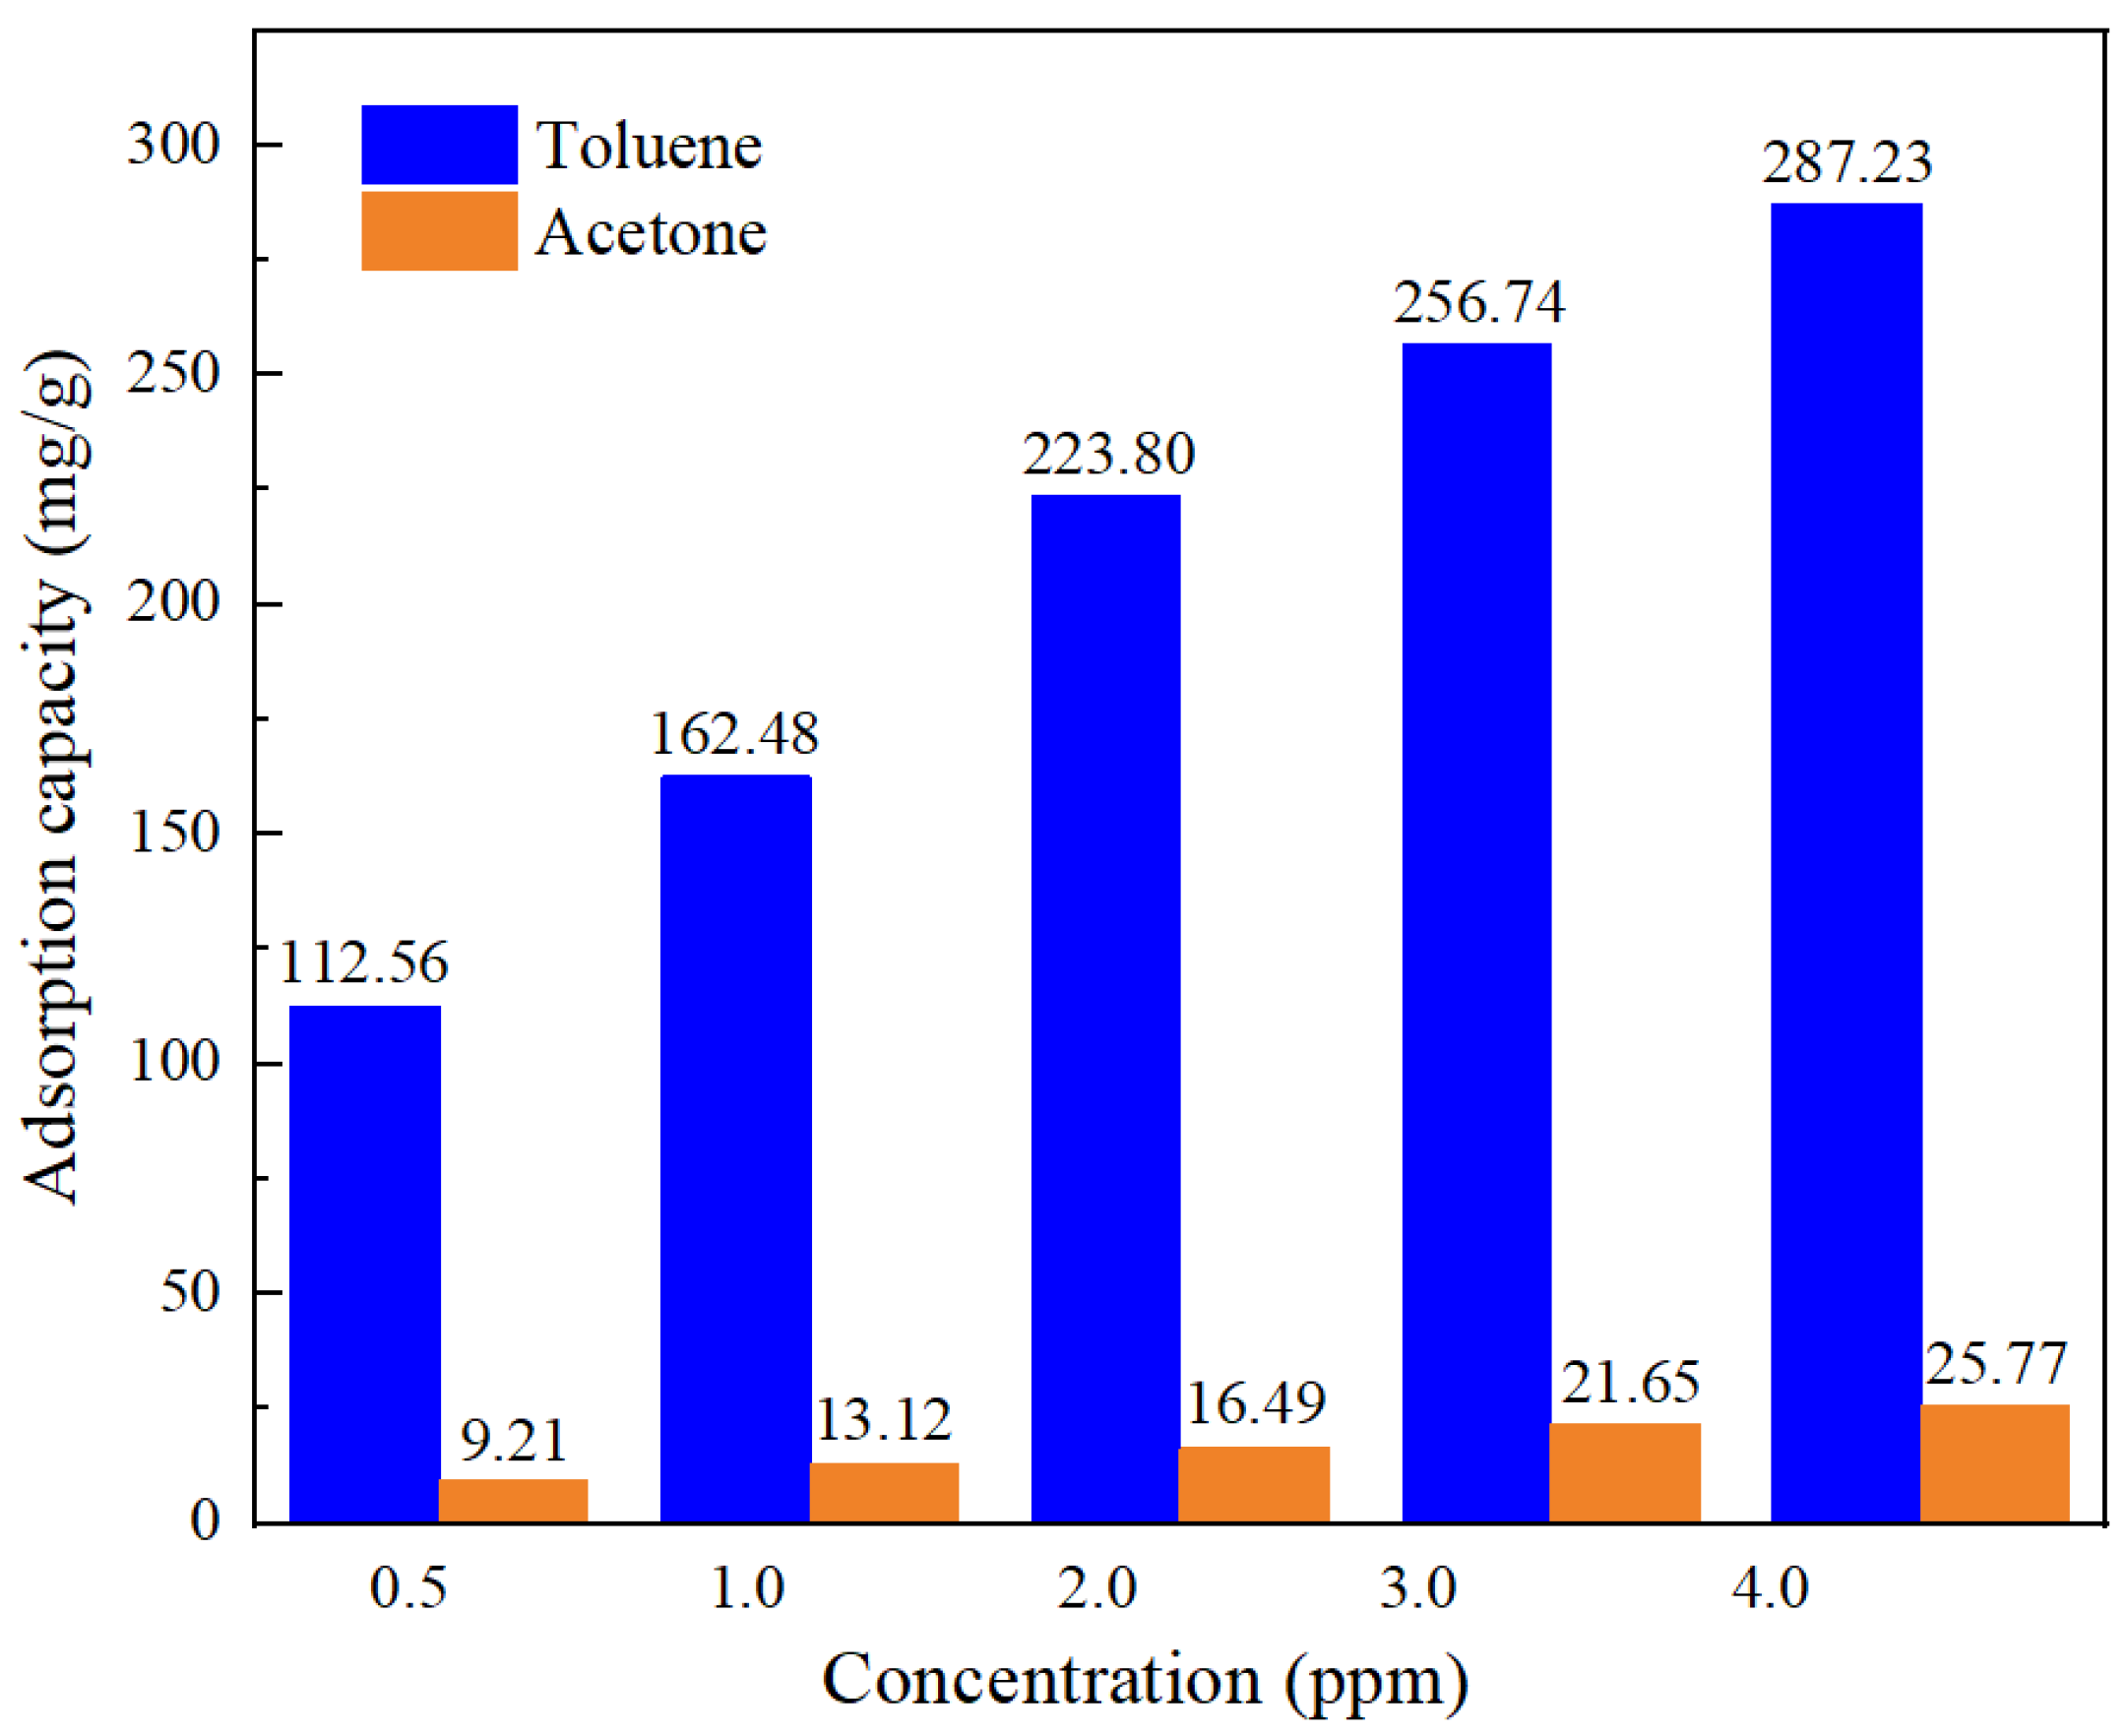
2.3. Experimental Results
3. Equilibrium Capacity Models
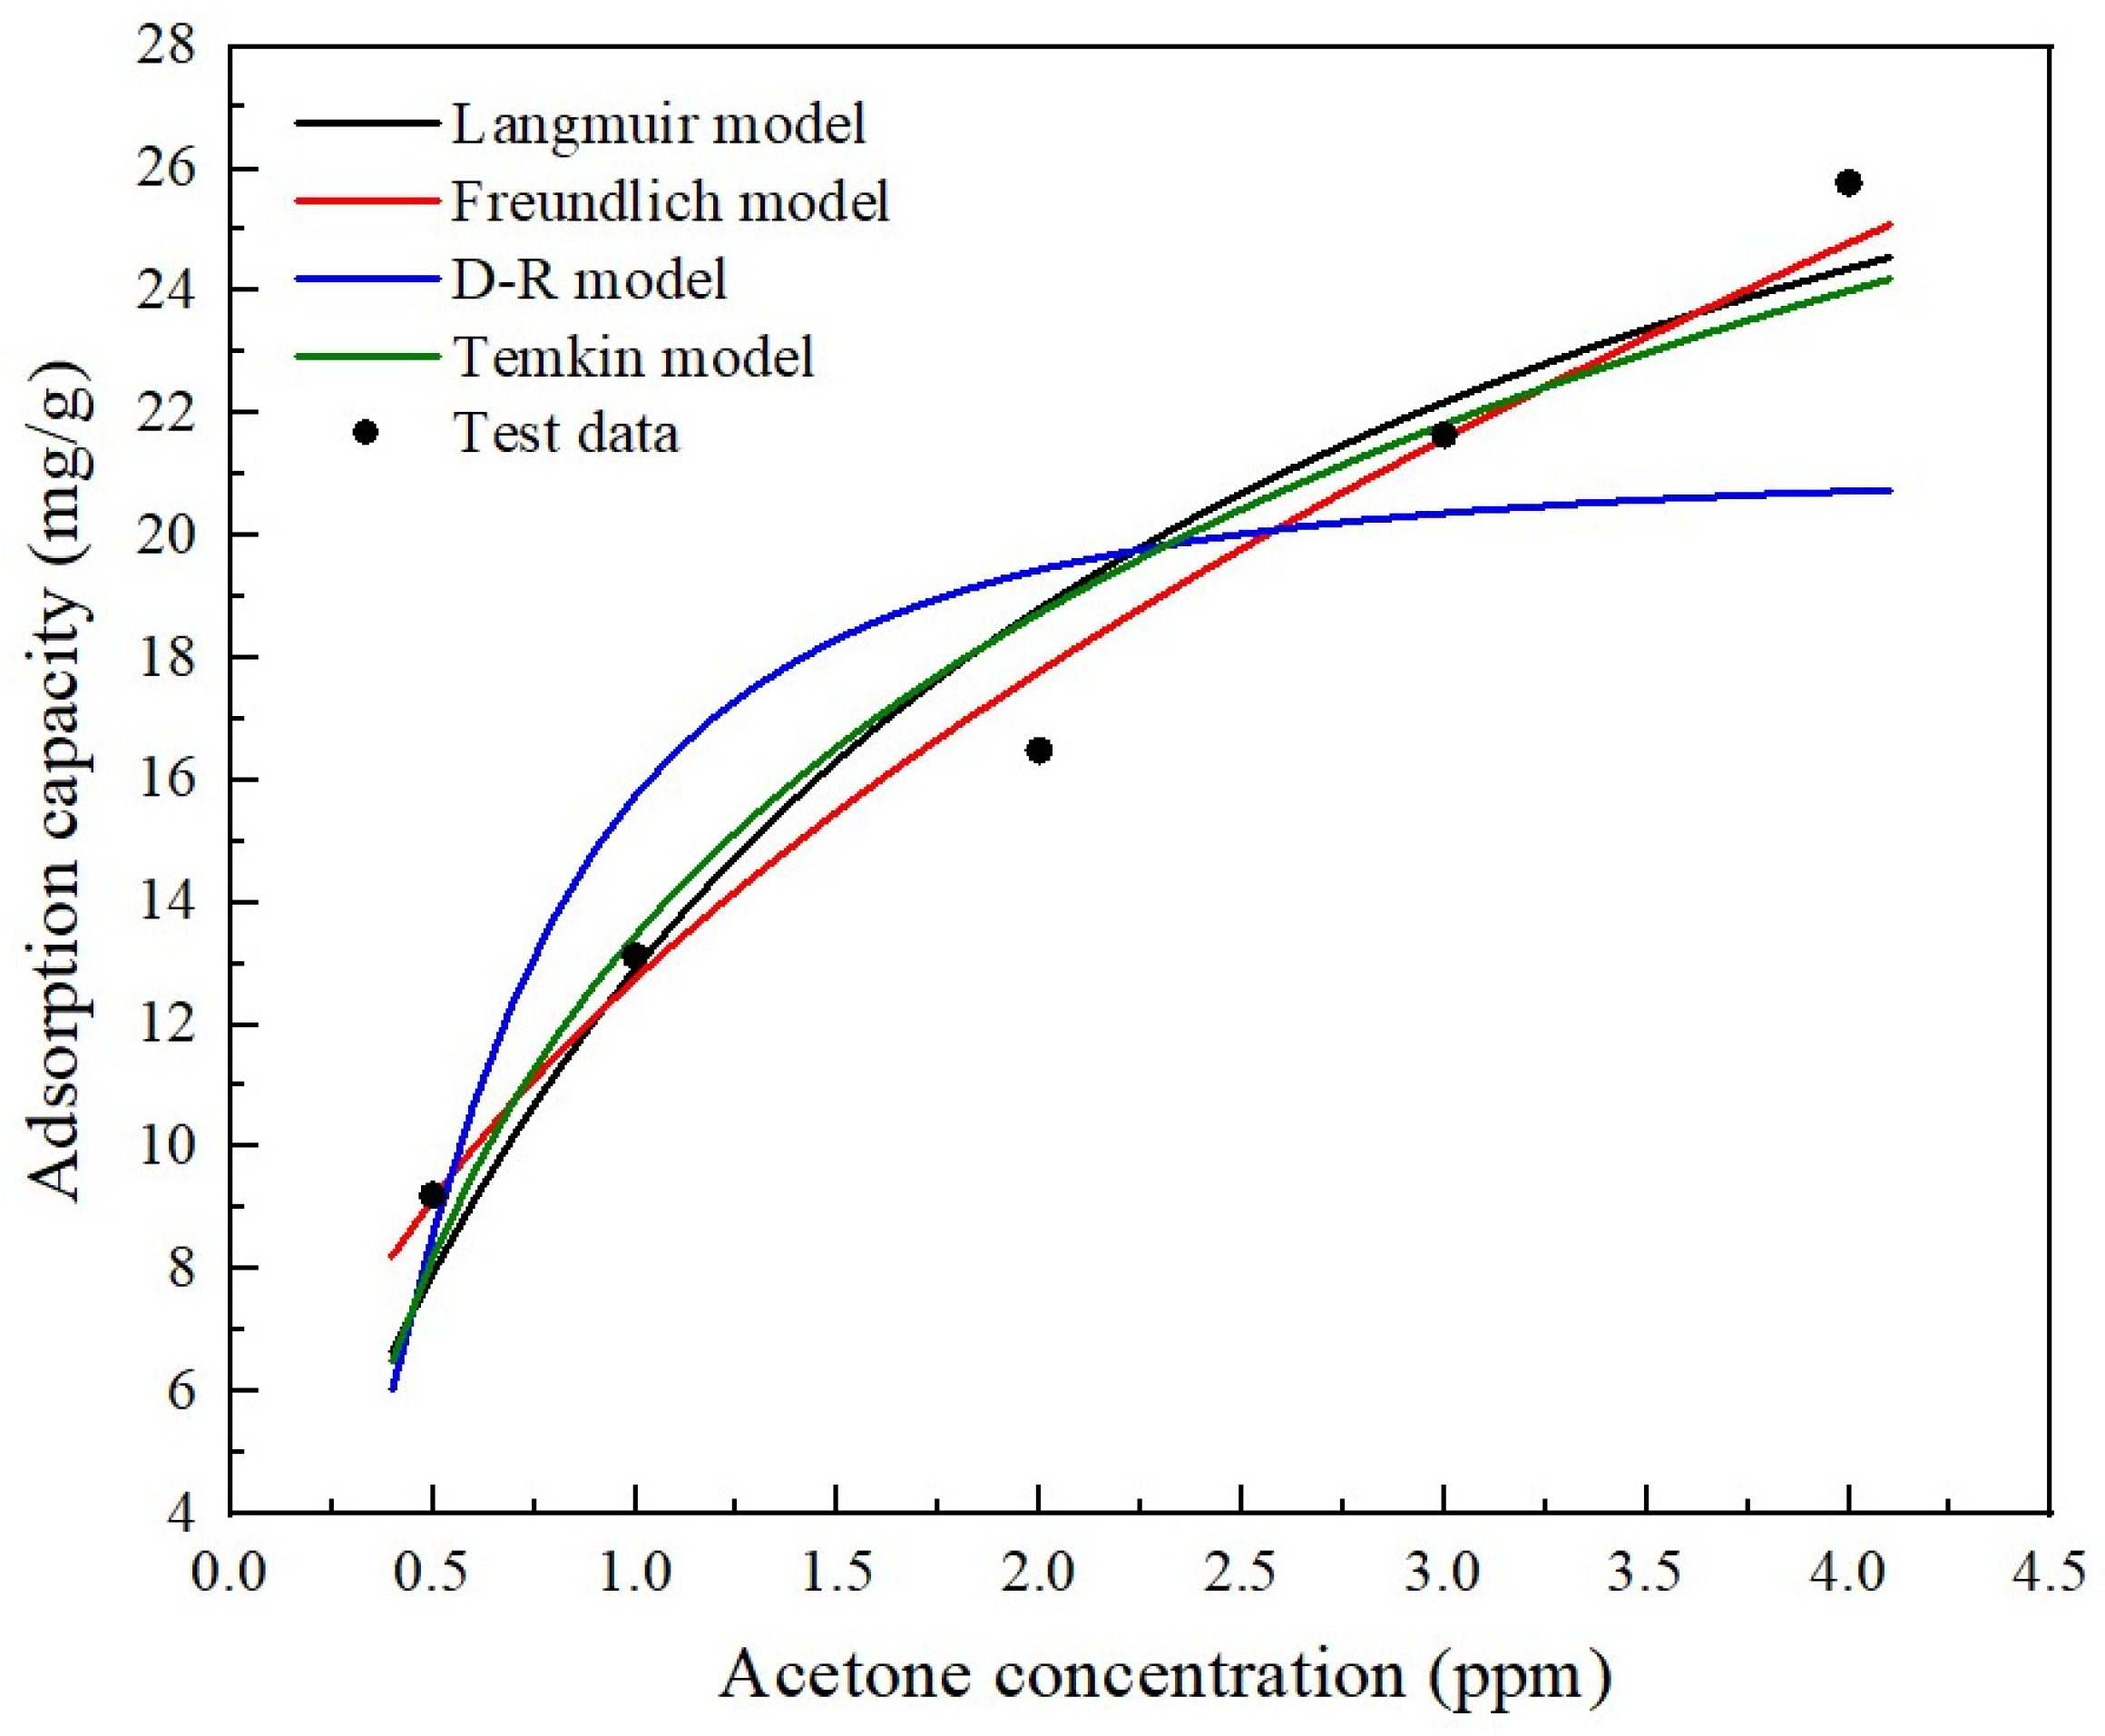
3.1. Isotherms
3.2. Fitting Results
4. Prediction Model
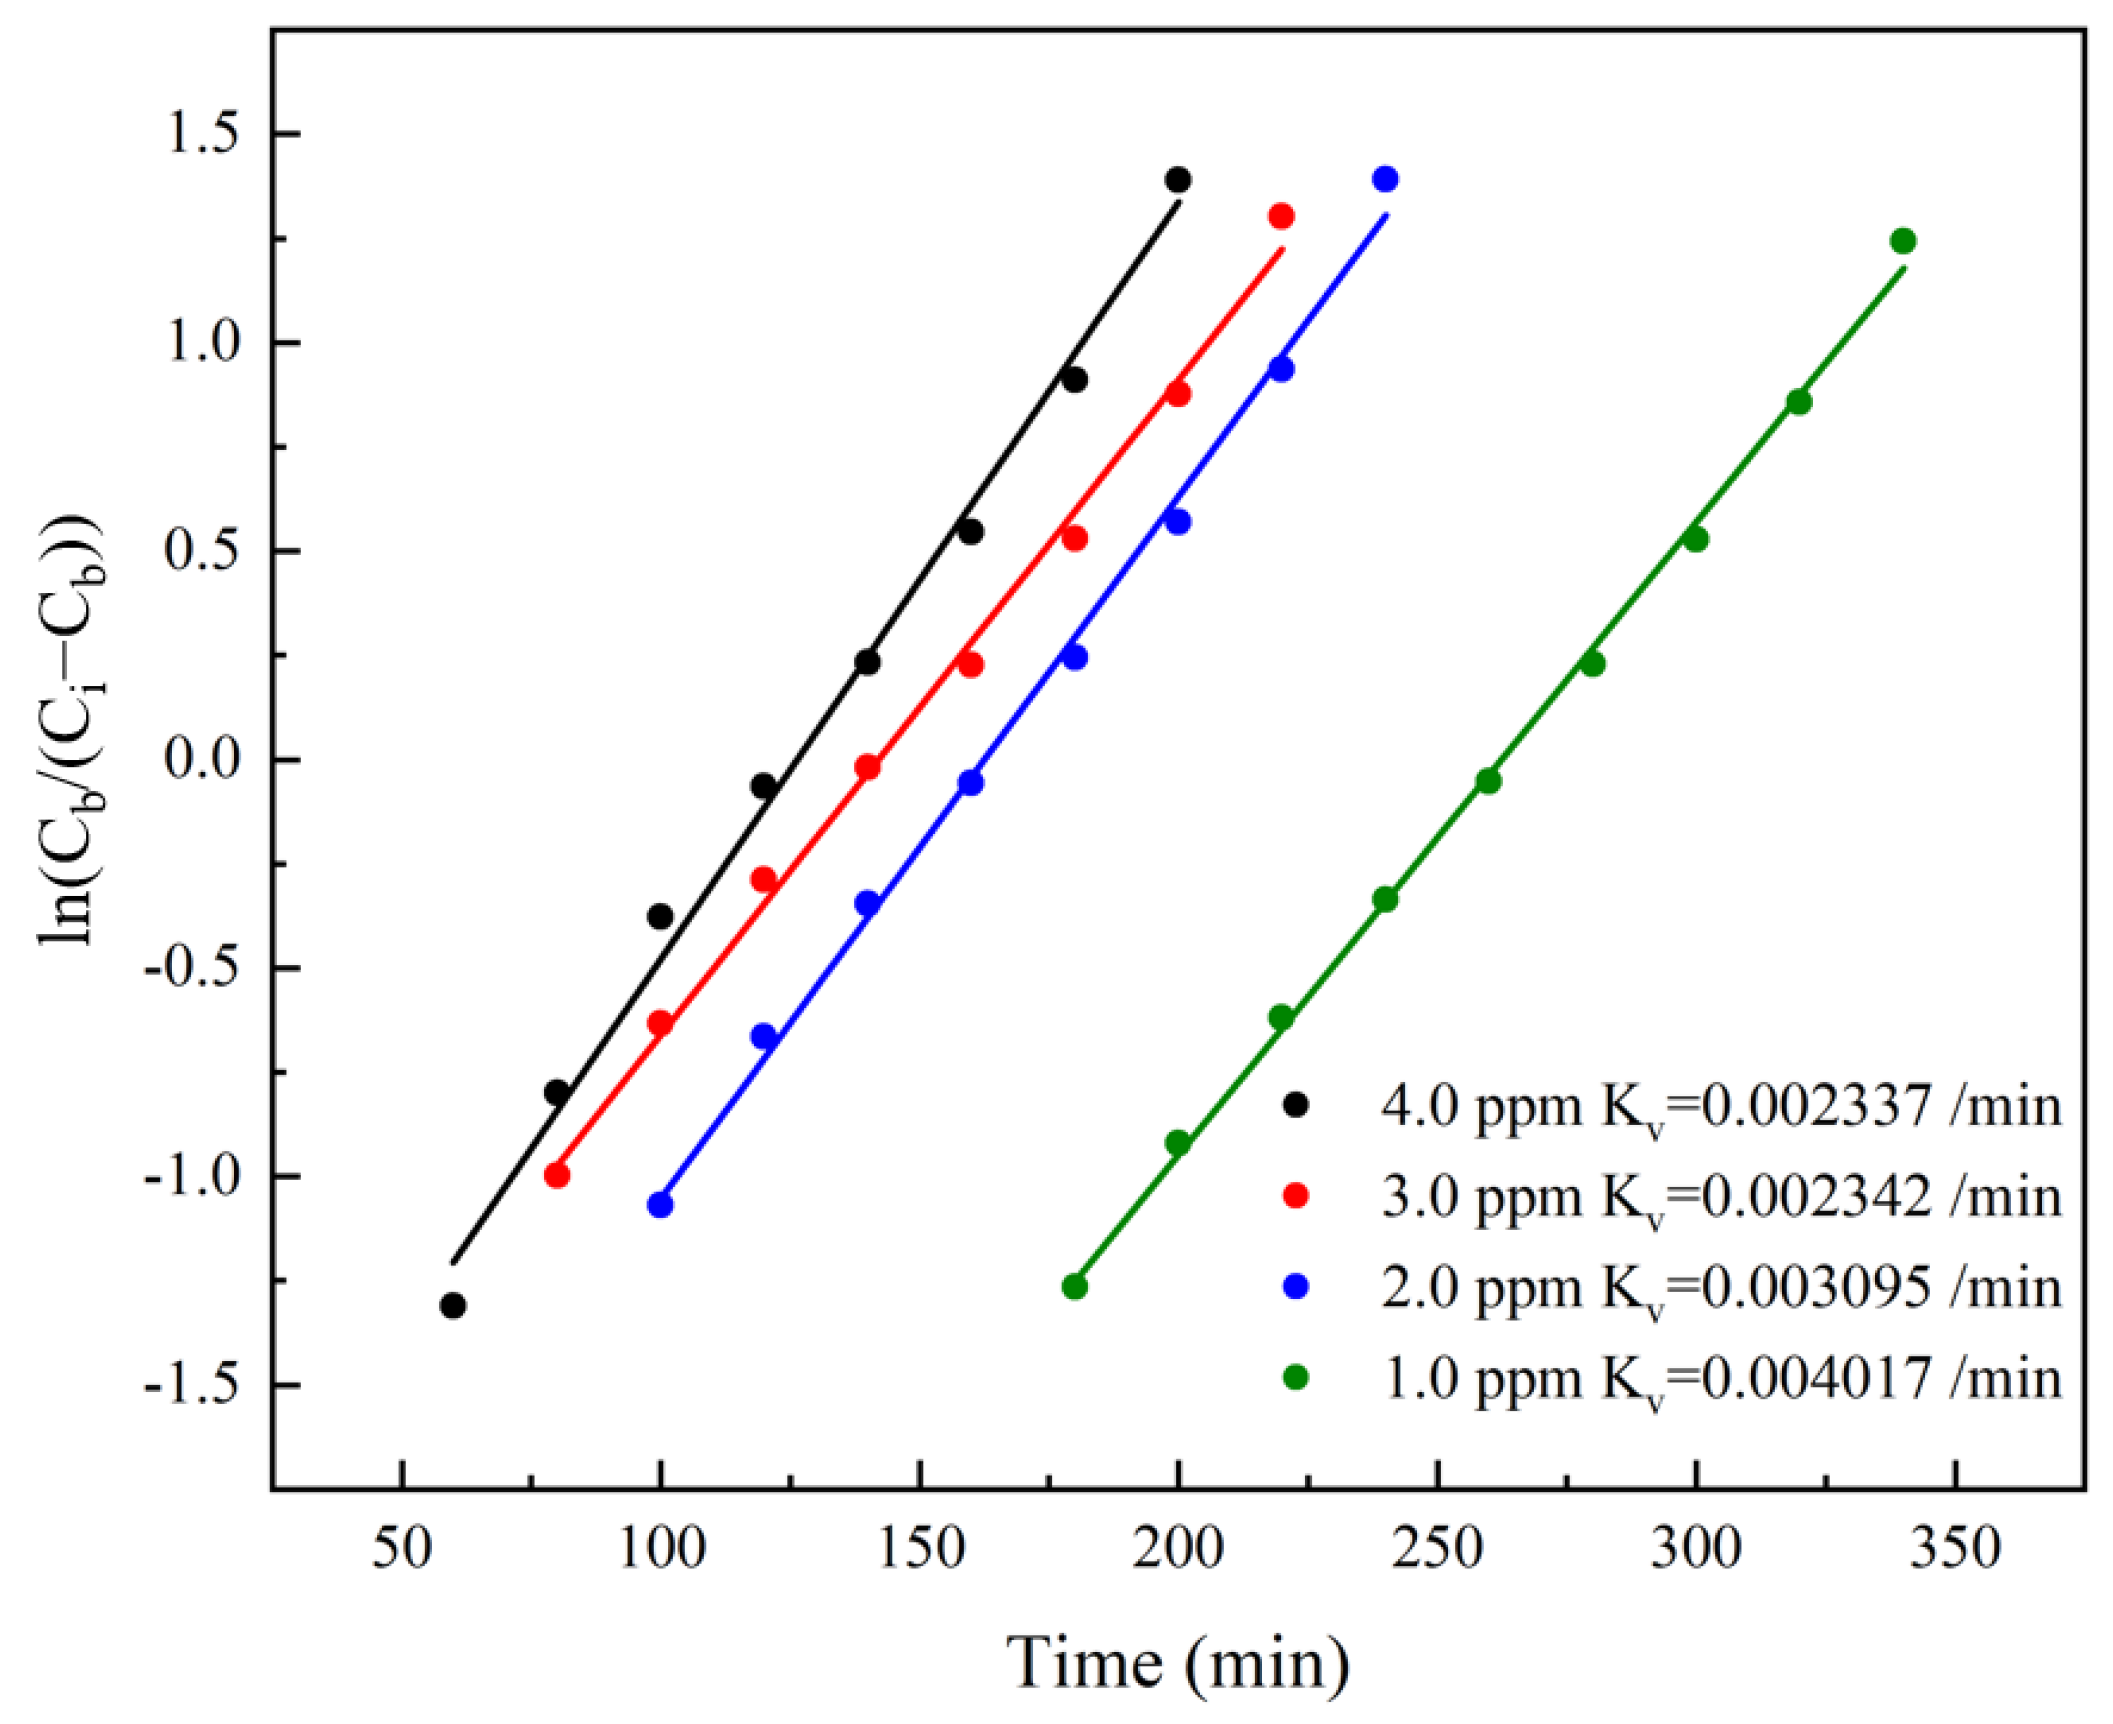
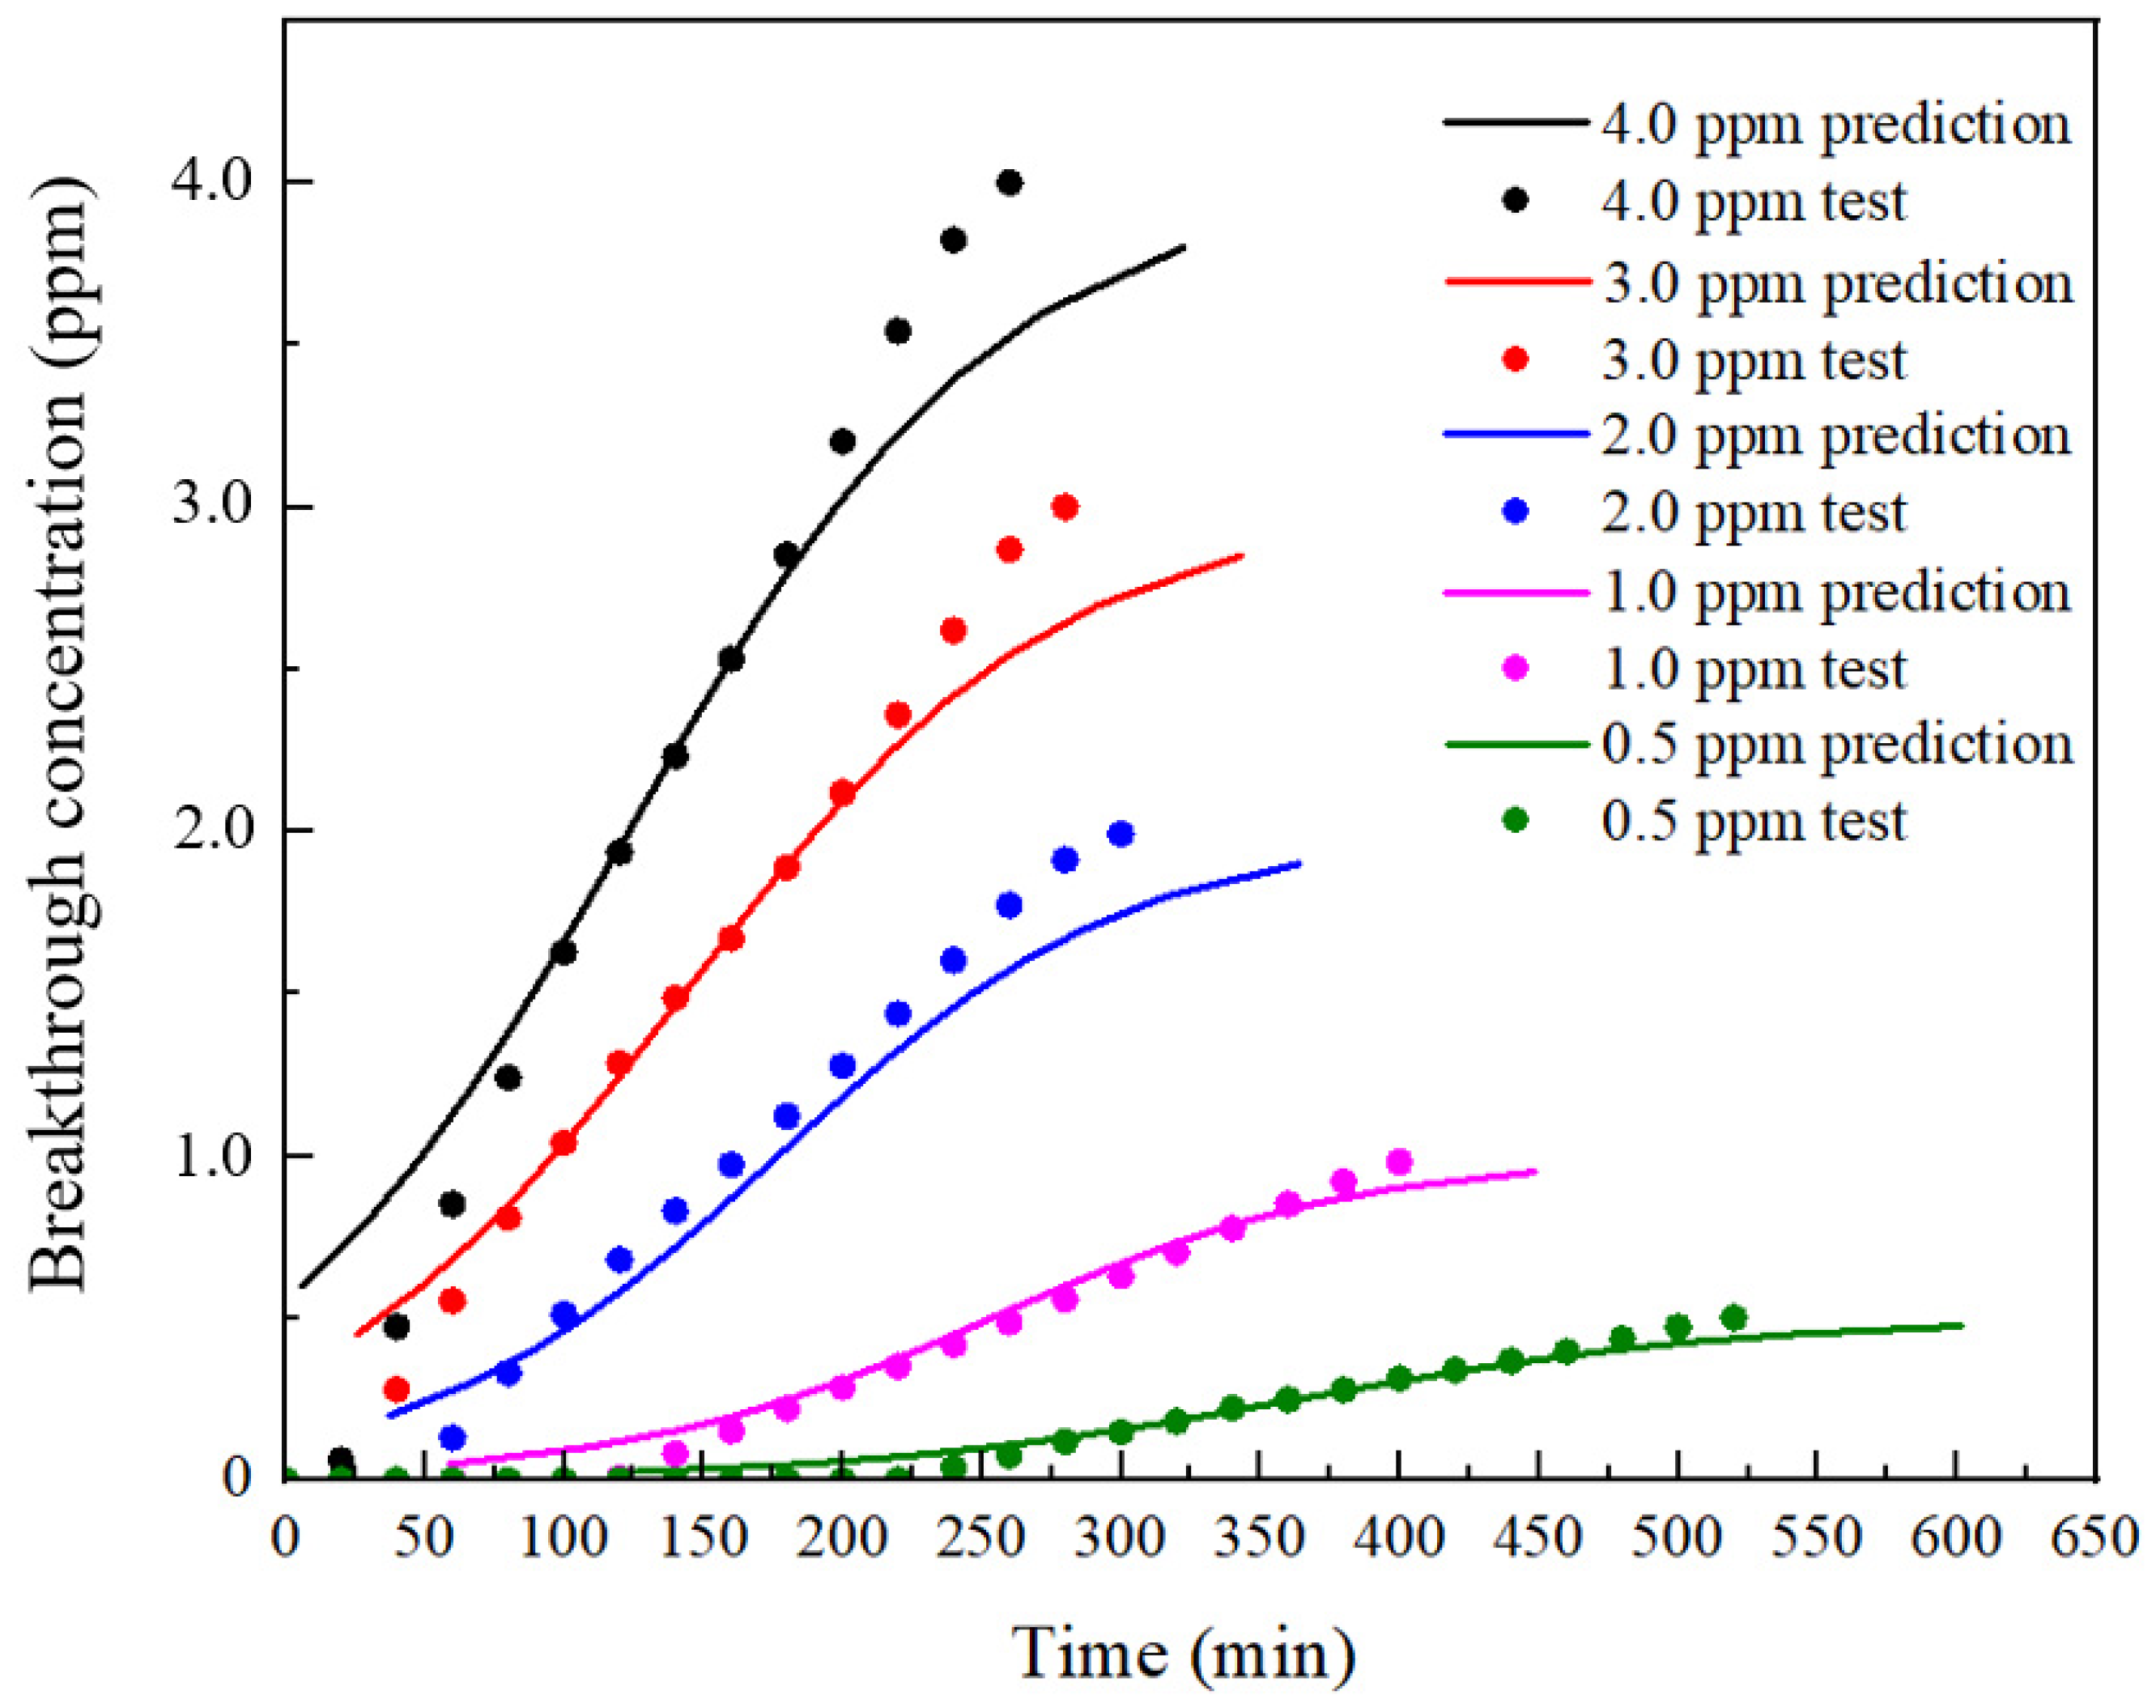
4.1. Prediction Based on Wheeler–Jonas Model
4.1.1. Wheeler–Jonas Model
4.1.2. Prediction Process
4.2. Prediction Based on the Thomas Model
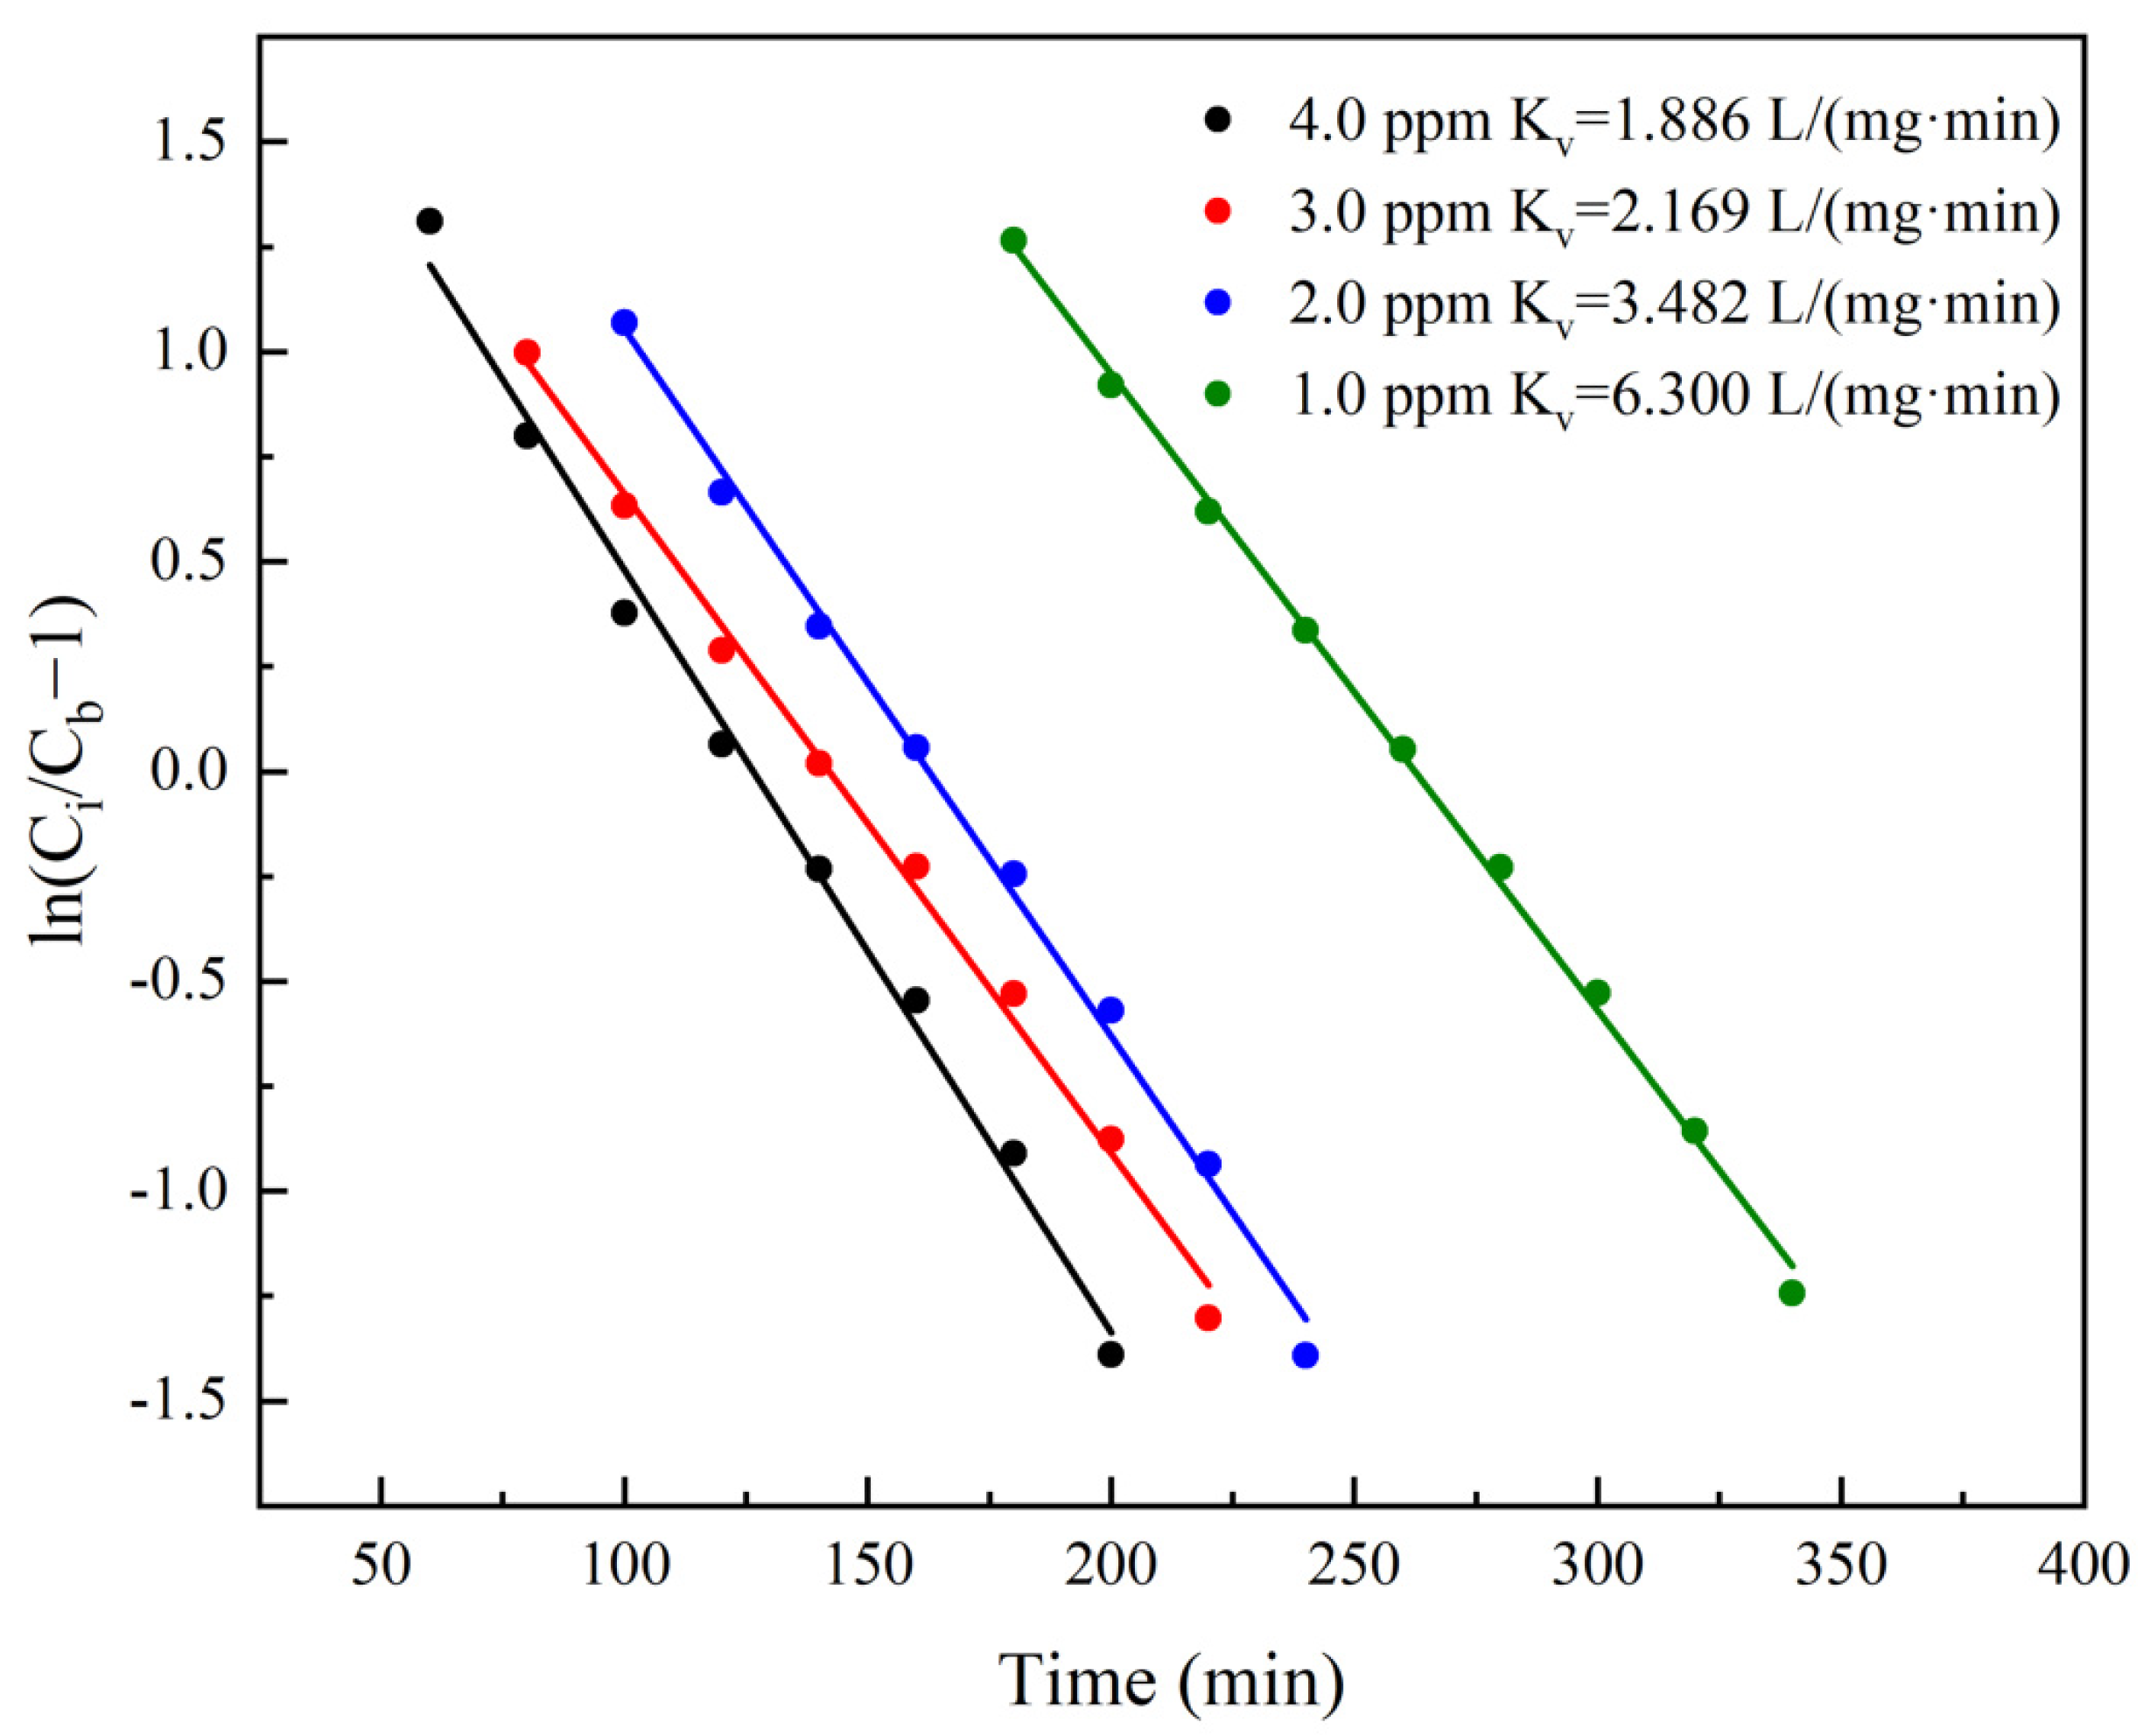
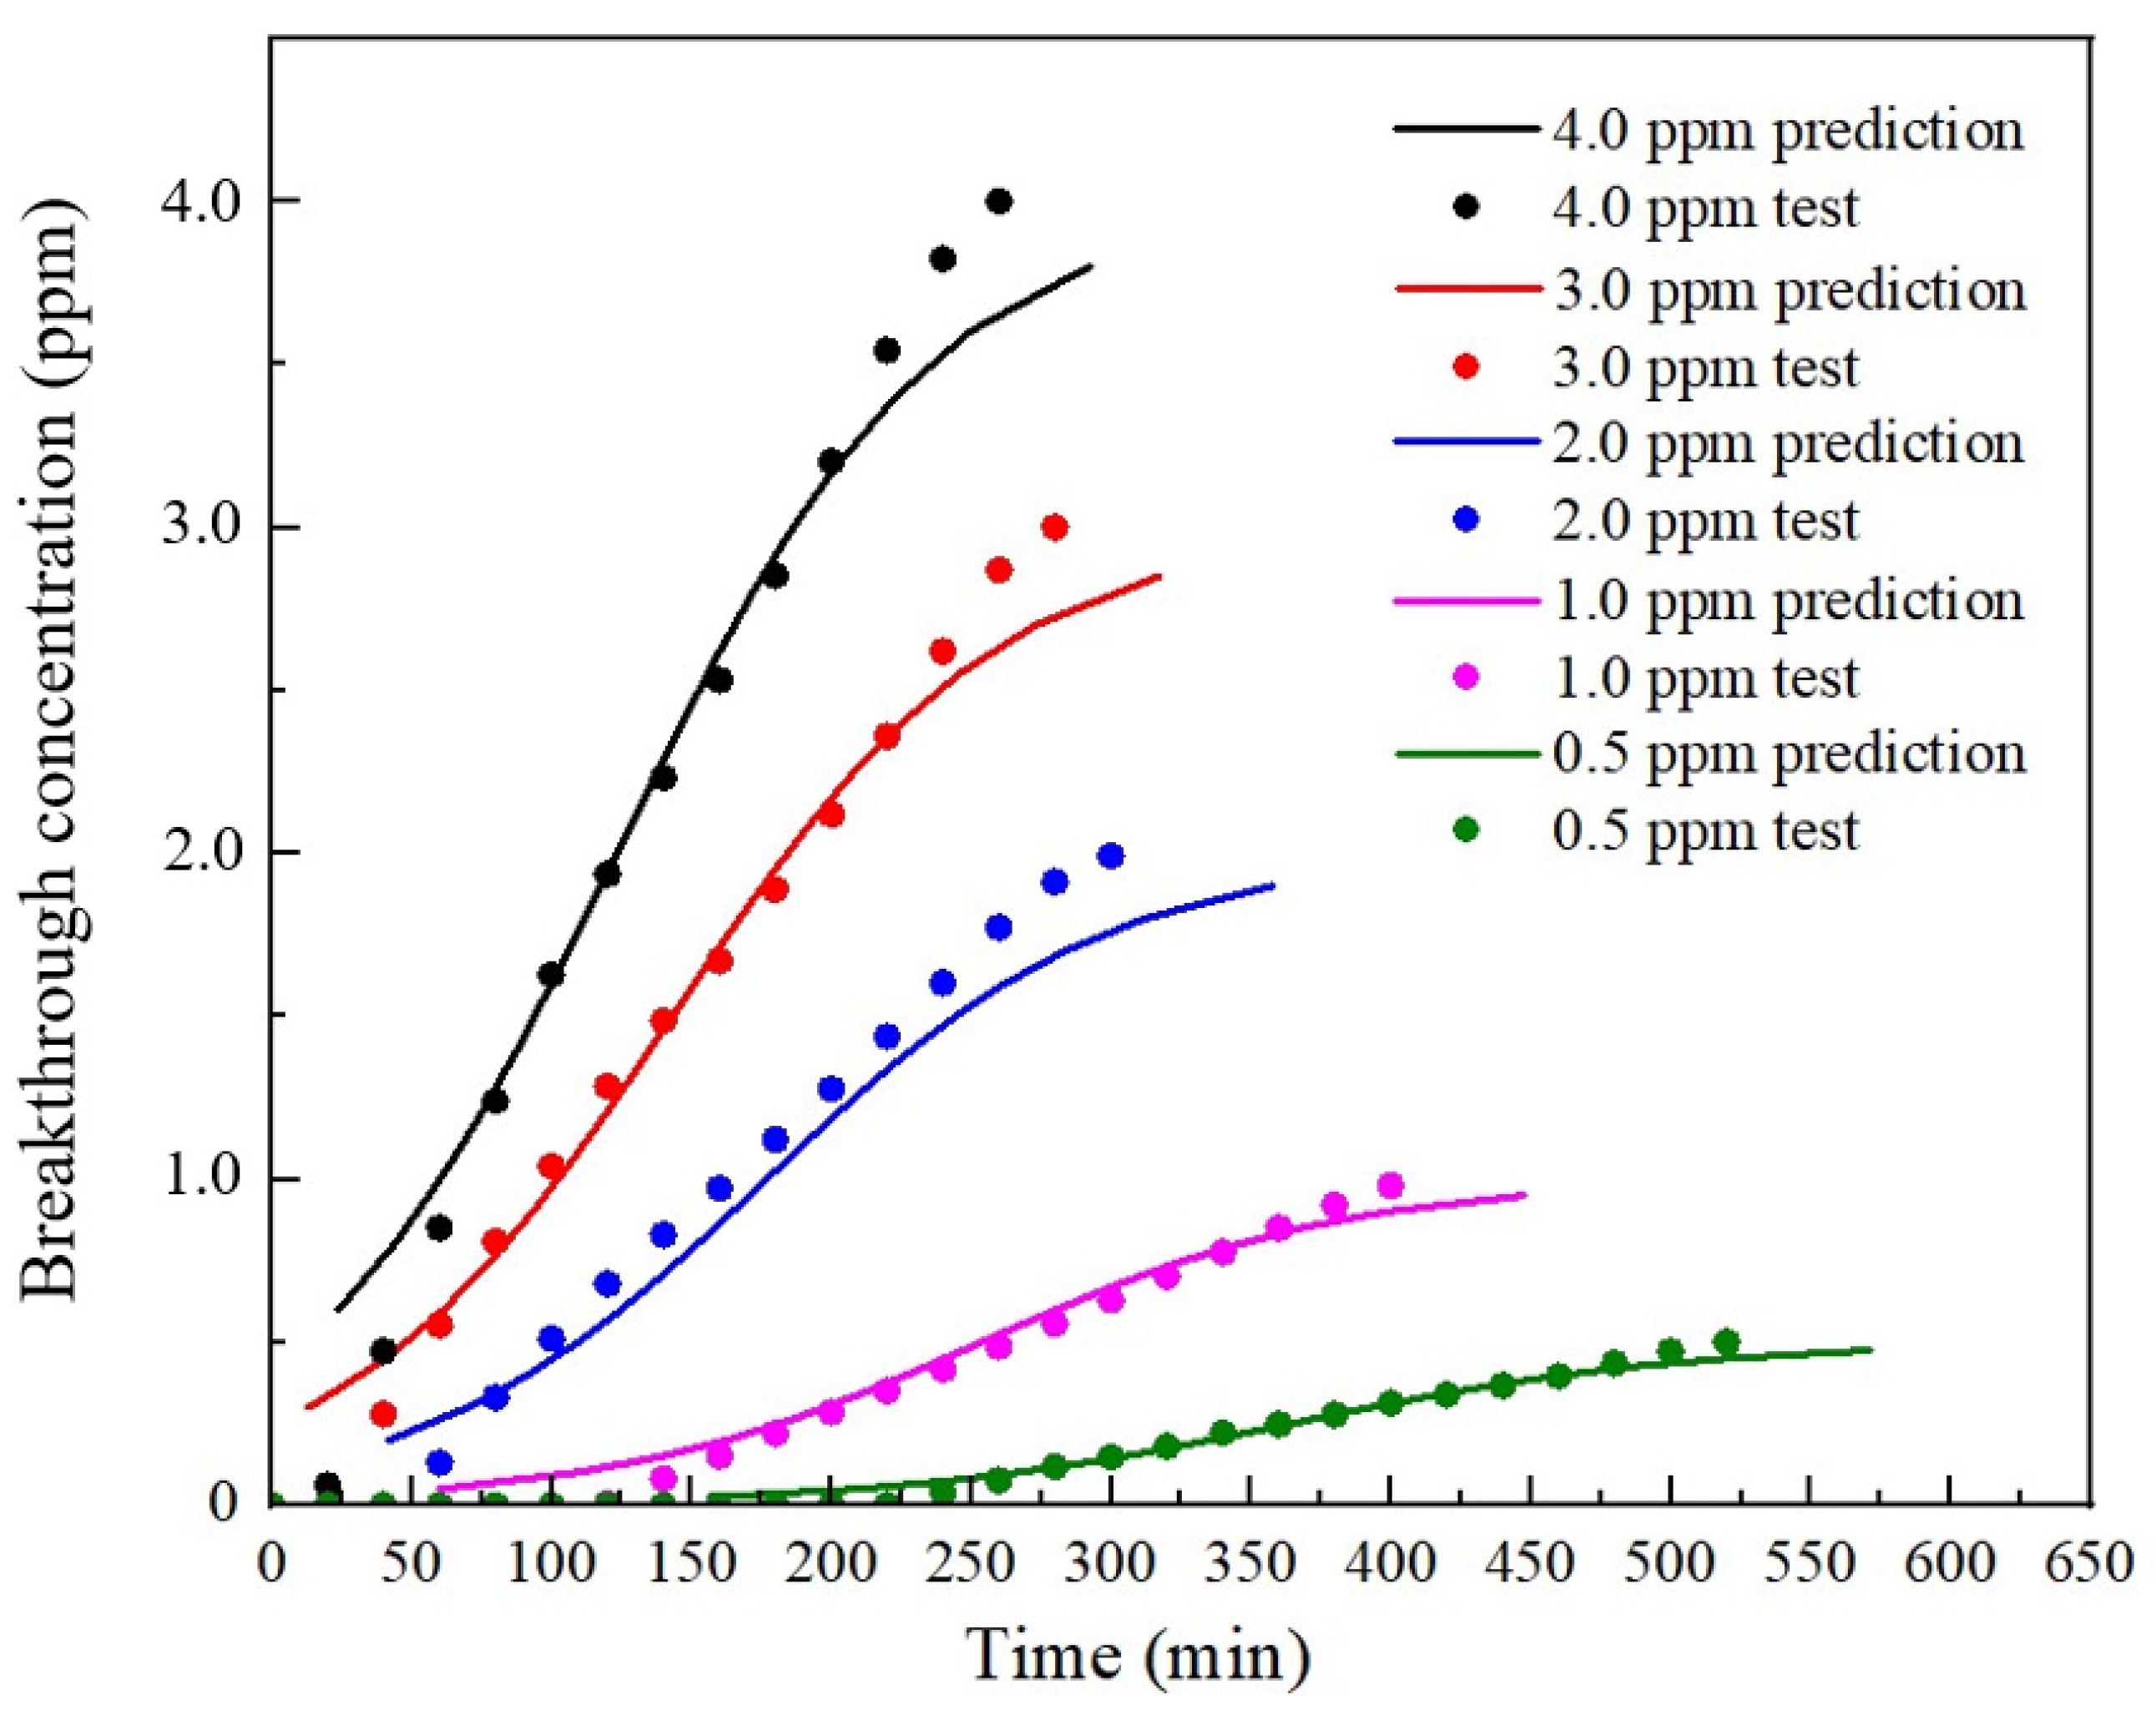
4.2.1. Thomas Model
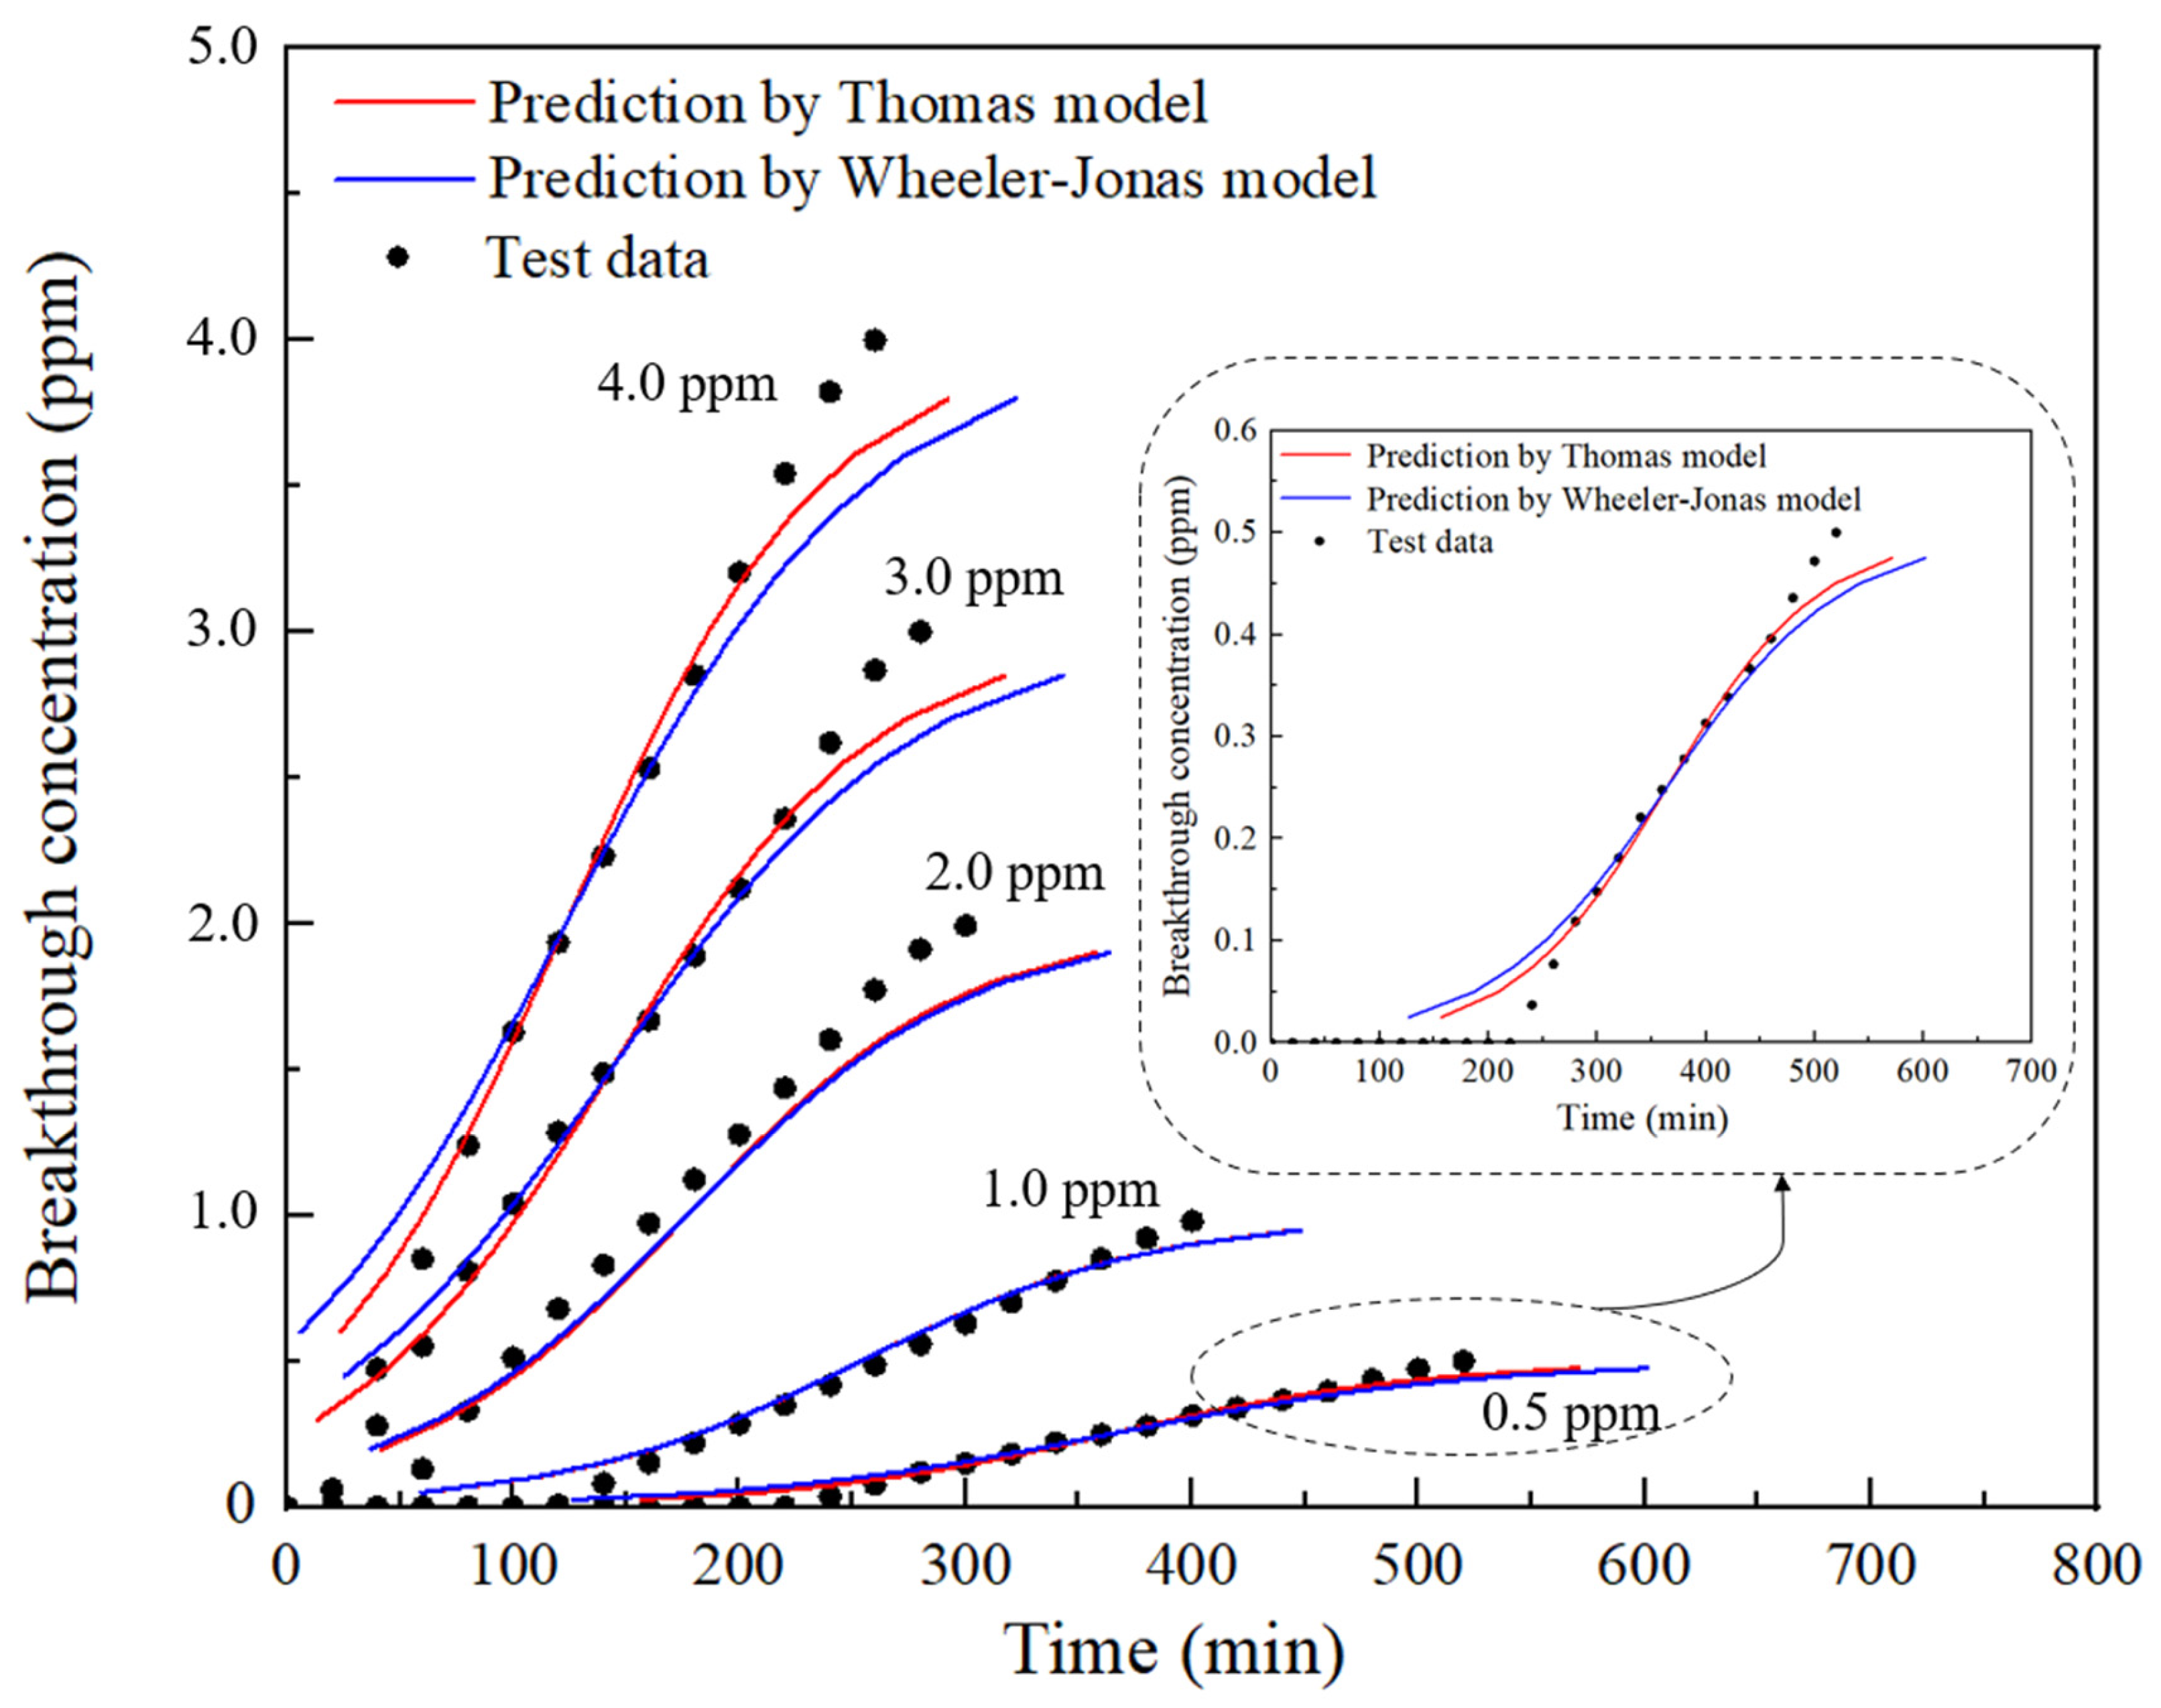
4.2.2. Prediction Process
5. Discussion
6. Conclusions
Author Contributions
Funding
Institutional Review Board Statement
Informed Consent Statement
Data Availability Statement
Conflicts of Interest
References
- Tsai, W.T. An overview of health hazards of volatile organic compounds regulated as indoor air pollutants. Rev. Environ. Health 2019, 34, 81–89. [Google Scholar] [CrossRef] [PubMed]
- Hansel, N.N.; Putcha, N.; Woo, H.; Peng, R.; Diette, G.B.; Fawzy, A.; Wise, R.A.; Romero, K.; Davis, M.F.; Rule, A.M.; et al. Randomized Clinical Trial of Air Cleaners to Improve Indoor Air Quality and Chronic Obstructive Pulmonary Disease Health Results of the CLEAN AIR Study. Am. J. Respir. Crit. Care Med. 2022, 205, 421–430. [Google Scholar] [CrossRef] [PubMed]
- Ayoko, G.A.; Wang, H. Volatile Organic Compounds in Indoor Environments. Environ. Sci. 2014, 64, 69–107. [Google Scholar]
- Zhang, Y.P.; Mo, J.H.; Li, Y.G.; Sundell, J.; Wargocki, P.; Zhang, J.; Little, J.C.; Corsi, R.; Deng, Q.; Leung, M.H.K.; et al. Can commonly-used fan-driven air cleaning technologies improve indoor air quality? A literature review. Atmos. Environ. 2011, 45, 4329–4343. [Google Scholar] [CrossRef] [PubMed]
- Mahmoodi, N.M.; Taghizadeh, M.; Taghizadeh, A. Mesoporous activated carbons of low-cost agricultural bio-wastes with high adsorption capacity: Preparation and artificial neural network modeling of dye removal from single and multicomponent (binary and ternary) systems. J. Mol. Liq. 2018, 269, 217–228. [Google Scholar] [CrossRef]
- Li, X.Q.; Zhang, L.; Yang, Z.Q.; Wang, P.; Yan, Y.; Ran, J. Adsorption materials for volatile organic compounds (VOCs) and the key factors for VOCs adsorption process: A review. Sep. Purif. Technol. 2019, 235, 116213. [Google Scholar] [CrossRef]
- Rajahmundry, G.K.; Garlapati, C.; Kumar, P.S.; Alwi, R.S.; Vo, D.-V.N. Statistical analysis of adsorption isotherm models and its appropriate selection. Chemosphere 2021, 276, 130176. [Google Scholar] [CrossRef]
- Huffer, T.; Weniger, A.K.; Hofmann, T. Sorption of organic compounds by aged polystyrene microplastic particles. Environ. Pollut. 2018, 236, 218–225. [Google Scholar] [CrossRef]
- Gupta, H.; Kumar, R. Removal of PAH Anthracene from Aqueous Media using Banana Peel Activated Carbon. Int. J. Sci. Res. Environ. Sci. 2016, 4, 109–114. [Google Scholar] [CrossRef]
- Lamplugh, A.; Harries, M.; Nguyen, A.; Montoya, L. VOC emissions from nail salon products and their effective removal using affordable adsorbents and synthetic jets. Build. Environ. 2020, 168, 106499. [Google Scholar] [CrossRef]
- Liu, Q.Y.; Liu, Y.J.; Zhang, M.G. Personal exposure and source characteristics of carbonyl compounds and BTEXs within homes in Beijing, China. Build. Environ. 2013, 61, 210–216. [Google Scholar] [CrossRef]
- Verriele, M.; Schoemaecker, C.; Hanoune, B.; Leclerc, N.; Germain, S.; Gaudion, V.; Locoge, N. The MERMAID study: Indoor and outdoor average pollutant concentrations in 10 low-energy school buildings in France. Indoor Air 2016, 26, 702–713. [Google Scholar] [CrossRef]
- Kiurski, J.S.; Marić, B.B.; Aksentijević, S.M.; Oros, I.B.; Kecić, V.S.; Kovačević, I.M. Indoor air quality investigation from screen printing industry. Renew. Sustain. Energy Rev. 2013, 28, 224–231. [Google Scholar] [CrossRef]
- Alali, K.T.; Liu, J.; Liu, Q.; Li, R.; Zhang, H.; Aljebawi, K.; Liu, P.; Wang, J. Enhanced acetone gas sensing response of ZnO/ZnCo2O4 nanotubes synthesized by single capillary electrospinning technology. Sens. Actuators B-Chem. 2017, 252, 511–522. [Google Scholar] [CrossRef]
- Rengga, W.D.P.; Chafidz, A.; Sudibandriyo, M.; Nasikin, M.; Abasaeed, A.E. Silver nano-particles deposited on bamboo-based activated carbon for removal of formaldehyde. J. Environ. Chem. Eng. 2017, 5, 1657–1665. [Google Scholar] [CrossRef]
- Tseng, C.; Wu, H.; Shiue, A.; Hsu, C.; Huang, Y.; Leggett, G. Performance of coated activated carbon filters used in the building environment. J. Chem. Technol. Biotechnol. 2022, 97, 2511–2518. [Google Scholar] [CrossRef]
- Lillo-Ródenas, M.A.; Cazorla-Amorós, D.; Linares-Solano, A. Benzene and toluene adsorption at low concentration on activated carbon fibres. Adsorption 2011, 17, 473–481. [Google Scholar] [CrossRef]
- Yao, X.; Liu, Y.; Li, T.; Zhang, T.; Li, H.; Wang, W.; Shen, X.; Qian, F.; Yao, Z. Adsorption behavior of multicomponent volatile organic compounds on a citric acid residue waste-based activated carbon: Experiment and molecular simulation. J. Hazard. Mater. 2020, 392, 122323. [Google Scholar] [CrossRef]
- Zhou, C.; Zhou, K.; Li, H.; Xu, X.; Liu, B.; Li, H.; Zeng, Z.; Ma, W.; Li, L. Pressure swing adsorption properties of activated carbon for methanol, acetone and toluene. Chem. Eng. J. 2020, 413, 127384. [Google Scholar] [CrossRef]
- Hand, D.W.; Crittenden, J.C.; Thacker, W.E. Simplified models for design of fixed-bed adsorption systems. J. Environ. Eng. 1984, 110, 440–456. [Google Scholar] [CrossRef]
- Yoon, Y.H.; Nelson, J.H. Application of gas adsorption kinetics I. A theoretical model for respirator cartridge service life. Am. Ind. Hyg. Assoc. J. 1984, 45, 509–516. [Google Scholar] [CrossRef] [PubMed]
- Yoon, Y.H.; Nelson, J.H. Application of gas adsorption kinetics II. A theoretical model for respirator cartridge service life and its practical applications. Am. Ind. Hyg. Assoc. J. 1984, 45, 517–524. [Google Scholar] [CrossRef] [PubMed]
- Jonas, L.A.; Rehrmann, J.A. Predictive equations in gas adsorption kinetics. Carbon 1973, 11, 59–64. [Google Scholar] [CrossRef]
- Downarowicz, D.; Zietarska, K. Adsorption of propan-1-ol vapour on Sorbonorit 4 activated carbon—Equilibrium and dynamic studies. Pol. J. Chem. Technol. 2018, 19, 59–64. [Google Scholar] [CrossRef]
- Clark, R.M. Evaluating the cost and performance of field-scale granular activated carbon systems. Environ. Sci. Technol. 1987, 21, 573–580. [Google Scholar] [CrossRef]
- Wolborska, A.; Pustelnik, P. A simplified method for determination of the breakthrough time of an adsorbent layer. Water Res. 1996, 30, 2643–2650. [Google Scholar] [CrossRef]
- Mohammad, H.; Hanafy, H.; Hassan, H. Remediation of lead by pretreated red algae: Adsorption isotherm, kinetic, column modeling and simulation studies. Green Chem. Lett. Rev. 2014, 7, 342–358. [Google Scholar]
- Vizhemehr, A.K.; Haghighat, F.; Lee, C.S. Predicting gas-phase air-cleaning system efficiency at low concentration using high concentration results: Development of a framework. Build. Environ. 2013, 68, 12–21. [Google Scholar] [CrossRef]
- Ligotski, R.; Sager, U.; Schneiderwind, U.; Asbach, C.; Schmidt, F. Prediction of VOC adsorption performance for estimation of service life of activated carbon based filter media for indoor air purification. Build. Environ. 2019, 149, 146–156. [Google Scholar] [CrossRef]
- Shiue, A.; Den, W.; Kang, Y.H.; Hu, S.C.; Jou, G.T.; Lin, C.H.; Hu, V.; Lin, S.I. Validation and application of adsorption breakthrough models for the chemical filters used in the make-up air unit (MAU) of a cleanroom. Build. Environ. 2011, 46, 468–477. [Google Scholar] [CrossRef]
- Laskar, I.I.; Hashisho, Z.; Phillips, J.H.; Anderson, J.E.; Nichols, M. Modeling the Effect of Relative Humidity on Adsorption Dynamics of Volatile Organic Compound onto Activated Carbon. Environ. Sci. Technol. 2019, 53, 2647–2659. [Google Scholar] [CrossRef] [PubMed]
- ISO 10121-2; Test Methods for Assessing the Performance of Gas-Phase Air Cleaning Media and Devices for General Ventilation Part 1: Gas-Phase Air Cleaning Media. ISO: Geneva, Switzerland, 2013.
- Seo, J.; Kato, S.; Ataka, Y.; Chino, S. Performance test for evaluating the reduction of VOCs in rooms and evaluating the lifetime of sorptive building materials. Build. Environ. 2009, 44, 207–215. [Google Scholar] [CrossRef]
- Ammendola, P.; Raganati, F.; Chirone, R. CO2 adsorption on a fine activated carbon in a sound assisted fluidized bed: Thermodynamics and kinetics. Chem. Eng. J. 2017, 332, 302–313. [Google Scholar] [CrossRef]
- Zhao, Z.X.; Wang, S.; Yang, Y.; Li, X.; Li, J.; Li, Z. Competitive adsorption and selectivity of benzene and water vapor on the microporous metal organic frameworks (HKUST-1). Chem. Eng. J. 2015, 259, 79–89. [Google Scholar] [CrossRef]
- Lin, D.R.; Hu, L.J.; Xing, B.S.; You, H.; Loy, D.A. Mechanisms of Competitive Adsorption Organic Pollutants on Hexylene-Bridged Polysilsesquioxane. Materials 2015, 8, 5806–5817. [Google Scholar] [CrossRef]
- Mobasser, S.; Wager, Y.; Dittrich, T.M. Indoor Air Purification of Volatile Organic Compounds (VOCs) Using Activated Carbon, Zeolite, and Organosilica Sorbents. Ind. Eng. Chem. Res. 2022, 61, 6791–6801. [Google Scholar] [CrossRef]
- Wu, J.; Claesson, A.; Fangmark, I.; Hammarstrom, L.-G. A systematic investigation the Wheeler-Jonas equation for of the overall rate coefficient in adsorption on dry activated carbons. Carbon 2005, 43, 481–490. [Google Scholar] [CrossRef]
- Busmundrud, O. Vapor breakthrough in activated carbon beds. Carbon 1993, 31, 279–286. [Google Scholar] [CrossRef]
- Njaramba, L.K.; Kim, S.; Kim, Y.; Cha, B. Remarkable adsorption for hazardous organic and inorganic contaminants by multifunctional amorphous core-shell structures of metal-organic framework-alginate composites. Chem. Eng. J. 2022, 431, 133415. [Google Scholar] [CrossRef]
- Li, L.C.; Wang, L.; Shi, K.Z.; Hua, Z.; Zhu, Z.; Cheng, Y.; Li, X. Study on acetone adsorption performance of activated carbon with different water content. J. For. Eng. 2018, 3, 56–61. [Google Scholar]
- Grévillot, G.; Marsteau, S.; Vallières, C. A Comparison of the Wheeler-Jonas Model and the Linear Driving Force at Constant-Pattern Model for the Prediction of the Service Time of Activated Carbon Cartridges. J. Occup. Environ. Hyg. 2011, 8, 279–288. [Google Scholar] [CrossRef] [PubMed]
- Sheng, Y.; Dong, Q.Q.; Wang, M.Y. Prediction for the Adsorption of Low-Concentration Toluene by Activated Carbon. Sustainability 2023, 15, 1555. [Google Scholar] [CrossRef]
- Ang, T.N.; Young, B.R.; Taylor, M.; Burrell, R.; Aroua, M.K.; Baroutian, S. Breakthrough analysis of continuous fixed-bed adsorption of sevoflurane using activated carbons. Chemosphere 2020, 239, 124839. [Google Scholar] [CrossRef] [PubMed]


| Property | Value |
|---|---|
| Specific surface area (m2/g) | 519.8 |
| Average pore size (nm) | 2.71 |
| Total pore volume (cm3/g) | 0.0994 |
| Micropore volume (cm3/g) | 0.0030 |
| Mesoporous pore volume (cm3/g) | 0.0849 |
| Macroporous pore volume (cm3/g) | 0.0115 |
| Device | Measurement Range | Accuracy |
|---|---|---|
| ppbRAE 3000 | 1 ppb~10,000 ppm | ±3% (10~2000 ppm isobutene), 1 ppb resolution |
| Mass flow meter 1 | 0~10 L/min | ±1% |
| Mass flow meter 2 | 0~2 L/min | ±1% |
| Adsorption Isotherm | Parameter | Fitting Degree R2 |
|---|---|---|
| Langmuir | = 34.602 mg/g, = 0.247 | 0.9457 |
| Freundlich | = 8.360, = 0.479 | 0.9847 |
| D-R | = 21.235 mg/g, = 2183.636 | 0.7664 |
| Temkin | = 6.763 mg/g, = 7.605 m3/g | 0.9464 |
| Inlet Concentration of Acetone (ppm) | Test Data of Service Life (min) | Predicted Value Based on the Wheeler–Jonas Model (min) | Predicted Value Based on the Thomas Model (min) | Relative Deviation Based on the Wheeler–Jonas Model | Relative Deviation Based on the Thomas Model |
|---|---|---|---|---|---|
| 4.0 | 260 | 322 | 292 | 24% | 12% |
| 3.0 | 280 | 343 | 317 | 23% | 13% |
| 2.0 | 310 | 364 | 358 | 17% | 15% |
| 1.0 | 405 | 448 | 447 | 11% | 10% |
| 0.5 | 520 | 601 | 571 | 16% | 10% |
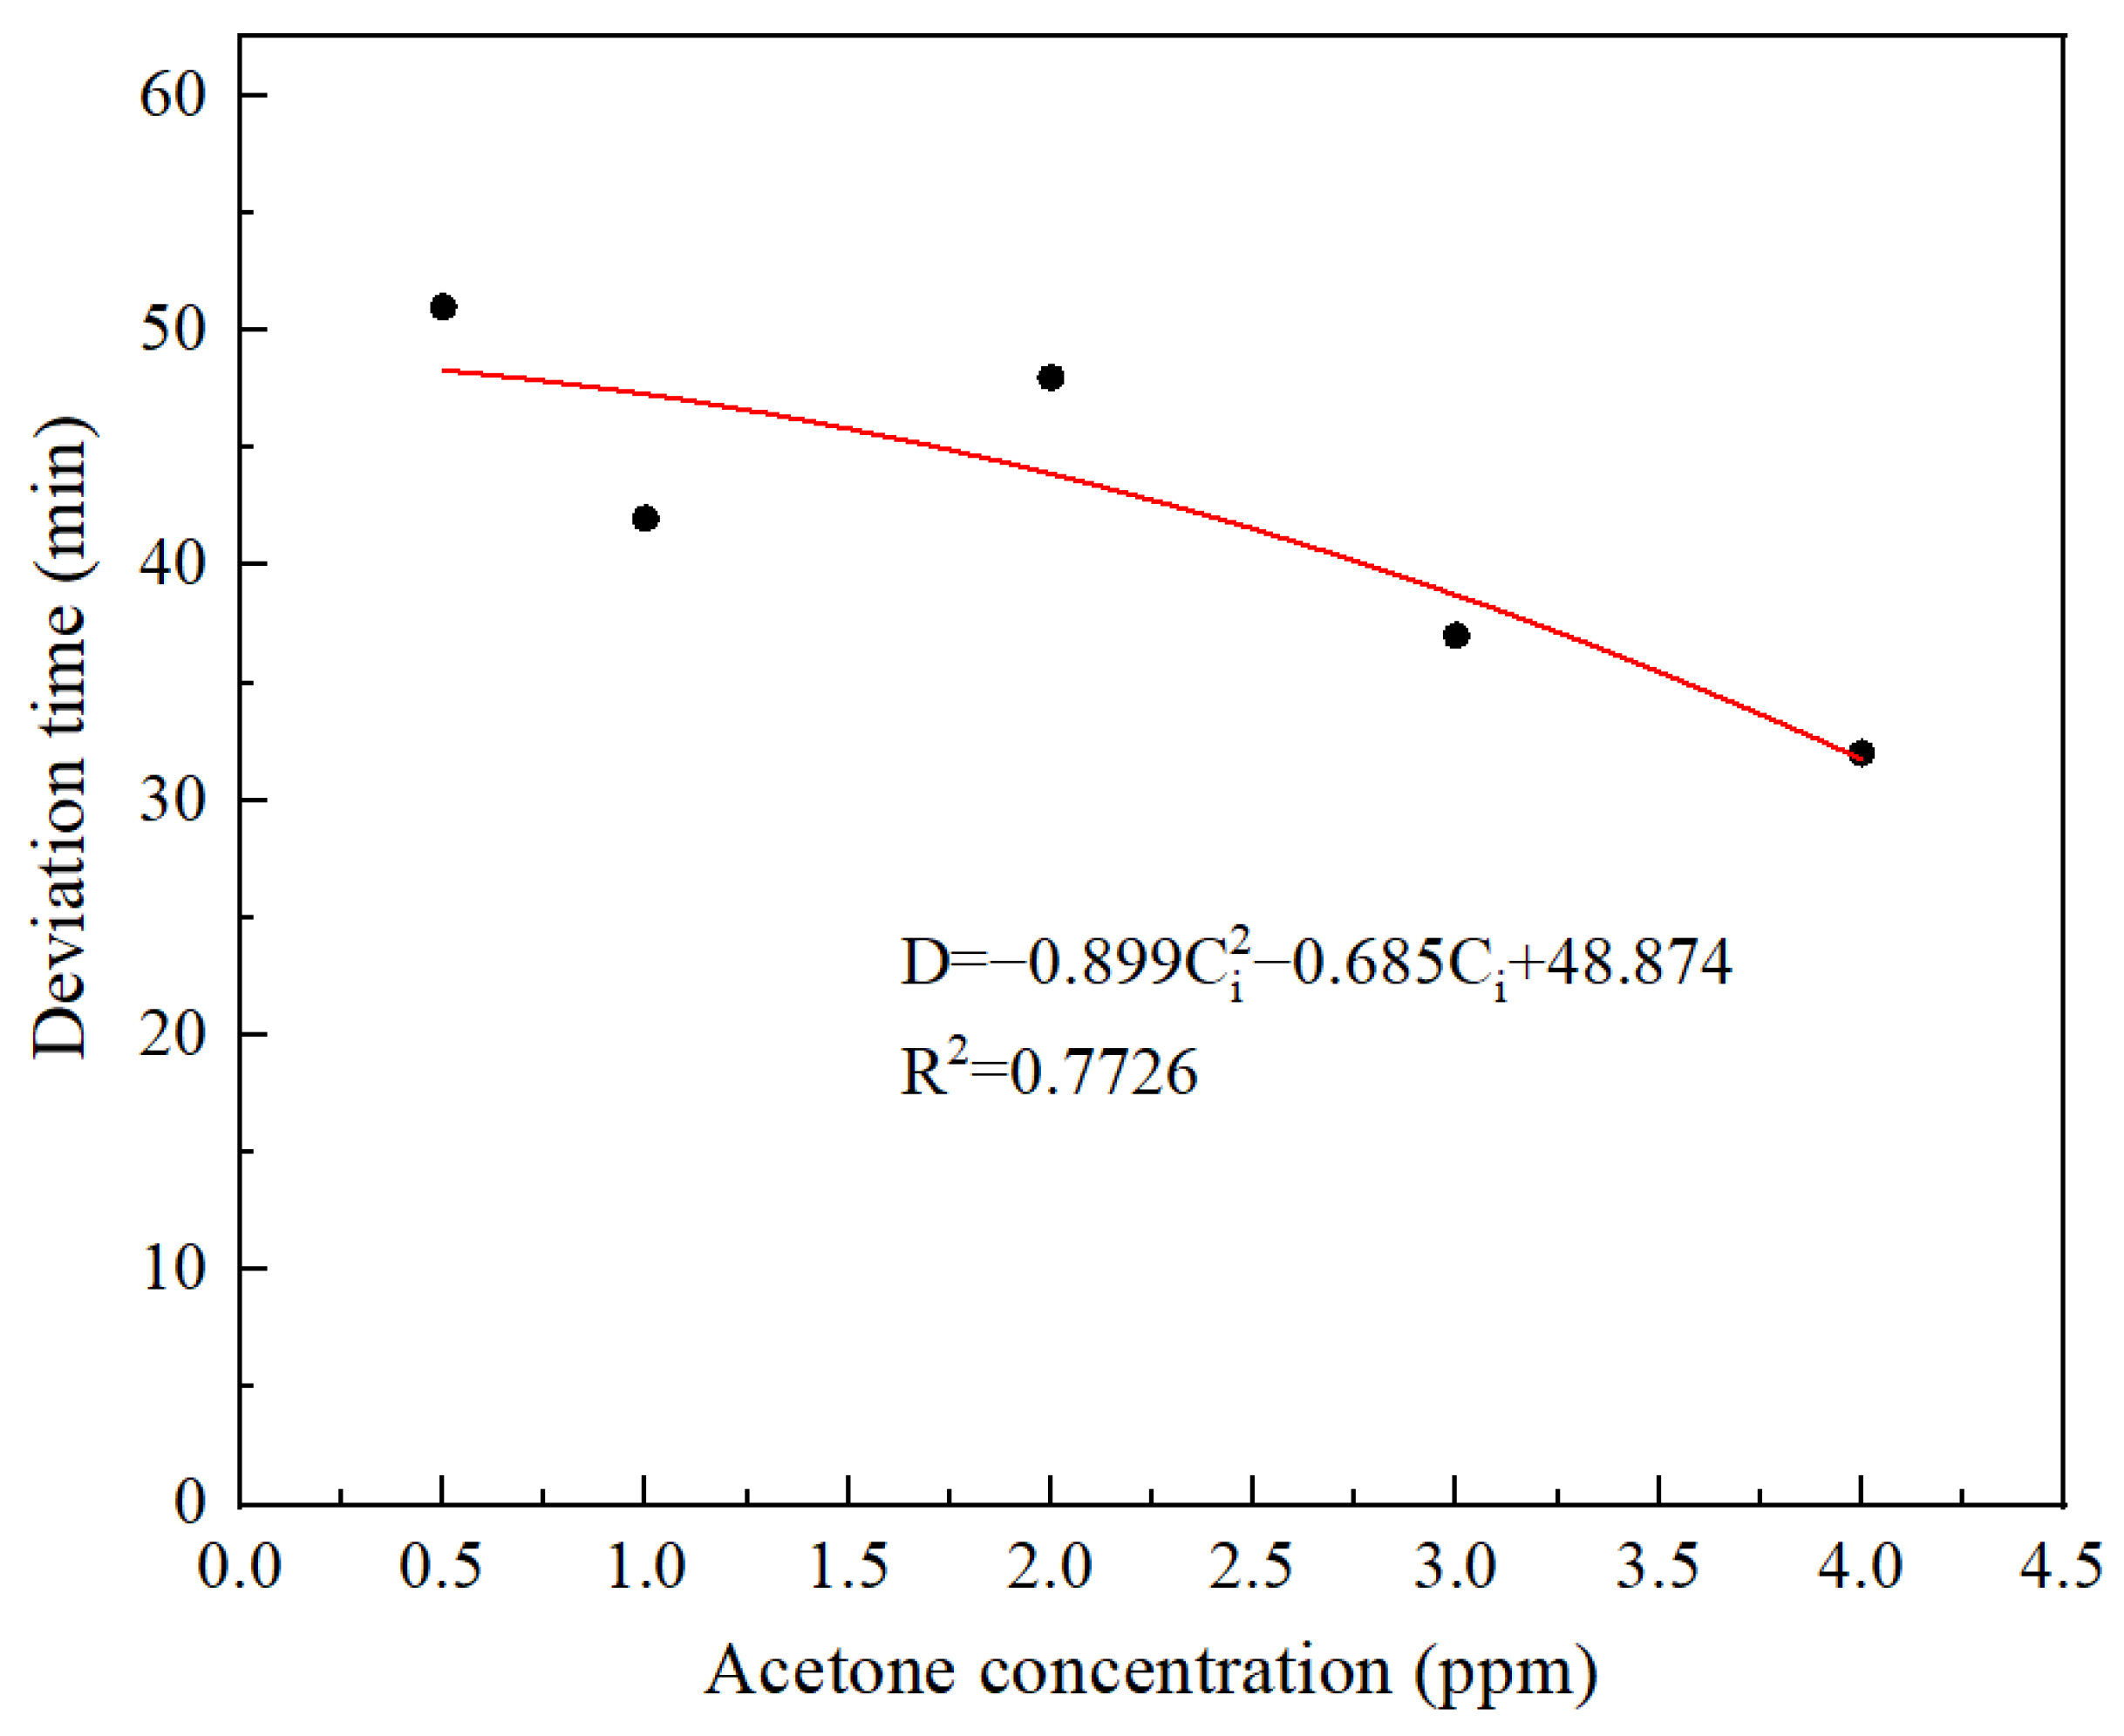
| Inlet Concentration of Acetone (ppm) | Deviation Time (min) | Modified Service Life (min) | Test Data of Service Life (min) | Relative Error |
|---|---|---|---|---|
| 4 | 32 | 260 | 260 | 0.1% |
| 3 | 37 | 278 | 280 | 0.6% |
| 2 | 38 | 314 | 310 | 4.7% |
| 1 | 37 | 400 | 405 | 0.1% |
| 0.5 | 51 | 523 | 520 | 0.5% |
Disclaimer/Publisher’s Note: The statements, opinions and data contained in all publications are solely those of the individual author(s) and contributor(s) and not of MDPI and/or the editor(s). MDPI and/or the editor(s) disclaim responsibility for any injury to people or property resulting from any ideas, methods, instructions or products referred to in the content. |
© 2023 by the authors. Licensee MDPI, Basel, Switzerland. This article is an open access article distributed under the terms and conditions of the Creative Commons Attribution (CC BY) license (https://creativecommons.org/licenses/by/4.0/).
Share and Cite
Sheng, Y.; Ren, Q.; Dong, Q. Experimental and Modeled Results Describing the Low-Concentration Acetone Adsorption onto Coconut Shell Activated Carbon. Sustainability 2023, 15, 14803. https://doi.org/10.3390/su152014803
Sheng Y, Ren Q, Dong Q. Experimental and Modeled Results Describing the Low-Concentration Acetone Adsorption onto Coconut Shell Activated Carbon. Sustainability. 2023; 15(20):14803. https://doi.org/10.3390/su152014803
Chicago/Turabian StyleSheng, Ying, Qiang Ren, and Qingqing Dong. 2023. "Experimental and Modeled Results Describing the Low-Concentration Acetone Adsorption onto Coconut Shell Activated Carbon" Sustainability 15, no. 20: 14803. https://doi.org/10.3390/su152014803