Abstract
The hot-summer and cold-winter climate zone spans a large latitude, where the passive means of retrofitting the Trombe wall (TW) can be utilized to effectively improve the indoor wind environment and thermal comfort. In this study, a public building in Wenzhou, China, was selected as the object, and CFD numerical simulations and the wind environment data in spring, summer, and fall were collected through field experimental measurements. Comparative analyses were carried out to explore the adaptive strategy and effectiveness of the application of the Trombe wall on the local wind environment and climate and to quantify the improvement effect of the application of the Trombe wall on the Indoor environment. The results showed that the application of the Trombe wall in spring and fall in hot-summer and cold-winter regions could obviously increase the average indoor wind speed and the wind speed at the building outlet by 0.2–0.8 m/s and 0.9–3.6 m/s, respectively. This further effectively prolongs the indoor thermal comfort hours in spring and fall, which is a relatively applicable season, while the ventilation performance in summer is poor compared to spring and fall seasons.
1. Introduction
China’s vast geography contributes to a rich diversity of climatic types, each playing a critical role in architectural design and posing direct influences on the comfort of the building’s internal environment and its energy efficiency. Thus, it is meaningful to obtain a profound understanding of climatic influences so as to develop and duplicate various advanced solar building technologies. Therefore, architectural and technological applications may vary among climatic zones. The building to be studied is located in Wenzhou, Zhejiang Province, China, which falls into the hot-summer and cold-winter climatic zone (Figure 1) as per the Residential Building Design Code (GB J96-86) [1]. Natural ventilation is considered a prevalent strategy for improving indoor air quality and reducing building energy consumption in modern architecture, and Trombe walls represent a typical passive solar technology that effectively enhances natural ventilation and convection [2,3,4], which can effectively improve the indoor air environment. Compared to mechanical ventilation, natural ventilation has garnered attention from many scholars by taking significant energy-saving advantages with broad application prospects in transitional seasons and various climatic zones. Trombe wall structures utilize solar radiation to power airflow and combine ventilation techniques with modern solar energy utilization to deliver optimal ventilation performance [5], being seamlessly integrated into various architectural designs [6], balancing aesthetic and practical values [7].
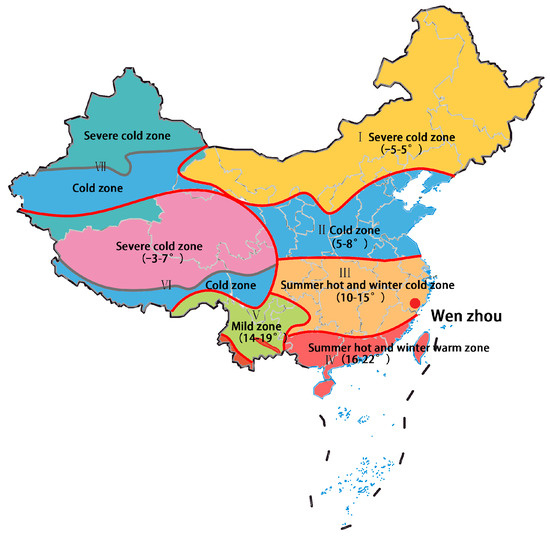
Figure 1.
Seven building climate zones in China and location of Wenzhou (from China Meteorological Administration).
The principles of buildings with Trombe wall construction in enhancing their building ventilation can be summarized as follows: to absorb as much energy as possible from the solar radiation and heat the air inside the chimney passage to a great extent, thus creating a sufficient temperature difference inside the passage and a pressure difference at the inlet. This further drives the passage airflow upwards, and the airflow at the inlet flows from the interior into the passage to increase the amount of indoor ventilation and air exchange. Therefore, both at home and abroad, a large number of experts and professors, as well as engineers, have invested a lot of effort into the architectural application of Trombe walls in different seasons, regions, and use conditions.
Shi et al. (2018) [8] summarized four groups of factors influencing Trombe wall performance (encompassing 13 parameters), including configuration and installation methods of Trombe walls and buildings, material properties, and external environment. Fahmy et al. (2014) [9] analyzed ventilation and thermal comfort in residential buildings using three different Trombe wall configurations to enhance the ability to predict the impact of climate change. Recently, Abdeen et al. (2019) [10] developed a 3D quasi-steady-state CFD model for predicting buoyancy airflows, which was validated through experiments with an inclined solar chimney connected to a single room. Elghamry, R. (2020) [11] and others conducted theoretical and experimental studies on the performance of Trombe wall systems in building heating and ventilation. They pointed out that the Trombe wall possesses satisfactory ventilation and heat preservation performance in buildings. On this basis, domestic and foreign scholars continue to conduct many numerical and experimental studies on Trombe walls to investigate their ventilation performance. For instance, Ana Briga et al. (2017) [12] performed an experimental study in a building retrofitted with a classical Trombe wall to analyze the effects of shading devices and vents on the indoor environment under a high range of climatic conditions. The results suggested that the indoor ventilation of the Trombe wall in the building needs to reach a controlled state so that it can perform better.
Computational fluid dynamics (CFD) is considered an important methodology for studying passive ventilation. It can be used to predict airflow and temperature distributions through numerical simulations [13] to rapidly develop optimization strategies for ventilation performance [14]. DuL (2020) [15] investigated the airflow characteristics to improve the performance of a Trombe wall (TW) through numerical simulations, providing a reliable basis for its design and natural ventilation analysis. Jimenez-Xaman et al. (2020) [16] numerically simulated the thermal performance of TW in a single room in Mexico in summer and winter, and it was found that the ventilation rate could be obviously improved. Sundar et al. (2020) [17] combined CFD and experimental methods to investigate the ventilation performance under different heat flow intensities and geometrical parameters. This provided a reference for the design of the Trombe wall. Bilgen (2009) [18] explored the coupled heat transfer by thermal conductivity in the wall and natural convection in the channel, emphasizing the importance of thermal insulation measures to improve ventilation performance. These studies demonstrate the high accuracy of CFD in predicting and optimizing the natural ventilation performance of Trombe walls in buildings.
Research on the seasonal impact on Trombe wall performance remains in the preliminary stage, indicating that the utilization and value of Trombe walls are intimately linked with local climatic conditions. Jibo Long et al. (2018) [19] introduced a novel Trombe wall design that meets insulation requirements for both summer and winter. This new structure consists of solar collectors, a heat radiation reflective layer, and an indoor radiation panel and was experimentally validated. Ma et al. (2018) [20] investigated the performance of Trombe walls in Japanese climatic conditions, comparing the results with existing experimental data. Findings showed that Trombe walls could save up to 50% of air conditioning electricity throughout the year. Koronakis (1992) [21] explored the application of Trombe wall systems in the Mediterranean summer climate, revealing that the walls could maintain temperature at night without solar radiation, thereby improving the indoor wind environment. Demirbilek et al. (2003) [22] conducted detailed research on a solar building located at an altitude of 2465 m in Turkey, focusing on nighttime ventilation and shading measures during summer and winter, which provides valuable insights for the application of Trombe-type structures in local climatic conditions. In accordance with the arguments in the existing literature, it is clear that the study of the seasonal ventilation performance of Trombe walls applied to buildings can optimize the ventilation effect of Trombe walls under different seasons in order to improve the energy efficiency and occupant comfort of buildings.
Trombe walls have an important impact on enhancing indoor ventilation and improving the indoor wind environment and should be paid attention to. Current research has found that by adjusting the design parameters of Trombe walls (e.g., wall material, thickness, color, and the width of the air layer behind them), the thermal performance and ventilation effects can be obviously affected. In addition, experimental studies and field tests have been widely used to evaluate the actual performance of Trombe walls. By comparing Trombe walls with conventional buildings, significant benefits in terms of increased indoor temperatures and reduced energy consumption have been demonstrated. Trombe walls, with other passive solar technologies, have also been reported to achieve superior energy efficiency and indoor environmental quality. These advances demonstrate the great potential of Trombe walls for building ventilation and energy utilization and provide an important theoretical and practical basis for future building design and energy management. Consequently, this research focuses on a solar public building in Wenzhou, China. This study initially examines the seasonal ventilation performance of Trombe walls in hot-summer and cold-winter climate zones through computational fluid dynamics (CFD) numerical simulations. This is followed by on-site experiments to corroborate and align with the simulation results. The study incorporates meteorological data to analyze the changes in indoor comfort environments brought about by ventilation effects across different seasons. The results were collected, and the performance of Trombe walls across time periods and throughout the year was analyzed to summarize a month with better performance. Recommendations were made for the application of Trombe walls.
2. Research Method
2.1. Study Areas
Wenzhou has a meso-subtropical monsoon climate with an average annual temperature of 17.3–20.0 °C, 4.9–11.4 °C in January, and 26.6–31.0 °C in July. The annual precipitation ranges from 1023 to 2494 mm. There are plum rains in spring and summer and tropical cyclones between July and September. Usually, the frost-free period lasts 241–326 days. The number of hours of sunshine throughout the year ranges between 1442 and 2264.
In contrast, the summer season sees predominant southerly winds from the ocean, bringing higher precipitation and temperature. The weather in spring and autumn is relatively stable. The annual wind direction distribution is evident, as can be seen from Figure 2. The overall climatic features of the region include moderate temperature, abundant heat, distinct seasons, and significant monsoonal influence.
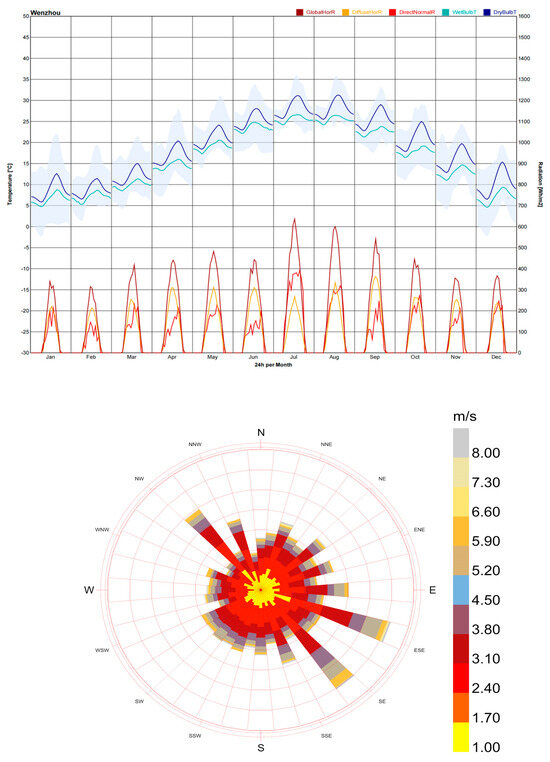
Figure 2.
Climate data of Wenzhou.
Wenzhou is a quintessential region with hot summers and cold winters; thus, it is selected as the focus of this study.
2.2. Research Subject
A public building located in Wenzhou, along the southeastern coast of China, designed as a space for rest and pause, is used as the research subject. Constructed in 2022, as illustrated in Figure 3, the building is oriented north to south, surrounded by open, unobstructed space, facilitating effective solar radiation capture. A Trombe wall system is installed on the southern side, while the remaining facades feature glass curtain walls, making it a distinctive solar energy structure in the area.
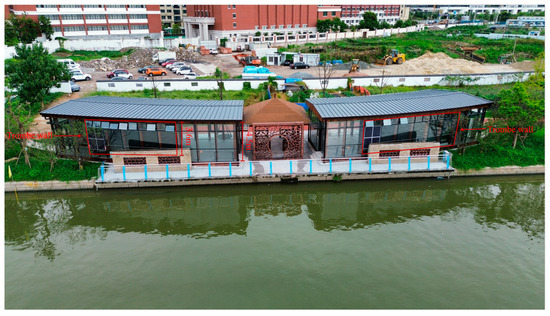
Figure 3.
Bird’s eye view of experimental building in summer.
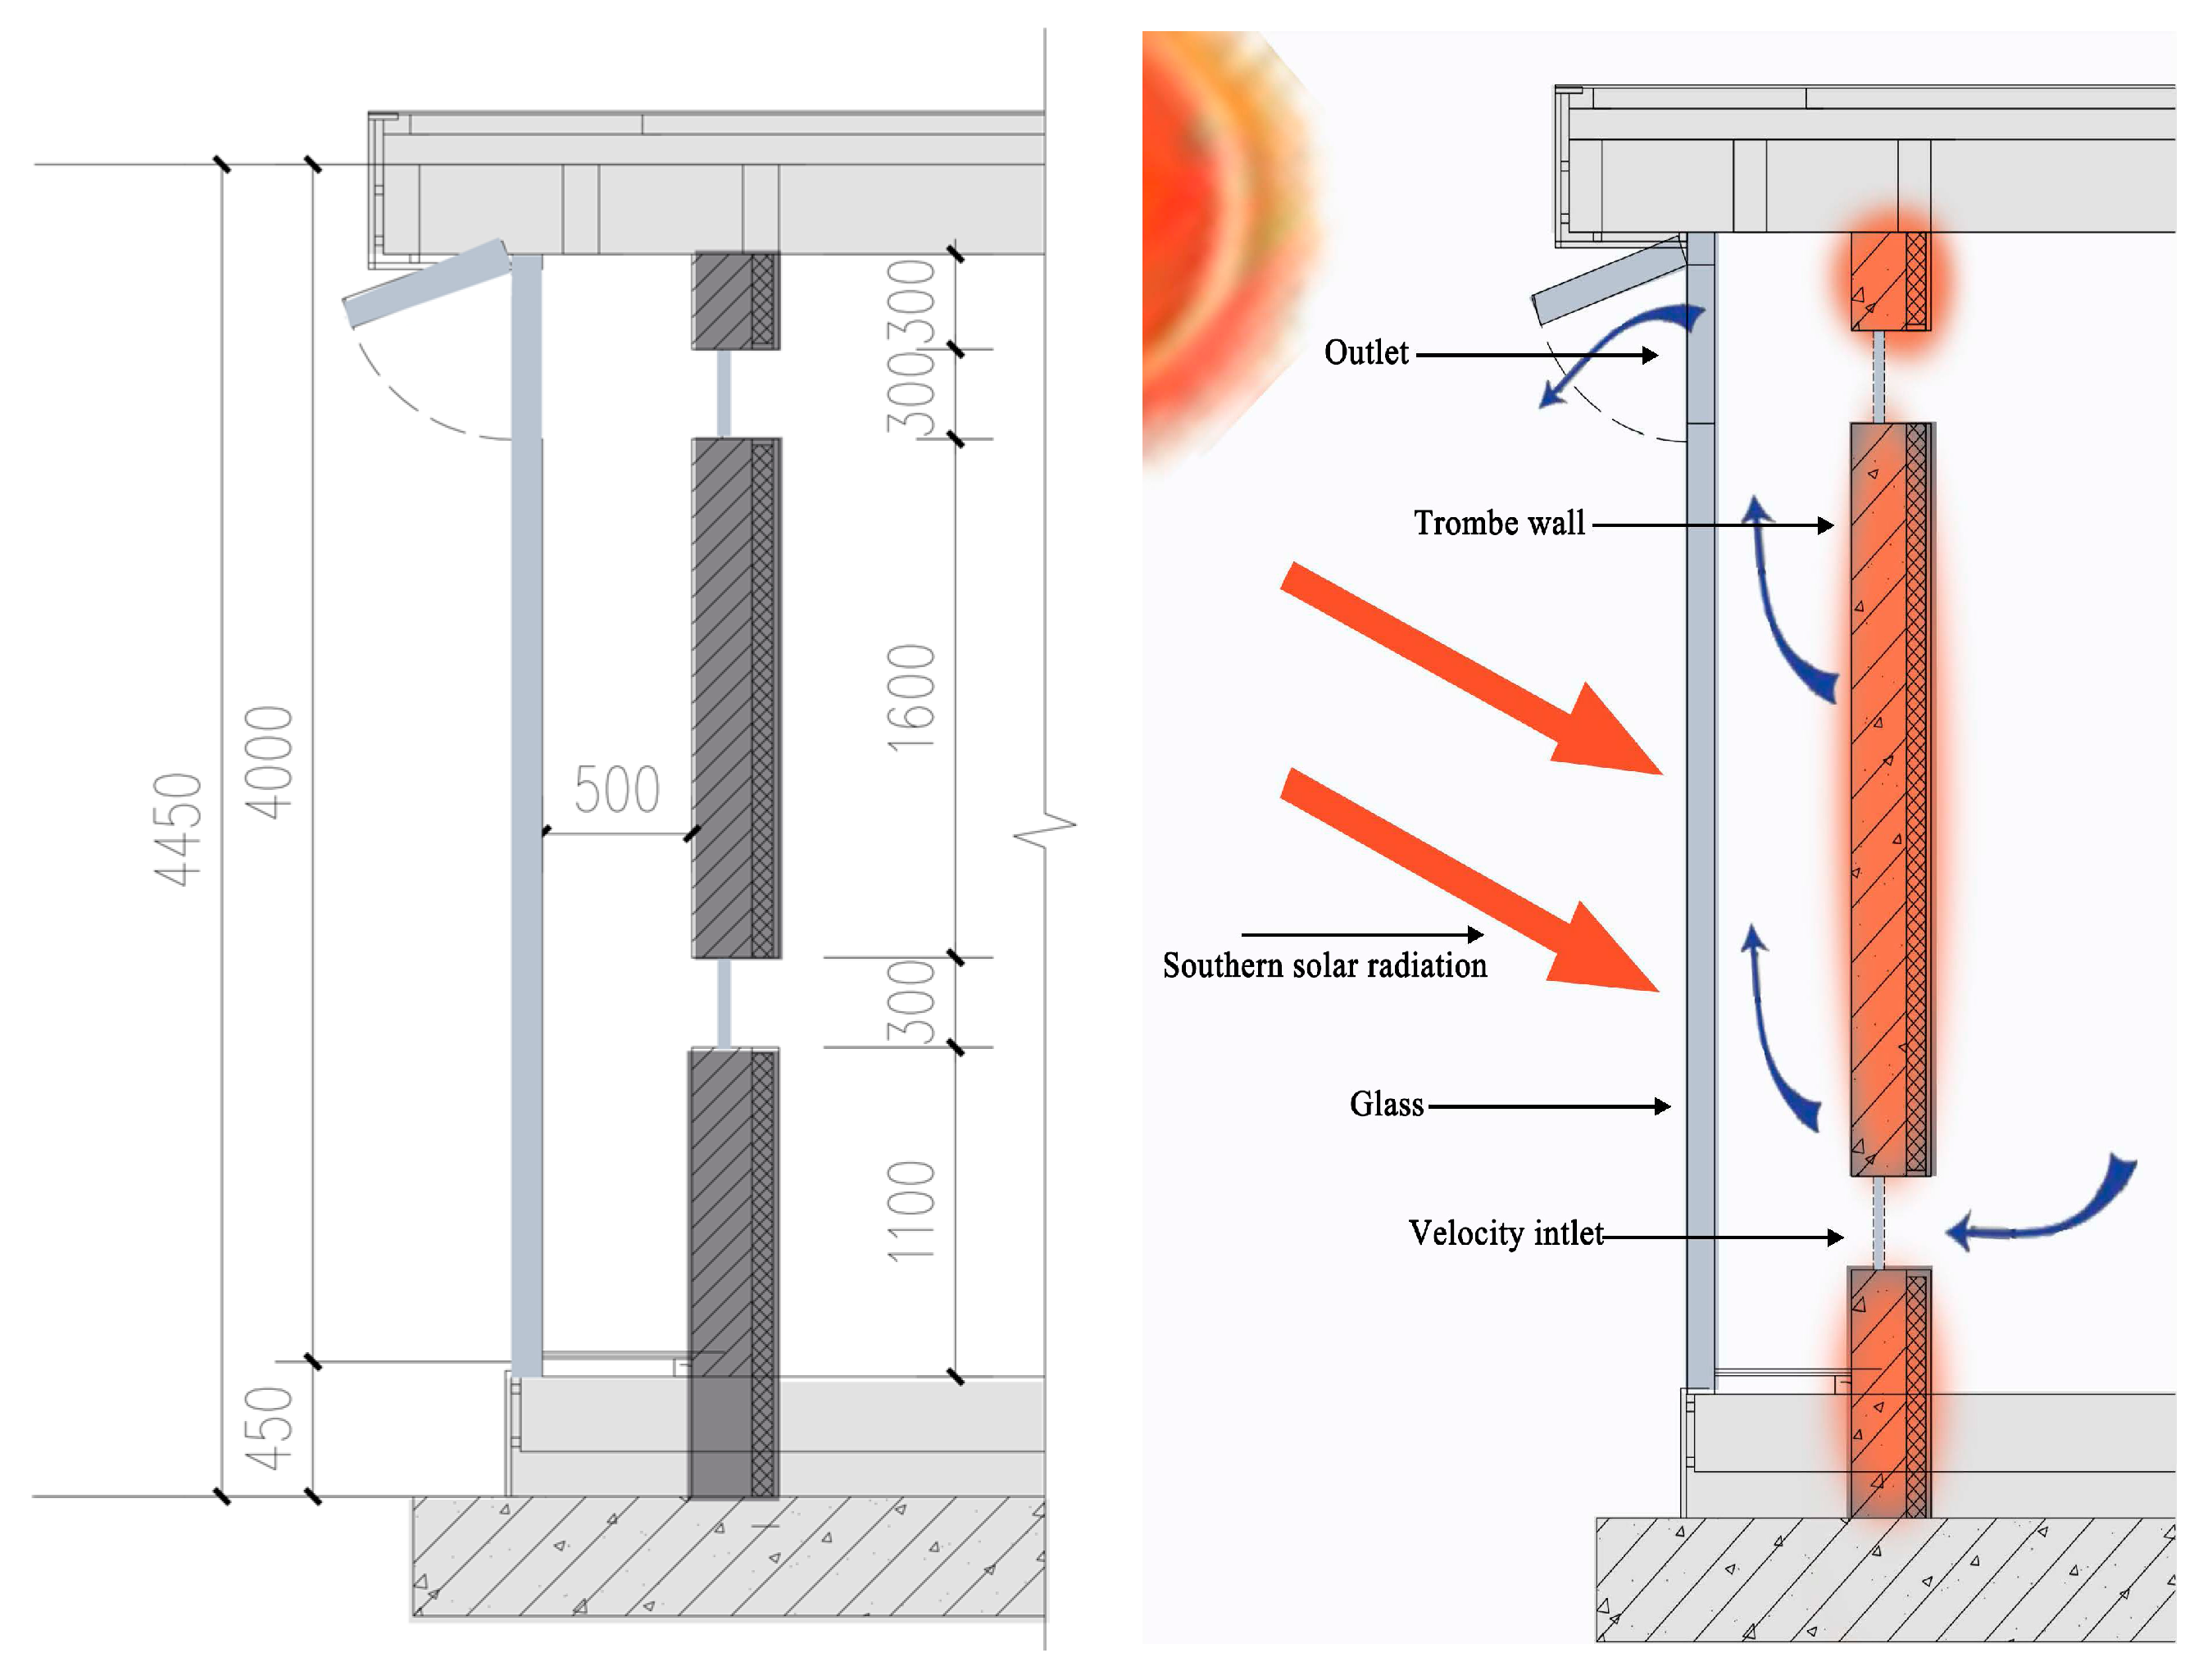
As depicted in Figure 4, the Trombe wall represents a thickness of 0.08 m, with its heat-absorbing surface painted black. The 7 mm double-layered tempered glass in the southern wall enhances the insulating effect within the chimney passage, thereby promoting convection. The cavity of the Trombe wall measures 0.5 m in width, and both the inlet and outlet of the chimney system are equipped with adjustable glass covers. The building’s overall dimensions are 1.2 m in length, 4.5 m in width, and 4 m in height, offering excellent insulation properties. The physical properties and parameters of various materials inside the building are shown in Table 1. Under the influence of solar radiation, the air within the Trombe wall chimney passage generates an upward buoyant force due to thermal pressure. When the chimney passage is connected with the interior of the building, the movement of indoor air is induced, thereby enhancing the building’s natural ventilation.
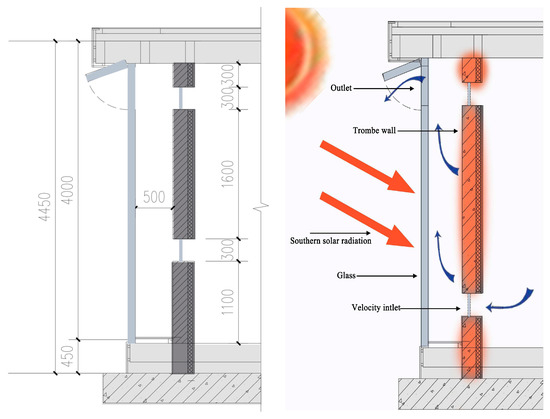
Figure 4.
Detailed schematic of Trombe wall.

Table 1.
Table of physical properties of materials.
2.3. Air Movement Equation
Experimental data indicate that the air movement within the chimney is in a state of turbulence, thus warranting the use of the standard k-ε turbulence model. Given the natural convective heat transfer from the thermal storage wall to the air in the passage and the existence of a flow boundary layer near this wall, a boundary layer grid close to the wall surface is utilized during grid division. Concurrently, the standard wall function method is employed to address boundary layer issues. This approach integrates the variables at the wall surface with those in the turbulent region of the passage [23,24,25], facilitating the determination of nodal variable values for the control volumes adjacent to the wall, leading to more precise simulation results.
The turbulent kinetic energy k and its dissipation rate ε satisfy the following relationship:
where Gk represents the turbulent kinetic energy generated by mean velocity gradient; Gbdenotes the turbulent kinetic energy produced by buoyancy effect; YM signifies the impact of compressible turbulence fluctuations on the total dissipation rate; 1C1ε, 2C2ε, and 3C3ε are the default constants in CFD calculations, with values of 1.44, 1.92, and 0.09, respectively; σk is the turbulence Prandtl number for turbulent kinetic energy k, set at 1.0; and σε is the turbulence Prandtl number for the dissipation rate ε, with a value of 1.3.
2.4. Physical Models for Numerical Simulation
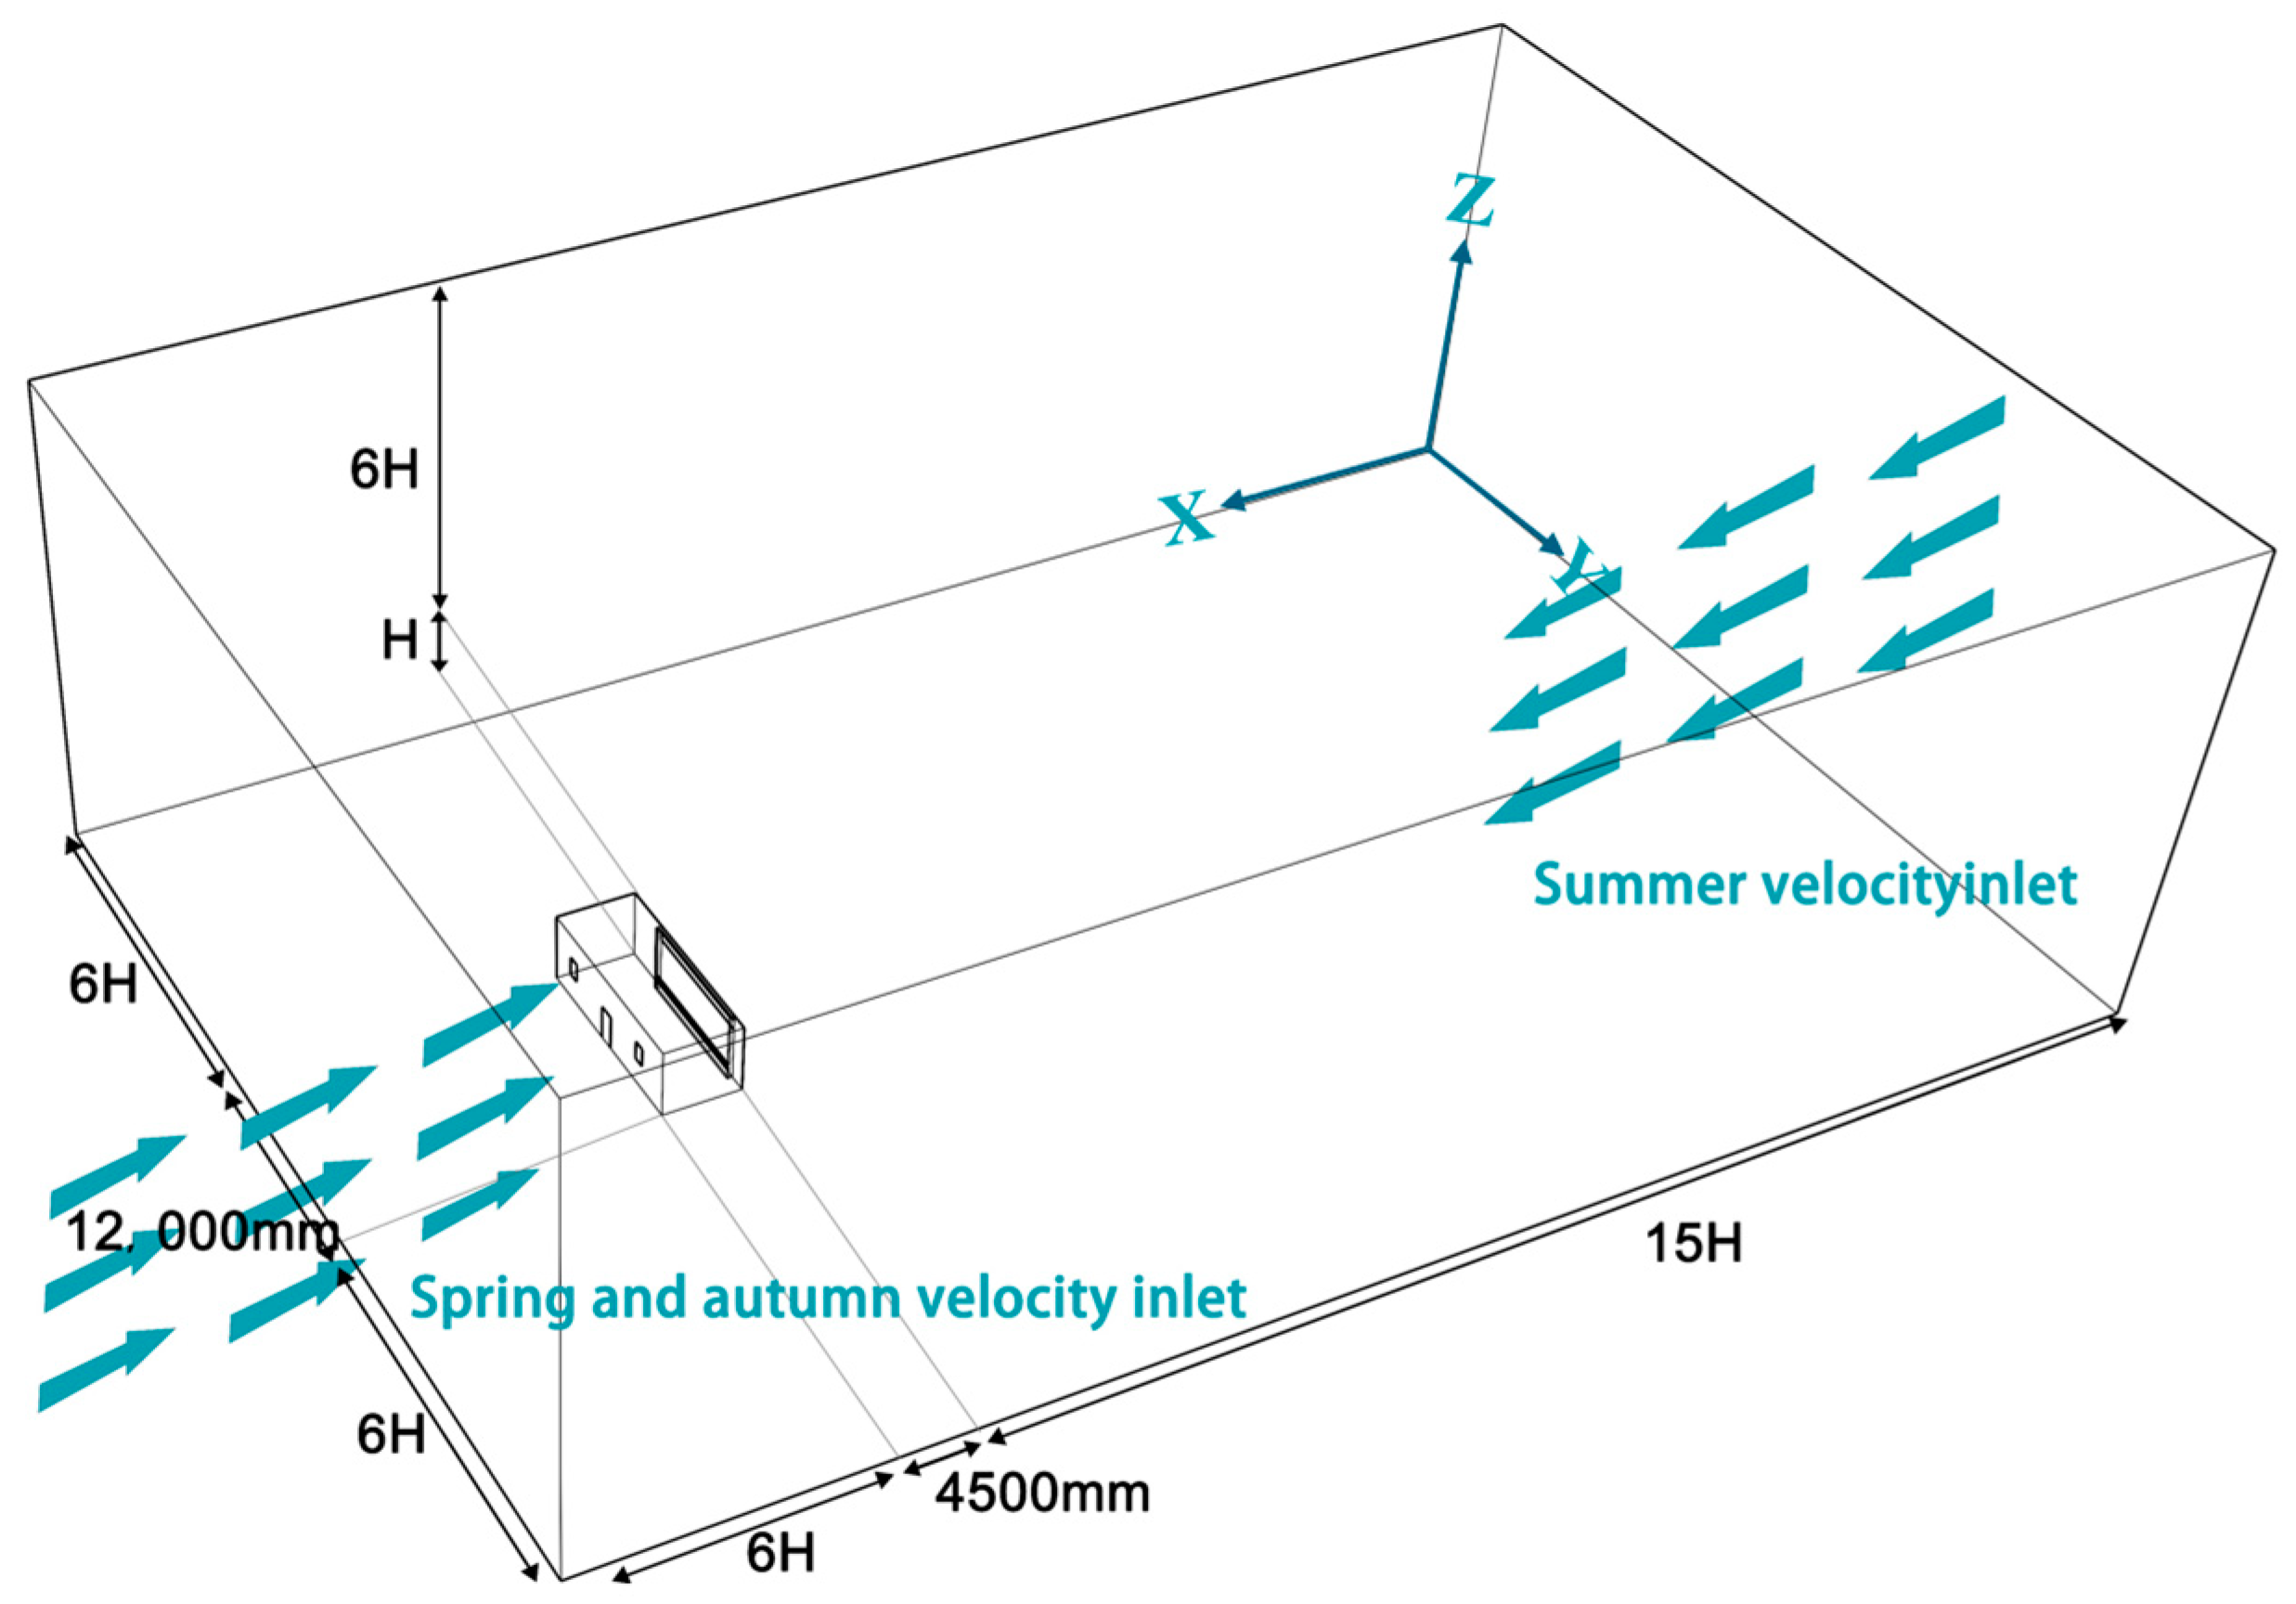
In this work, the performance of Trombe wall-driven indoor ventilation was simulated using the CFD software ANSYS FLUENT 2021 R1. This paper applied the pre- and postprocessing of its software ANSYSICIC 2021 R1 to establish the physical model of the Trombe wall building and mesh delineation. The dimensions of the Trombe wall and the building are based on actual architectural measurements, with the wall having a thickness of 0.08 m, a length of 6 m, and a total width of 0.58 m. The heights and lengths of the upper (or lower) exhaust ports are 1.1 m and 3.8 m, respectively. The overall dimensions of the building are 12 m in length, 4.5 m in width, and 4 m in height. The detailed structural parameters of the Trombe wall are illustrated in Figure 5.
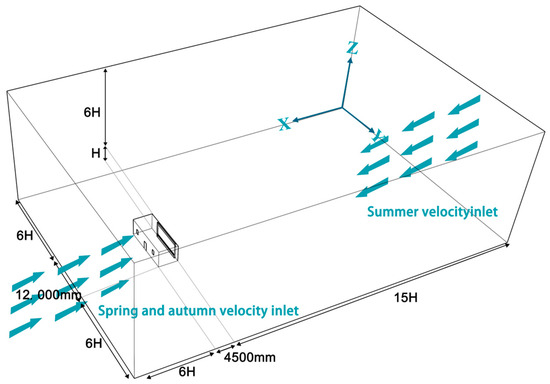
Figure 5.
Fluent software computational domain demonstration.
The computational domain size in this study is defined by the model height H. Following the “Chinese Standard for the Calculation of Green Performance of Civil Buildings” [26] and the experimental approaches proposed by Franke et al. (2007) [27] and Tominaga et al. (2008) [28], a combined indoor–outdoor simulation method is employed. As shown in Figure 6, the vertical height from the top of the subject building to the upper boundary of the computational domain is 6H. The distance from the outer edge of the building to the horizontal boundary of the computational domain is also 6H. The blockage rate of the computational cross-section perpendicular to the main flow direction is 2.97%. The horizontal distance from the inflow and outflow boundary to the outer edge of the building is 6H and 15H, respectively.
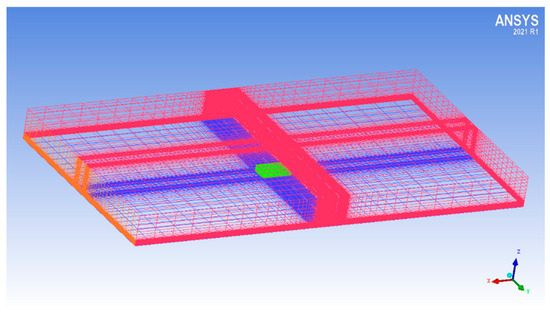
Figure 6.
Distribution of mesh.
2.5. Numerical Simulation Meshing
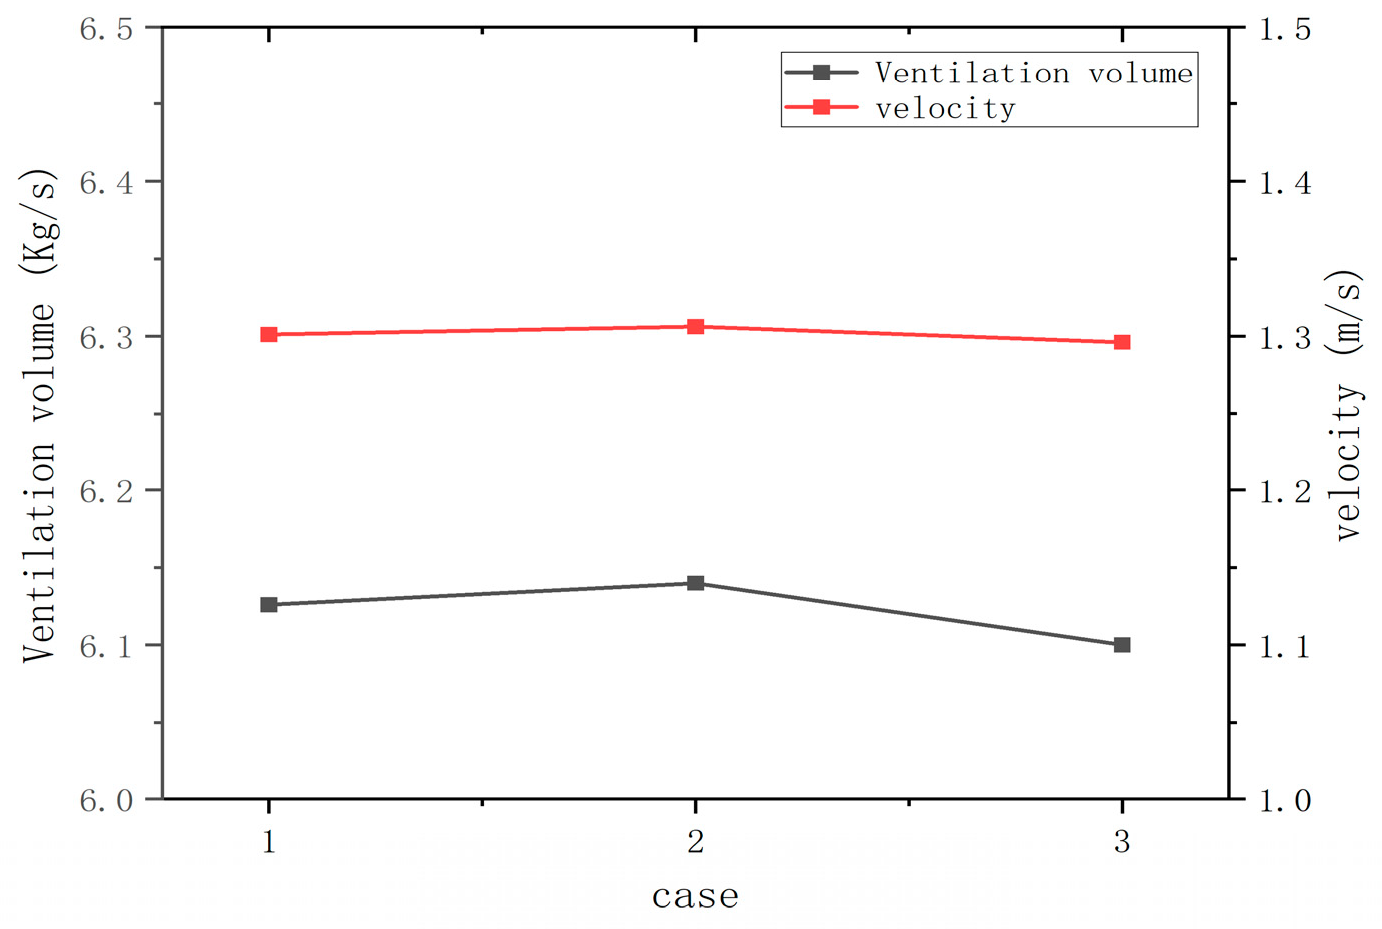
To achieve a higher grid quality, this model utilizes structured grids. The grid model of the integrated Trombe wall (ITW), generated using ANSYS-ICEM 2021R1 software, is illustrated in Figure 6. The smallest internal angle of the grid lies within the range of 85.5–90°, and the grid quality exceeds 0.95, indicating a high-quality grid model for the Trombe wall building. At the same time, we validated the sensitivity of the grid, as shown in Figure 7 and Figure 8, selecting ventilation volume and wind speed as validation indicators. Three types of grids with grid densities of 38,610, 146,857, and 233,772 were selected for comparison. It can be seen that as the number of grids increases, the results tend to converge, and the curve becomes flat. After calculation, the error of grid c is within 10%. Therefore, using grid c for calculation can achieve reliable calculation accuracy. Finally, the mathematical model of the Trombe wall building is established and solved using ANSYS-FLUENT software.
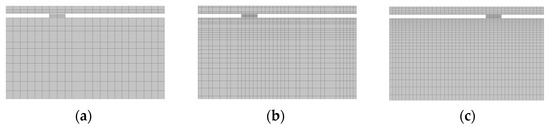
Figure 7.
Perspective view of grids for grid sensitivity analysis: (a) coarse grid A with 38,610 cells; (b) middle grid B with 146,857 cells; (c) fine grid C with 233,772 cells.
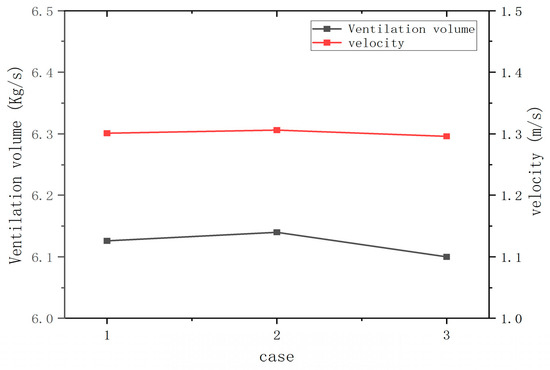
Figure 8.
Grid sensitivity validation.
In the numerical simulations of this study, the inlet type is defined as a velocity inlet, utilizing actual meteorological data from Wenzhou for the year under consideration. The average wind speeds from March to November, as shown in Table 2, are employed as the basis for the velocity inlet in the simulations for each month.
Table 2.
Average air velocity.
Additionally, to ensure the precision of the simulation, the grid is refined in specific areas, such as the internal airflow field of the model and the region within the 1H range outside the model, to enhance grid density.
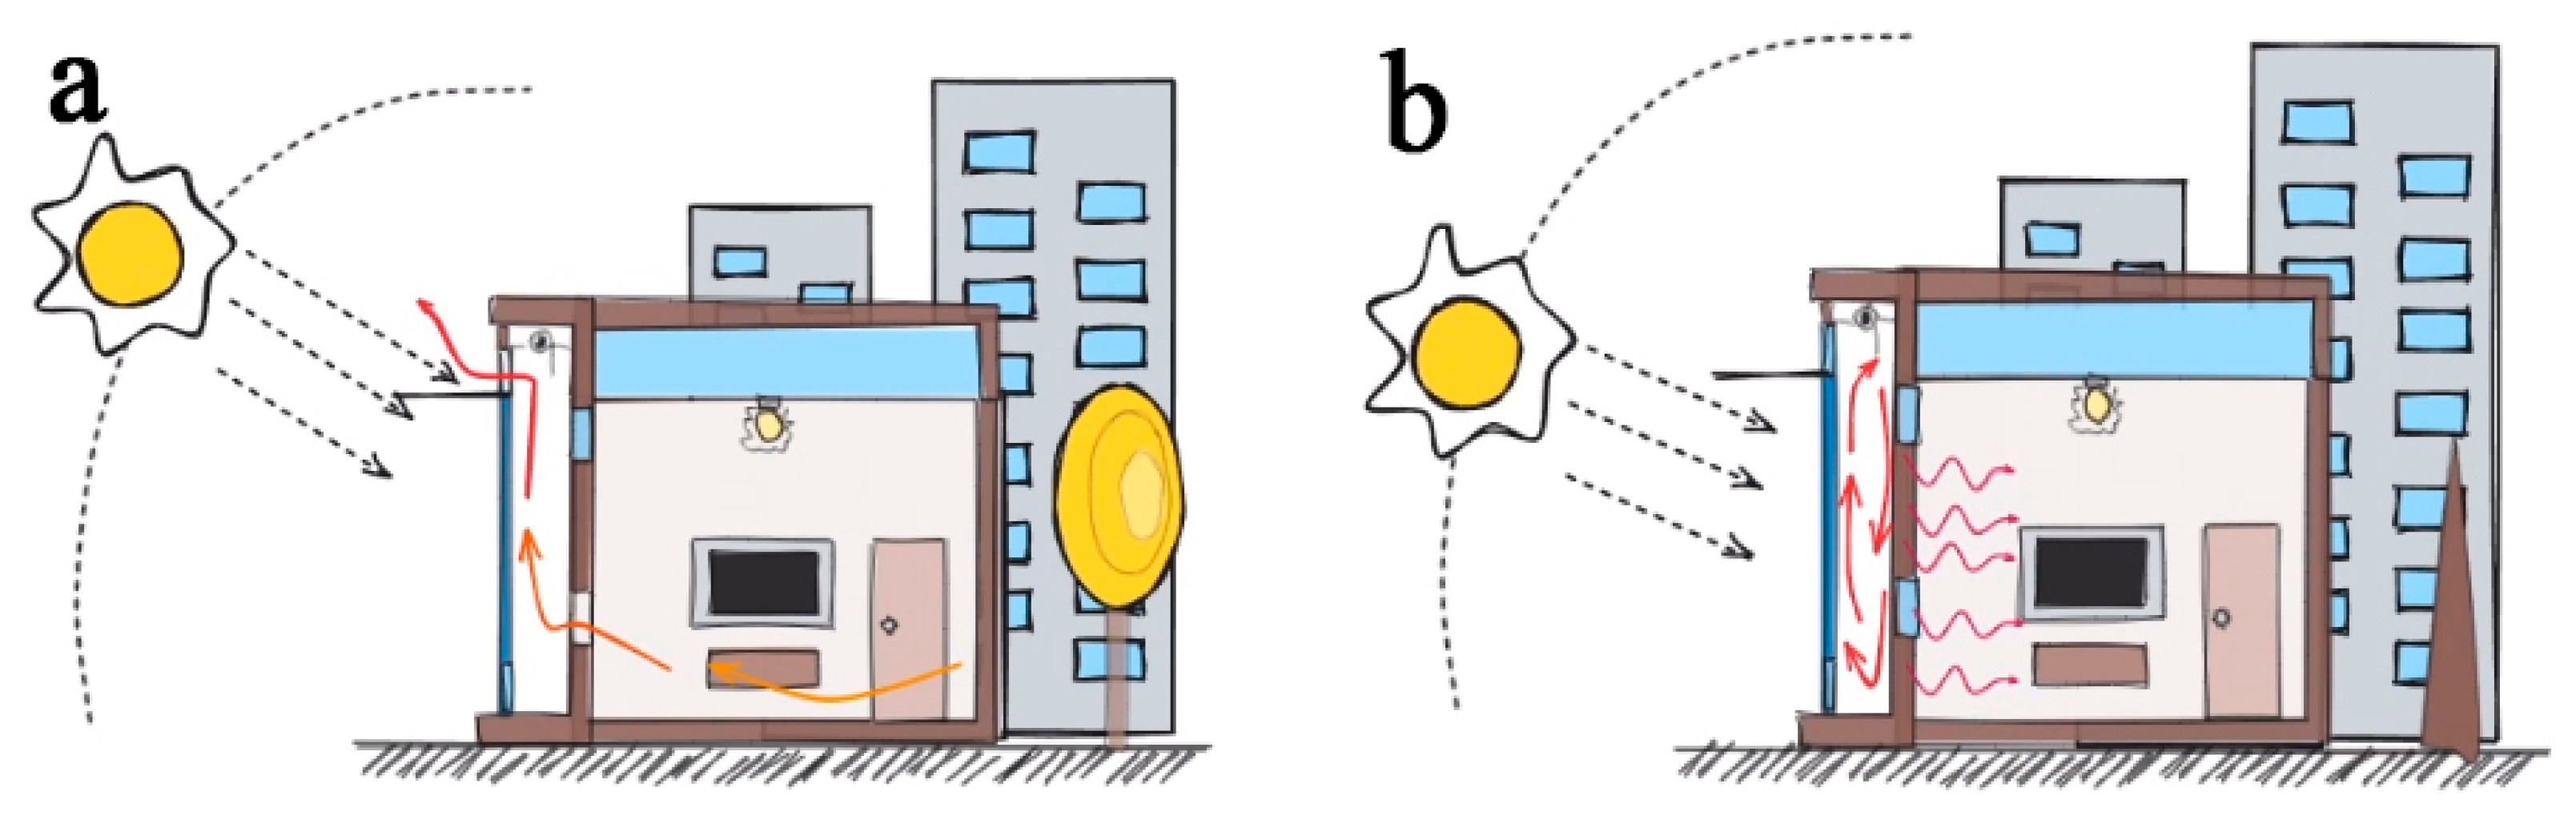
The ventilation methods of the Trombe wall system across different seasons are depicted in Figure 9. In spring, summer, and autumn, the system facilitates circulation with the external environment [29], while in winter, it primarily focuses on internal air circulation for insulation and heating [30]. Therefore, winter is not considered in the analysis on the seasonal ventilation of Trombe walls in this article.
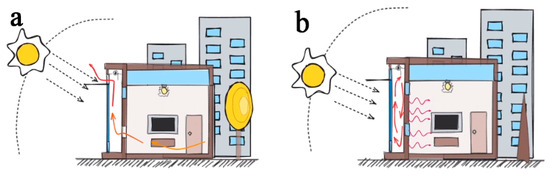
Figure 9.
(a) Summer mode with cross ventilation; (b) winter mode with air thermocirculation.
2.6. Boundary Condition Settings for Numerical Simulation
In order to make the simulation results as close as possible to the actual situation, local climatic conditions were used as the environmental conditions in this study. The wind speed for each month was obtained based on the actual average wind speed value for that month. Solar radiation was calculated using the DO discrete model with the actual local latitude and longitude to ensure the accuracy of the radiation value. After the experimental measurements in the Wenzhou area, it could be found that in the ventilation mode, the wind direction in spring and fall was mainly north wind, accounting for 70%. The windows and doors on the north side of the entrance were kept open, and the air vent at the bottom of the Trombe wall was open. Hence, the entrance wind conditions in spring and fall were set to the north side. In summer, the wind direction was dominated by the south wind, the north window and door were closed, and the vents at the bottom of the Trombe wall were opened to generate air circulation. The whole system was in steady-state condition [31], and the airflow was turbulent. Air is an incompressible fluid and satisfies the Boussinesq assumption. There was no air infiltration with heat flow density. The front side of the Trombe wall was a heat collecting wall with heat storage and a density of 1440. The transmittance of the glass was 0.95. The convective heat transfer coefficient of the wall surface of the Trombe wall was 8 w/m2k. The material properties do not change with temperature. A reference house without assembled Trombe walls was also set up for comparison with it, and the conditions for this condition were the same except for the absence of Trombe walls, and the measurement positions and horizontal distances were kept constant.
3. Experimental Measurement
3.1. Measuring Point Layout
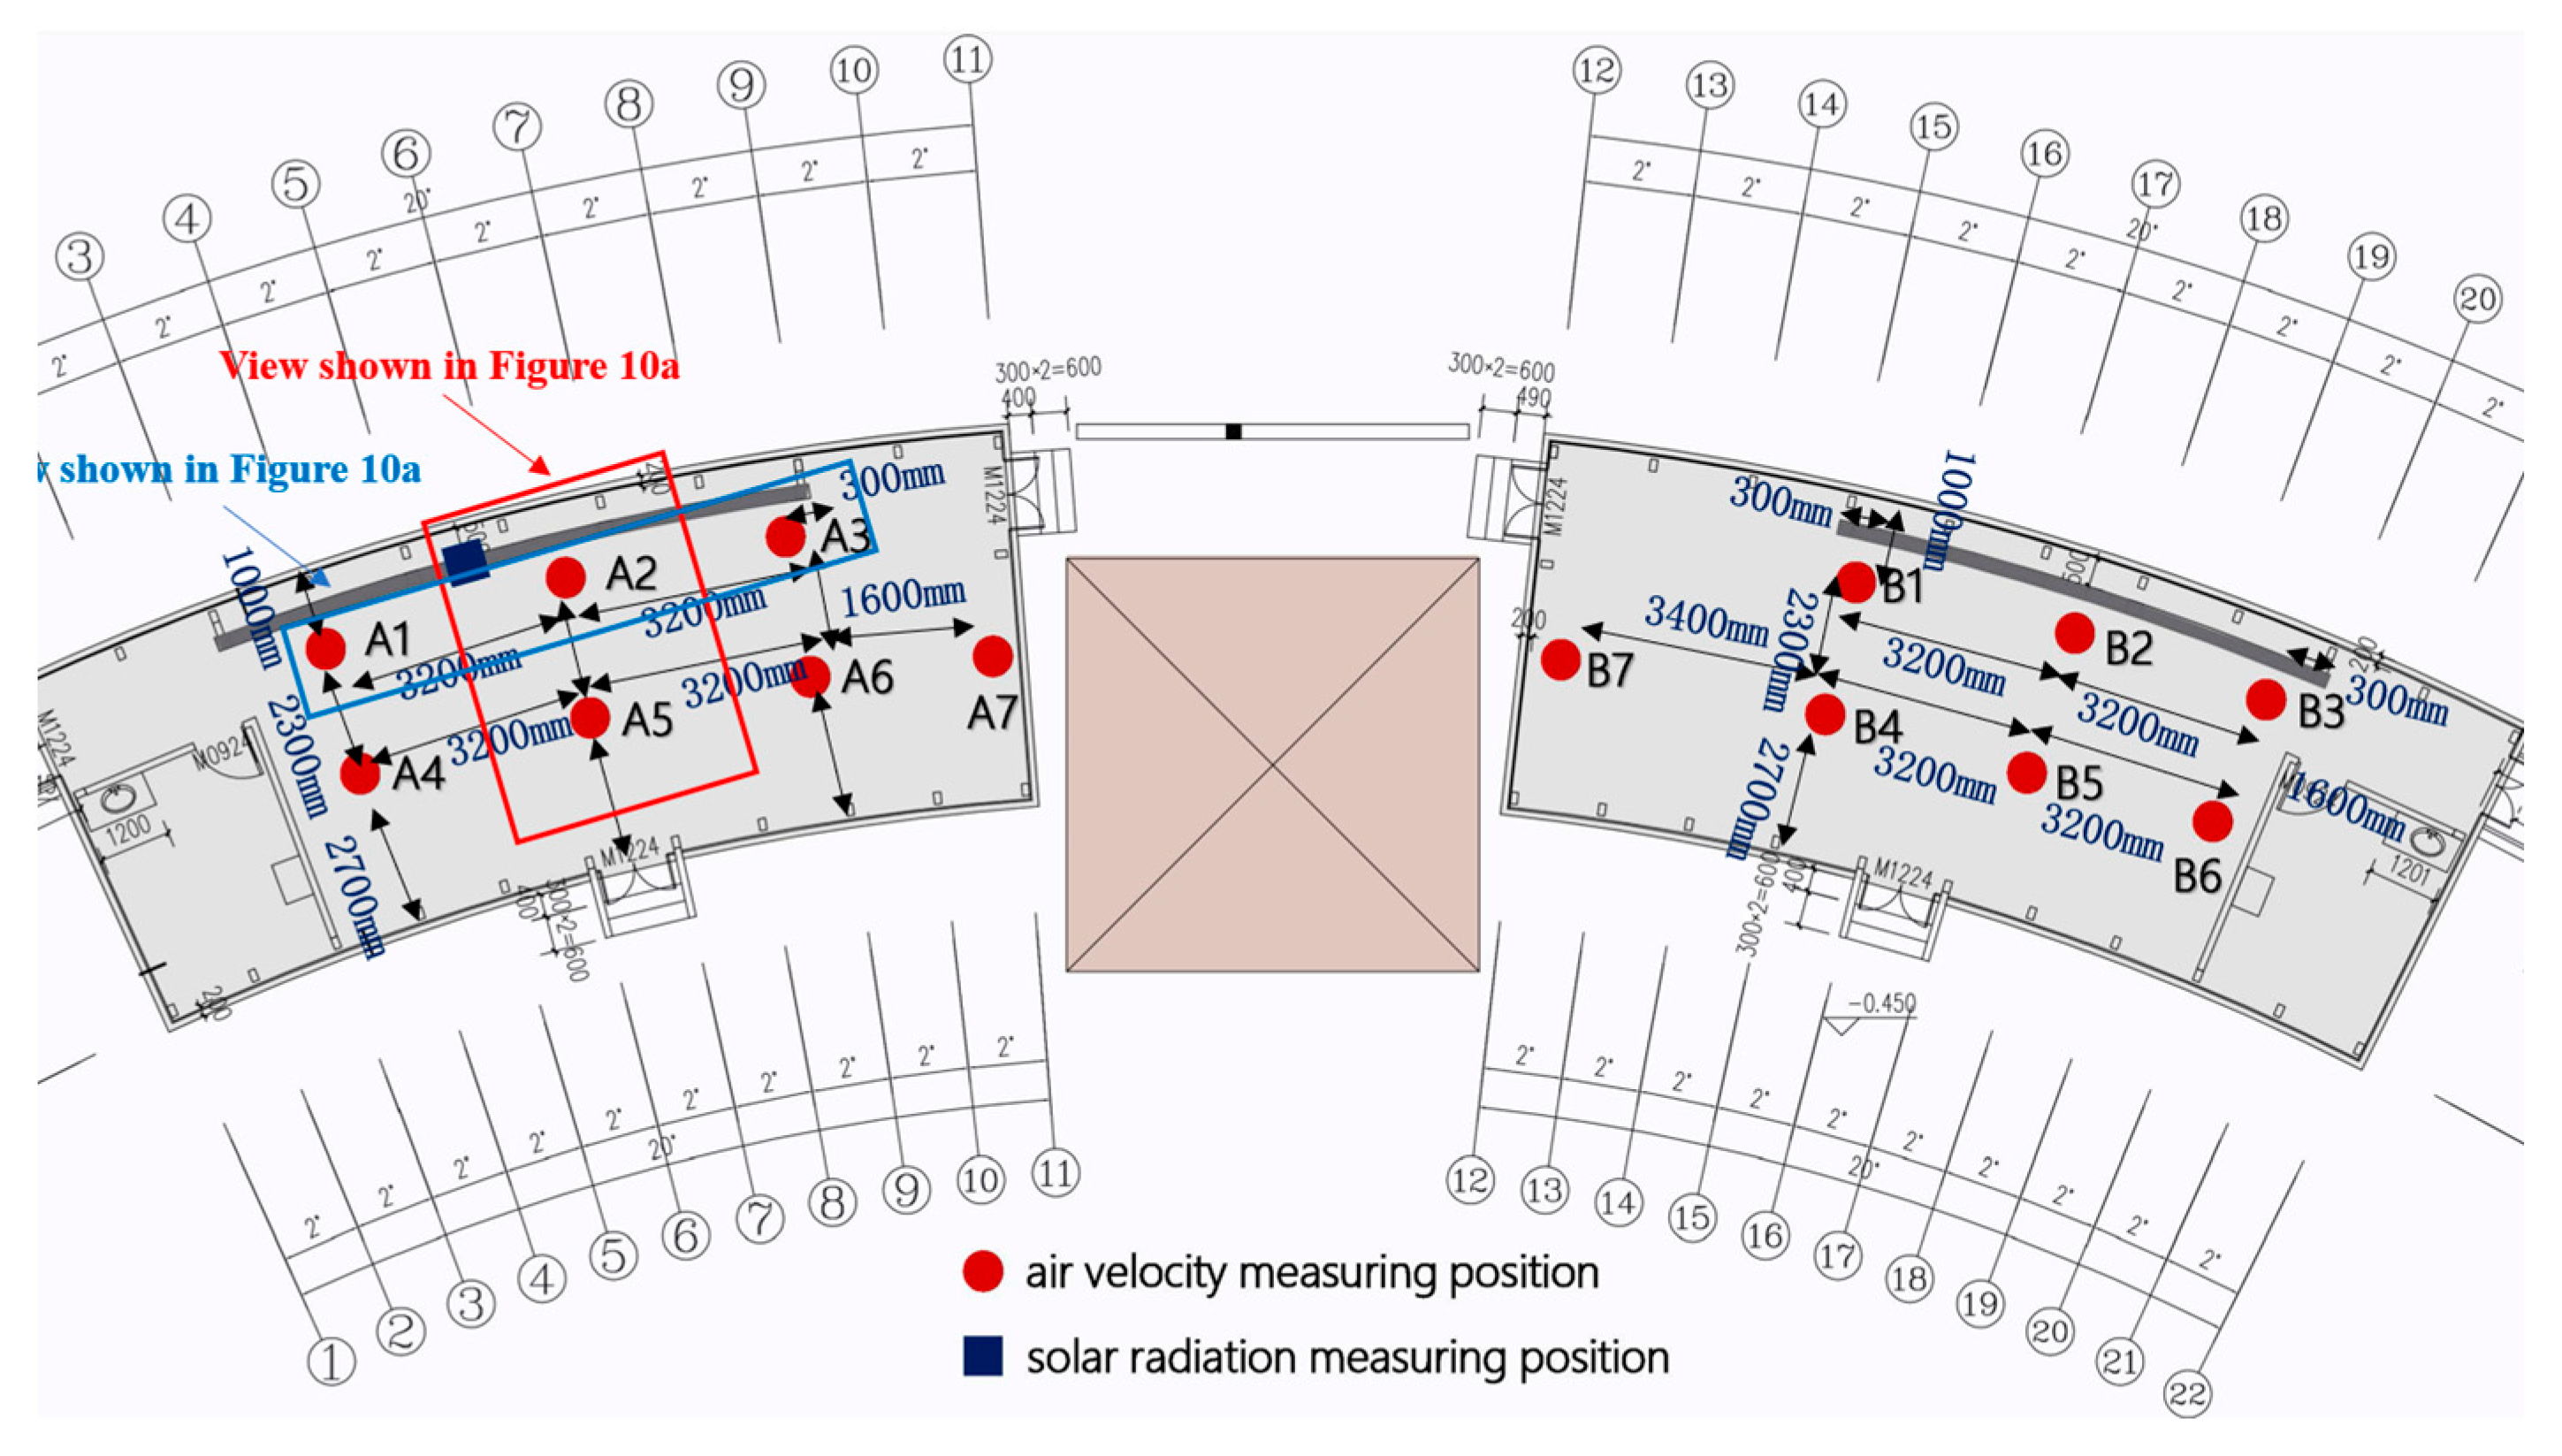
As shown in Figure 10, measurement points in this study are selected based on a vertical height of 1.5 m, approximating the respiratory level of humans. The horizontal measurement points are categorized as follows: near the chimney mouth—A1, A2, A3, B1, B2, and B3; at the central part of the building interior—A4, A5, A6, B4, B5, and B6; and in the still air zone inside the building—A7 and B7. The other numbers in the figure are dimension annotations for building details.
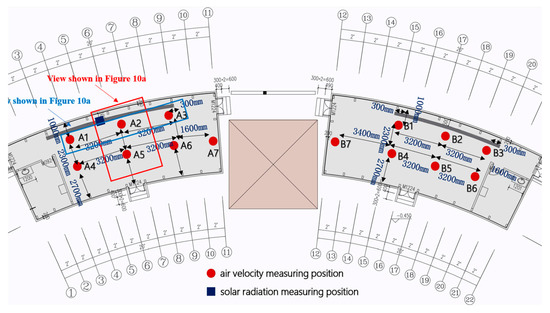
Figure 10.
Layout of indoor measuring points.
This comprehensive measurement approach evaluates the ventilation effect inside the building after the installation of the Trombe wall. Additionally, solar radiation and temperature–humidity monitoring points are placed on the exterior surface of the wall to monitor solar radiation and temperature–humidity levels in real time. The placement of these points is illustrated in Figure 11.
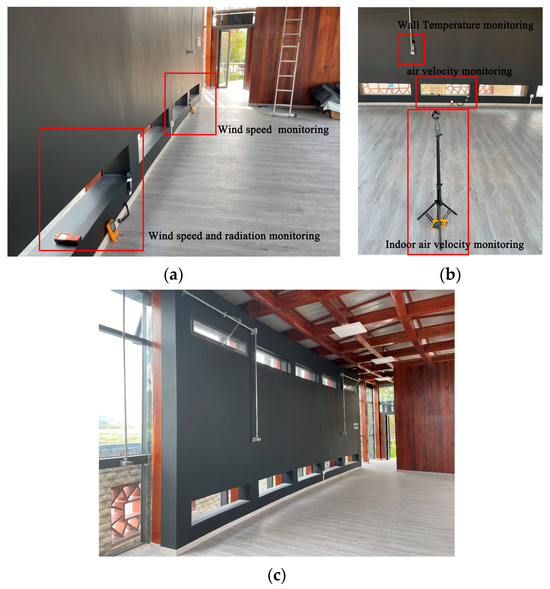
Figure 11.
Indoor layout plan. (a) Near-mouth experimental measurement points. (b) Overview of the experimental measurement point layout. (c) Interior perspective view.
3.2. Experimental Setup
The instrumentation employed in this field measurement encompasses various aspects, ensuring comprehensive monitoring of wind environments and meteorological parameters. The specific parameters of the used instruments are outlined in Table 3. Home-made anemometer stand: This device was used to support and position other instruments to ensure that they can accurately measure wind speed and direction. The exact design and parameters may differ depending on the specific requirements of the experiment. Anemometer: Used to measure the speed of airflow. Anemometers could be employed to obtain information about the strength of the wind in the experimental environment. This is essential for understanding the effectiveness of ventilation. Anemometer: Used to measure the direction of the wind. The data from the anemometer helps to determine the path of the airflow and provides critical information for analyzing the propagation and distribution of wind in the room. Hensin Black Bulb Thermometer AZ8778, The equipment is manufactured by Hengxin manufacturer in Taiwan, China.: This thermometer can be adopted to measure the black bulb temperature (an indicator of radiant heat). Monitoring the black-bulb temperature allowed us to obtain a more complete picture of the heat distribution in the environment. Tamas UV Intensity Tester TM-213, The equipment is manufactured by Tamas manufacturer in Taiwan, China.: This thermometer was utilized to measure the intensity of UV radiation. UV intensity is another important factor affecting the indoor environment, especially when considering human comfort and indoor lighting. These instruments have a high degree of recording stability, and real-time remote monitoring can be achieved by connecting them to a computer. This helps to instantly intervene and adjust the experimental conditions. Real-time computerized monitoring reduces the likelihood of human error in the recording of wind speed by automating the collection of experimental data on wind speeds and ensures that the process of collecting wind speeds will exclude data from some of the extreme convective weather conditions, thereby realizing the accuracy and consistency of the data. This is especially essential for experiments that require high-precision data. Overall, the implementation of these instruments in the measurement plan enables thorough monitoring of wind environments and meteorological parameters, enhancing the operability and precision of the experiment.
Table 3.
Introduction to testing instruments and measurement parameters.
3.3. Experimental Details
The experiment was conducted from 21 April to 10 October 2023. In order to account for the thermal storage capability of the Trombe wall, measurements were taken on the 21st day of each month at three different times: 9:00 a.m., 12:00 p.m., and 3:00 p.m. The chosen time slots corresponded to periods when the prevailing wind direction was predominantly northerly in April, May, and September and southerly in June, July, and August. Each month exhibited varying average wind speeds. The measurement duration at each individual point was 3–5 min. The speeds at all monitoring points were collected synchronously and in real time. Data were recorded continuously at 5 s intervals within each minute to obtain the average wind speed for that minute. This process was repeated three times for a one-minute average wind speed test, with a three-minute interval between each repetition. The wind speed for each monitoring point was calculated as the average of these three sets of wind speed data. All recorded data are provided in Table 4.
Table 4.
Average wind speed at each measuring point.
3.4. Verification Results
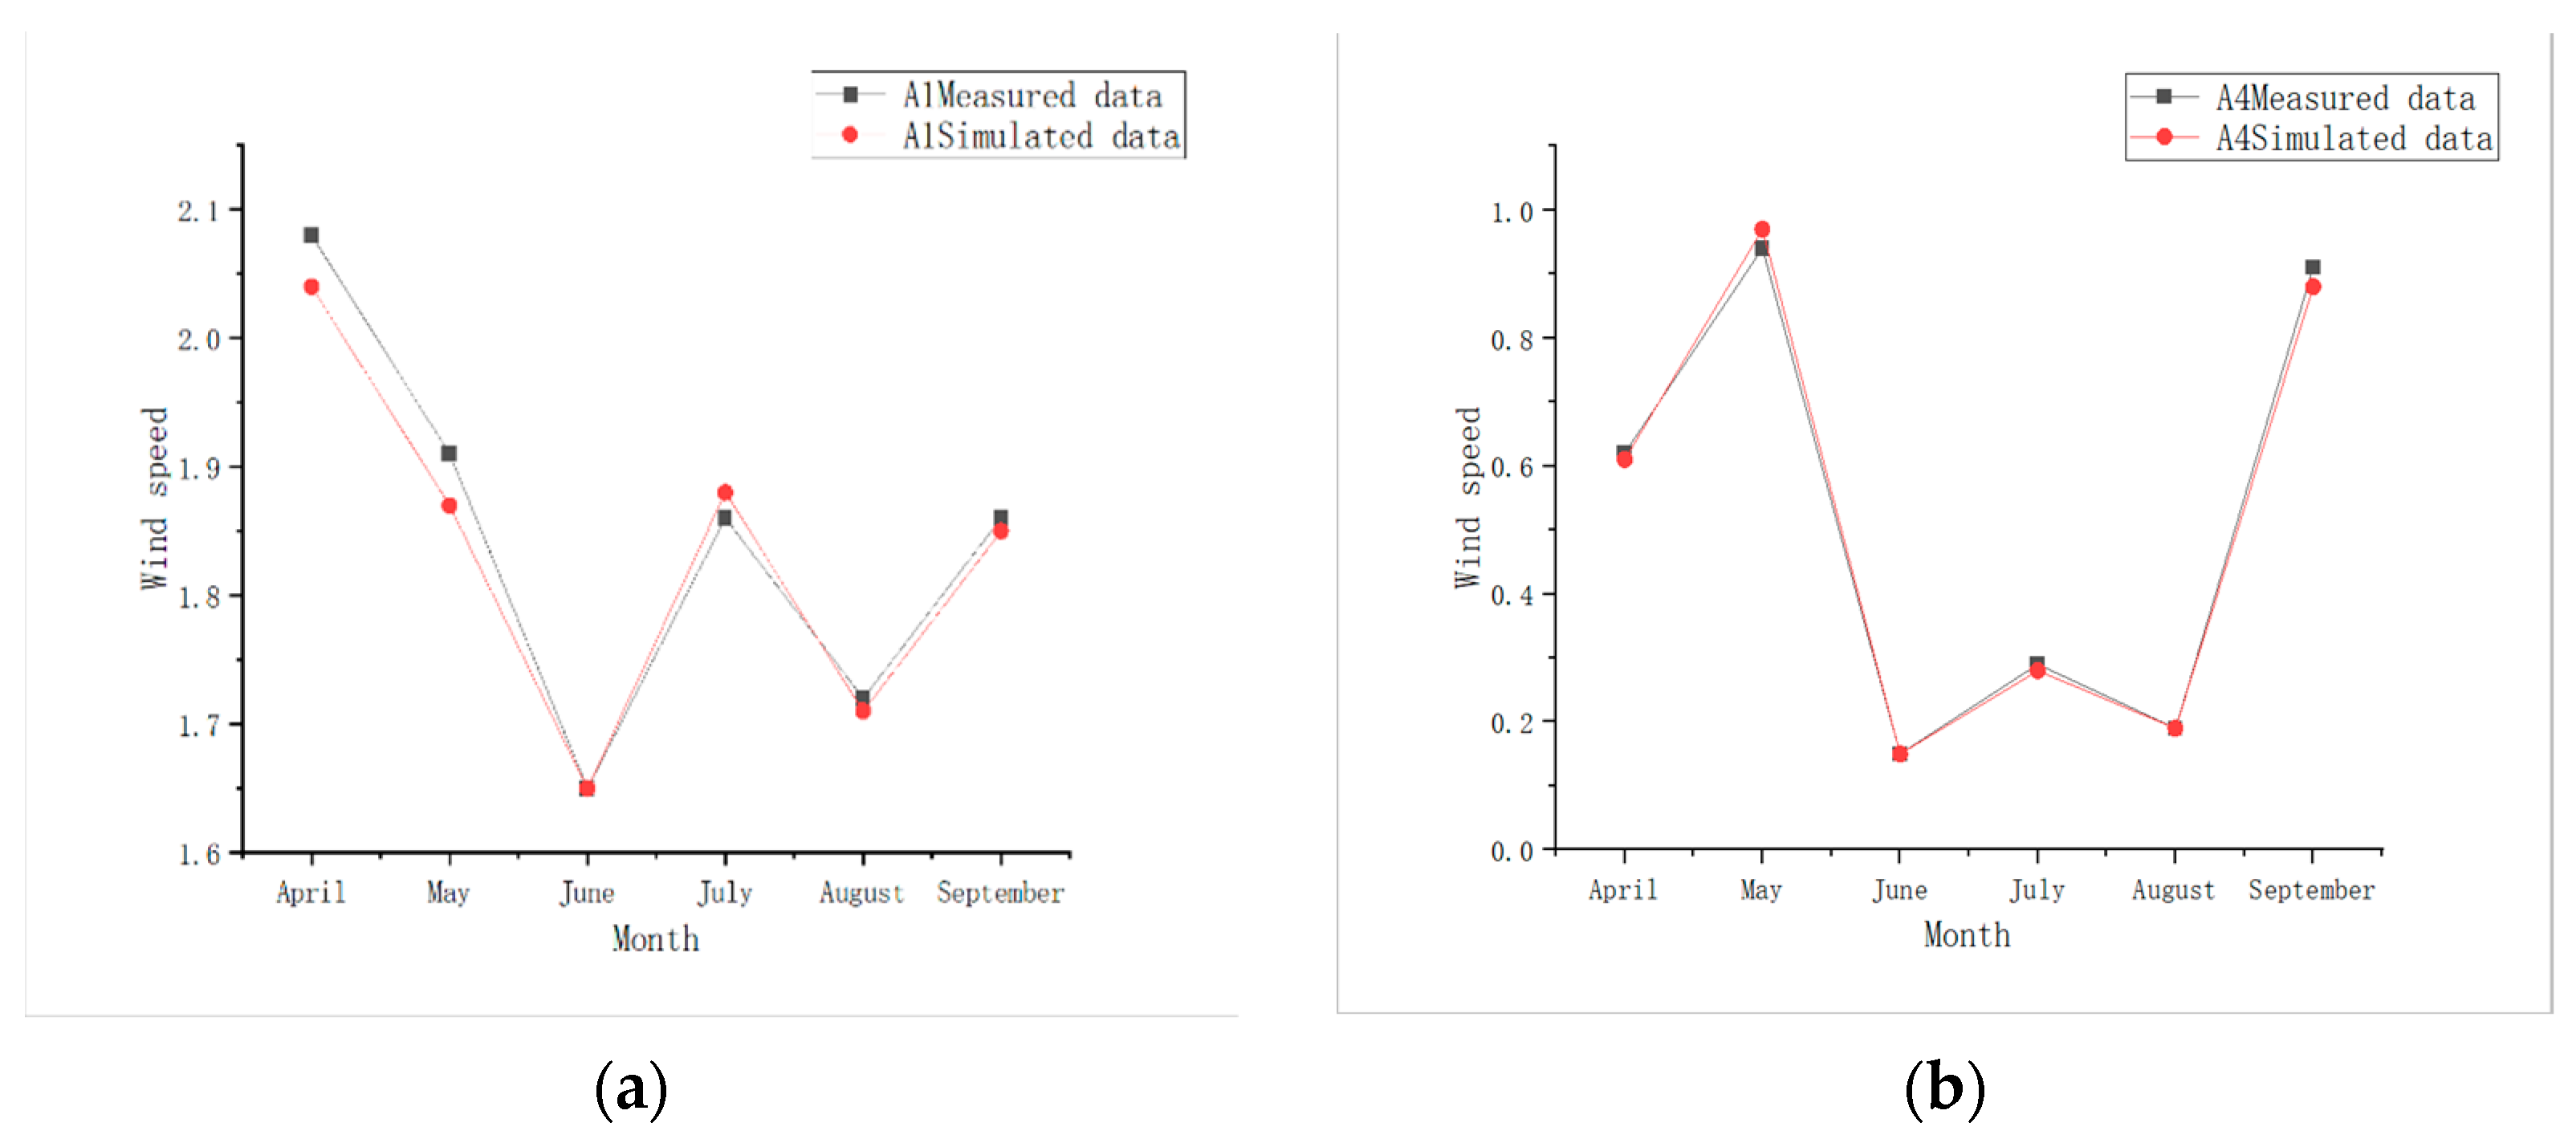
As shown in Figure 12, the overall trend of the curve is not overly biased. It is easy to notice that the calculation has a high accuracy. To further prove this data, the wind speed and temperature simulation results in this paper are compared with the data in the paper of Ahmed Abdeen [32]. Experimental and numerical simulations were performed to test the changes in the indoor environment of a building with Trombe walls applied in a specific climate zone.
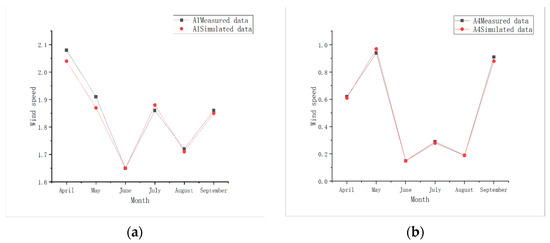
Figure 12.
Comparison between simulation and actual measurement. (a) Comparison between simulated and actual measurements at Point A1. (b) Comparison between simulated and actual measurements at Point A4.
3.5. Analysis of Calculation Errors
It could be seen that the results match better in spring and fall, but the error was large in summer. This can be attributed to measurement errors caused by strong convective weather during the summer months in hot-summer and cold-winter regions, as well as the lack of stability of the airflow inside the chimney due to localized heating of the Trombe wall. These further affected the indoor wind environment. In order to improve the accuracy of the data during the summer months, extreme wind speed values were filtered out and removed using a computer. On the other hand, measurements were avoided as much as possible during strong convective weather. In order to prevent errors caused by overheating of the chimney, several measurements were taken during midday and late afternoon. The average of these measurements was recorded, and the data were analyzed by computer to remove the unreasonable data values caused by overheating. The real-world environment has a number of uncontrollable factors that can interfere with the forward wind speed, including obstructions, monsoons, and extreme weather conditions. However, the simulated wind speed was the steady input wind speed inside the inlet. Although the outdoor environment was set to be restored in the outflow field, there was some error in the simulation results with the measured values. However, the overall trend remained consistent, and the error rate was controlled within 5%. Therefore, the experimental and simulation parameters could respond to the ventilation effect of the Trombe wall after it was applied to the building.
4. Analysis of Experimental and Simulated Results
In this section, we present the findings derived from both the simulation and experimental work. Initially, a comprehensive analysis is conducted to examine the simulated wind environment results for each season in detail. By meticulously scrutinizing the simulation data, we are able to discern the variations in wind speed across different seasons, thus establishing a solid foundation for further investigations. Subsequently, we shift our focus to the real-world implications of these simulated results on indoor wind conditions throughout different months of the year. Through a comparison between the simulated values and actual measurements, we can acquire a more comprehensive understanding of the actual fluctuations in wind speed and how they evolve within indoor settings. This comparative analysis contributes to the identification of consistencies or discrepancies between the simulation and real-world observations. Notably, the study reveals that wind speeds in various indoor areas are significantly influenced by the Trombe wall’s guiding system. This section explores the effects of this system across different seasons and, by contrasting with scenarios in the absence of a Trombe wall, reveals its dynamic performance amidst seasonal changes. Inputting optimized wind speed data into thermal comfort models yields refined psychrometric charts, providing more precise guidance for enhancing indoor comfort. Lastly, a fitting analysis of all experimental data is conducted to identify the months with the most pronounced ventilation effects in hot-summer and cold-winter climates, which is instrumental in determining the optimal timing for implementing optimization measures in specific seasons and offers targeted suggestions for architectural and environmental design.
4.1. Trends in Solar Radiation Variability
The airflow dynamics within a room and chimney cavity are governed by various factors, leading to fluctuations in their characteristics. The entire airflow process can be succinctly divided into two primary phases. In the first phase, the movement is predominantly driven by wind, characterized by airflow entering the room from the surrounding environment and then proceeding towards the chimney cavity. In the second phase, the movement of the airflow is influenced by a combination of wind drive, the inertia of the airflow, and thermal buoyancy. The generation of thermal buoyancy is primarily regulated by two factors, namely, the convective heat exchange between the walls and the airflow and the radiant heat absorbed by the walls.
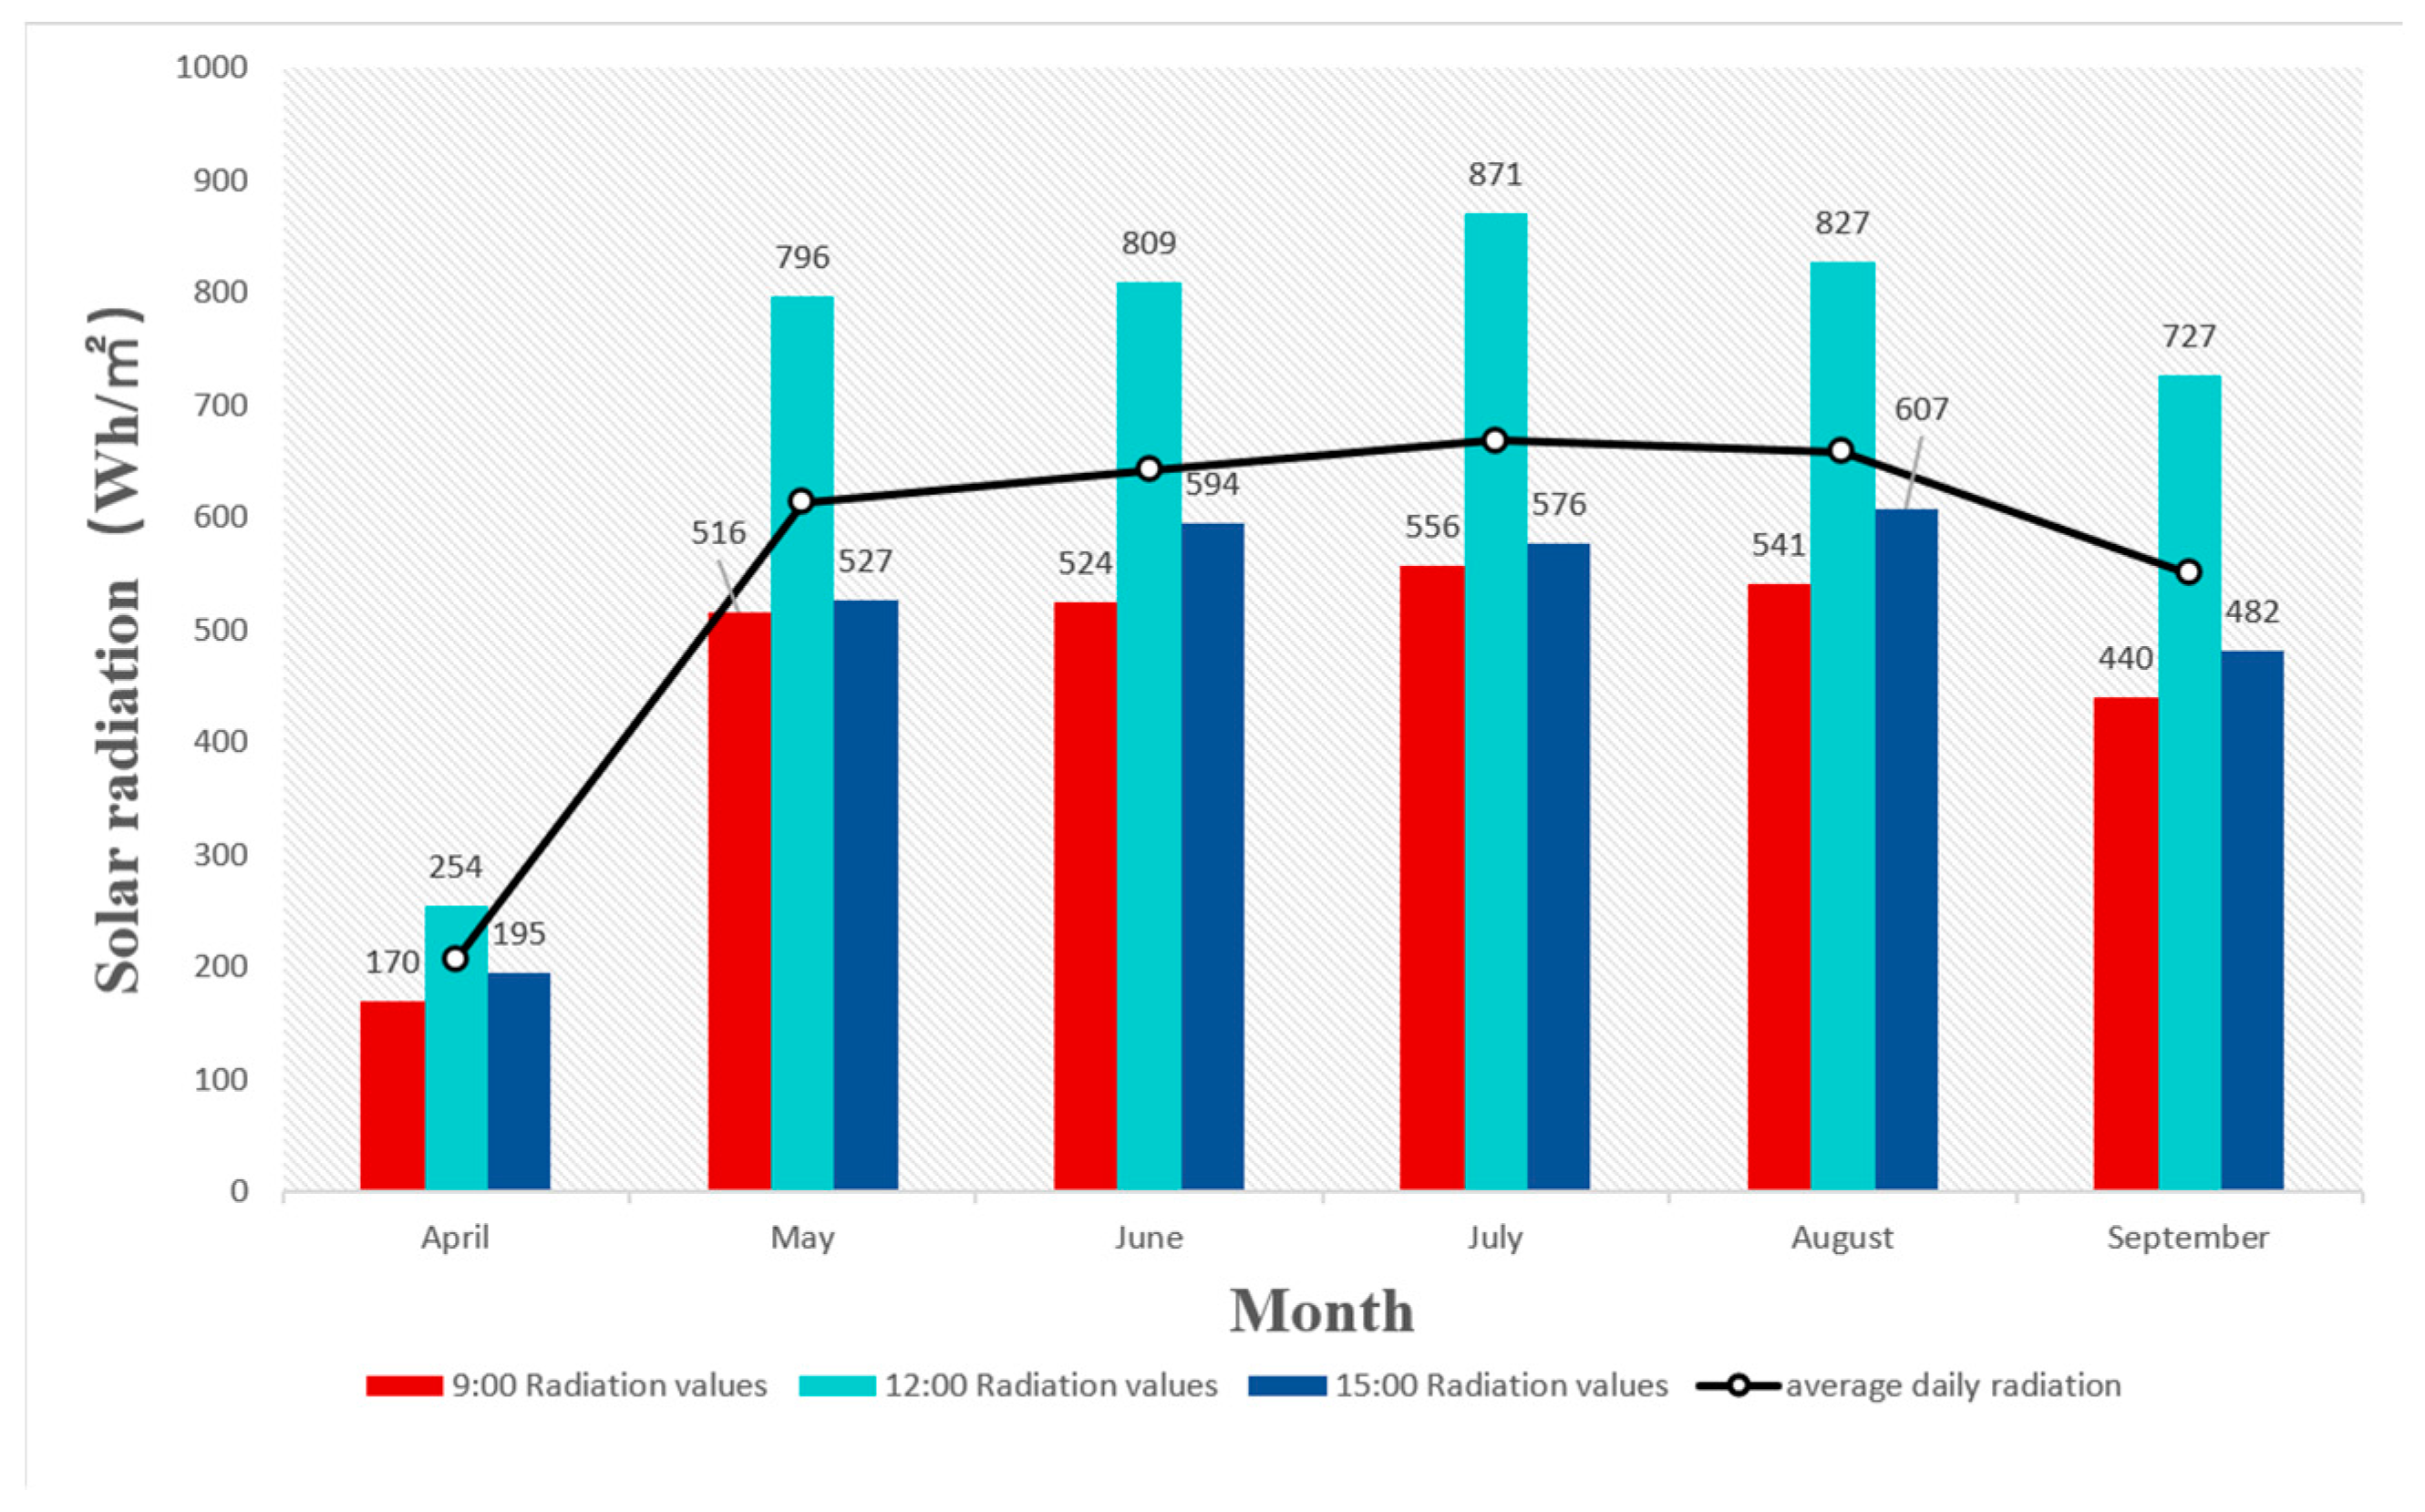
Under the influence of solar radiation, the temperature of the walls exhibits a continuous upward trend, triggering thermal convection. As illustrated in Figure 13, the solar radiation values measured each month show fluctuating variations. These values of solar radiation are derived from measurements of radiation received on the external surface of the Trombe wall. Observing the chart, it can be discerned that solar radiation peaks in July, reaching up to 871 Wh/m2 at noon, while bottoms in April at 9 a.m., registering only 170 Wh/m2. This analysis of solar radiation values provides a robust reference and basis for understanding the temperature variations in the Trombe wall and the intensity of the convective flow.
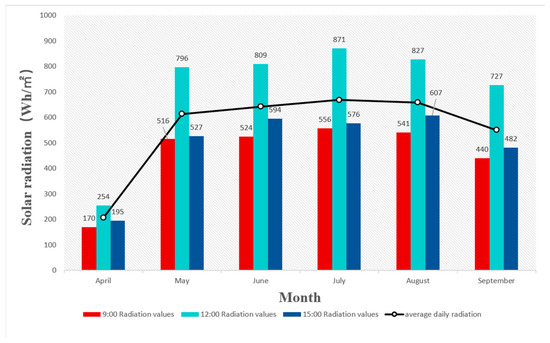
Figure 13.
Measured solar radiation.
Table 5 documents the recorded temperature variations for each month during the morning, noon, and afternoon, clearly demonstrating the overall trend of temperature fluctuations in alignment with changes in radiation. At 9 a.m., the temperature of the Trombe wall is not significantly different from the room temperature, indicating a relatively low radiation value at this time and suggesting that the wall temperature is still in the initial stage of heat collection due to its lower temperature. By 12 p.m., the wall temperature reaches its peak, coinciding with a significant increase in radiation values. This reflects the wall’s successful demonstration of its radiative capacity while fully showcasing its heat storage function. At 3 p.m., the Trombe wall, with its efficient heat storage capability, retains most of its heat despite the decrease in the radiation value compared to noon. Consequently, the wall temperature does not significantly vary from its noon level, thereby ensuring the stability of its ventilation performance.
Table 5.
Average wind speed at each measuring point.
4.2. Comparison of Wind Speed Contours for Each Month
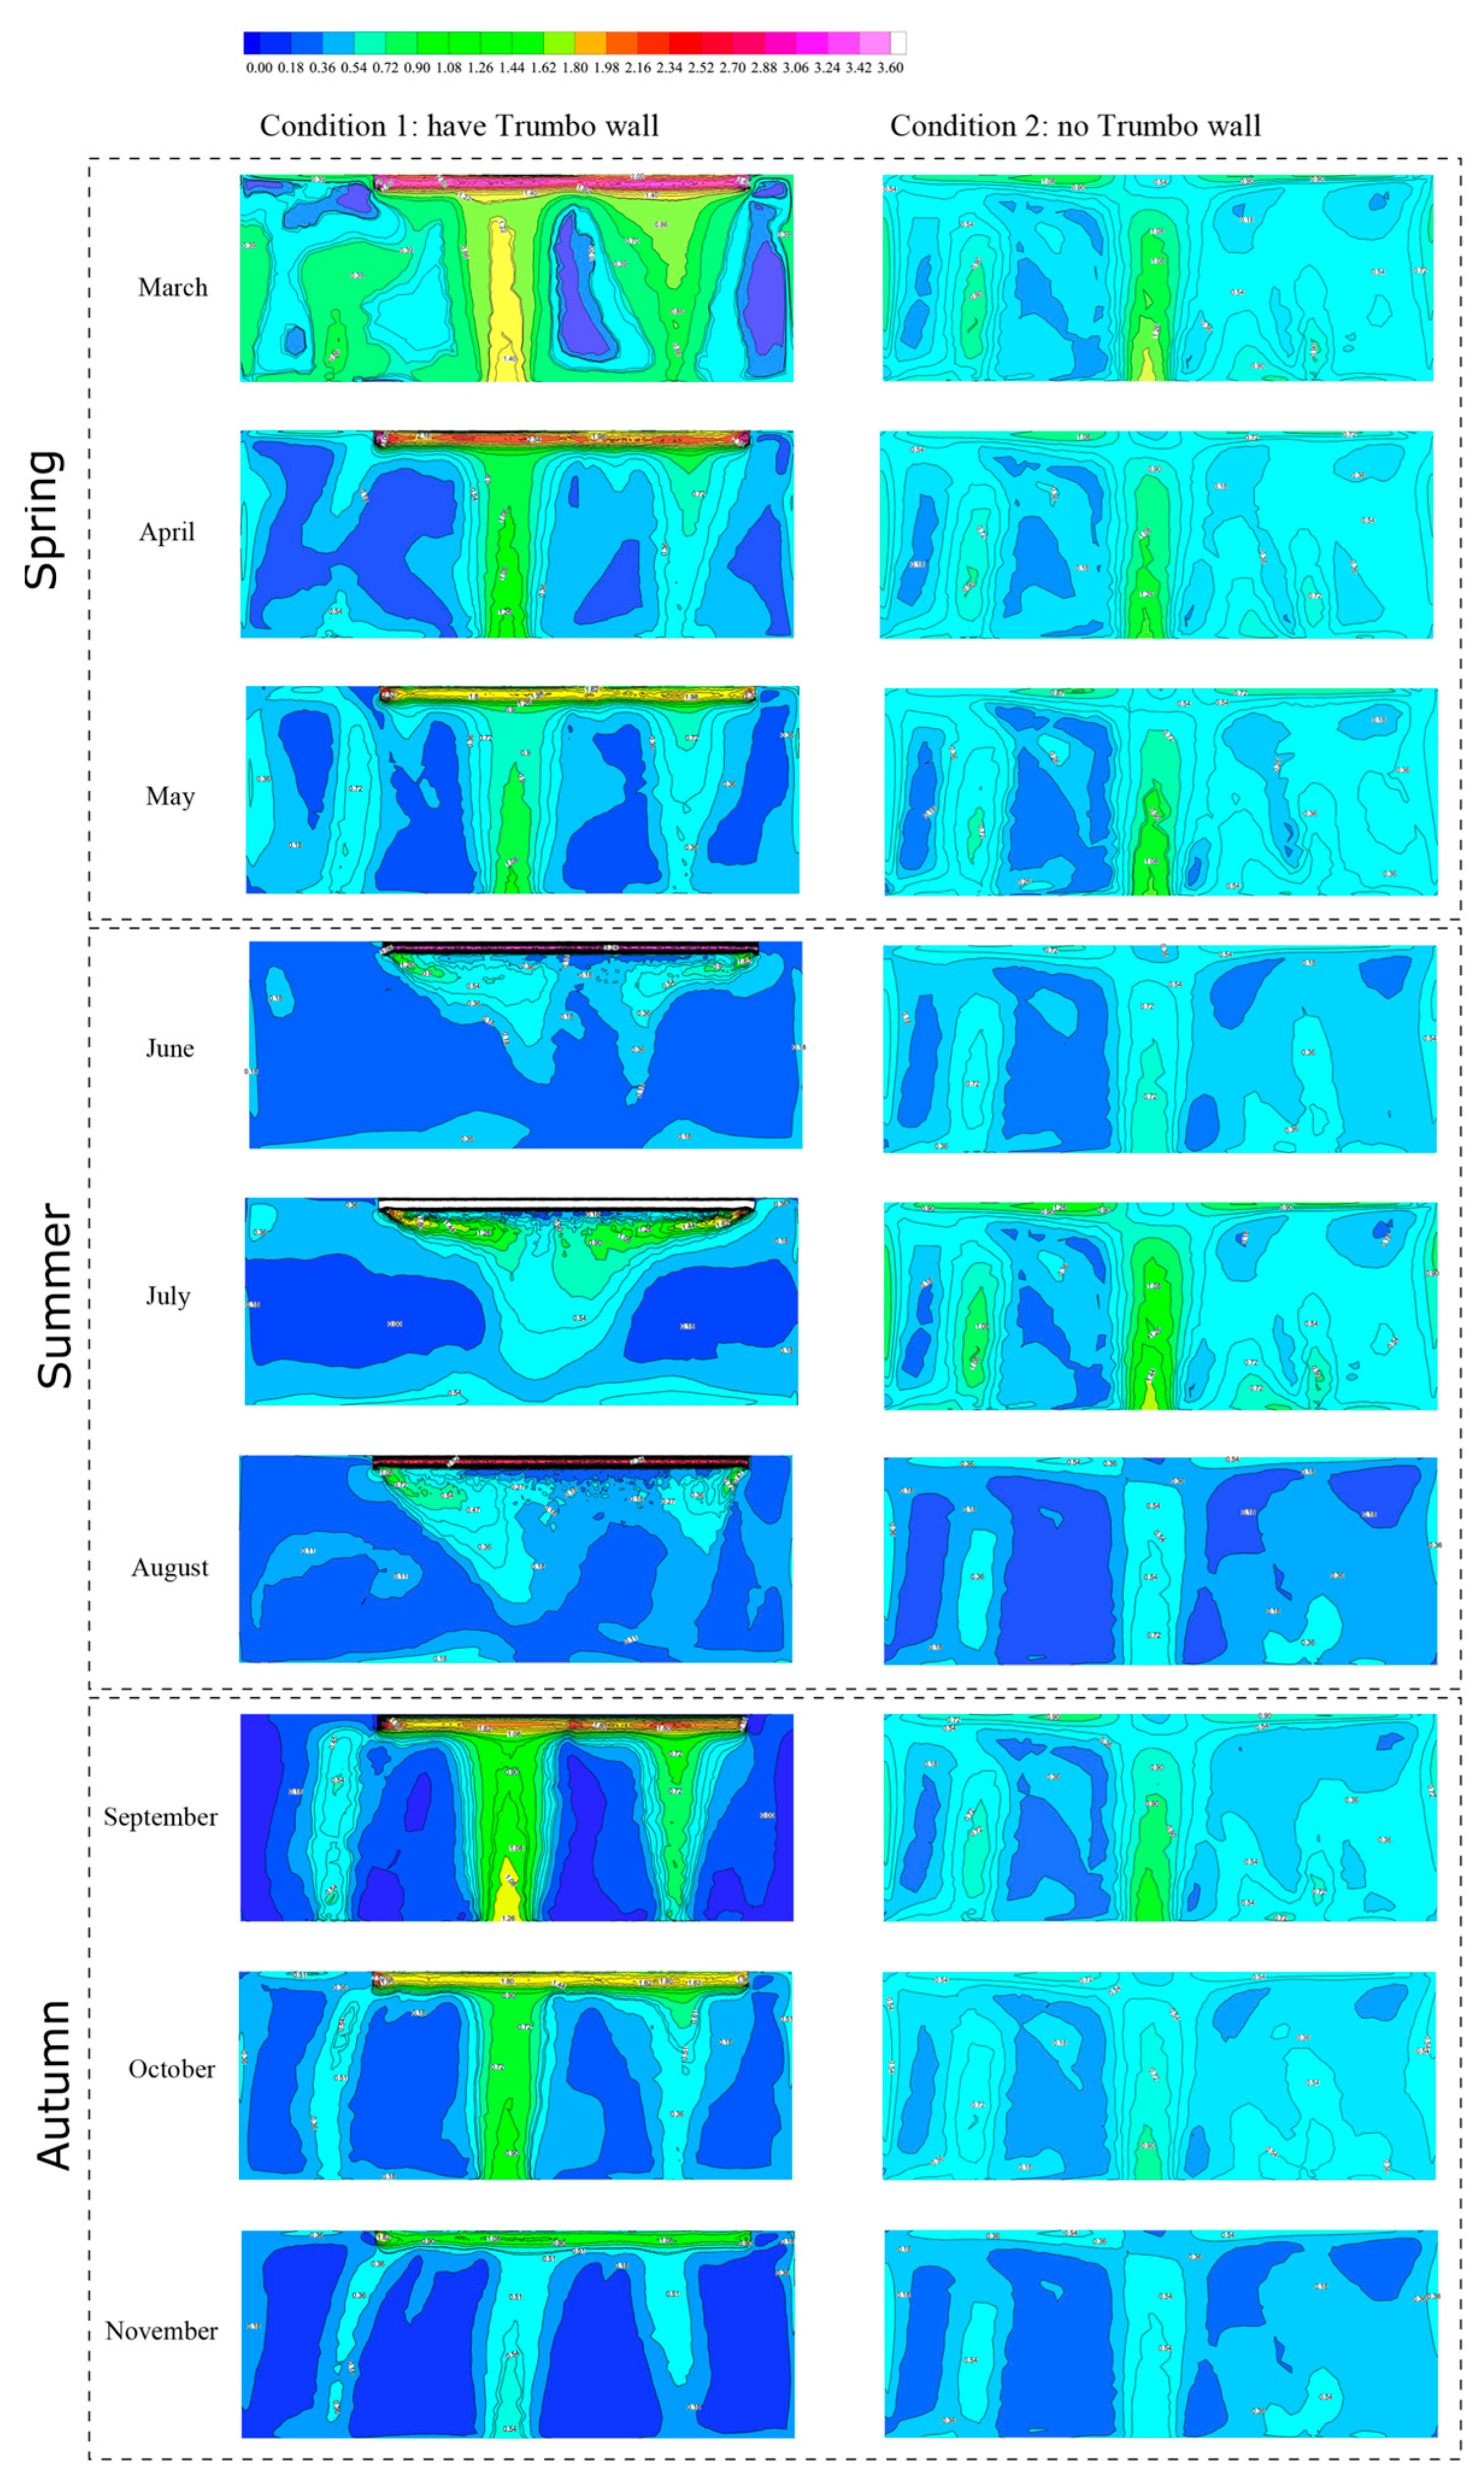
Figure 14 illustrates the wind speed contours at a height of 1.5 m inside the building. As can be clearly seen from the figure, the installation of the Trombe wall generally increases indoor wind speed, particularly where air convection around the wall is intense, significantly enhancing ventilation. Moreover, the indoor airflow exhibits a clear directional flow, with higher wind speeds in the area influenced by the Trombe wall. Notably, the wind speed changes are more pronounced within a 1.1 m distance from the ventilation port. This increase in wind speed at the wall opening is also evident in the measured data, though the effect diminishes towards the central area of the building. However, it still manages to increase wind speed by 0.2 m/s–0.8 m/s. The average indoor wind speed from March to November, respectively, increases by 0.35 m/s, 0.42 m/s, 0.68 m/s, −0.41 m/s, −0.2 m/s, −0.14 m/s, 0.8 m/s, 0.32 m/s, and 0.27 m/s. Measurements indicate that wind speed at the inlet of the Trombe wall increases by 0.9 m/s at least and 3.6 m/s at most. Data fitting suggests that the ventilation in May and September is particularly effective. The impact of the Trombe wall on the indoor still air zone is not as pronounced, with an approximate increase of 0.08 m/s in wind speed.

Figure 14.
Simulated cloud chart of wind speed at a height of 1.5 m.
An analysis of the conditions in hot-summer and cold-winter climate zones for each month reveals that the ventilation effect of the Trombe wall is notably better in spring and autumn, significantly improving the indoor wind environment. There is strong convective ventilation in the area parallel to the Trombe wall’s plane, and even during transitional seasons, the ventilation performance is commendable. However, it is important to note that during summer, the ventilation effectiveness of the Trombe wall is less than ideal. Considering the summer ventilation method of the Trombe wall, the air does not truly reach the entire indoor area but rather forms thermal convection near the wall opening. Furthermore, the average wind speed inside during summer is lower than that when the Trombe wall is not applied, indicating that the indoor wind environment in summer is relatively poor and fails to achieve the desired cooling and ventilation effects.
4.3. Variations in Wind Speed at Different Time
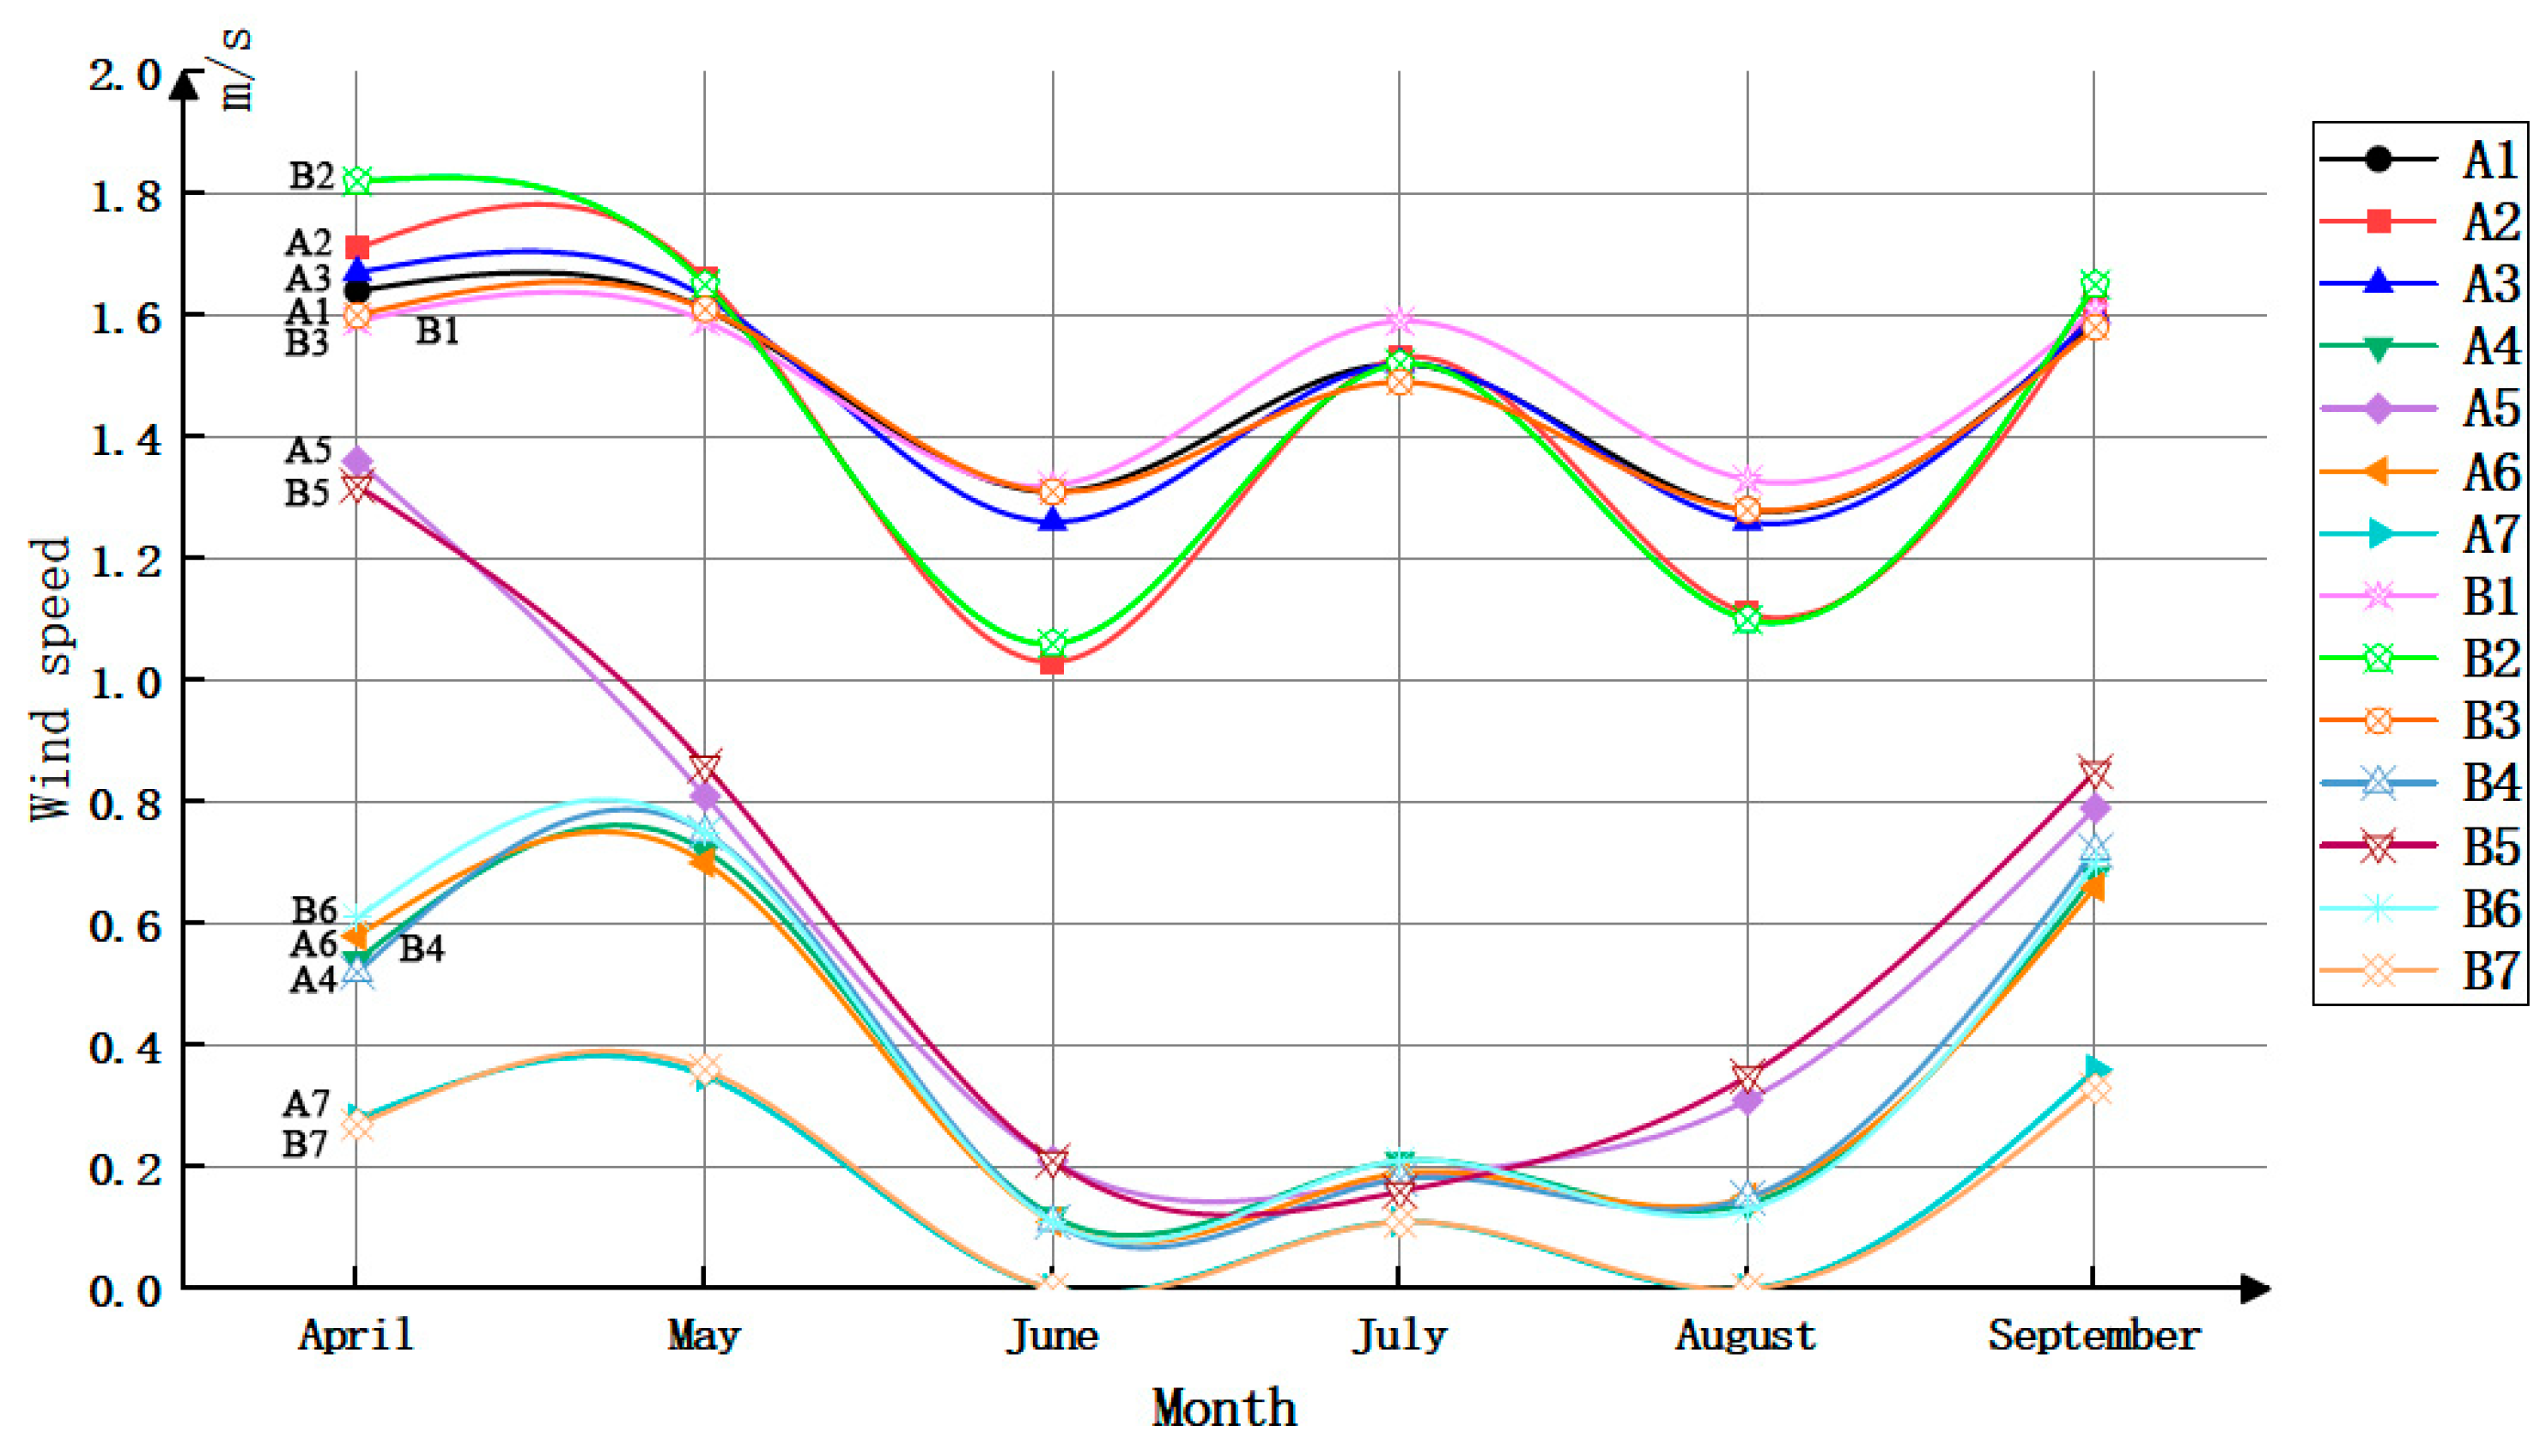
According to the observed wind speed data at 9 a.m. across different months, as detailed in Figure 15, wind speed does not particularly significantly increase at this time, which is attributed to the relatively lower solar radiation, resulting in insufficient thermal accumulation in the wall to substantially affect the indoor wind speed. The highest wind speed was recorded at point B2, reaching 1.82 m/s. The variation in wind speed is relatively stable during spring and autumn, while in summer, the fluctuation is more pronounced. During the summer, wind speeds in the central part of the room are lower, and there is no noticeable increase in the still air zone, with wind speeds approaching zero, implying that the ventilation effectiveness of the Trombe wall is relatively weaker in summer, failing to significantly enhance the indoor airflow rate. This condition could lead to a more stagnant indoor environment in the summer, lacking in coolness and ventilation.
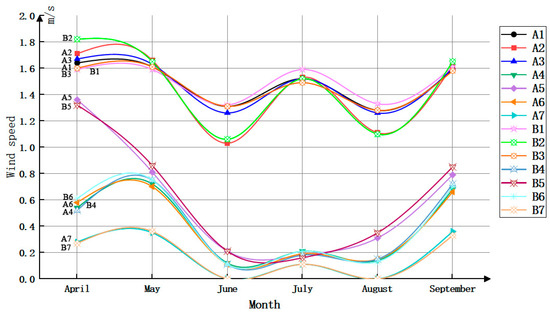
Figure 15.
Nine o’clock wind speed change chart.
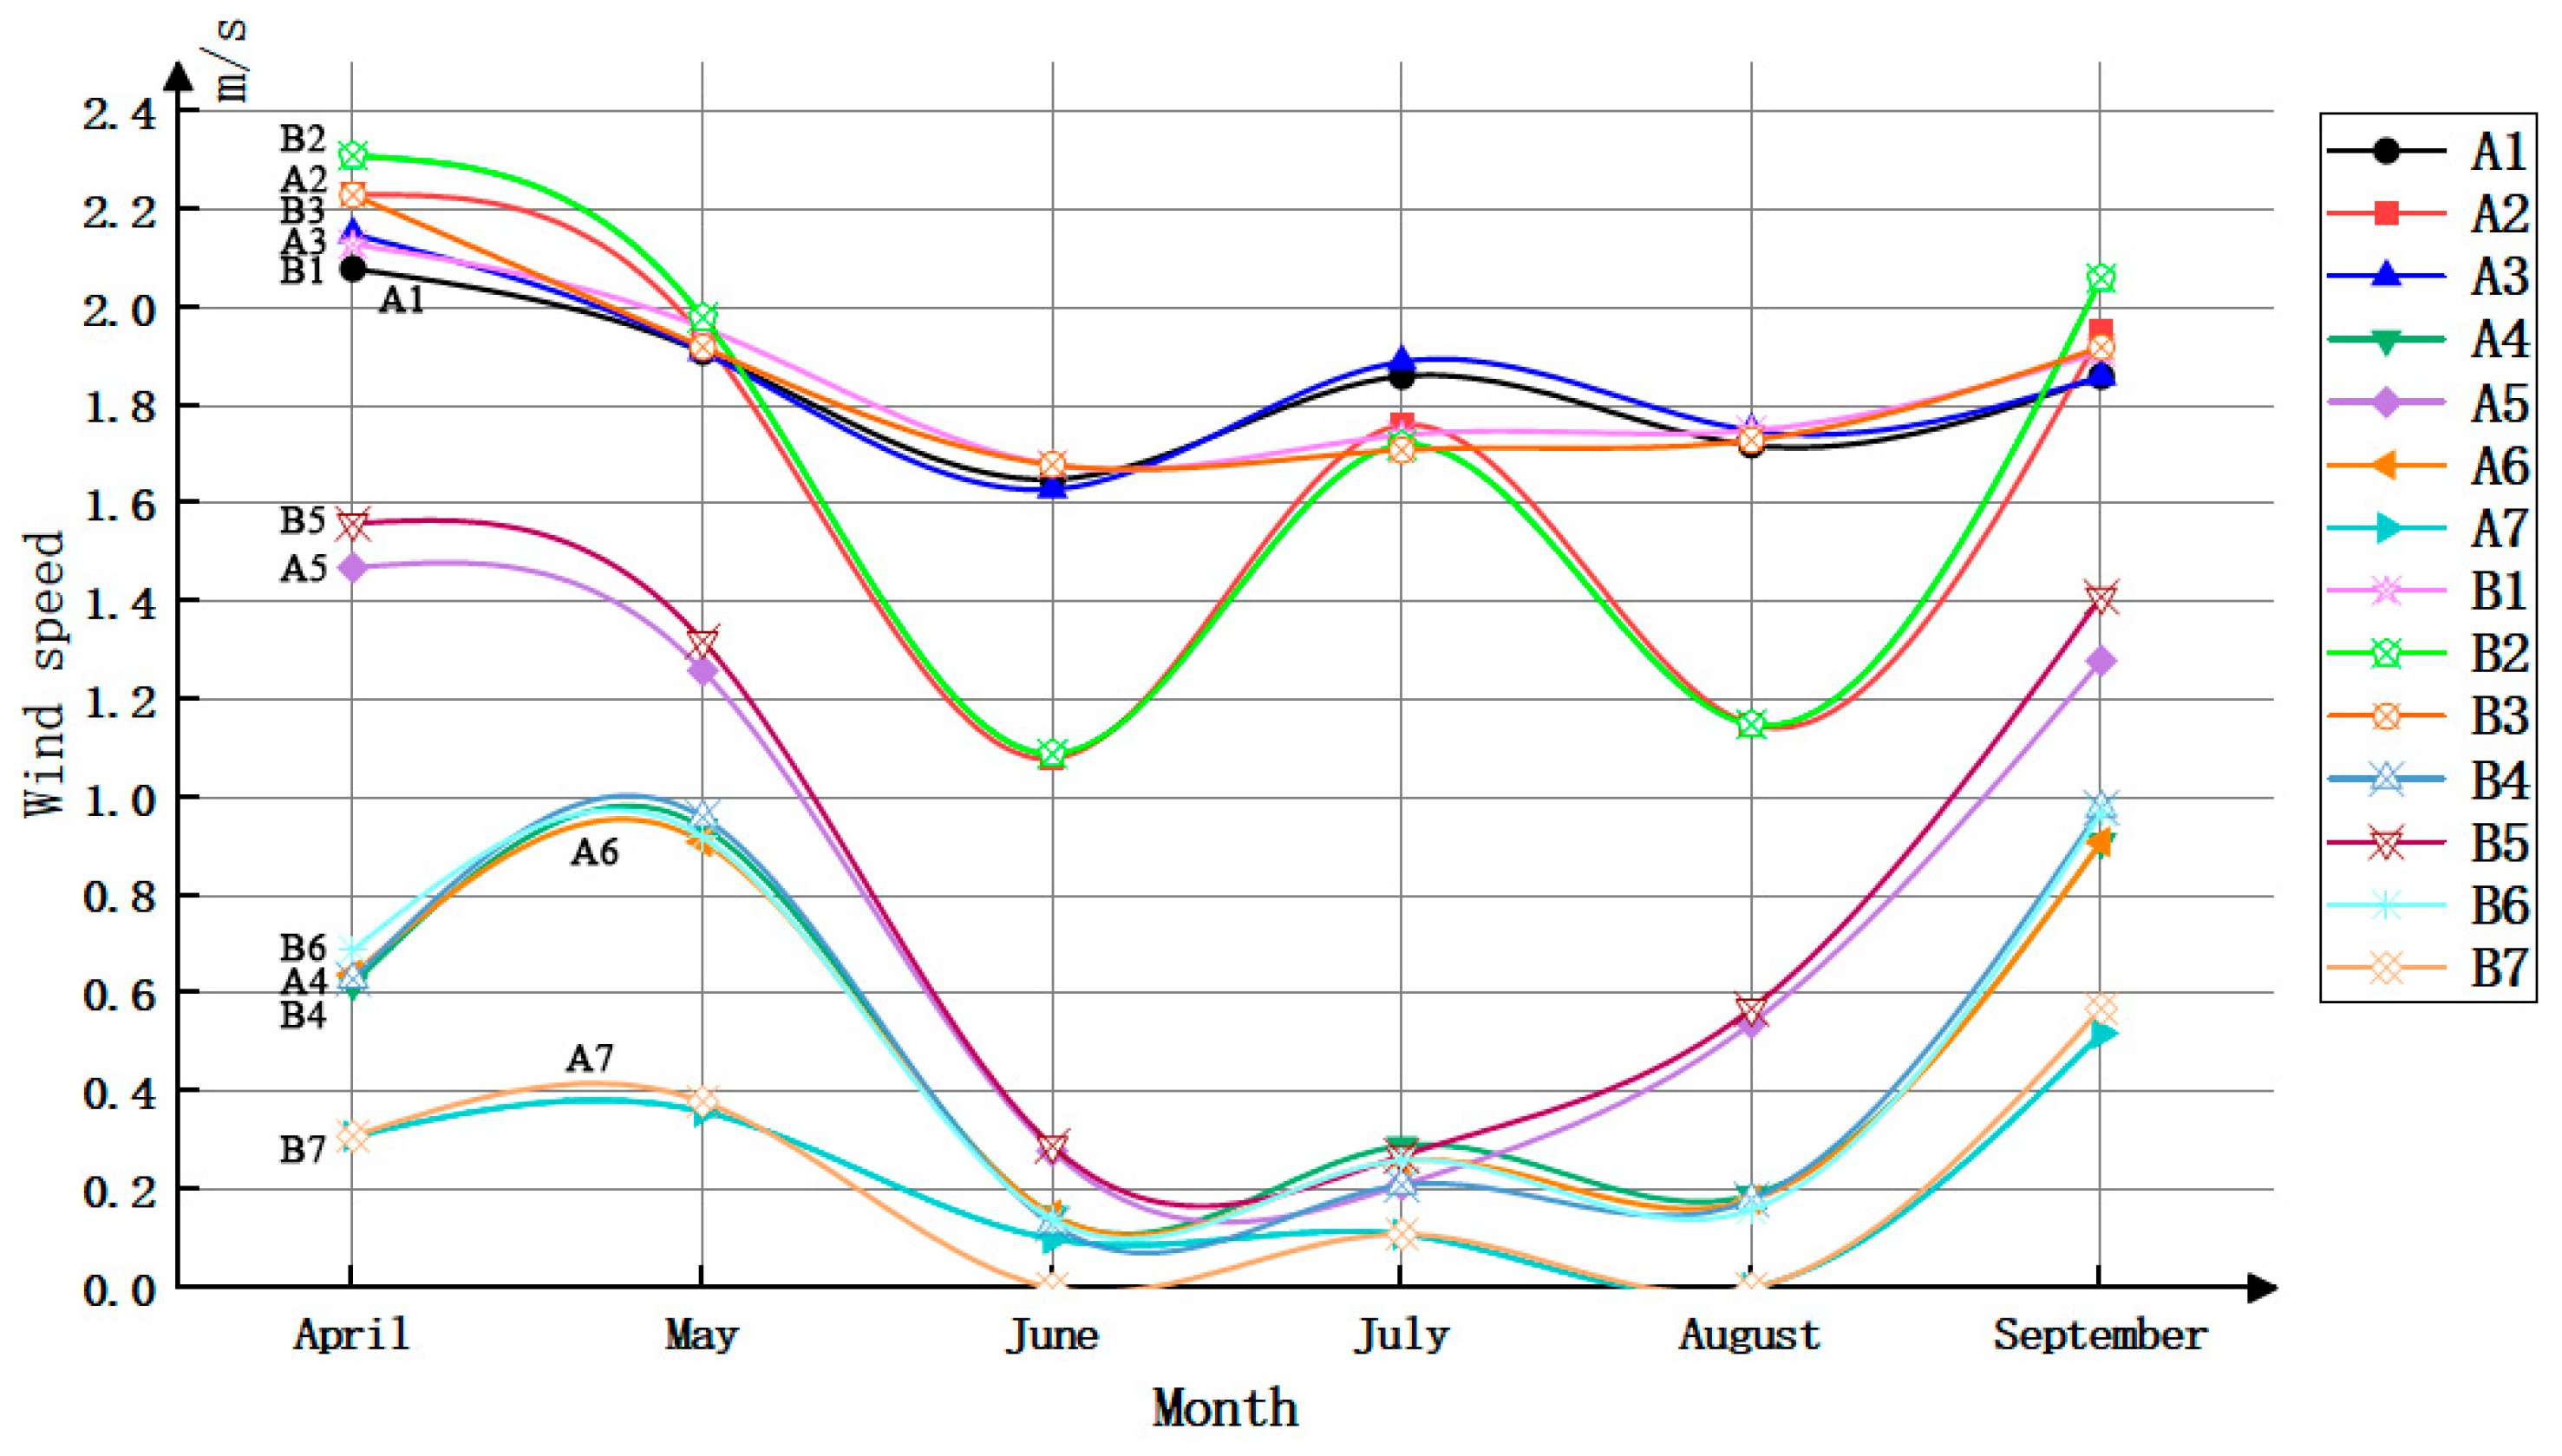
Analyzing the wind speed data at noon across various months from Figure 16 shows a noticeable increase in wind speed compared to 9 a.m. This rise is attributed to the stronger solar radiation at this time, which maintains the wall temperature at a higher level, allowing the thermal storage capability to be effectively utilized and consequently driving strong convective air movement indoors. The highest wind speed is still recorded at point B2, reaching 2.31 m/s. The wind speed in spring and autumn tends to be more stable and similar, while the variability in summer wind speed continues to grow, correlating with the season’s typically unstable weather patterns. In hot-summer and cold-winter climate zones, summer often witnesses strong convective weather, significantly impacting wind speed. In summer, the increase in wind speed in the central part of the room remains modest, and the wind speed in the still air zone continues to be negligible. Therefore, at noon in summer, the ventilation effect remains suboptimal. Conversely, during noon in spring and autumn, indoor wind speeds are considerably higher on average, resulting in better ventilation, which suggests that the Trombe wall is more effective in facilitating indoor ventilation and air movement in spring and autumn, contributing to enhanced indoor comfort.
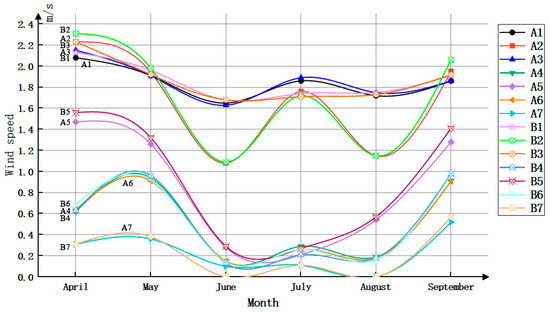
Figure 16.
Twelve o’clock wind speed change chart.
It can be seen from Figure 17 that the wind speed fluctuations at 3 p.m. are not significantly different from those at 12 p.m. Although solar radiation has diminished by this time, the thermal storage of the wall itself remains at its peak, making the ventilation performance at 3 p.m. still quite remarkable.
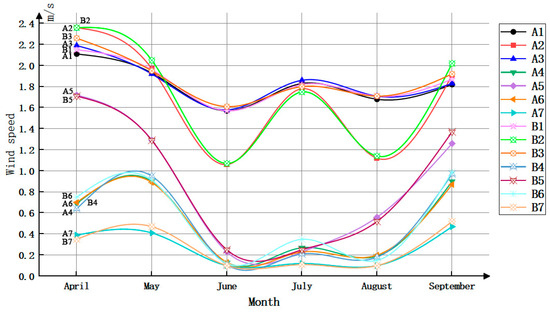
Figure 17.
Fifteen o’clock wind speed change chart.
4.4. Comparison of Psychrometric Charts
Figure 18 vividly illustrates the environmental impact of the Trombe wall in the current study. This article introduces the Ladybug tools plugin in Rhino7 Grasshopper software for indoor thermal comfort simulation. This plugin can handle climate information while also simulating indoor thermal comfort, excluding winter. During this process, actual wind speed data from the Trombe wall were incorporated, enabling a more accurate representation of its effects. The charts clearly demonstrate that the temperature and humidity during transitional seasons can be maintained within a relatively comfortable range with the application of the Trombe wall in hot-summer and cold-winter climate zones. Taking the Wenzhou area as an example, the annual average temperature is approximately 18.5 °C, with annual average relative humidity ranging between 74% and 85%.
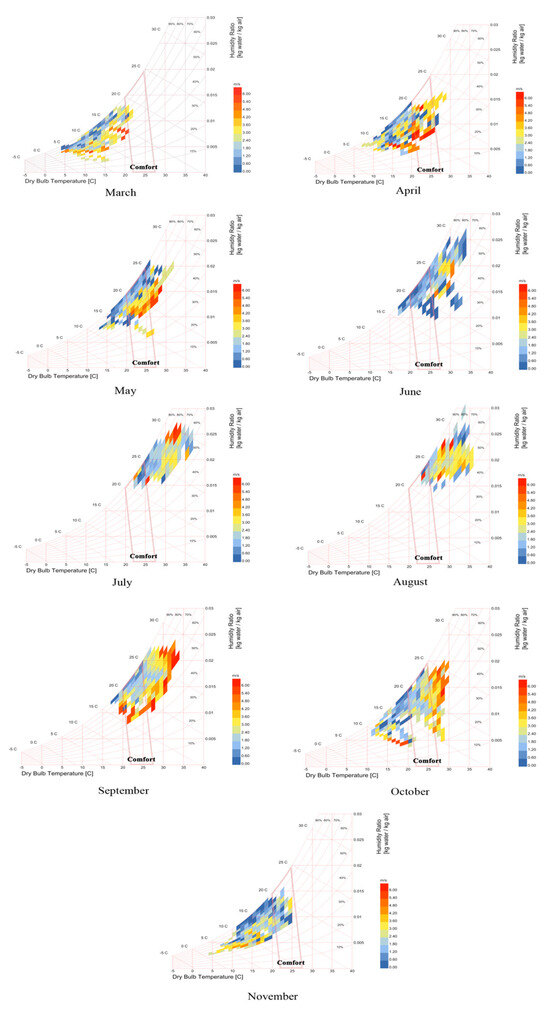
Figure 18.
Annual enthalpy and humidity chart.
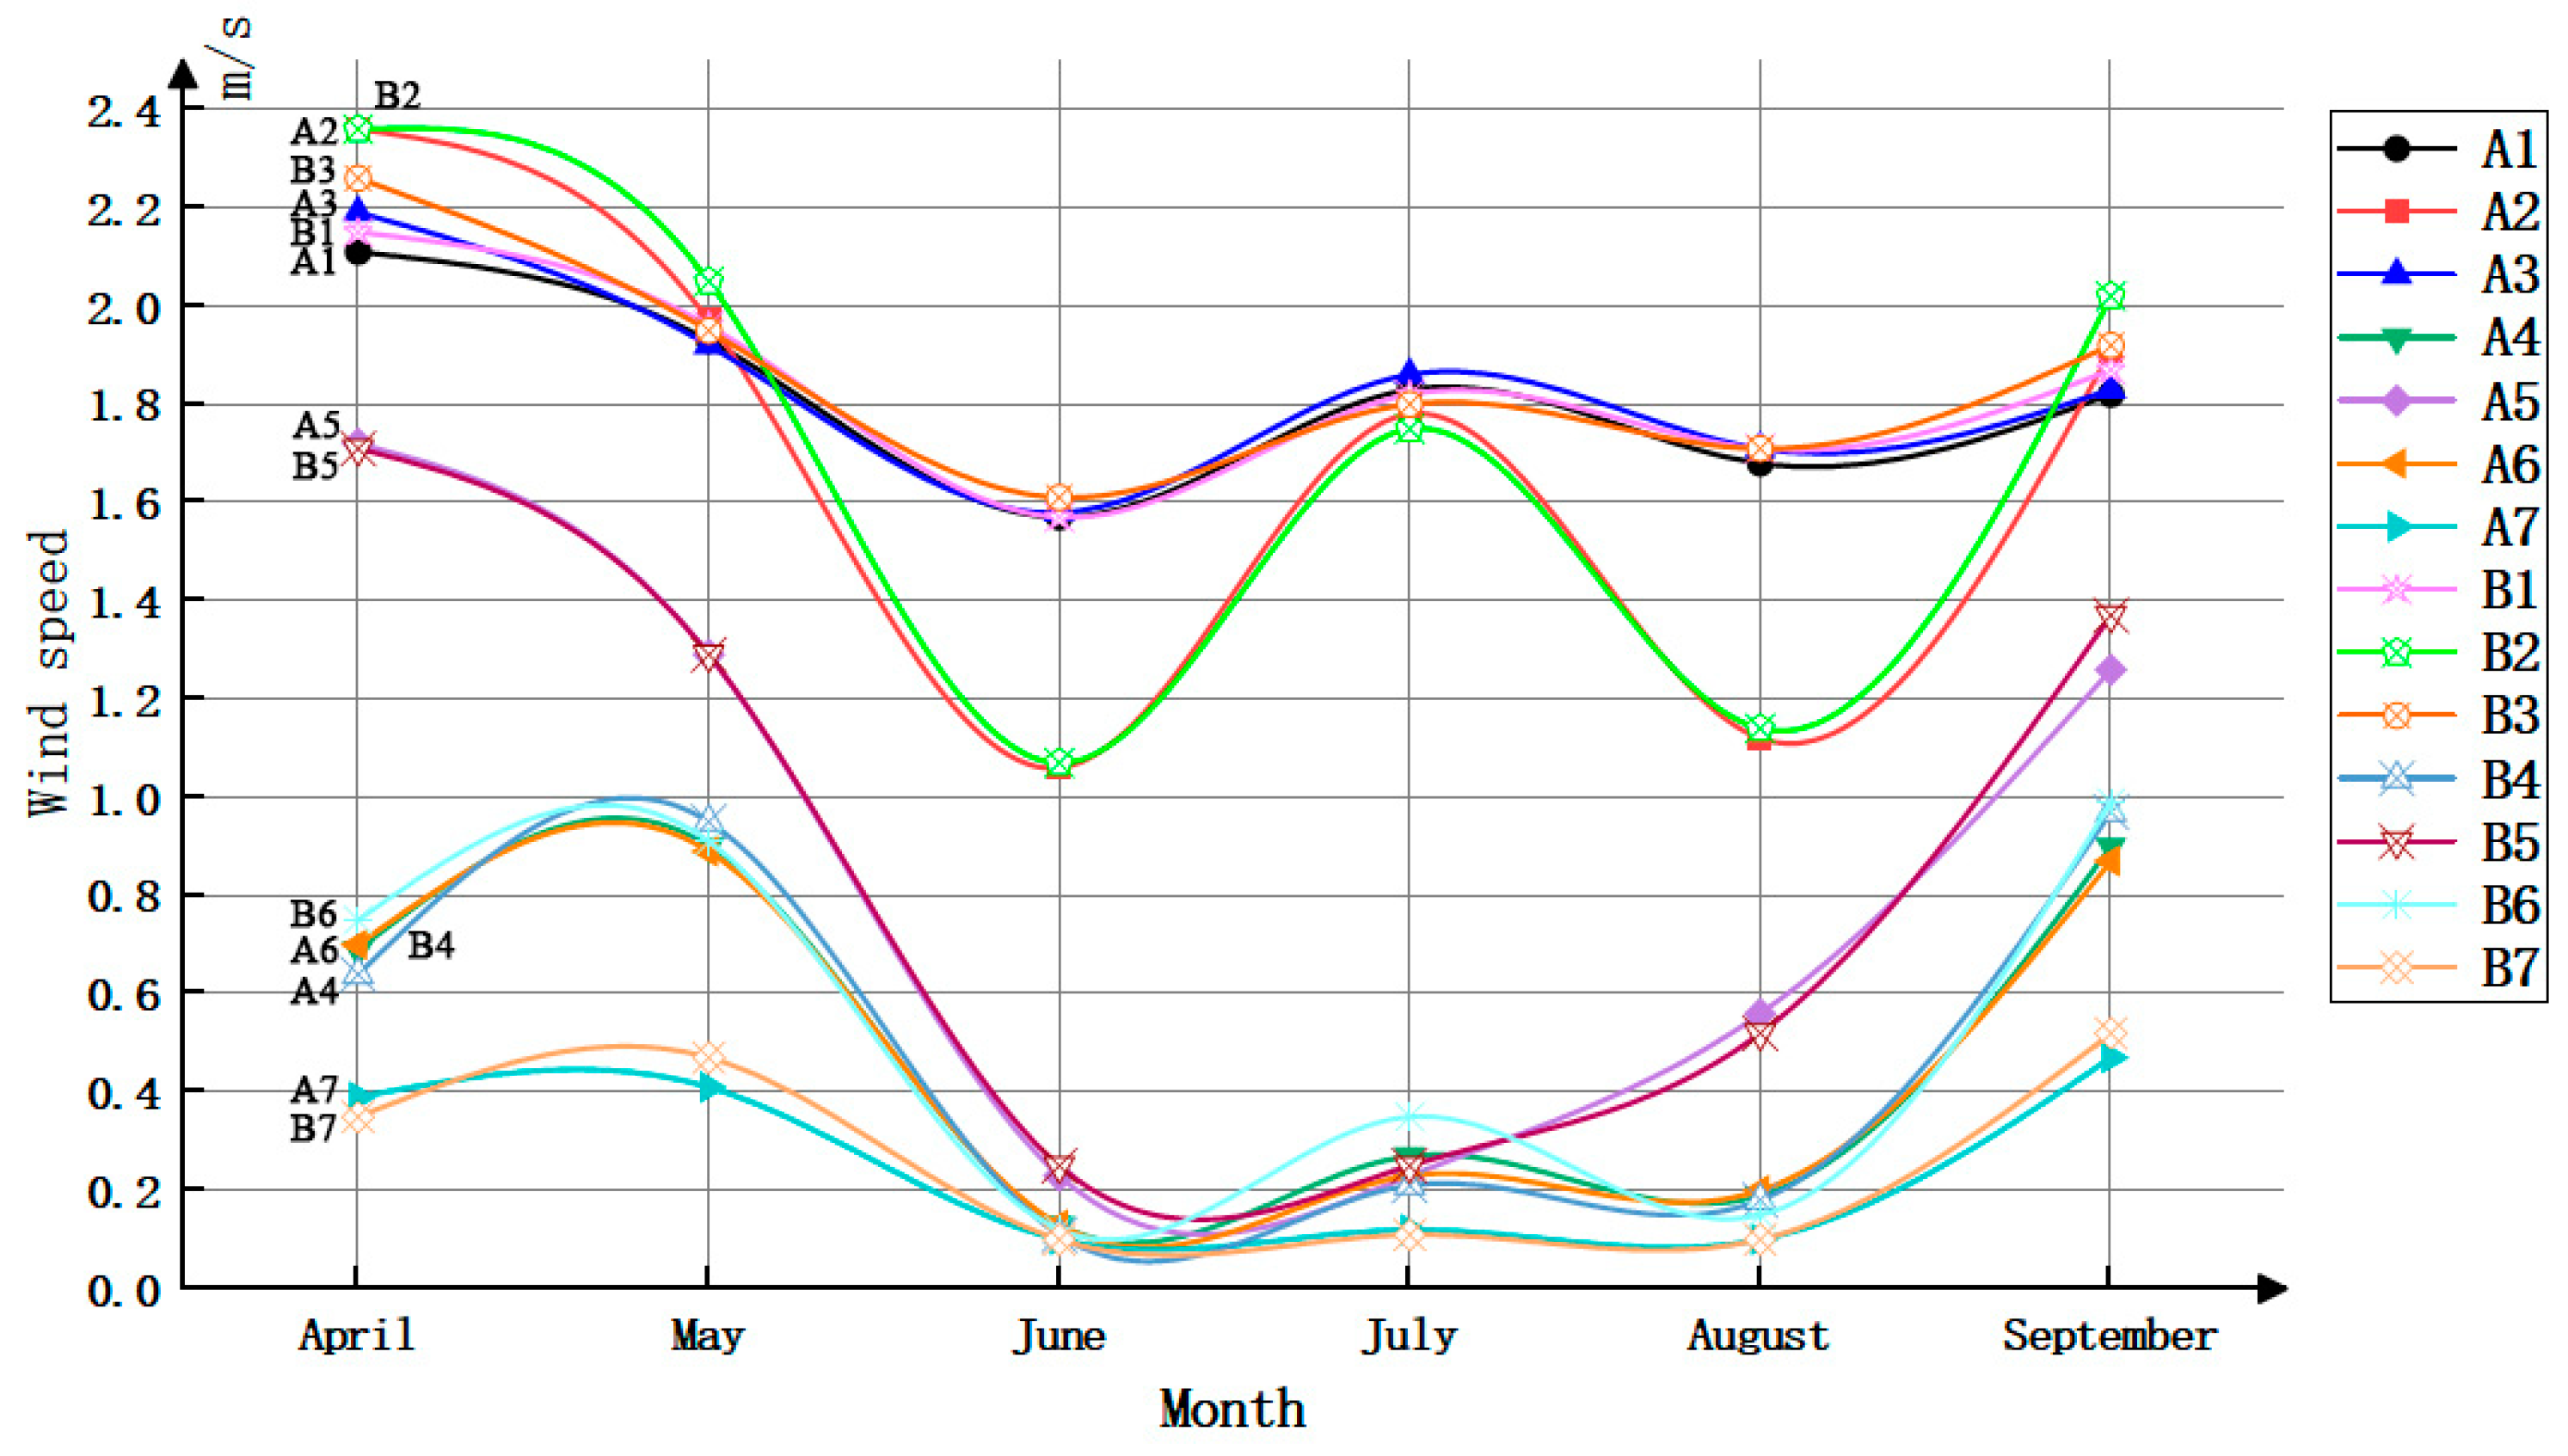
The chart also includes a thermal comfort range established using the PMV (predicted mean vote) model, which accounts for varying clothing conditions across different seasons and assumes a default standing posture. The thermal comfort range indicates that while summer thermal comfort remains relatively low with the application of the Trombe wall, comfort is higher in spring, autumn, and transitional seasons. Notably, May and September show the highest proportions of thermal comfort, accounting for 47% and 45% of the comfort range, respectively. These months are considered the most comfortable periods throughout the year following the application of the Trombe wall. Additionally, the ventilation performance in May and September is also relatively good. Figure 19 presents wind speed statistics and overlay charts for these months, indicating minor fluctuations in wind speed at points A1, A2, A3, B1, B2, and B3. This suggests a relatively stable convective effect at the inlet of the Trombe wall, with strong guiding performance. However, the central part of the building shows greater variability in wind speeds due to the diminishing influence of the Trombe wall, with impact varying at various points. The central area experiences higher wind speeds, while the sides have lower speeds, but the trend remains fairly consistent in May and September. Notably, air zone points A7 and B7 still register considerable wind speeds in these months, demonstrating the exemplary performance of the Trombe wall in transitional seasons.
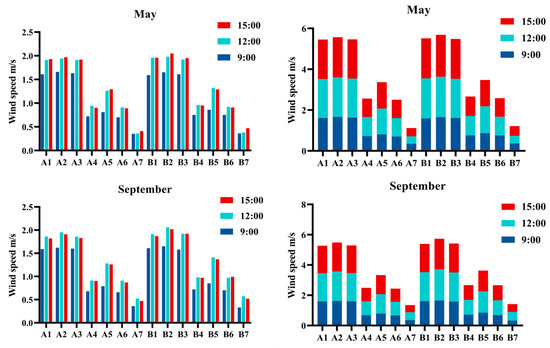
Figure 19.
Wind speed statistics for May and September.
Based on the aforementioned analysis, it becomes evident that the Trombe wall exhibits commendable ventilation performance during transitional seasons and effectively adjusts the indoor thermal comfort environment, making it an outstanding passive ventilation approach.
5. Conclusions
To delve deeper into the impact of the Trombe wall on indoor ventilation effectiveness, this study employed the k-ε model for CFD simulations and complemented it with empirical measurements. A physical theoretical model was constructed based on the existing architectural conditions. Subsequently, numerical simulations of the wind environment across different seasons were conducted to explore the ventilation performance of the Trombe wall within the climate zone. Field measurements for certain months were also carried out to establish a data foundation. Wind speed data were incorporated into psychrometric charts and thermal comfort models for fitting and drafting, resulting in refined psychrometric charts. The comparison between simulation results and empirical data reveals that due to the variability of wind speeds and climatic conditions, some discrepancies exist, but overall, there is a good correlation. These results effectively reflect the characteristics of the indoor wind environment following the application of the Trombe wall. In summary, the study primarily concludes the following:
- (1)
- With an in-depth exploration of the Trombe wall’s ventilation performance across various seasons, it is concluded that the Trombe wall performs well in spring, autumn, and transitional seasons, achieving an average wind speed increase of 0.2 m/s to 0.8 m/s in the central part of the building and 0.9 m/s to 3.6 m/s at the inlet of the Trombe wall. However, its performance in summer is suboptimal, with extensive areas of still air inside the building, failing to effectively improve the indoor wind environment. Therefore, the Trombe wall in hot-summer and cold-winter regions should be utilized during spring, autumn, and transitional seasons.
- (2)
- Due to the thermal storage properties of the Trombe wall, its ventilation effectiveness is relatively weaker in the morning hours, exhibiting a steady increase from 9 a.m. to 12 p.m. The wall temperature peaks at noon, resulting in a significant improvement in ventilation effectiveness, which remains high until 3 p.m. Observing the Trombe wall’s daytime operation, the wall temperature maintains a high level from noon until evening, thereby ensuring effective ventilation and pronounced thermal convection.
- (3)
- Incorporating wind speed data into psychrometric charts and thermal comfort models reveal that May and September experience a higher proportion of indoor thermal comfort, accounting for 47% and 45%, respectively, which further indicates that following the application of the Trombe wall, there is a significant improvement in indoor thermal comfort during transitional seasons while maintaining the stability of the indoor wind environment.
Author Contributions
Z.S.: Conceptualization, Software, Validation, Formal analysis, Writing—original draft preparation, and Writing—review and editing. G.Z. and J.L.: Conceptualization, Software, Validation, Writing—original draft preparation, and Writing—review and editing; Z.C., X.L.: methodology, validation, supervision. G.Z. and C.Y.: formal analysis and visualization. All authors have read and agreed to the published version of the manuscript.
Funding
This research received no external funding.
Institutional Review Board Statement
Not applicable.
Informed Consent Statement
Not applicable.
Data Availability Statement
The data that support the findings of this study are available from the corresponding author upon reasonable request.
Acknowledgments
We are thankful to all our colleagues and coauthors for their very valued contributions to this work. The authors are also very appreciative of the reviewers’ comments, which helped better the manuscript.
Conflicts of Interest
Author Jinhe Lin was employed by the company Guangzhou Meiya Energy Storage Technology Company. Author Xiaojun Luo was employed by the company China Construction Fifth Engineering Division Co. The remaining authors declare that the research was conducted in the absence of any commercial or financial relationships that could be construed as a potential conflict of interest.
References
- GBJ96-86; Code for Design of Residential Buildings—Code Forresidential Building Design. Ministry of Environmental Protection of the People’s Republic of China: Beijing, China, 1987.
- Lee, K.H.; Strand, R.K. Enhancement of natural ventilation in buildings using a thermal chimney. Energy Build. 2009, 41, 615–621. [Google Scholar] [CrossRef]
- Zhai, X.; Song, Z.; Wang, R. A review for the applications of solar chimneys in buildings. Renew. Sustain. Energy Rev. 2011, 15, 3757–3767. [Google Scholar] [CrossRef]
- Shi, L.; Zhang, G.; Cheng, X.; Guo, Y.; Wang, J.; Chew, M.Y.L. Developing an empirical model for roof solar chimney based on experimental data from various test rigs. Build. Environ. 2016, 110, 115–128. [Google Scholar] [CrossRef]
- Haaf, W.; Friedrich, K.; Mayr, G.; Schlaich, J. Solar chimneys part I: Principle and construction of the pilot plant in Manzanares. Int. J. Sol. Energy 1983, 2, 3–20. [Google Scholar] [CrossRef]
- Fordham, M. Natural ventilation. Renew. Energy 2000, 19, 17–37. [Google Scholar] [CrossRef]
- Khedari, J.; Rachapradit, N.; Hirunlabh, J. Field study of performance of solar chimney with air-conditioned building. Energy 2003, 28, 1099–1114. [Google Scholar] [CrossRef]
- Shi, L.; Zhang, G.; Yang, W.; Huang, D.; Cheng, X.; Setunge, S. Determining the influencing factors on the performance of solar chimney in buildings. Renew. Sustain. Energy Rev. 2018, 88, 223–238. [Google Scholar] [CrossRef]
- Fahmy, M.; Mahdy, M.M.; Nikolopoulou, M. Prediction of future energy consumption reduction using GRC envelope optimization for residential buildings in Egypt. Energy Build. 2014, 70, 186–193. [Google Scholar] [CrossRef]
- Abdeen, A.; Serageldin, A.A.; Ibrahim, M.G.; El-Zafarany, A.; Ookawara, S.; Murata, R. Solar chimney optimization for enhancing thermal comfort in Egypt: An experimental and numerical study. Sol. Energy 2019, 180, 524–536. [Google Scholar] [CrossRef]
- Elghamry, R.; Hassan, H. Impact a combination of geothermal and solar energy systems on building ventilation, heating and output power: Experimental study. Renew. Energy 2020, 152, 1403–1413. [Google Scholar] [CrossRef]
- Sá, A.B.; Boaventura-Cunha, J.; Lanzinha, J.C.; Paiva, A. An experimental analysis of the Trombe wall temperature fluctuations for high range climate conditions: Influence of ventilation openings and shading devices. Energy Build. 2017, 138, 546–558. [Google Scholar]
- Jiru, T.E.; Bitsuamlak, G.T. Application of CFD in modelling wind-induced natural ventilation of buildings-A review. Int. J. Vent. 2010, 9, 131–147. [Google Scholar] [CrossRef]
- Khanal, R.; Lei, C. Flow reversal effects on buoyancy induced air flow in a solar chimney. Sol. Energy 2012, 86, 2783–2794. [Google Scholar] [CrossRef]
- Du, L.; Ping, L.; Yongming, C. Study and analysis of air flow characteristics in Trombe wall. Renew. Energy 2020, 162, 234–241. [Google Scholar] [CrossRef]
- Jiménez-Xamán, C.; Xamán, J.; Gijón-Rivera, M.; Zavala-Guillén, I.; Noh-Pat, F.; Simá, E. Assessing the thermal performance of a rooftop solar chimney attached to a single room. J. Build. Eng. 2020, 31, 101380. [Google Scholar] [CrossRef]
- Sundar, S.; Prakash, D.; Surya, V. Analysis and Optimization of Passive Wall Solar Chimney through Taguchi’s Technique. Appl. Sol. Energy 2020, 56, 397–403. [Google Scholar] [CrossRef]
- Bilgen, E. Conjugate heat transfer by conduction and natural convection on a heated vertical wall. Appl. Therm. Eng. 2009, 29, 334–339. [Google Scholar] [CrossRef]
- Long, J.; Yongga, A.; Sun, H. Thermal insulation performance of a Trombe wall combined with collector and reflection layer in hot summer and cold winter zone. Energy Build. 2018, 171, 144–154. [Google Scholar] [CrossRef]
- Ma, Q.; Fukuda, H.; Lee, M.; Kobatake, T.; Kuma, Y.; Ozaki, A. Study on the utilization of heat in the mechanically ventilated Trombe wall in a house with a central air conditioning and air circulation system. Appl. Energy 2018, 222, 861–871. [Google Scholar] [CrossRef]
- Koronakis, P. Solar chimney dynamic performance under typical Mediterranean summer conditions. Int. J. Sol. Energy 1992, 13, 73–84. [Google Scholar] [CrossRef]
- Demirbilek, F.N.; Yalçiner, U.G.; Ecevit, A.; Sahmali, E.; Inanici, M. Analysis of the thermal performance of a building design located at 2465m: Antalya-Saklikent National Observatory guesthouse. Build. Environ. 2003, 38, 177–184. [Google Scholar] [CrossRef]
- Zhou, Y.; Wang, Z.; Xu, L.; Zhang, S.K.; Sui, C.J. Characteristic analysis of buoyancy induced indoor ventilation in Trombe wall channels. Acta Energiae Solaris Sin. 2021, 42, 8. [Google Scholar]
- ANSYS Inc. ANSYS FLUENT Theory Guide; ANSYS Inc.: Canonsburg, PA, USA, 2013. [Google Scholar]
- Gowda, B.K.; Rajagopal, M.; Seetharamu, K. Heat transfer in a side heated trapezoidal cavity with openings. Eng. Sci. Technol. Int. J. 2019, 22, 153–167. [Google Scholar] [CrossRef]
- JGJ/T 449-2018; Calculation Standard for Green Performance of Civil Buildings. Ministry of Housing and Urban Rural Development of the People’s Republic of China, China Architecture & Building Press: Beijing, China, 2018.
- Franke, J.; Hellsten, A.; Schlünzen, H.; Carissimo, B. Best Practice Guideline for the CFD Simulation of Flows in the Urban Environment. COST European Cooperation in Science and Technology; COST Office: Brussels, Belgium, 2007. [Google Scholar]
- Tominaga, Y.; Mochida, A.; Yoshie, R.; Kataoka, H.; Nozu, T.; Yoshikawa, M.; Shirasawa, T. AIJ guidelines for practical applications of CFD to pedestrian wind environment around buildings. J. Wind Eng. Ind. Aerodyn. 2008, 96, 1749–1761. [Google Scholar] [CrossRef]
- Chantawong, P.; Hirunlabh, J.; Zeghmati, B.; Khedari, J.; Teekasap, S.; Win, M.M. Investigation on thermal performance of glazed solar chimney walls. Sol. Energy 2006, 80, 288–297. [Google Scholar] [CrossRef]
- Shen, J.; Lassue, S.; Zalewski, L.; Huang, D. Numerical study on thermal behavior of classical or composite Trombe solar walls. Energy Build. 2007, 39, 962–974. [Google Scholar] [CrossRef]
- Acred, A.; Hunt, G.R. A simplified mathematical approach for modelling stack ventilation in multi-compartment buildings. Build. Environ. 2014, 71, 121–130. [Google Scholar] [CrossRef]
- Abdeen, A.; Serageldin, A.A.; Ibrahim, M.G.E.; Zafarany, A.E.; Ookawara, S.; Murata, R. Experimental, analytical, and numerical investigation into the feasibility of integrating a passive Trombe wall into a single room. Appl. Therm. Eng. 2019, 154, 751–768. [Google Scholar] [CrossRef]


Disclaimer/Publisher’s Note: The statements, opinions and data contained in all publications are solely those of the individual author(s) and contributor(s) and not of MDPI and/or the editor(s). MDPI and/or the editor(s) disclaim responsibility for any injury to people or property resulting from any ideas, methods, instructions or products referred to in the content. |
© 2024 by the authors. Licensee MDPI, Basel, Switzerland. This article is an open access article distributed under the terms and conditions of the Creative Commons Attribution (CC BY) license (https://creativecommons.org/licenses/by/4.0/).