1. Introduction
Physical inactivity among Chilean adults is relatively prevalent which results in a high obesity rate in this country [
1]. Obesity affects over 35% of Chileans above the age of 15 [
2,
3]. Obesity-related health problems are the leading cause of death and disability [
4]. Regular physical activity has numerous health benefits [
5]; hence, the level of physical activity in this country needs to be increased. Walking, as one type of regular moderate physical activity practiced by people of all ages worldwide, is an easy type of physical activity that contributes to maintaining a minimal rate of physical activity and enhancing physical health [
6]. It is the most common kind of leisure time physical activity among adults in the United States [
7]. According to ecological models, one of the main elements influencing walking behavior is the built environment [
8,
9]. The existence of urban parks, among other built environmental elements, has been shown to promote walking behavior, particularly walking for recreation on the neighborhood scale [
10,
11].
Walking in parks is usually seen as recreational walking [
12]. The characteristics of the nearby environment are intimately related to recreational walking [
13]. As a result, the design features of urban park pathways are critical in encouraging leisure walking. Furthermore, recent research has shown the significance of both attractions for walking (walking preference) and walking behavior when evaluating leisure walking [
14]. As a result, both of these factors may be essential when analyzing the relationship between design-related attributes along paths and walking in urban park pathways.
Cautin Park, with a total area of 27.7 hectares, is the largest urban park in Temuco and the Araucania region of Chile. It draws individuals from all around the city, who come to spend some of their free time at this park. As previously stated, the design aspects of the pathways in this park may play an important role in improving the tendency to walk as well as the walking behavior of the inhabitants due to the importance of this park as the largest and only urban park of this type in this city and region.
The objective of this study is to assess the relationship between design aspects and walking behavior in Cautin Park, the largest urban park in Temuco and Araucaria Region. This would help Temuco’s residents improve their physical activity and public health. This study’s key research question is as follows:
- -
What pathway design characteristics are associated with the walking preference/behavior of pedestrians in Cautin Park?
2. Literature Review
2.1. Walking for Recreation and the Built Environment
Prior research on a neighborhood scale has discovered a relationship between walking for recreation and environmental factors, including land use mix [
15], the availability of paths for walking [
16], infrastructure for walking, including its condition and quality of the surface [
17,
18], the proximity of recreational facilities [
16,
18], the presence of accessible destinations such as stores, parks, and beaches [
17,
19], the presence of public transportation facilities [
19,
20], surrounding non-residential areas [
21], perceived and actual traffic safety, including elements like the proportion of a street’s length that has speed limits [
16,
19], less worry about crime and increased personal security [
17,
22], and the person’s perception of the aesthetics of their area, as well as the presence of aesthetic elements such the amount of tree canopy covering, the upkeep of walkways, cleanliness, and the view of architecture [
16,
17,
23]. Additionally, Borst et al. [
14] examined the connections between the perceived attractiveness of streets for walking and (physical) street characteristics. They discovered that three primary factors—the street’s cleanliness, its scenic value, and the presence of activity or other people along the street—affect how appealing streets are to walkers [
14].
2.2. Walking Behavior and the Factors That Influence It in Urban Parks
The majority of the design features linked to pedestrian behavior along pathways have been investigated and examined at the neighborhood scale. Even though urban park pathways have been demonstrated to be important areas for encouraging walking and physical activity [
24], the characteristics of park pathways that enhance pedestrian mobility have rarely been studied [
25]. In the design of urban park pathways, aesthetic and comfort-related factors were prioritized over other considerations. According to Kaczynski et al. [
24], compared to parks without paved paths, parks with paved trails are more likely to be used for physical activity. Seniors prefer walkways with soft or even surfaces, benches, flowers, and light fixtures, according to Zhai and Baran [
25]. Trails with soft pavement, shade, pathway width, benches, and the presence of flowers and trees all lead to better walking behavior in urban parks [
25,
26,
27,
28].
In addition to the physical attributes along the pathways, the aspects related to pathway surroundings are crucial in improving walking behavior at the neighborhood scale as well as in the urban park setting [
25,
29]. Visual interest, lateral visibility, street space scale, landmarks that can be seen from the paths, public gardens that can be seen, transparent front structures, activity that can be seen, street trees, coherence of built form, and lighting are various aspects of path surroundings investigated in previous studies [
29,
30,
31,
32]. The enclosure type along the pathways contributes to the improvement in walking behavior in the natural and urban park setting [
25,
33]. Water has a beneficial effect on observers’ emotional states as well as their propensity for walking [
34]. Visual connection with landmarks, according to Lynch [
30], may influence people’s walking movements [
30,
35]. Finally, the linkage of pathways to activity zones increases the amount of walking in the park environment [
25,
36].
3. Methods
3.1. Case Study
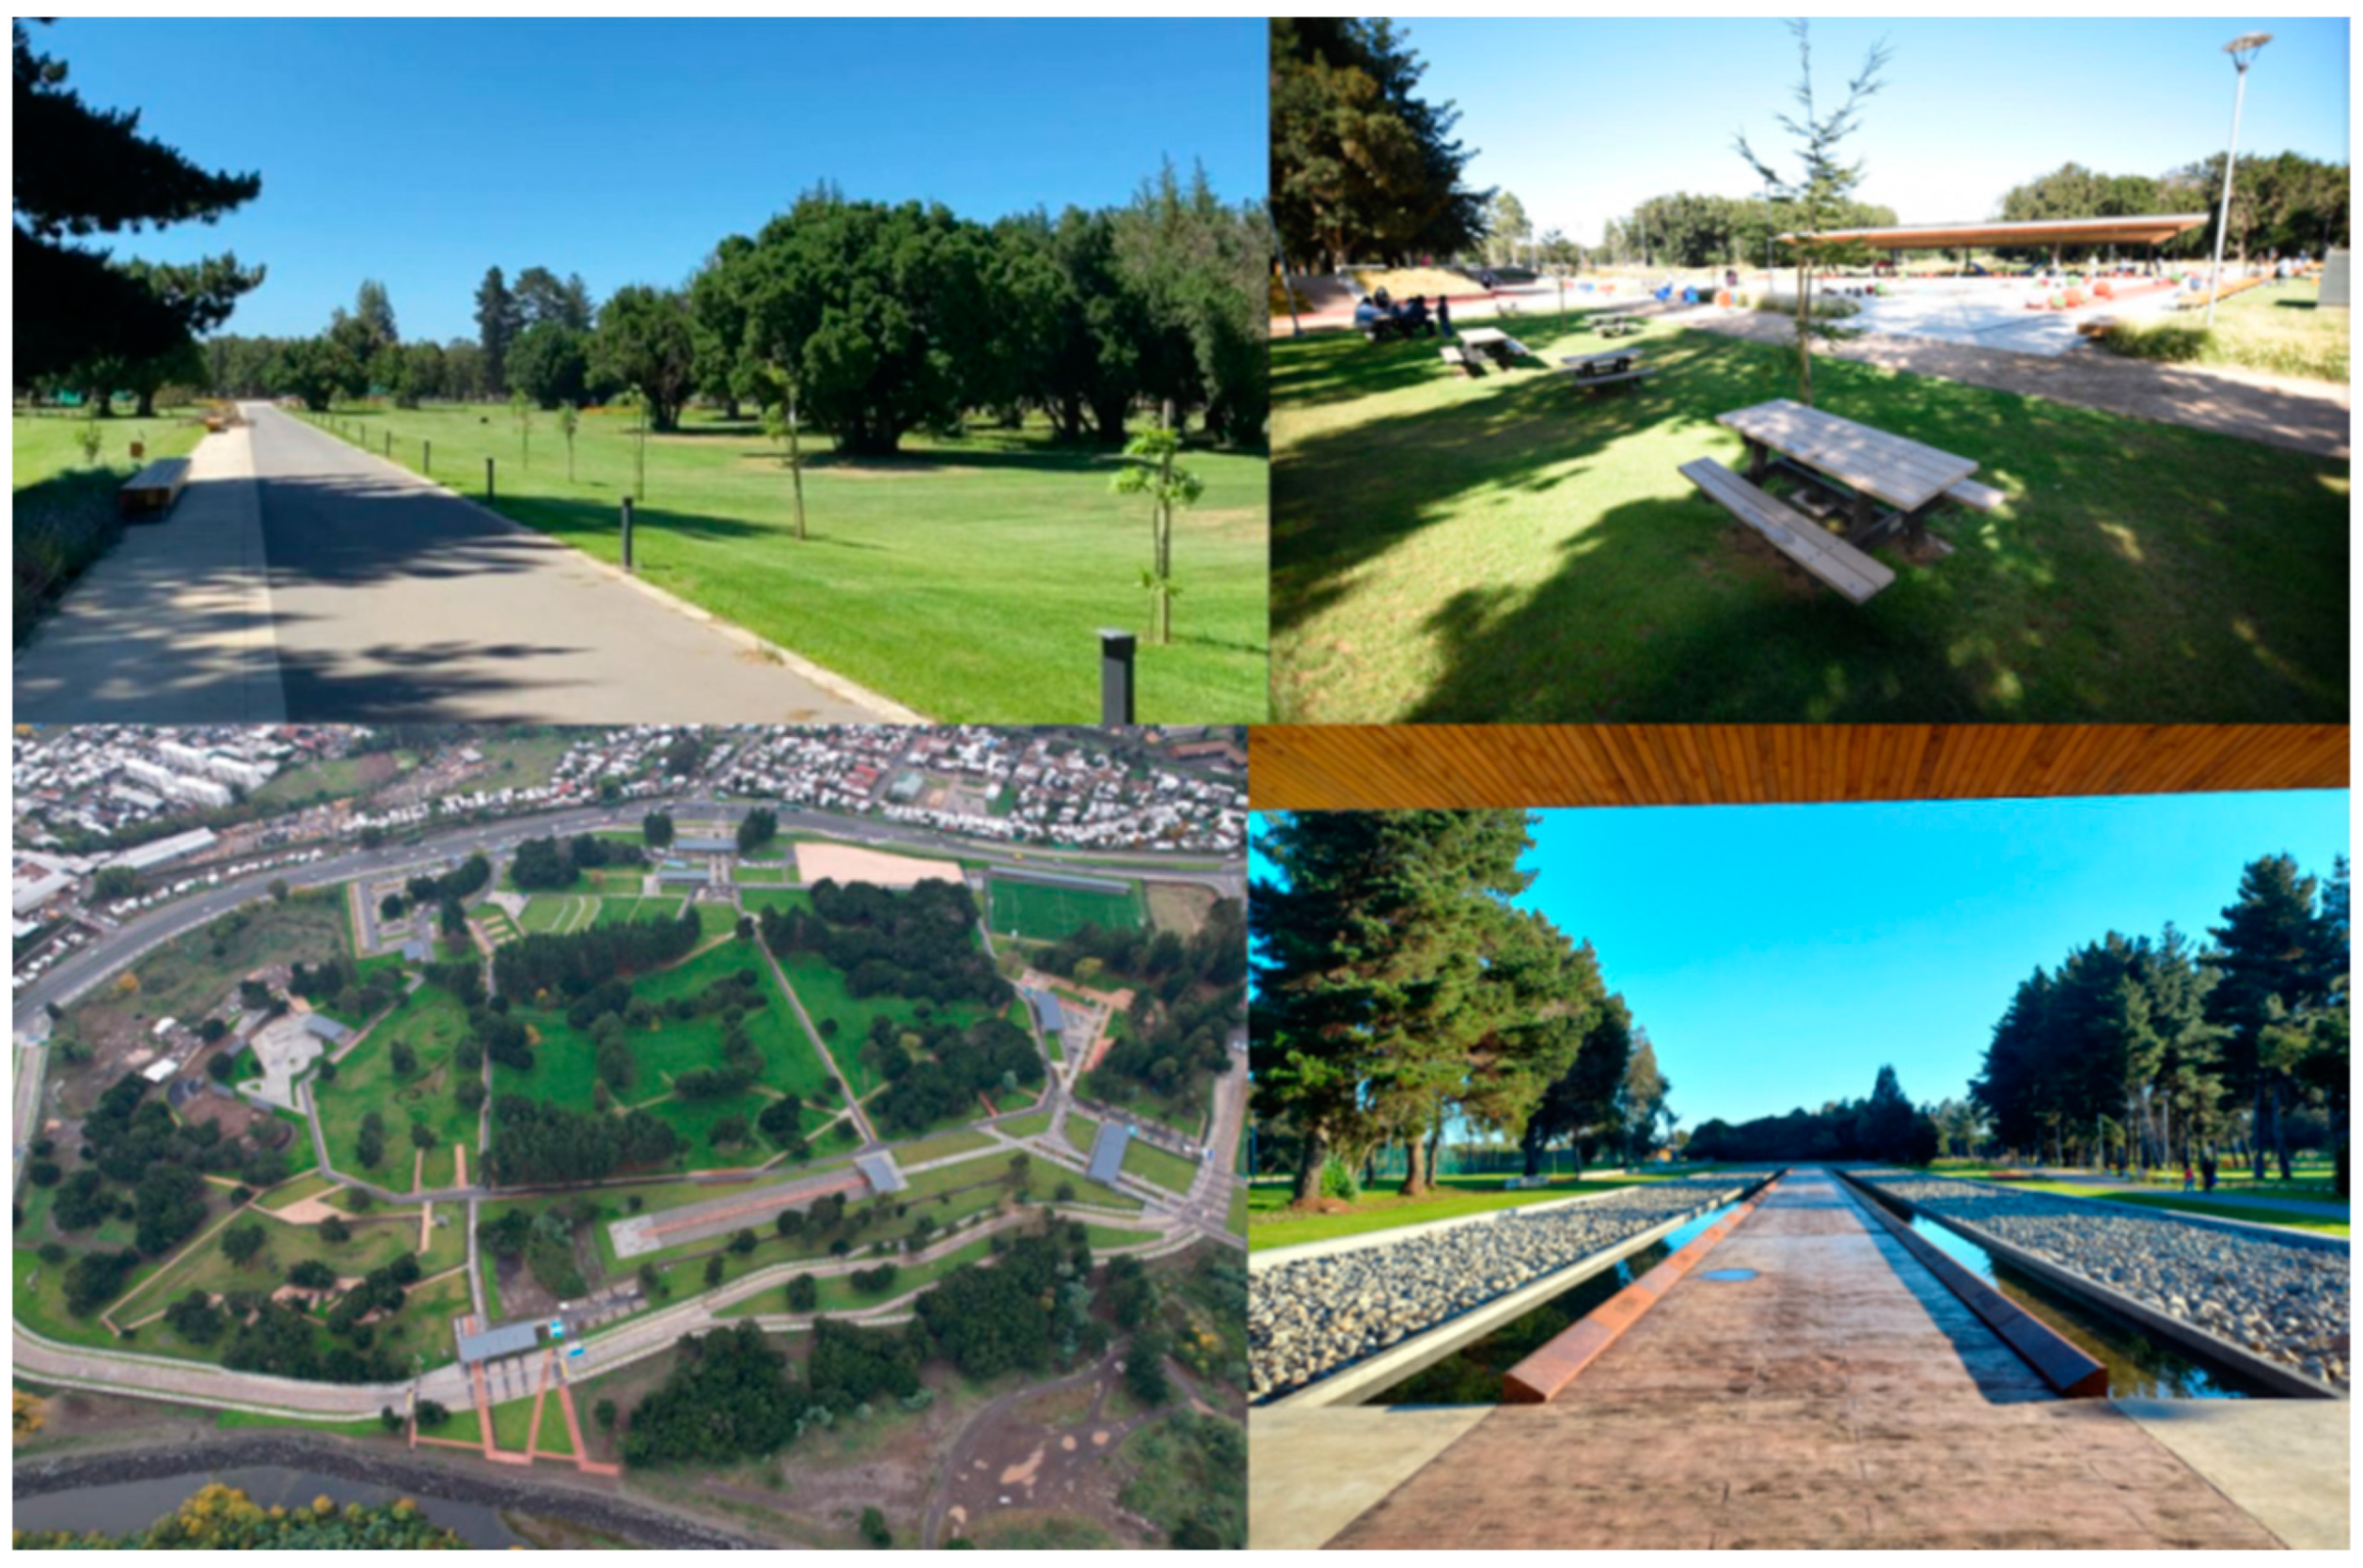
Temuco, the regional capital of Araucania, has a population of about 300,000 people, making it one of the medium-sized southern cities, following the 2017 census. This research was carried out in Cautin Park, which has a total size of 27.7 hectares and is the largest urban park in Temuco and the region of Araucania.The Park was created between 2015 and 2016 as part of Chile’s Green Area Plan, which aims to improve residents’ quality of life by improving the quality of public spaces in terms of their ecological, cultural, and social aspects. This urban park attracts individuals of all ages from all across the city, who come here to enjoy some of their free time. According to Paydar et al., [
37], Temuco lacks sufficient parks and plazas, and this urban park, which opened in 2022, was built to meet that demand. This park is located near the city’s historic zone and is designed as a ring of six thematic squares united by a central esplanade with views of nearby natural monuments such as Ñielol Hill.
Figure 1 shows an aerial photo of this park and some pictures from its different areas.
3.2. The Quantitative Approach
All of the park’s routes are included in this study, except those that are too short (less than 3 m). A pathway segment serves as the unit of analysis and is defined as a single pathway that begins at one intersection and ends at another intersection without passing through another intersection. To focus just on the pathways that people accidentally chose, the path segments connected to the entrances were deleted. In total, 39 pathway segments were recognized in Cautin Park. The gate method was used during our on-site observation to collect the walking behavior data [
38]. During the observations, the researcher stopped in the middle of a pathway section and counted how many park visitors passed an imaginary line at the researcher’s position, which was perpendicular to the walkway’s direction [
39]. We carried out the on-site inspections in November and December 2022. Four randomly chosen weekdays and two weekend days were chosen each week for observations. We conducted 30 rounds of observations. As a result, each pathway section was observed 30 times for a total of two minutes each time.
All spatial and visual/physical characteristics that influence a park setting are referred to in this study as park design characteristics. The physical and aesthetic characteristics were chosen based on the research review. The majority of the information on pathway design attributes was gathered from on-site observations. The procedure for measuring pathway characteristics was created based on current park environment measurement tools [
40,
41,
42]. Each section of the pathway was traversed by the observer, who noted its characteristics. Each section of the pathway was observed twice. AutoCAD was used to calculate the length of the pathways. The level of cleanliness along the pathways, the type of pavement material, the quality of the pavement in terms of maintenance, the presence of stairs or slopes along the park pathways, the presence of obstacle(s) along the pathways, and the amount of graffiti did not demonstrate variability along the various pathways of Cautin Park during the final process of choosing design features. Since variability is a requirement for the selection of the variables in our statistical models, these variables were not subjected to further statistical analysis. The remaining 12 design elements (variables) that demonstrated variation along the trails in Cautin Park were included in the statistical analysis.
Table 1 displays these pathway design attributes together with their categories and measurements.
3.3. The Qualitative Approach
Regarding the study’s qualitative methodology, we conducted 60 face-to-face interviews with respondents inside Cautin Park to inquire about their favorite and least favorite aspects of pathway design for walking. The primary criterion used to pick interviewees was that they should regularly go for strolls in parks so they could respond to questions based on actual experiences. Five questions were asked during the interview: (1) Would you mind showing me where you typically walk? (2) What features of these pathways do you find appealing? (3) Which park trails do you avoid using for walking? (4) Why? (5) Could you please let me know how old you are? Participants were given colored maps that were enriched with images taken along various park pathways to assist them in deciding which park places and pathways they preferred and disliked. Each interview lasted between 10 and 15 min, and the data were entered using a data entry form.
3.4. Analysis
The average number of seniors observed along pathways with varied features was compared using ANOVA to examine for differences in categorical pathway design characteristic factors. Correlation studies were conducted to look into the links between the typical number of observed pedestrians and the continuous pathway design characteristic variable (pathway length). The data from the interviews were then investigated through content analysis. For this, the factors were classified based on the respondents’ answers to two subsequent interview questions regarding two main categories of liked and disliked factors of walking paths. Then, the number of repetitions of each factor and its frequency regarding each category were calculated [
19]. We can more credibly comprehend the relationships between characteristics of pathway design and the tendency to walk, as well as walking behavior, by comparing the results of statistical and content analysis.
4. Results
4.1. Descriptive Statistics
A total of 7018 people were seen walking within Cautin Park as a whole. The usage of each pathway segment was represented at the level of the individual pathway segment by calculating the average number of pedestrians observed across all observations for each segment (30 rounds of observations for each segment) (
Figure 2). The average of the maximum number of users on a pathway segment that was recorded (for two minutes) was 5.82 pedestrians.
In terms of the physical and aesthetic design elements along the routes (
Table 2), paved pathways make up most of them (69.2%), while unpaved (sand-covered) walkways make up 30.8%. More people use the curved shape (66.7%) than the straight form (33.3%). The majority of the walkways (51.3%) contain 4–7 benches. In terms of seeing flowers (48.7%) versus not seeing flowers (41.3%), the pathways are nearly similar, and 64.1% of the paths have less than 30% shade. Compared to the percentage of paths without light fixtures (41%), the percentage of pathways with light fixtures is higher (59%). The majority of pathways in terms of width are those that are wider than 5 m (33.3%). The average length of the pathways is 91.77 m, which shows that pedestrians face rather long pathways to walk in this urban park. The majority of pathways (61.5%) exhibit modest lateral visibility in terms of enclosure, as opposed to “no lateral visibility” (12.8%) and “continuous lateral visibility” (25.6%). This demonstrates that “tall objects on one side” (46.2%) and “tall objects on both sides” (41%) are both responsible for the medium degree of enclosure that is seen along the majority of pathways. Along the majority of the walkways (66.6%), monuments such as specific canopy structures in the parks can also be seen. Additionally, when it comes to access to activity zones, pathways that do not connect to any activity zones account for 48.7% of all paths, as opposed to pathways that connect to one or more activity zones (51.3%).
4.2. The Relationships between Walking Behavior and Features of Park Walkway Designs
The results demonstrate that on pathways with specific design elements, the average number of observed pedestrians is consistently higher. These design elements of the pathway include the pavement and the width. More specifically, the findings show that, in comparison to unpaved routes, pedestrians considerably prefer to stroll on paved pathways (
p = 0.000) (
Table 3). Furthermore, compared to routes less than 2 m long, pedestrians go along all types of pathways covering more than 2 m much more often (except the pathways between 2 and 3 m) (
Table 4). Other physical or visual characteristics along the pathways do not significantly correlate with the number of pedestrians. Additionally, the conclusion of the correlational analysis (coefficient: 0.004; P: 0.983) demonstrates that there is no correlation between the number of pedestrians and pathway length.
The results of the qualitative approach added valuable insights to the findings of the quantitative approach. In total, 30 male (50%) and 30 female (50%) respondents made up the sample. The presence of more trees (50%), more green spaces and vegetation (43.3%), shade (31.6%), pathways with hard pavement (as opposed to unpaved pathways) (28.3%), connection to program and activity zones (28.3%), quiet along the pathways, particularly in terms of the number of people (16.6%), and the presence of benches along the walkways (10%) all showed importance for pedestrians walking, respectively.
Wider pathways (8.3%), pet-friendly pathway environments (8.3%), better connectivity to other park areas (the pathways that provide better connectivity) (6.6%), increased security along the pathways (5%), and lack of aesthetic appeal (5%) also demonstrated relative significance for pedestrians walking in each case. Additionally, locations that serve as historical reminders (such as the memorial location and its unique architecture) demonstrated perplexing results in terms of their walkability. Some people expressed their propensity to stroll there (3.3%), while others mentioned avoiding walking there since it brought back terrible memories, especially for young people (5%).
5. Discussion of the Relationships between Design Elements and Walking Propensity as Well as Walking Behavior
This study discovered the contributions of several design elements to walking behavior. The pathways with pavement contribute to improved walking behavior significantly as compared to unpaved pathways. Additionally, walkways that are broader than 2 m considerably improve pedestrian walking habits. According to the results of the interviews, narrow pathways contribute to less comfortable and less expedited walking movement. Earlier research [
24,
25] to promote walking behavior in urban parks lends credence to these findings. The unpaved, narrow pathway is a typical element of design found in Chilean urban parks. These pavements are not consistent with an improvement in walking behavior in urban parks, according to this study’s findings. Urban planners should take this into account when constructing new parks in this region.
More trees, greenery, and open spaces are key additional elements that enhance walking. Previous studies [
16,
17,
25] regularly stated these elements’ importance to enhance walking both at the neighborhood scale and in the urban park setting as well. The Native Forest section of this park is one of the best areas for strolling. The unpaved narrow paths in this area, however, can hinder the improvement of walking habits. As a result, while planning areas with lots of trees and greenery, it is important to consider how to make the pavement wider to make walking more appealing. Another alternative that is compatible with the region’s rainy environment is to use walking-friendly pavement types like permeable pavement in these places.
The availability of shade is yet another crucial element to enhance walking. Numerous research [
25,
27] that found the value of shade to enhance walking behavior confirms this. Another crucial element to enhance walking behavior is the presence of additional benches. The earlier research on improving walking behavior at the neighborhood scale and in urban park settings also supports this [
27].
The next crucial element for enhancing visitors’ propensity to walk in this urban park is the “connection to program and activity zones”. This is also corroborated by other research [
25,
36], which revealed that access to activity zones helped to enhance park visitors’ walking habits. In this sense, designing various activities, such as those seen in various areas of Cautin Park, could help to increase people’s propensity to walk. Temporal events like temporary commercial fairs are also effective in enhancing park visitors’ walking habits. In this light, creating spaces that incorporate these temporal activities is crucial to the process of creating urban parks. Another important feature that increases the appeal of walking is better connectivity with various park areas (the pathways that allow for better connectivity between various park areas). The design of the primary activities in various areas of the park should be such that these activities are located close to the main pathway network of the urban park, taking into account and comparing this factor with more access to activity zones to improve the attractiveness for walking.
Another crucial factor to increase the appeal of walking in this urban park is “tranquility along the pathways, especially in terms of people’s number”. Additionally, a significant element that lessens the appeal of walking through Cautin Park’s walkways is a sense of insecurity. This factor is one of the key ones that have a detrimental impact on how pedestrians travel in cities [
43]. However, its importance in improving walking behavior has been rarely explored in the urban park setting. One of the characteristics that this research also identified as helping to lessen feelings of insecurity is the presence of other individuals [
44]. The presence of others, which acts as a form of passive surveillance throughout the paths, helps to lessen feelings of insecurity [
45]. More tranquility is also related to less presence of others as well. The presence of people improves walking behavior up until the point where it contributes to the creation of dense environments, at which point it becomes a barrier to walking in urban parks. This is implied when considering and comparing tranquility with security as two relevant factors to increase the attractiveness of walking in Cautin Park. As was already said, wider pathways may contribute to maintaining situations where there is a manageable density for people to walk. Additionally, more trees are preferable for walking, but due to the significance of a sense of security, these trees should be created in a way that lessens that feeling. For instance, the placement of the trees must avoid creating any hidden places along the pathways in urban parks.
Additionally, “more comfortable pathway environments for pets” was identified as one of the important elements that can improve walkability. It has attributes like “more green spaces for pets to play in”, “fewer people for more comfortable walking with pets”, and “clear path to guide pets”. Walking with pets is also made more comfortable by wider walkways. Instead of urban park surroundings, walking with dogs has primarily been researched in urban settings (neighborhood scale) [
46,
47,
48,
49,
50]. According to McCormack et al. [
51], the likelihood of walking with dogs in an urban setting was favorably correlated with walkability and aesthetics. The local scale of dog walking is supported by a higher population density, more connected and integrated street layouts, and improved accessibility to sidewalks and destinations [
46,
52]. The presence of parks is linked to neighborhood dog-walking practices [
53,
54]. A better knowledge of the design elements that contribute to walking behavior with dogs in urban park environments is vital to improve walking behavior since significant numbers of people often walk with their dogs in urban parks in this context. In the future, this could be one of the important research areas that help to enhance walking habits and overall public health.
6. Conclusions
Urban parks’ walkway designs play a crucial role in promoting leisurely walking and sustaining the recommended level of physical activity. The largest urban park in Chile’s Araucania Region, Cautin Park, has unique physical and visual design elements. This study looked at these features concerning walking behavior and the tendency to walk.
Numerous design elements were discovered to be connected to walking propensity and habits in this urban park. Compared to unpaved pathways, there is a large increase in the number of people walking on paved routes. As opposed to routes under 2 m, those beyond 2 m are likewise favored for walking. This demonstrates that, in this context, the enhancement of walking behavior in the urban park setting is not consistent with the unpaved, narrow pathways that are frequently seen in many urban parks.
More (dense) trees, more green spaces and vegetation, connections to programs and activity zones, tranquility along the pathways, more shade along the pathways, pathways that provide better connectivity between different parts of the park, and the presence of benches along the pathways of urban parks were all found to contribute to the tendency for walking. These results were reviewed and their implications were discussed as well. In this setting, urban planners and designers could use these insights to create new urban parks.
One of the implications of these findings is that since activities further from the main pathway network have a lower tendency to encourage walking, the various components of the parks should be structured to integrate with the main pathway network in the urban park pathway. Another implication is that to lessen feelings of fear, pedestrian traffic should always flow naturally along the pathways in urban parks. At the same time, the high density of pedestrians makes walking less appealing. Therefore, the flow of pedestrians must be managed to prevent overcrowding of the routes.
A further intriguing conclusion of this study is the correlation between the appeal for walking and pet-friendly pathway conditions. Given how common it is for individuals to stroll alongside their dogs along urban park pathways, it is crucial to investigate the factors that encourage increased strolling among this population. Future research should investigate this more to improve walking behavior in urban parks.
This study’s advantages include conducting both interviews and observations. The credibility of our findings was significantly increased by combining the outcomes from these two approaches. However, there are certain limitations to this study as well. First of all, because the data are cross-sectional, causal inferences cannot be made from them. Second, the data were gathered in the final weeks of spring and early summer. The findings’ applicability to other seasons is thus constrained.
Author Contributions
Conceptualization, A.K.F. and M.P.; methodology, A.K.F. and M.P.; software, M.P.; validation, M.P.; formal analysis, M.P.; investigation, A.K.F. and M.P.; resources, M.P.; data curation, M.P., A.K.F. and V.G.N.; writing—original draft preparation, A.K.F. and M.P.; writing—review and editing, M.P. and A.K.F.; visualization, M.P.; supervision, M.P.; project administration, A.K.F.; funding acquisition, M.P. and A.K.F. All authors have read and agreed to the published version of the manuscript.
Funding
The APC of this research was funded by the ANID + InES Género+ INGE210029.
Institutional Review Board Statement
Not applicable.
Informed Consent Statement
Not applicable.
Data Availability Statement
Not applicable.
Acknowledgments
We are grateful for the support from the School of Architecture, Temuco, Universidad Mayor.
Conflicts of Interest
The authors declare no conflict of interest.
References
- Tello, A.J.; Toffoletto, M.C. Factores asociados al sedentarismo e inactividad física en Chile: Una revisión sistemática cualitativa. Rev. Médica De Chile 2020, 148, 233–241. [Google Scholar] [CrossRef] [PubMed]
- Departamento de Epidemiología MINSAL. Santiago, Chile: 2017. Encuesta Nacional de Salud (ENS) 2016–2017. Available online: http://epi.minsal.cl/encuesta-ens/ (accessed on 29 August 2018).
- JUNAEB Evolución Nutricional—Mapa Nutricional—JUNAEB 2018. 2018. Available online: https://www.junaeb.cl/mapa-nutricional (accessed on 18 November 2019).
- IHME. Seattle, WA, USA: 2017. Chile Profile. Available online: http://www.healthdata.org/chile (accessed on 26 March 2018).
- Pasco, J.A.; Williams, L.J.; Jacka, F.N.; Henry, M.J.; Coulson, C.E.; Brennan, S.L.; Leslie, E.; Nicholson, G.C.; Kotowicz, M.A.; Berk, M. Habitual physical activity and the risk for depressive and anxiety disorders among older men and women. Int. Psychogeriatr. 2011, 23, 292–298. [Google Scholar] [CrossRef]
- Paydar, M.; Kamani Fard, A. The Contribution of Socio-Demographic Factors to Walking Behavior Considering Destination Types; Case Study: Temuco, Chile. Soc. Sci. 2021, 10, 479. [Google Scholar] [CrossRef]
- Paul, P.; Carlson, S.A.; Carroll, D.D.; Berrigan, D.; Fulton, J.E. Walking for Transportation and Leisure Among U.S. Adults—National Health Interview Survey 2010. J. Phys. Act. Health 2015, 12 (Suppl. S1), S62–S69. [Google Scholar] [CrossRef] [PubMed]
- Krogstad, J.R.; Hjorthol, R.; Tennøy, A. Improving walking conditions for older adults. A three-step method investigation. Eur. J. Ageing 2015, 12, 249–260. [Google Scholar] [CrossRef]
- Paydar, M.; Kamani Fard, A.; Khaghani, M.M. Walking toward Metro Stations: The Contribution of Distance, Attitudes, and Perceived Built Environment. Sustainability 2020, 12, 10291. [Google Scholar] [CrossRef]
- Gómez, L.F.; Parra, D.C.; Buchner, D.; Brownson, R.C.; Sarmiento, O.L.; Pinzón, J.D.; Ardila, M.; Moreno, J.; Serrato, M.; Lobelo, F. Built environment attributes and walking patterns among the elderly population in Bogotá. Am. J. Prev. Med. 2010, 38, 592–599. [Google Scholar] [CrossRef]
- Paydar, M.; Kamani Fard, A. The Hierarchy of Walking Needs and the COVID-19 Pandemic. Int. J. Environ. Res. Public Health 2021, 18, 7461. [Google Scholar] [CrossRef]
- Ding, D.; Sallis, J.F.; Kerr, J.; Lee, S.; Rosenberg, D.E. Neighborhoodenvironment and physical activity among youth: A review. Am. J. Prev. Med. 2011, 41, 442–455. [Google Scholar] [CrossRef]
- Handy, S.L. Urban form and pedestrian choices: Study of Austin neighborhoods Transportation Research Record. J. Trans. Res. Board 1996, 1552, 135–144. [Google Scholar] [CrossRef]
- Borst, H.; Miedema, H.; De Vries, S.; Graham, J.; Dongen, J. Relationships between street characteristics and perceived attractiveness for walking reported by elderly people. J. Environ. Psychol. 2008, 28, 353–361. [Google Scholar] [CrossRef]
- Oliver, L.; Schuurman, N.; Hall, A.W.; Hayes, M.V. Assessing the influence of the built environment on physical activity for utility and recreation in suburban metro Vancouver. BMC Public Health 2011, 11, 959. [Google Scholar] [CrossRef] [PubMed]
- Nehme, E.; Oluyomi, A.O.; Calise, T.V.; Kohl, H.W. Environmental Correlates of Recreational Walking in the Neighborhood. Am. J. Health Promot. 2016, 30, 139–148. [Google Scholar] [CrossRef] [PubMed]
- Chan, E.T.H.; Schwanen, T.; Banister, D. The role of perceived environment, neighbourhood characteristics, and attitudes in walking behaviour: Evidence from a rapidly developing city in China. Transportation 2021, 48, 431–454. [Google Scholar] [CrossRef]
- Cerin, E.; Sit, C.H.P.; Barnett, A.; Cheung, M.-C.; Chan, W.-M. Walking for Recreation and Perceptions of the Neighborhood Environment in Older Chinese Urban Dwellers. J. Urban Health 2012, 90, 56–66. [Google Scholar] [CrossRef]
- Jia, Y.; Usagawa, T.; Fu, H. The Association between Walking and Perceived Environment in Chinese Community Residents: A Cross-Sectional Study. PLoS ONE 2014, 9, e90078. [Google Scholar] [CrossRef]
- Yun, H.Y. Environmental Factors Associated with Older Adult’s Walking Behaviors: A Systematic Review of Quantitative Studies. Sustainability 2019, 11, 3253. [Google Scholar] [CrossRef]
- Day, K. Built environmental correlates of physical activity in China: A review. Prev. Med. Rep. 2016, 3, 303–316. [Google Scholar] [CrossRef]
- Deka, D.; Brown, C.T.; Sinclair, J. Exploration of the effect of violent crime on recreational and transportation walking by path and structural equation models. Health Place 2018, 52, 34–45. [Google Scholar] [CrossRef]
- Paydar, M.; Kamani Fard, A. Walking Behavior of Older Adults in Temuco, Chile: The Contribution of the Built Environment and Socio-Demographic Factors. Int. J. Environ. Res. Public Health 2022, 19, 14625. [Google Scholar] [CrossRef]
- Kaczynski, A.T.; Potwarka, L.R.; Saelens, B.E. Association of park size, distance, and features with physical activity in neighborhood parks. Am. J. Public Health 2008, 98, 1451–1456. [Google Scholar] [CrossRef] [PubMed]
- Zhai, Y.; Baran, P.K. Urban Park Pathway Design Characteristics and Senior Walking Behavior. Urban For. Urban Green. 2017, 21, 60–73. [Google Scholar] [CrossRef]
- Cohen, D.A.; McKenzie, T.L.; Sehgal, A.; Williamson, S.; Golinelli, D.; Lurie, N. Contribution of public parks to physical activity. Am. J. Public Health 2007, 97, 509–514. [Google Scholar] [CrossRef]
- Lu, Z.P. Investigating walking environments in and around assisted Living facilities: A facility visit study. Herd—Health Environm. Res. Des. J. 2010, 3, 58–73. [Google Scholar] [CrossRef]
- Misgav, A. Visual preference of the public for vegetation groups in Israel. Landsc. Urban Plan. 2000, 48, 143–159. [Google Scholar] [CrossRef]
- Southworth, M. Designing the Walkable City. J. Urban Plan. Dev. 2005, 131, 246–257. [Google Scholar] [CrossRef]
- Lynch, K. The Image of City; MIT Press: Cambridge, UK, 1960. [Google Scholar]
- Paydar, M.; Kamani Fard, A. Perceived legibility in relation to path choice of commuters in central business district. Urban Des. Int. 2016, 21, 213–235. [Google Scholar] [CrossRef]
- Paydar, M.; Fard, A.K.; Khaghani, M. Pedestrian Walkways for Health in Shiraz, Iran, the Contribution of Attitudes, and Perceived Environmental Attributes. Sustainability 2020, 12, 7263. [Google Scholar] [CrossRef]
- Thwaites, K.; Simkins, I. Experiential Landscape: An Approach to People, Place and Space; Routledge: Abingdon, UK; New York, NY, USA, 2007. [Google Scholar] [CrossRef]
- Ulrich, R.S. Natural versus urban scenes—Somepsychophysiological effects. Environ. Behav. 1981, 13, 523–556. [Google Scholar] [CrossRef]
- Isaacs, R. The Urban Picturesque: An Aesthetic Experience of Urban Pedestrian Places. J. Urban Des. 2000, 5, 145–180. [Google Scholar] [CrossRef]
- Gauvin, L.; Riva, M.; Barnett, T.; Richard, L.; Craig, C.L.; Spivock, M.L. Association between neighborhood active living potential and walking. Am. J. Epidemiol. 2008, 167, 944–953. [Google Scholar] [CrossRef] [PubMed]
- Paydar, M.; Javier, A.C.; Asal, K.F. Walking Behavior in Temuco, Chile: The Contribution of Built Environment and Socio-Demographic Factors. Behav. Sci. 2022, 12, 133. [Google Scholar] [CrossRef] [PubMed]
- Chang, D. Spatial choice and preference in multilevel movement networks. Environ. Behav. 2002, 34, 582–615. [Google Scholar] [CrossRef]
- Foltête, J.-C.; Piombini, A. Urban layout, landscape features and pedestrian usage. Landsc. Urban Plan. 2007, 81, 225–234. [Google Scholar] [CrossRef]
- Bedimo-Rung, L.A.; Gustat, J.; Tompkins, J.B.; Rice, J.; Thomson, J. Development of a direct observation instrument to measure environmentalcharacteristics of parks for physical activity. J. Phys. Act. Health 2006, 3, S176–S189. [Google Scholar] [CrossRef]
- Kaczynski, A.T.; Stanis, S.A.W.; Besenyi, G.M. Development and testing of acommunity stakeholder park audit tool. Am. J. Prev. Med. 2012, 42, 242–249. [Google Scholar] [CrossRef]
- Saelens, E.B.; Frank, D.L.; Auffrey, C.; Whitaker, C.R.; Burdette, L.H.; Colabianchi, N. Measuring physical environments of parks and playgrounds: EAPRSinstrument development and inter-Rater reliability. J. Phys. Act. Health 2006, 3, S190–S207. [Google Scholar] [CrossRef]
- Baobeid, A.; Koç, M.; Al-Ghamdi, S.G. Walkability and Its Relationships with Health, Sustainability, and Livability: Elements of Physical Environment and Evaluation Frameworks. Front. Built Environ. 2021, 7, 721218. [Google Scholar] [CrossRef]
- Lizárraga, C.; Martín-Blanco, C.; Castillo-Pérez, I.; Chica-Olmo, J. Do University Students’ Security Perceptions Influence Their Walking Preferences and Their Walking Activity? A Case Study of Granada (Spain). Sustainability 2022, 14, 1880. [Google Scholar] [CrossRef]
- Paydar, M.; Kamani Fard, A. The Contribution of Mobile Apps to the Improvement of Walking/Cycling Behavior Considering the Impacts of COVID-19 Pandemic. Sustainability 2021, 13, 10580. [Google Scholar] [CrossRef]
- Koohsari, M.J.; Nakaya, T.; McCormack, G.R.; Shibata, A.; Ishii, K.; Yasunaga, A.; Liao, Y.; Oka, K. Dog-walking in dense compact areas: The role of neighbourhood built environment. Health Place 2020, 61, 102242. [Google Scholar] [CrossRef] [PubMed]
- Christian, H.; Bauman, A.; Epping, J.N.; Levine, G.N.; McCormack, G.; Rhodes, R.E.; Richards, E.; Rock, M.; Westgarth, C. Encouraging Dog Walking for Health Promotion and Disease Prevention. Am. J. Lifestyle Med. 2016, 12, 233–243. [Google Scholar] [CrossRef] [PubMed]
- Christian, H.E.; Westgarth, C.; Bauman, A.; Richards, E.A.; Rhodes, R.E.; Evenson, K.R.; Mayer, J.A.; Thorpe, R.J., Jr. Dog ownership and physical activity: A review of the evidence. J. Phys. Act. Health 2013, 10, 750–759. [Google Scholar] [CrossRef]
- Cutt, H.; Giles-Corti, B.; Knuiman, M. Encouraging physical activity through dog walking: Why don’t some owners walk with their dog? Prev. Med. 2008, 46, 120–126. [Google Scholar] [CrossRef] [PubMed]
- Westgarth, C.; Christley, R.M.; Christian, H.E. How might we increase physical activity through dog walking?: A comprehensive review of dog walking correlates. Int. J. Behav. Nutr. Phys. Act. 2014, 11, 83. [Google Scholar] [CrossRef]
- McCormack, G.R.; Graham, T.M.; Christian, H.; Toohey, A.M.; Rock, M.J. Supportive neighbourhood built characteristics and dog-walking in Canadian adults. Can. J. Public Health 2016, 107, e245–e250. [Google Scholar] [CrossRef]
- Engelberg, J.K.; Carlson, J.A.; Conway, T.L.; Cain, K.L.; Saelens, B.E.; Glanz, K.; Frank, L.D.; Sallis, J.F. Dog walking among adolescents: Correlates and contribution to physical activity. Prev. Med. 2016, 82, 65–72. [Google Scholar] [CrossRef]
- Christian, H.; Giles-Corti, B.; Knuiman, M. “I’m Just a’-Walking the Dog” correlates of regular dog walking. Fam. Community Health 2010, 33, 44–52. [Google Scholar] [CrossRef]
- McCormack, G.R.; Rock, M.; Sandalack, B.; Uribe, F.A. Access to off-leash parks, street pattern and dog walking among adults. Public Health 2011, 125, 540–546. [Google Scholar] [CrossRef]
| Disclaimer/Publisher’s Note: The statements, opinions and data contained in all publications are solely those of the individual author(s) and contributor(s) and not of MDPI and/or the editor(s). MDPI and/or the editor(s) disclaim responsibility for any injury to people or property resulting from any ideas, methods, instructions or products referred to in the content. |
© 2023 by the authors. Licensee MDPI, Basel, Switzerland. This article is an open access article distributed under the terms and conditions of the Creative Commons Attribution (CC BY) license (https://creativecommons.org/licenses/by/4.0/).


