Abstract
Based on the water quality monitoring results from 2002 to 2018 in the coastal waters of Shantou City, this study used eight methods, including the single-factor index method, eutrophication index method, nutrient status quality method, comprehensive index method, organic pollution index method, nitrogen–phosphorus ratio method, potential eutrophication evaluation, and dissolved oxygen saturation parameter method, to evaluate the eutrophication and organic pollution status of the area. The applicability of the first-generation eutrophication model was assessed from the perspective of red tide occurrence, and a comparison was made among the various evaluation methods. The results indicate that the coastal waters of the study area were mostly in a phosphorus-limited state, with a few periods of nutrient deficiency and a very small portion of time in a moderately nutritious state with both nitrogen and phosphorus limitations. The overall N/P ratio showed an increasing trend primarily due to the gradual increase in inorganic nitrogen content. In terms of evaluating eutrophication based on red tide symptoms, the comprehensive index method showed better performance in reflecting eutrophication conditions, while the eutrophication index method and dissolved oxygen saturation parameter method highlighted problematic areas but often exaggerated their extent. The nutrient status quality method and organic pollution index method did not provide distinctive indications and could not verify red tide symptoms. The nitrogen–phosphorus ratio method and potential eutrophication evaluation could reflect certain nutrient structures and eutrophication characteristics but also failed to verify red tide symptoms. Furthermore, this study found a certain correlation between the occurrence of red tide and the ratio of nitrate nitrogen to ammonia nitrogen, which consistently ranged from 1.15 to 1.94 during red tide events. Therefore, whether this ratio can serve as a characteristic value for red tide occurrence and be used for early warning and monitoring still requires further validation.
1. Introduction
In recent decades, the accelerated discharge of nutrients, particularly nitrogen and phosphorus, into coastal waters has led to the excessive enrichment of nutrients [1]. This has resulted in prominent issues, such as the eutrophication of seawater [2,3], making it one of the major marine problems faced by the world today [4,5]. Nitrogen and phosphorus are important nutrients in seawater [6,7] and serve as the material foundation for marine biological resources. They are also the primary factors leading to the problem of seawater eutrophication [8,9,10]. The main pathways for the input of nutrients into coastal waters include river runoff [11], submarine groundwater discharge [12], waste discharge [13,14], and atmospheric deposition [15]. According to statistics, the total nitrogen input from rivers in 2020 was 57.9 trillion tons [16], which has increased by 40% since 1961. The global phosphorus flux into the oceans has reached approximately 22 trillion tons per year [17]. These nutrients from different sources are expected to increase nutrient concentrations in coastal waters. The nutrient load and composition have also undergone significant changes in the past few decades [18]. From 1980 to 2015, global nitrogen and phosphorus loads increased by 40–45% [19], leading to an increased N:P ratio of coastal nutrients due to land-based nutrient inputs [20]. This may result in phosphorus limitation [21], but the increase in nitrogen content is considered to be the primary cause of eutrophication in most estuaries and coastal areas [22].
The concentration of nutrients in seawater is one of the key indicators of coastal eutrophication [23]. Understanding the eutrophication status plays a crucial role in controlling and managing coastal water eutrophication issues. Currently, there are various methods available for assessing the eutrophication status of seawater. However, there is a lack of universal evaluation standards and systems for eutrophication assessment. Eutrophication assessment mainly relies on first-generation methods, including the single-factor index method, comprehensive index method, potential eutrophication evaluation [24], etc. These methods assess the eutrophication status via model calculations, and many researchers have adopted such approaches. Previous studies have summarized and discussed the advantages and limitations of eutrophication assessment methods [23,25], but they did not specifically consider the evaluation methods based on eutrophication symptoms (such as red tide). In this study, eight first-generation eutrophication models will be evaluated based on monitoring data, and the suitability and future prospects of the models will be discussed from the perspective of red tide symptoms.
Shantou City is located in the eastern part of Guangdong Province at the junction of Fujian and Guangdong, southwest of the Taiwan Strait. The Tropic of Cancer passes through the northern region of the city, giving it a distinct monsoon climate. The area is mainly characterized by three rivers: Han River, Rong River, and Lian River. It is also one of the six major river mouth deltas in China, with a population of nearly tens of millions, and it is an open economic special zone. The coastal waters are formed by the convergence of several rivers flowing into the sea, and Nan’ao Island serves as a natural barrier on the northeast side of Shantou. This unique location creates a gentle water flow zone in the nearshore waters. The water sources include fresh water from the rivers, water from the Fujian–Zhejiang coast, water from the west branch of the Taiwan Warm Current, and water from the bottom layer of the South China Sea. These five different types of water systems converge, resulting in a rich nutrient environment and diverse marine species. The area is known for its developed fishing industry and aquaculture. However, in recent years, there has been a significant increase in nutrient input from rivers, leading to water pollution and impacting the ecological environment. Some rivers, such as the Rong River and Lian River, have become black and odorous water bodies, and the coastal waters have also suffered from varying degrees of pollution [26]. Therefore, it is crucial to investigate the pollution level, pollution factors, nutrient conditions, and structural characteristics in this area. Previous studies on the environment in Shantou mainly focused on heavy metals and their control [27,28,29], river eutrophication [30,31], and nutrient salts in the waters around Nan’ao Island [32,33]. However, there has not been a comprehensive survey and study on the nutrient salts in all coastal waters of Shantou. Based on monitoring and field measurement data, this study aims to assess the nutrient status in the coastal waters of Shantou. Rational opinions and suggestions will be provided based on the survey results, aiming to provide data and theoretical support for local fishery development, environmental protection, and ecological restoration.
2. Materials and Methods
2.1. Monitoring Stations
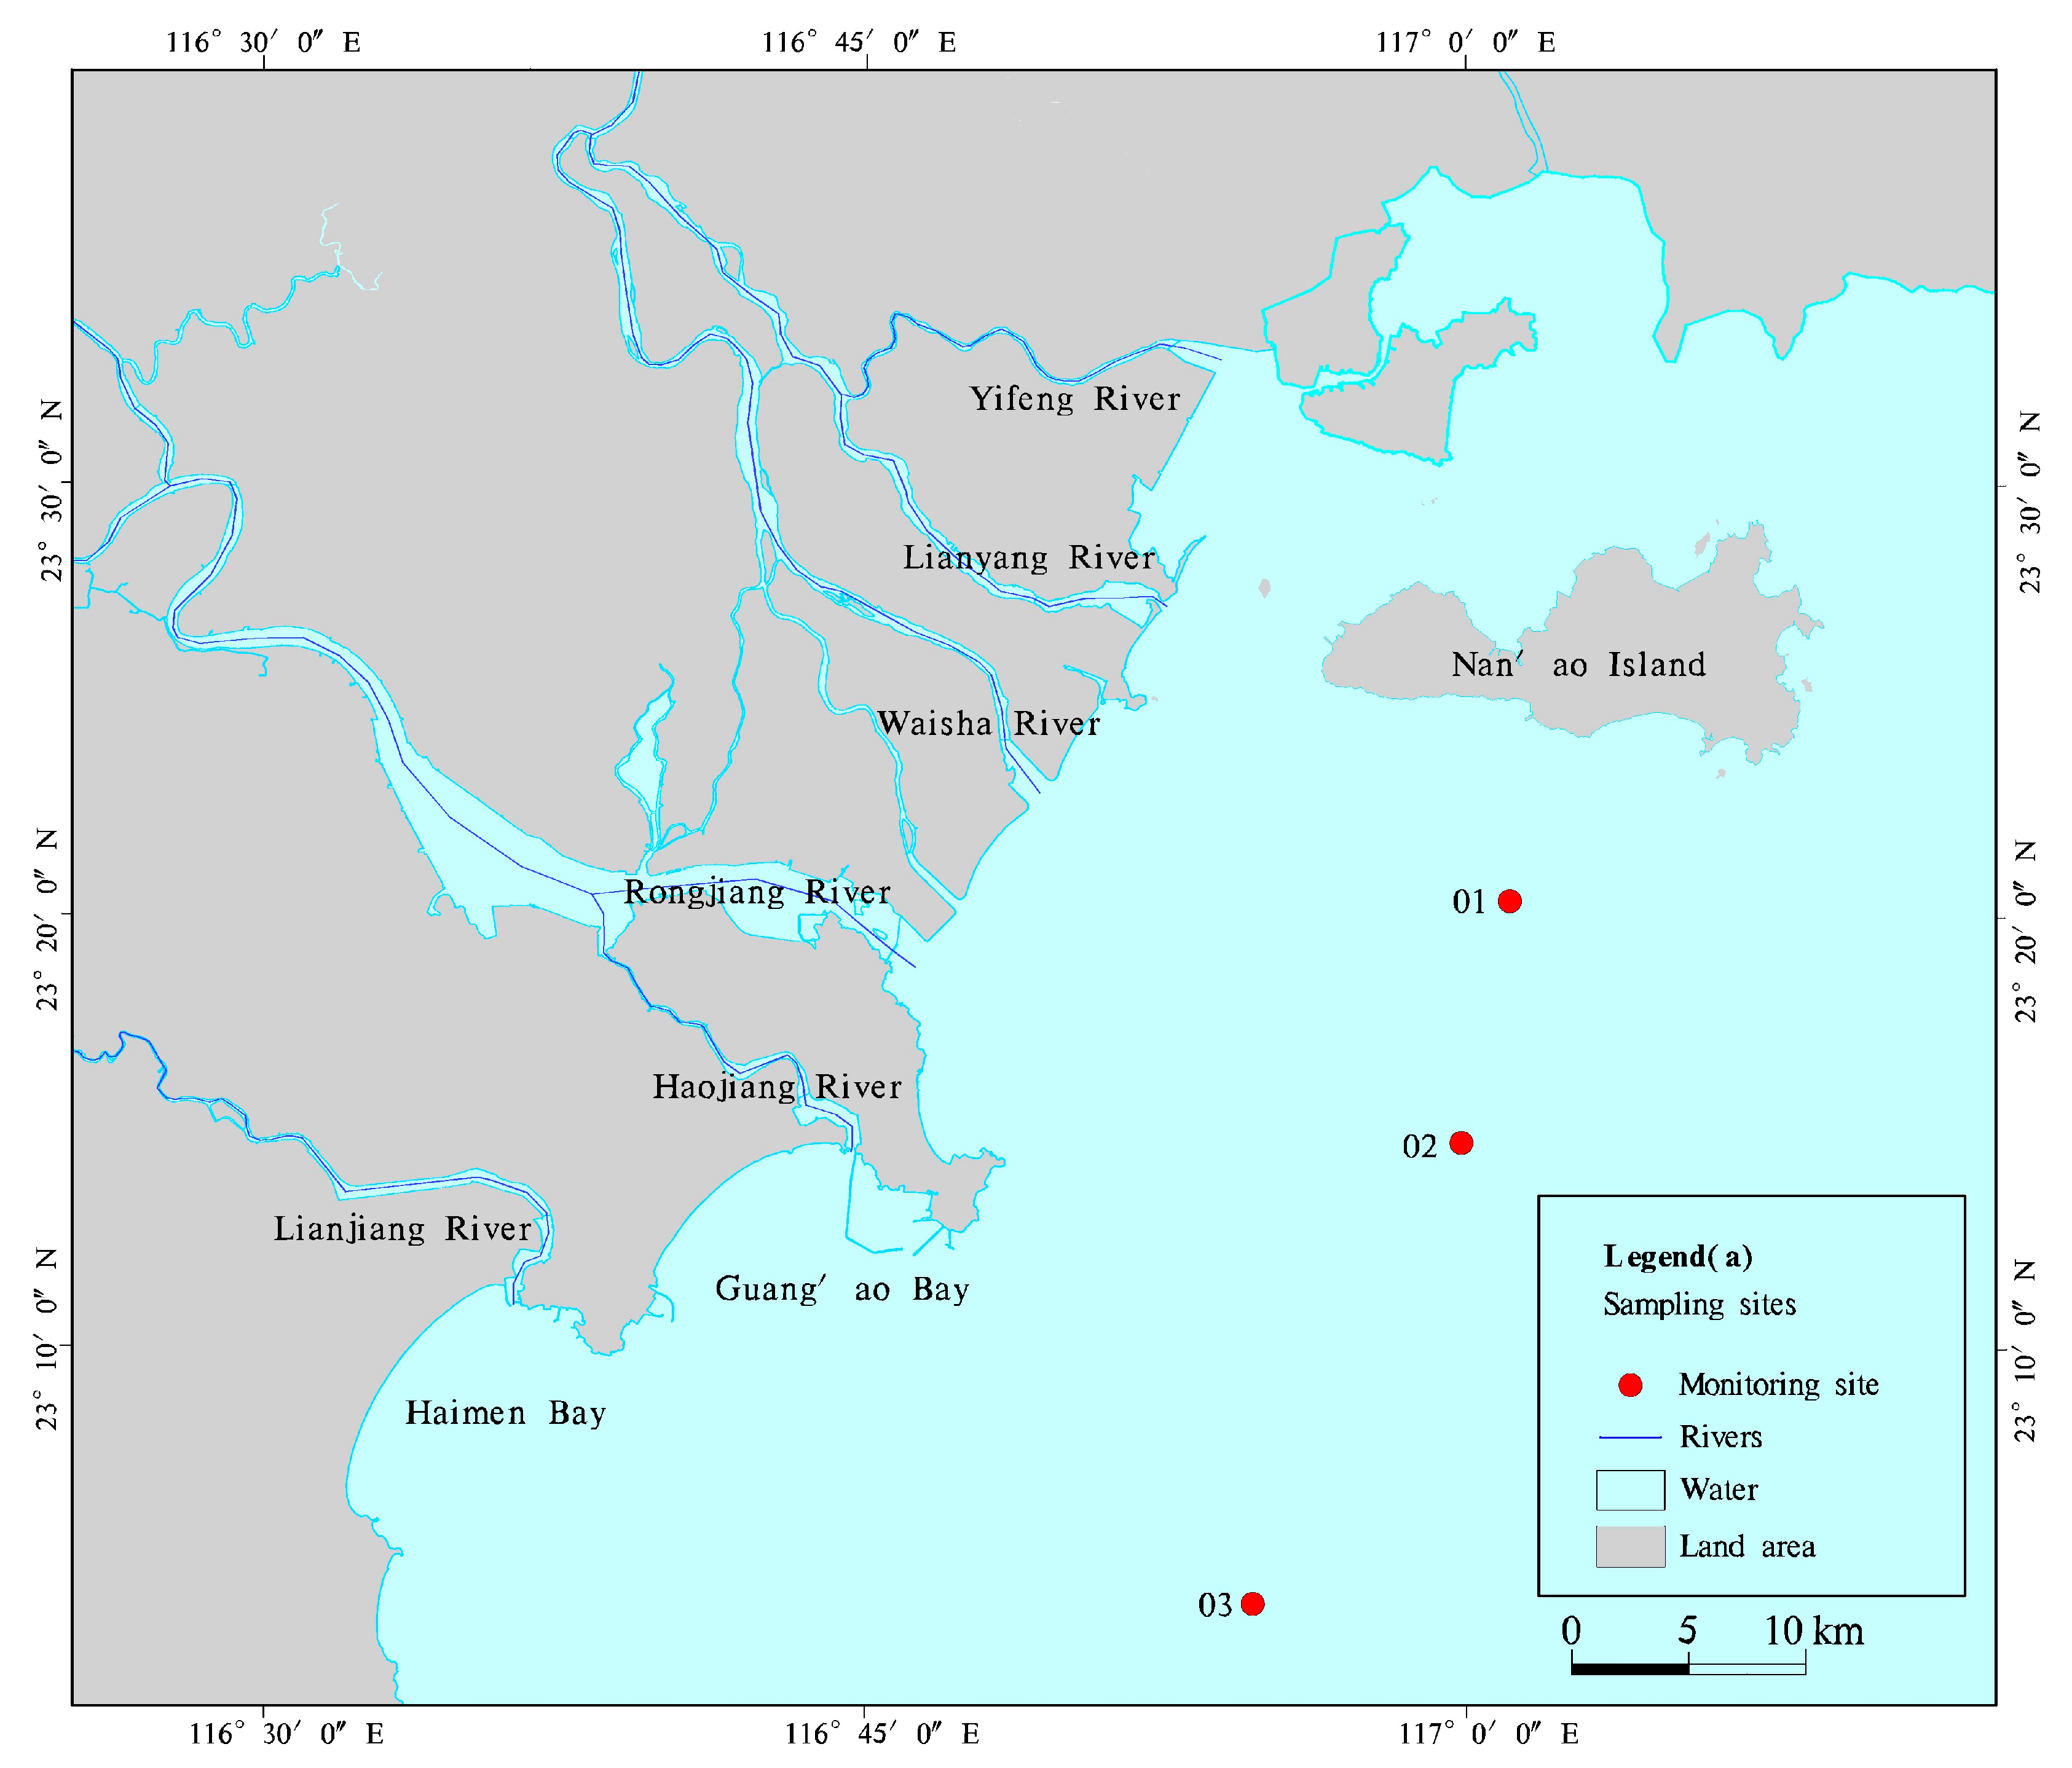
The data in this article were sourced from the South China Sea Information Center monitoring station. Monitoring was conducted at stations 01, 02, and 03 from 2002 to 2018. The main monitoring period was between 2 August and 13 September each year, which falls within the summer season. Sampling was carried out at both surface and bottom layers. At station 01, sampling depths were at 0.5 m and 17 m. At station 02, sampling depths were at 0.5 m and 23 m. At station 03, sampling depths were at 0.5 m and 30 m. Two parallel samples were taken at each layer. The monitoring and analysis indicators included pH, salinity, dissolved oxygen (DO), chemical oxygen demand (COD), reactive phosphate (PO4-P), ammonia nitrogen (NH4-N), nitrate nitrogen (NO3-N), nitrite nitrogen (NO2-N), and chlorophyll a (Chl-a), among others. Sample collection, storage, and transportation were conducted according to the specifications outlined in Part 3 of “Technical Standard for Marine Monitoring” (GB17378.3-2007) [34]. Sample analysis followed the standard methods for seawater analysis specified in Part 4 of “Technical Standard for Marine Monitoring” (GB 17378.4-2007) [34], which was issued by the Ministry of Ecology and Environment of the People’s Republic of China. The detection methods and detection limits are shown in Table 1. Inorganic nitrogen refers to the total content of ammonia nitrogen, nitrate nitrogen, and nitrite nitrogen. The monitoring stations are shown in Figure 1.

Table 1.
Detection methods and detection limits.
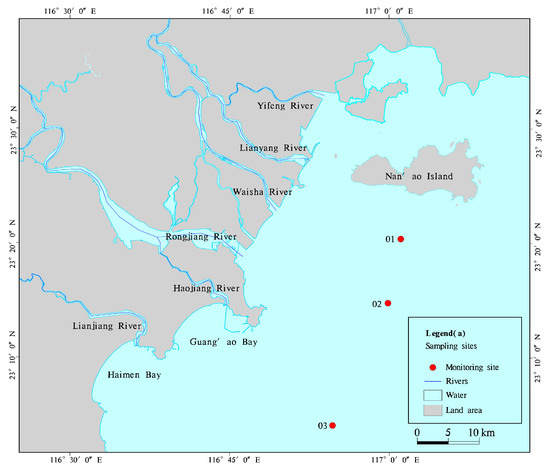
Figure 1.
Monitoring station schematic diagram.
2.2. Eutrophication Assessment Methods for Seawater
This article primarily employs first-generation eutrophication assessment methods, including the single-factor index method [35], eutrophication index method [36], nutrient status quality method [37], comprehensive index method [38], organic pollution index method [39], nitrogen–phosphorus ratio method, potential eutrophication assessment [40], dissolved oxygen saturation parameter method [41], and other methods that evaluate the eutrophication and organic pollution status of the water in this area. Different assessment methods were utilized to determine if the seawater in the region is eutrophic, and comparisons were carried out between these methods to explore their respective advantages, disadvantages, and accuracy:
- Single-factor index method: This method uses the standard index method to evaluate the equivalent impact of individual water quality factors on the environment. The factor pollution index of 1.0 serves as the basic threshold for determining whether the factor pollutes the environment. A value less than 0.5 indicates that the water area is not polluted by that factor, a value between 0.5 and 1.0 indicates pollution in the water area due to that factor, and a value greater than 1.0 indicates severe pollution in the water area due to that factor. The formula is as follows:
Pi = Ci/Ci0
In the equation, Pi represents the pollution index of the i-th pollutant, which is the single-factor pollution index. Ci represents the measured concentration of the i-th pollutant. C0i represents the evaluation standard for the i-th pollutant, with C0i being the Class II water quality standard in the “Water Quality Standards for Seawater” (GB 3097-1997) [42]. This article evaluates pH, dissolved oxygen (DO), chemical oxygen demand (COD), inorganic nitrogen (DIN), and dissolved inorganic phosphate (DIP). Since the content of dissolved inorganic phosphate is essentially the same as that of inorganic phosphate, DIP is used to represent dissolved inorganic phosphate throughout the following text. The evaluation parameters can be found in Table 2.
Table 2.
Seawater quality standards.
- 2.
- The eutrophication index method: The level of water eutrophication is determined based on the indicators specified in Table 3. The calculation formula for the eutrophication index (E) is as follows:
Table 3. Water quality eutrophication grade classification index.
In the equation, E represents the eutrophication index; COD is chemical oxygen demand, measured in mg/L; DIN is the mass concentration of inorganic nitrogen, measured in mg/L; DIP is the mass concentration of reactive phosphate, measured in mg/L. When E ≥ 1, it indicates eutrophication.
- 3.
- Nutritional status quality method: the calculation formula is as follows:
In the equation, NQI is calculated based on chemical oxygen demand (COD), dissolved inorganic nitrogen (DIN), dissolved inorganic phosphorus (DIP), and chlorophyll a (Chl-a). Subscript 0 represents the corresponding standard values, with Chl-a selected as 3 μg/L. When NQI is less than 2, it indicates oligotrophic conditions in seawater; when NQI is between 2 and 3, it indicates mesotrophic conditions; when NQI is equal to or greater than 3, it indicates eutrophic conditions. The nutrient quality index method is also one of the commonly used methods for eutrophication assessments in China.
- 4.
- Comprehensive index method: the calculation formula is as follows:
In the equation, PI represents the comprehensive water quality evaluation index, Pi represents the pollution index of the i-th pollutant, and N represents the number of water quality parameters involved in the evaluation. A larger value of PI indicates poorer water quality. If the comprehensive water quality evaluation index PI is greater than or equal to 1, it means that the water quality in the marine area does not meet the selected water quality standards. If PI is less than 1, it means that the water quality in the marine area meets the selected water quality standards.
- 5.
- Organic pollution index: We refer readers to the rating scale (Table 4). The calculation formula is as follows:
Table 4. Waterbody organic pollution evaluation grading table.
In the equation, A represents the organic pollution index of the water body. COD is the measured concentration of chemical oxygen demand in the water. DIN is the measured concentration of dissolved inorganic nitrogen in the water. DIP is the measured concentration of dissolved inorganic phosphates in the water. DO is the measured concentration of dissolved oxygen in the water. COD0, DIN0, DIP0, and DO0 are the evaluation standards for the respective indicators used in the water body.
- 6.
- Nitrogen–phosphorus ratio method: The nitrogen-to-phosphorus ratio method is based on the Redfield ratio, which represents the theoretical basis of marine phytoplankton’s absorption of nitrogen and phosphorus nutrients. When the nitrogen-to-phosphorus ratio (N/P) is less than 8, it indicates nitrogen limitation, while an N/P greater than 30 indicates phosphorus limitation. Based on the first-class seawater quality standards in China, upper or lower threshold values for dissolved inorganic nitrogen (DIN) and dissolved inorganic phosphorus (DIP) concentrations are determined for oligotrophic, mesotrophic, and eutrophic seawater. The nitrogen-to-phosphorus ratio method is commonly used to calculate potential eutrophication and reveals the limitations of nutrient enrichment. It is believed that only when the nitrogen-to-phosphorus ratio approaches the Redfield ratio can the contribution of potential nutrient reserves to eutrophication be released.
- 7.
- Potential eutrophication assessment: The nitrogen-to-phosphorus ratio (N/P) is a key indicator for assessing nutrient concentration structures in seawater. Redfield [43] discovered that the molar ratio of nitrogen to phosphorus in deep ocean layers is generally around 16:1, which is referred to as the Redfield ratio. This ratio is widely used to determine whether the growth of phytoplankton in a particular marine area is limited by phosphorus or nitrogen [44]. Bueler [45] conducted experiments and found that when N/P > 30, phytoplankton growth is limited by phosphorus, while N/P < 8 indicates that phytoplankton growth is limited by nitrogen. Phytoplankton typically uptakes nutrients based on the Redfield ratio, resulting in a relative surplus of phosphorus (in nitrogen-limited water bodies) or nitrogen (in phosphorus-limited water bodies). Guo Weidong et al. [40] proposed a potential eutrophication assessment model, known as the potential eutrophication assessment model (PEAM), which reflects nutrient limitation. This model primarily relies on the concentrations of dissolved inorganic nitrogen (DIN) and dissolved inorganic phosphate (DIP), along with the N/P value. It combines China’s seawater quality standards and results from biological cultivation experiments to categorize the eutrophication status into nine trophic levels. The classification criteria and principles for trophic levels can be seen in Table 5.
Table 5. Principles of trophic level classification.
- 8.
- Dissolved oxygen saturation parameter method: the calculation formula is as follows:
In the equation, DOs represents the surface-dissolved oxygen concentration in the target marine area, DOb represents the bottom-dissolved oxygen concentration in the target marine area, and DO′ represents the saturated dissolved oxygen concentration. When D < 0.2, it indicates that the seawater in the target marine area is oligotrophic (low nutrient). When 0.2 ≤ D < 0.4, it indicates a mesotrophic (moderate nutrient) condition. D ≥ 0.4 indicates eutrophication (high nutrient) in the target marine area.
Based on the detection data, this article calculates the eutrophication index using the aforementioned 8 eutrophication assessment methods. By referring to the classification criteria corresponding to the index, the eutrophication characteristics of the study area are explored. Via the collection of information on the occurrence time, location, and dominant algal species of red tides in the study area, a correlation analysis is conducted between the eutrophication characteristics reflected by the eutrophication index and the occurrence of red tides. The evaluation of the 8 first-generation eutrophication models is performed.
3. Results
3.1. Single-Factor Index Method
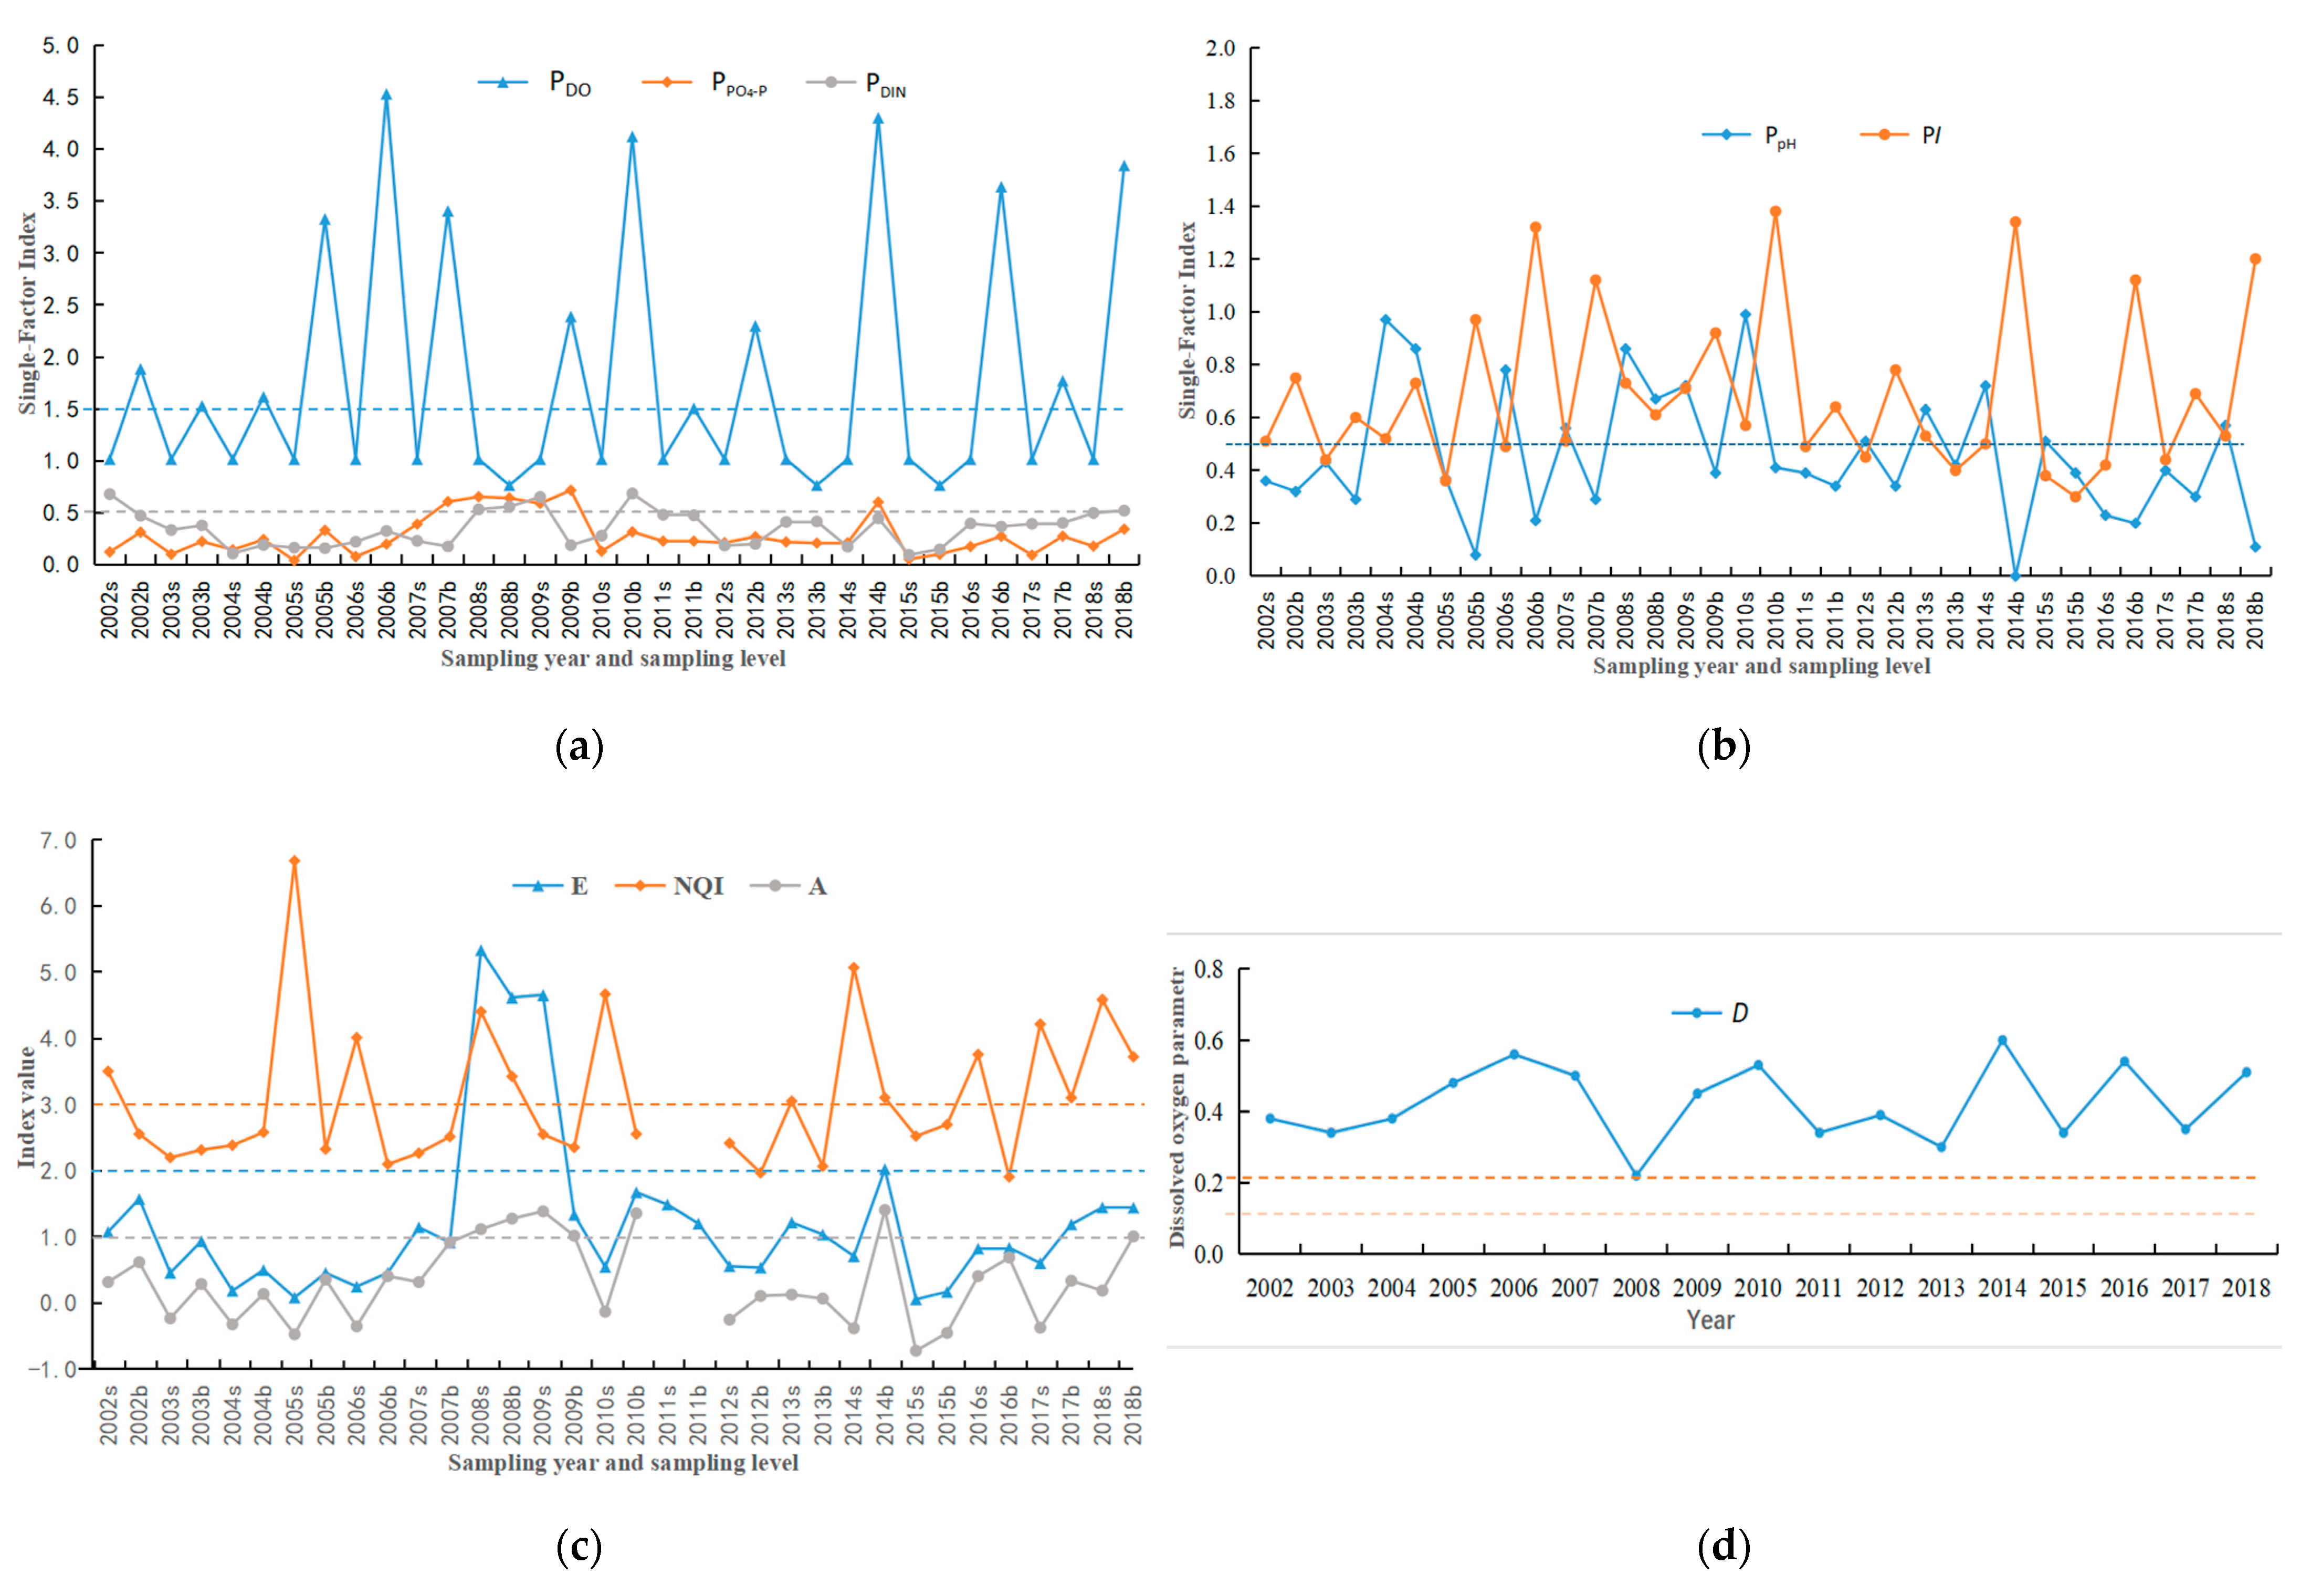
According to the single-factor index calculation formula, the single-factor indexes of pH, dissolved oxygen, phosphates, and inorganic nitrogen were obtained. The data can be observed in Table 5, and the trends of each index can be observed in Figure 2a,b.
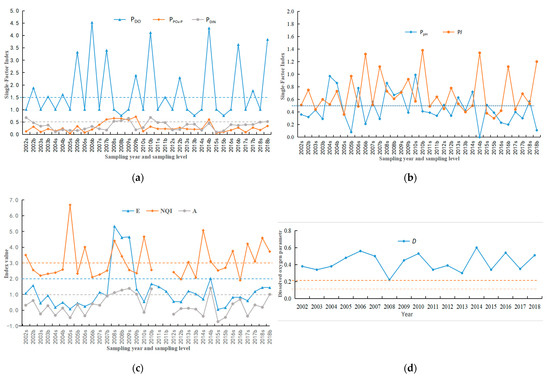
Figure 2.
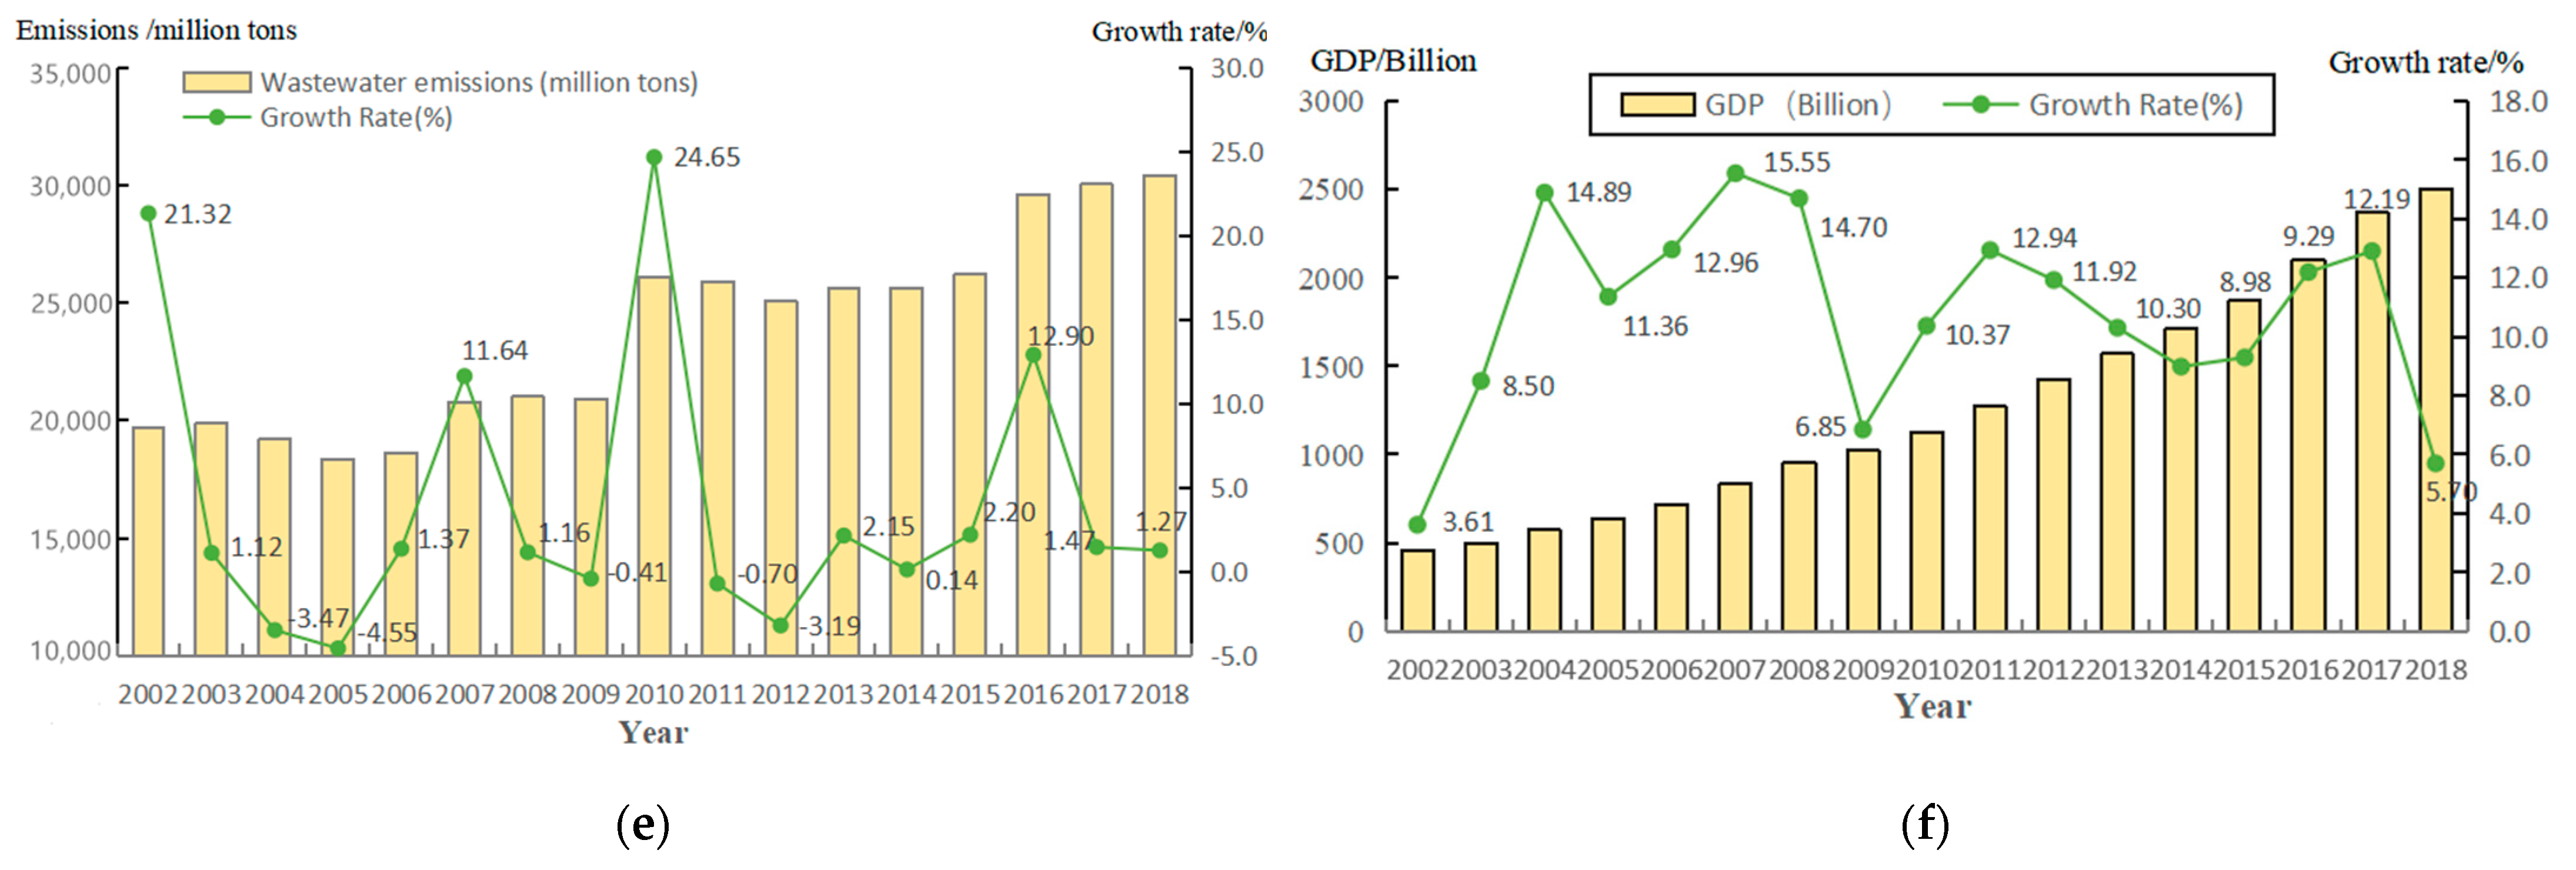
(a) Trend chart of the single-factor index from 2002 to 2018; (b) Trend chart of the single-factor index from 2002 to 2018; (c) Trend chart of E, NQI, and A indices from 2002 to 2018; (d) The trend chart of dissolved oxygen saturation parameters from 2002 to 2018 is shown; (e) Shantou wastewater discharge trend chart; (f) Shantou GDP growth trend chart. Note: s—surface water; b—bottom water.
- The pH index ranges from 0.08 to 0.99. Values between 0.5 and 1.0 indicate pollution caused by this factor in the water body. The years affected by pollution are 2004, 2006–2010, 2012–2015, and 2018. Pollution mainly occurred at the surface layer, while the bottom layer was contaminated in 2004 and 2008. This indicates that out of the 17 years of monitoring, this factor caused pollution in 11 years, with less impact on the bottom layer of water.
- The range of the PDO index is 0.08–4.54. The dissolved oxygen index in surface water was 1.06 in 2014, indicating severe pollution from this factor. In other years, the dissolved oxygen index in surface water was less than 1, with years between 0.5 and 1 being 2002, 2004, 2005, 2007, 2009, 2011, 2013, 2015, and 2016, indicating pollution from this factor in those years. The dissolved oxygen indices in the bottom water were lower than 1 only in 2008 and 2013, indicating pollution from this factor, while in other years, the dissolved oxygen indices in bottom water were greater than 1, indicating severe pollution from this factor in other years in the marine region.
- The PDIN index ranges from 0.09 to 0.68, with values between 0.5 and 1.0 indicating pollution by this factor in the water body. The polluted years include 2002 (surface), 2008 (surface and bottom layers), 2009 (surface), 2010 (bottom layer), and 2018 (surface and bottom layers). All other years are considered unpolluted.
- The range of the PDIP index is 0.04–0.71. The years 2007 (bottom), 2008 (surface and bottom), 2009 (surface and bottom), and 2014 (bottom) fall between 0.5 and 1, indicating pollution from this factor in those years. Compared with the seawater quality standard, the years of pollution indicated by the second-class seawater classification are consistent with the index method.
According to the trend, it can be observed that since 2005, the dissolved oxygen indices in bottom water have been relatively high. Among them, the 2008–2009 years had a special situation where the dissolved oxygen index was relatively low when both the inorganic nitrogen and active phosphate indexes were greater than 0.5. This indicates that when N and P concentrations increase simultaneously, the dissolved oxygen level remains relatively high. Active phosphate was relatively high from 2007 to 2009, while inorganic nitrogen has remained at a high level since 2007, which is directly related to wastewater discharge, indicating that the inorganic nitrogen content in wastewater has been gradually increasing since 2007 while active phosphate has maintained a relatively constant level.
3.2. Eutrophication Index Method
The eutrophication index (E) ranges from 0.06 to 5.33, where E ≥ 5 indicates severe eutrophication, which only occurred in surface water in 2008. When 2.0 ≤ E < 5.0, the index indicates moderate eutrophication, which was observed in deep-sea water in 2008, surface water in 2009, and deep-sea water in 2014. When 1.0 ≤ E < 2.0, the index indicates mild eutrophication, appearing in bottom water in 2002, surface water in 2007, bottom water in 2009, bottom water in 2010, bottom water in 2011/2013/2018, and bottom water in 2017. When E < 1, the index indicates oligotrophic conditions, occurring in bottom water from 2003 to 2006, bottom water in 2007, surface water in 2010, bottom water in 2012, surface water in 2014, bottom water from 2015 to 2016, and surface water in 2017; the variation trend is shown in Figure 2c.
3.3. Nutrient Quality Index Method
The nutrient quality index (NQI) ranges from 1.91 to 6.69, where NQI ≥ 3 indicates eutrophic conditions. It occurred in surface water in 2002, 2005, 2006, 2008 (bottom water), 2010, 2013, 2014 (bottom water), 2016, and 2017–2018 (bottom water). It can be observed that surface water has a higher proportion compared to bottom water. When 2 ≤ NQI < 3, the index indicates moderate nutrient conditions, which appeared in bottom water in 2002, surface water from 2003 to 2004, bottom water from 2005 to 2006, bottom water in 2007/2009, bottom water in 2010, surface water in 2012, bottom water in 2013, and surface water in 2015. When NQI < 2, the index indicates oligotrophic conditions and occurred in bottom water in 2012 and 2016; the variation trend is shown in Figure 2c.
3.4. Comprehensive Index Method
The comprehensive index (PI) ranges from 0.30 to 1.38. When PI ≥ 1, the index indicates that the water quality in the area does not meet the selected water quality standards. It occurred in bottom water in 2006, 2007, 2010, 2014, 2016, and 2018. During other times, when PI < 1, the index indicates that the water quality meets the standards; the variation trend is shown in Figure 2b.
3.5. Organic Pollution Index Method
The variation range of the organic pollution index (A) is −0.72 to 1.41. When 1 ≤ A < 2, the index indicates the beginning of pollution. It occurred in bottom water in 2008–2009, 2010, 2014, and 2018. During other times, A is less than 1, indicating relatively good to good water quality; the variation trend is shown in Figure 2c.
In the trend charts of the E, NQI, and A indices, it can be observed that NQI is more consistent with the trends of GDP growth and wastewater discharge. This indicates a good correlation between NQI and these two factors. Moreover, the NQI index shows a gradual increase, suggesting an increasing trend in eutrophication. The E and A indices exhibit consistency in the trend chart, indicating a similar trend and influencing factors. They also show an inverse relationship with the NQI index, suggesting a negative correlation between the E and A indices and the NQI index.
3.6. Nitrogen–Phosphorus Ratio Method and Eutrophication Evaluation
Based on the nitrogen–phosphorus ratio and potential eutrophication evaluation method, it can be observed that when N/P < 8, it indicates nitrogen limitation, which only occurred in bottom water in 2007 and 2009. When DIN is between 0.2 and 0.3 and N/P > 30, it indicates moderate phosphorus-limited nutrition, which only occurred in surface water in 2002 and bottom water in 2010. Poor nutrition occurred in bottom water in 2004, 2005, 2007, 2008, 2009, 2012, 2014, and 2016. In other years, it indicates phosphorus limitation. The N/P ratio and the classification of potential eutrophication can be found in Table 6.
Table 6.
N/P ratio and trophic level classification results.
3.7. Dissolved Oxygen Saturation Parameters Method
The variation range of the dissolved oxygen saturation parameter (D) is 0.22 to 0.60. There are no data with D < 0.2 in all years, indicating that the target offshore seawater is not nutrient-poor. When 0.2 ≤ D < 0.4, it represents a moderately nutritious state, mainly occurring in 2002–2004, 2008, 2011–2013, 2015, and 2017. When D ≥ 0.4, it represents a nutrient-rich state, occurring in 2005–2007, 2009–2010, 2014, 2016, and 2018. This indicates that the nearshore waters of Shantou are generally in a moderately nutritious to nutrient-rich state. The variation trend is shown in Figure 2d.
4. Discussion
From the perspective of symptoms caused by eutrophication, they mainly include high levels of phytoplankton biomass, excessive growth of macroalgae, formation of hypoxic and anoxic zones, the occurrence of toxic harmful algal blooms, and even the decline of submerged vegetation and fish mortality [46]. Among them, red tide is the most typical symptom resulting from eutrophication. As a typical eutrophication symptom, red tide can further trigger more ecological disasters caused by eutrophication. The decline and decomposition of red tide algae lead to a decrease in dissolved oxygen, which damages the growth of submerged plants. In certain cases, red tide becomes the dominant primary producer while large benthic plants disappear completely [47]. With the development of the economy and the intensification of human activities, nearshore red tide events are gradually increasing.
According to the severity and stages of eutrophication symptoms, they can be divided into primary effects and secondary effects. The primary effects mainly involve a decrease in water transparency caused by phytoplankton growth, while the secondary effects include the disappearance of submerged vegetation, algal blooms, and the formation of hypoxic zones. Therefore, analyzing the “symptoms” perspective is more helpful in understanding the expression of eutrophication resulting from the enrichment of nutrients in marine systems. This paper discusses eutrophication from the occurrence of red tide symptoms to verify the rationality of eutrophication assessment methods and to some extent reflects the characteristics of and changes in eutrophication in marine areas via the spatiotemporal variations of red tide.
4.1. Red Tide Occurrence in the Study Area
Between 2002 and 2018, a total of four red tide events occurred in the study area. The first event took place from 7 November to 19 November 2003 in the Chenghai–Haojiang area, which is characterized by the presence of “Scrippsiella trochoidea”. The second event occurred from 2 February to 5 March 2007 in the harbors near Shantou and the bays near Nan’ao Island, which are also dominated by “Scrippsiella trochoidea.” The third event occurred from 15 April to 18 April 2016 in the waters near Nan’ao Island in Shantou, with the main dominant species being Noctiluca scintillans. The fourth event took place from 7 August to 9 August 2018 in the offshore waters southeast of Haimen Bay in Shantou, with the dominant species being Prorocentrum danica and Gonyaulax polygramma.
In the four red tide incidents, the dominant species in the first two occurrences were spherical brown dinoflagellates, which are a widely distributed group of phytoplankton in the ocean and one of the main harmful algal species in China’s coastal waters in recent years. The nitrate content in the environment is an important stimulative factor for the formation of spherical brown dinoflagellate blooms, and the combined effect of various carbon enrichment mechanisms within the cells is a crucial condition for the outbreak of these blooms [48]. When nitrogen and phosphorus nutrients are abundant, spherical brown dinoflagellates cannot gain a competitive advantage. As the depletion of silicates reaches a low level, the abundance of cysts gradually increases, showing a negative correlation with silicate concentration [49]. Spherical brown dinoflagellates have a high demand for phosphate [50] and exhibit a higher growth rate under lower N/P ratios (5.9–19.6) [51]. Therefore, the contents of nitrate nitrogen, phosphate, organic carbon, silicate, and other nutrients are all related to the outbreak of spherical brown dinoflagellate blooms.
The causative organism for the third red tide incident is Noctiluca scintillans, which belongs to a completely anaerobic type of planktonic organism and cannot directly absorb nutrients. Therefore, the influence of nutrients on Noctiluca scintillans is manifested through indirect effects mainly by promoting the growth of other phytoplankton and thus accelerating the growth and reproduction of Noctiluca scintillans [52]. Nitrite and nitrate may regulate the metabolism and reproduction of Noctiluca scintillans and are negatively correlated with their abundance and sexual reproduction ratio [53]. In the absence of predation pressure, the eutrophication of the water (enriched with nutrients and trace elements) promotes the extensive reproduction of Noctiluca scintillans as prey organisms (mainly diatoms and dinoflagellates) [54].
The main causative organisms for the fourth red tide incident are Ceratium danicum and Gyrodinium instriatum, both of which are common dominant algae in the study area. Ceratium danicum is negatively correlated with active phosphates and positively correlated with pH, chlorophyll a, water color, and dissolved oxygen [55], indicating that Ceratium danicum starts to proliferate extensively in good light transmission and nutrient-rich conditions. At this time, the phosphate content is relatively high, consistent with the monitoring data. Gyrodinium instriatum is a warm-water species and a common planktonic diatom. It shows a significantly positive correlation with salinity, transparency, and chlorophyll a and a significantly negative correlation with temperature, chemical oxygen demand, pH, and petroleum hydrocarbons [56]. As Ceratium danicum and Gyrodinium instriatum simultaneously proliferate, pH increases when the light transmission is good, which inhibits the growth of Gyrodinium instriatum. The high chlorophyll a levels indicated by the monitoring data suggest that chlorophyll a has a greater influence on the growth of these algae.
4.2. Advantages and Disadvantages of Each Evaluation Method
- Single-factor index method and comprehensive index method
Single-factor evaluation criteria can reflect the indicators of seawater pollution factors during sampling, but they cannot show consistent patterns or correspond to specific eutrophication conditions. They have significant limitations. The comprehensive index method corresponds more closely to eutrophication conditions and red tide symptoms. Although the indices for 2010 and 2014 were also greater than 1, no red tide symptoms occurred. Based on Figure 2c,d, it is inferred that the economic growth rate increased in 2010, wastewater discharge increased, and the discharge after 2010 showed a step-wise increase compared to before 2009. There was a change in algal types in the nearshore seawater. Therefore, although eutrophication was severe in these two years, the replacement of dominant algae prevented red tide occurrence.
- 2.
- Eutrophication index method, nutrient state quality method, and organic pollution index method
Since these three evaluation methods are relatively consistent, a comprehensive comparison was conducted. The results of the E index method showed more years of eutrophication, but they did not correspond to the occurrence of red tides. Specifically, the years with high E values, such as 2008–2009, indicated severe eutrophication without red tide occurrence, suggesting that the E index method can highlight problematic areas but often exaggerates them. Both the A and NQI methods have the same weights for all variables in their formulas, without distinguishing them based on actual conditions. The A index showed eutrophic years without red tide occurrence except for 2018, while the NQI index indicated that most years were in a moderate nutrient state, without providing differentiated indications. In terms of detecting red tide symptoms, the E index method performed slightly better than the NQI and A index methods. However, none of these three index methods can clearly indicate the eutrophication state, and further optimization and improvement are needed.
- 3.
- Nitrogen–Phosphorus Ratio Method and Eutrophication Assessment
The potential eutrophication assessment can reflect the deficiency of nutrient levels in water quality. From 2002 to 2018, most of the study area’s marine waters were in a phosphorus-limited state, with a small portion of time spent in a nutrient-poor state and a very small portion of time spent in a nitrogen-limited state. By comparing the symptoms of red tide, it can be observed that there is a certain correlation between the nitrogen–phosphorus ratio and the occurrence of red tide. Red tides always occur when the nitrogen–phosphorus ratio decreases from high to low. This indicates that algae start to reproduce rapidly under high nitrogen–phosphorus ratios, and when the ratio reaches around 16, it means that nutrients are nearly depleted, and algae will not massively bloom. When the ratio is below 16, potential nutrients continue to be released, increasing the probability of red tide occurrence. The nitrogen–phosphorus ratio shows a pattern of high–low–high variation between years, but from 2016 to 2018, this pattern was less evident. The N/P ratio remained consistently high during this period, which can be attributed to the stepped increase in wastewater discharge after 2016. This suggests that nearshore eutrophication is mainly influenced by river water quality. Therefore, the N/P ratio can reflect certain nutrient structures and eutrophication characteristics. The main reason for the increase in the N/P ratio is the increase in ammonia nitrogen content, while nitrate nitrogen content slightly decreased. During this time, the dominant algae in red tides became diatoms and dinoflagellates that feed on diatoms, indicating changes in the dominant algae species and their relationship with nitrate and ammonia nitrogen content. Analyses of the nitrate and ammonia nitrogen ratio during red tide occurrences showed that the ratio ranged from 1.15 to 1.94. Therefore, further verification is needed to determine if this ratio can be used as a characteristic indicator for red tide prediction and monitoring.
- 4.
- Dissolved Oxygen Saturation Parameter Method
The abundance of dissolved oxygen in the bottom water can to some extent reflect the eutrophication status of the water body. The dissolved oxygen saturation parameter method can effectively reflect the eutrophication condition in the water body, but it is an indirect reflection, and the overall values tend to be larger, exaggerating the eutrophic condition of the water body.
Based on the above first-generation eutrophication assessment methods, it can be observed that the comprehensive index method corresponds well to the symptoms of red tide. The ratio of nitrate nitrogen to ammonia nitrogen reflects the characteristic water quality values when red tide occurs.
4.3. Application Prospects of the First-Generation Eutrophication Assessment Model
Via the discussion of the first-generation eutrophication model mentioned above, it can be observed that the first-generation eutrophication evaluation method emphasizes the role of nutrients in characterizing the eutrophication status. The applicability of the evaluation method is somewhat limited, as it cannot provide a more comprehensive perspective on eutrophication issues. However, its advantages lie in being simple, direct, and universally efficient. Due to the limitations of the first-generation eutrophication model, many marine research institutions have begun to attempt the establishment of a second-generation seawater eutrophication evaluation model with multiple parameters [57]. This model is built upon the first-generation model, and the main difference lies in the emphasis on the process of eutrophication in the second-generation seawater eutrophication evaluation method, including comprehensive evaluation methods [58], estuarine eutrophication evaluation methods, Baltic Sea Action Plans, etc. The second-generation evaluation model and methods can more accurately reflect the eutrophication status. However, in terms of eutrophication monitoring and early warning, the second-generation model clearly lacks feasibility. For example, in the evaluation of estuarine nutrient conditions, the indicators that need to be monitored include nutrient concentrations in freshwater from land-based sources, nutrient concentrations from direct seawater discharges, nutrient concentrations in estuarine mixing zones and seawater areas, chlorophyll a concentration, macroalgae, attached plants, underwater vegetation, red tide occurrences, freshwater input from land-based sources, hydraulic dilution, and flushing capacity. There are a total of 10 monitoring indicators. While monitoring two periods per year is feasible, it is not possible for local governments to implement such a large number of indicators if monthly or long-term monitoring at multiple sites is required. Although the first-generation model has significant flaws, it better meets the long-term work requirements of local governments and monitoring agencies in terms of economic investment, operational feasibility, and subsequent data processing. In response to the shortcomings of the first-generation model, the monitoring of indicators such as organic carbon, silicates, and phytoplankton should be added. By incorporating these indicators and optimizing and improving the first-generation model, linear relationships and simple expressions among them can be explored in long-term monitoring and research, thereby playing a better role in water quality monitoring and eutrophication early warning in coastal areas near urban cities.
5. Conclusions
- According to the N/P ratio and potential eutrophication evaluation method, the coastal waters of the study area are mostly in a phosphorus-limited state for the majority of the time, occasionally in a nutrient-poor state, and rarely in a moderately nutrient-limited state of both nitrogen and phosphorus. The overall trend shows an increase in the N/P ratio, mainly due to the gradual increase in inorganic nitrogen content.
- In terms of evaluating eutrophication symptoms, the comprehensive index method provides a better reflection of eutrophication statuses. The eutrophication index method and dissolved oxygen saturation parameter method can highlight problematic areas but often overestimate them. The nutrient status quality method and organic pollution index method do not provide distinguishing indications and cannot validate red tide symptoms. The nitrogen–phosphorus ratio method and potential eutrophication evaluation can reflect certain nutrient structures and eutrophication characteristics but also cannot validate red tide symptoms.
- This study found that there is a certain pattern between the occurrence of red tides and the ratio of nitrate nitrogen to ammonia nitrogen. The ratio falls between 1.15 and 1.94 during red tide occurrences. Therefore, further verification is needed to determine whether this ratio can be used as a characteristic value for red tide prediction and monitoring.
Author Contributions
Conceptualization, S.W.; methodology, L.X.; software, L.X.; validation, Y.S.; formal analysis, L.X.; investigation, H.W.; writing—original draft, H.W.; writing—review and editing, Y.S.; visualization, S.W.; supervision, X.W.; project administration, X.W. All authors have read and agreed to the published version of the manuscript.
Funding
This research was funded by the Comprehensive Survey of Natural Resources in Haichengwen, Coastal Zone: DD20230414; and Haikou Marine Geological Survey Center, China Geological Survey, grant number DD20208013.
Institutional Review Board Statement
Not applicable.
Informed Consent Statement
Not applicable.
Data Availability Statement
The data are unavailable due to privacy.
Conflicts of Interest
The authors declare no conflict of interest.
References
- Dai, M.; Zhao, Y.; Chai, F.; Chen, M.; Chen, N. Persistent eutrophication and hypoxia in the coastal ocean. Camb. Prism. Coast. Futures 2023, 1, E19. [Google Scholar] [CrossRef]
- Han, G.; Fan, J. The Current Status and Development Trend of the Ecological Environment in China’s Nearshore Waters; Ocean Press: Beijing, China, 2016. [Google Scholar]
- State Oceanic Administration. 2016 China Marine Environment Bulletin; State Oceanic Administration: Beijing, China, 2017. [Google Scholar]
- Devlin, M.J.; Lyons, B.P.; Bacon, J.; Edmonds, N.; Tracey, D.; Al Zaidan, A.S.; Al Ajmi, F.; Al-Wazzan, Z.A.; Al-Hussain, M.M.; Al Khaled, H.; et al. Principles to enable comprehensive national marine ecosystem status assessments from disparate data: The state of the marine environment in Kuwait. Estuar. Coast. Shelf Sci. 2019, 230, 106407. [Google Scholar] [CrossRef]
- Howarth, R.W.; Anderson, D.B.; Cloern, J.E.; Elfring, C.; Hopkinson, C.S.; Lapointe, B.; Malone, T.; Marcus, N.; McGlathery, K.; Sharpley, A.N.; et al. Nutrient pollution of coastal rivers, bays and seas. Issues Ecol. 2000, 7, 1–15. [Google Scholar]
- Foden, J.; Devlin, M.J.; Mills, D.K.; Malcolm, S.J. Searching for undesirable disturbance: An application of the OSPAR eutrophication assessment method to marine waters of England and Wales. Biogeochemistry 2011, 106, 157–175. [Google Scholar] [CrossRef]
- Kratzer, S.; Kyryliuk, D.; Edman, M.; Philipson, P.; Lyon, S.W. Synergy of satellite, in situ and modelled data for addressing the scarcity of water quality information for eutrophication assessment and monitoring of swedish coastal waters. Remote Sens. 2019, 11, 2051. [Google Scholar] [CrossRef]
- Lao, Q.; Liu, G.; Gao, J.; Shen, Y.; Guo, Z.; Qing, S.; Su, Q.; Sun, Y. Study on the distribution characteristics of nutrients and eutrophication status in Qinzhou Bay aquaculture area. Mar. Environ. Sci. 2021, 40, 407–416. [Google Scholar]
- Kitsiou, D.; Karydis, M. Coastal marine eutrophication assessment: A review on data analysis. Environ. Int. 2011, 37, 778–801. [Google Scholar] [CrossRef]
- Nguyen, T.T.; Némery, J.; Gratiot, N.; Strady, E.; Tran, V.Q.; Nguyen, A.T.; Aimé, J.; Peyne, A. Nutrient dynamics and eutrophication assessment in the tropical river system of Saigon-Dongnai (southern Vietnam). Sci. Total Environ. 2019, 653, 370–383. [Google Scholar] [CrossRef] [PubMed]
- Große, F.; Fennel, K.; Laurent, A. Quantifying the relative importance of riverine and Open-Ocean nitrogen sources for hypoxia formation in the northern Gulf of Mexico. J. Geophys. Res. Ocean. 2019, 124, 5451–5467. [Google Scholar] [CrossRef]
- Santos, I.R.; Chen, X.; Lecher, A.L.; Sawyer, A.H.; Moosdorf, N.; Rodellas, V.; Tamborski, J.; Cho, H.-M.; Dimova, N.; Sugimoto, R.; et al. Submarine groundwater discharge impacts on coastal nutrient biogeochemistry. Nat. Rev. Earth Environ. 2021, 2, 307–323. [Google Scholar] [CrossRef]
- Tuholske, C.; Halpern, B.S.; Blasco, G.; Villasenor, J.C.; Frazier, M.; Caylor, K. Mapping global inputs and impacts from of human sewage in coastal ecosystems. PLoS ONE 2021, 16, e0258898. [Google Scholar] [CrossRef] [PubMed]
- Asmal, I.; Syarif, E.; Amin, S.; Walenna, M.A. The Impact of the Environment and People’s Attitudes on Greywater Management in Slum Coastal Settlements. Civ. Eng. J. 2022, 8, 2734–2748. [Google Scholar] [CrossRef]
- Codispoti, L.; Brandes, J.A.; Christensen, J.; Devol, A.; Naqvi, S.; Paerl, H.W.; Yoshinari, T. The oceanic fixed nitrogen and nitrous oxide budgets: Moving targets as we enter the anthropocene? Sci. Mar. 2001, 65, 85–105. [Google Scholar] [CrossRef]
- Liu, X.; Stock, C.A.; Dunne, J.P.; Lee, M.; Shevliakova, E.; Malyshev, S.; Milly, P.C.D. Simulated global coastal ecosystem responses to a half-century increase in river nitrogen loads. Geophys. Res. Lett. 2021, 48, e2021GL094367. [Google Scholar] [CrossRef]
- Bennett, E.M.; Carpenter, S.R.; Caraco, N.F. Human impact on erodable phosphorus and eutrophication: A global perspective: Increasing accumulation of phosphorus in soil threatens rivers, lakes, and coastal oceans with eutrophication. Bioscience 2001, 51, 227–234. [Google Scholar] [CrossRef]
- Malone, T.C.; Newton, A. The globalization of cultural eutrophication in the Coastal Ocean: Causes and consequences. Front. Mar. Sci. 2020, 7, 670. [Google Scholar] [CrossRef]
- Beusen, A.; Doelman, J.; Van Beek, L.; Van Puijenbroek, P.J.T.M.; Mogollón, J.M.; Van Grinsven, H.J.M.; Stehfest, E.; Van Vuuren, D.P.; Bouwman, A.F. Exploring river nitrogen and phosphorus loading and export to global coastal waters in the shared socio-economic pathways. Glob. Environ. Chang. 2022, 72, 102426. [Google Scholar] [CrossRef]
- Peñuelas, J.; Sardans, J. The global nitrogen-phosphorus imbalance. Science 2022, 375, 266–267. [Google Scholar] [CrossRef] [PubMed]
- Lin, S.; Litaker, R.W.; Sunda, W.G. Phosphorus physiological ecology and molecular mechanisms in marine phytoplankton. J. Phycol. 2016, 52, 10–36. [Google Scholar] [CrossRef]
- Paerl, H.W. Mitigating toxic planktonic cyanobacterial blooms in aquatic ecosystems facing increasing anthropogenic and climatic pressures. Toxins 2018, 10, 76. [Google Scholar] [CrossRef]
- Lin, X.; Gao, S.; Zhang, T.; Liu, G. Research progress and application status of methods for evaluating eutrophication in seawater. Adv. Earth Sci. 2018, 33, 373–384. [Google Scholar]
- Yao, Y.; Shen, Z. Water quality evaluation of eutrophication in Jiaozhou Bay. Mar. Sci. 2004, 28, 14–17. [Google Scholar]
- Wu, Z. Eutrophication Characteristics, Evaluation Methods and Their Applications in Typical Sea Areas of China; Graduate University of Chinese Academy of Sciences (Institute of Oceanography): Qingdao, China, 2013. [Google Scholar]
- Shantou Municipal Bureau of Ocean and Fisheries. Shantou Marine Environment Report (2015); Shantou Municipal Bureau of Ocean and Fisheries: Shantou, China, 2011. [Google Scholar]
- Zhao, C.; Hu, J.; Li, F.; Liu, L.; Lu, W.; Fu, J.; Zhou, J.; Li, J. Distribution and Risk Assessment of Heavy Metal Contents in Surface Sediments of Shantou Bay, Guangdong. J. Appl. Oceanogr. 2020, 39, 408–418. [Google Scholar]
- Nworie, F.S.; Mgbemena, N.; Ike-Amadi, A.C.; Ebunoha, J. Functionalized Biochars for Enhanced Removal of Heavy Metals from Aqueous Solutions: Mechanism and Future Industrial Prospects. J. Hum. Earth Future 2022, 3, 377–395. [Google Scholar] [CrossRef]
- Li, J.; Liu, N.; Gong, Q.; Li, C. Survey and Evaluation of Heavy Metal Environmental Quality in the Inshore Bay Sediments of Shantou City, Guangdong. Mod. Geol. 2021, 35, 1441–1449. [Google Scholar]
- Zhang, J.; Ke, D.; Fang, H.; Sun, S. Study on Nitrogen and Phosphorus Nutrient Environmental Capacity and Total Emission Control in Shantou Port Sea Area. J. Dalian Ocean. Univ. 2012, 27, 247–254. [Google Scholar]
- Huang, Y. Analysis of the Spatial and Temporal Distribution Characteristics of Nitrogen and Nitrogen Transformation Processes in Estuarine Rivers with Sluice Control; Shantou University: Shantou, China, 2022. [Google Scholar]
- Zhang, J.; Liu, Q.; Wang, Q.; Yang, Y. Phytoplankton Community Structure and Distribution Characteristics of Nutrients in Baisha Bay, Nanao, Shantou. J. Aquat. Ecol. 2012, 33, 61–68. [Google Scholar]
- Chen, D.; Ke, Z.; Tang, Y.; Liu, J. Seasonal Distribution Characteristics of Nutrients in Nanao-Dongshan Waters, Shantou, and Potential Limitations on Phytoplankton Growth. Ecol. Sci. 2020, 39, 41–50. [Google Scholar]
- GB 17378-2007; Specification for Marine Monitoring. National Technical Committee for Marine Standardization: Beijing, China, 2008.
- Office of the Leading Group for the Second National Marine Pollution Baseline Survey. Technical Regulations for the Second National Marine Pollution Baseline Survey; China Ocean Press: Beijing, China, 1997. [Google Scholar]
- HJ 442.0-2020; Evaluation and Reporting of Nearshore Marine Environment Monitoring Specifications Part Ten. China Environmental Science Press: Beijing, China, 2021.
- Bian, J.; Yuan, L.; Wang, Q.; Jiang, J.; Li, J.; Zhuang, H.; Xue, J.; Wu, H. Analysis of water quality variations and eutrophication assessment in the waters of Yangshan Deep-water Port. Mar. Bull. 2013, 32, 107–112. [Google Scholar]
- China Geological Survey. Specification for Geological Environmental Investigation and Evaluation of Coastal Zone; (DD 2014-03); China Geological Survey: Beijing, China, 2014. [Google Scholar]
- Guo, F.; Chen, J.; Zhang, Y.; Chen, B. Analysis and evaluation of nutrient levels and organic pollution in the southern waters of Huangdao District. Adv. Fish. Sci. 2015, 36, 44–50. [Google Scholar]
- Guo, W.; Zhang, X.; Yang, Y.; Hu, M. Evaluation of the potential eutrophication level in China’s coastal waters. Taiwan Strait 1998, 1, 64–70. [Google Scholar]
- Justic, D.A. Simple oxygen index for trophic state description. Mar. Pollut. Bull. 1991, 22, 201–204. [Google Scholar] [CrossRef]
- GB 3097-1997; Water Quality Standards for Seawater. China Standards Press: Beijing, China, 1997.
- Baodong, W.; Aiping, C.; Feng, L. Study on the Redfield Ratio in the Ocean. Adv. Mar. Sci. 2003, 21, 232–235. [Google Scholar]
- Redfield, A.C. The biological control of chemical factors in the environments. Am. Sci. 1958, 46, 205–221. [Google Scholar]
- Butler, E.I. Nutrient balance in the Western Englsh Channel. Estuar. Coast. Mar. Sci. 1979, 8, 195–197. [Google Scholar] [CrossRef]
- Burkholder, J.M.; Noga, E.J.; Hobbs, C.H.; Glasgow, H.B. New phantom dinoflagellate is the causative agent of major estuarine fish kills. Nature 1992, 360, 768. [Google Scholar] [CrossRef]
- Zou, D.; Xia, J. Nutrient Metabolism of Macroalgae and its Relationship with Coastal Eutrophication. Chin. J. Ecol. 2011, 30, 589–595. [Google Scholar]
- Zhang, S.F.; Han, B.B.; Shi, R.J.; Wu, F.X.; Rao, Y.Y.; Dai, M.; Huang, H.H. Quantitative Proteomic Analysis Reveals the Key Molecular Events Driving Phaeocystis globosa Bloom and Dissipation. Int. J. Mol. Sci. 2022, 23, 12668. [Google Scholar] [CrossRef] [PubMed]
- Mo, Y.; Lan, C.; Xu, M.; Lai, J.; Ling, H. The Influence of Nitrogen and Phosphorus Nutrient Changes on the Growth of Spheroidal Brown Algae in Qinzhou Bay. Mar. Sci. 2022, 46, 30–41. [Google Scholar]
- Su, X.; Chen, B.; Ya, H.; Zhu, D.; Zhang, R.; Qin, X. Analysis of nutrient salts and phytoplankton community composition during the sphere-shaped brown algal bloom process in the waters of Weizhou Island. J. Trop. Subtrop. Bot. 2022, 30, 863–873. [Google Scholar]
- Shen, P. Taxonomic Physiological Characteristics and Sulfur Production of Harmful Red Tide Alga—Spheroid Brown Algae; Jinan University: Guangzhou, China, 2001. [Google Scholar]
- Zheng, X.; Fu, Z.; Xi, Y.; Mu, J.; Li, Y. Gray correlation analysis of the population density of Noctiluca and environmental factors in the waters near Qinhuangdao. Adv. Fish. Sci. 2014, 35, 8–15. [Google Scholar]
- Tian, D.; Song, S.; Chen, T.; Li, Z.; Liu, Y.; Liang, J.; Li, C. Population dynamics and ecological mechanisms of mass reproduction of Noctiluca in Jiaozhou Bay. J. Oceanogr. Limnol. 2017, 48, 276–284. [Google Scholar]
- Hu, C.; Jin, H.; Li, Z.; Zhu, W.; Zhou, Y. Research Progress on Bioluminescent Dinoflagellates in Red Tide. J. Zhejiang Ocean. Univ. Nat. Sci. Ed. 2015, 34, 379–386. [Google Scholar]
- Wang, N.; Zhou, Z.; Ma, Z.; Han, J.; Xue, K.; Wan, L.; Deng, H.; Wang, S. Principal component analysis of Prorocentrum minimum red tide in Dalian Bay. Fish. Sci. 2004, 7, 9–11. [Google Scholar]
- Luo, X.; Shan, Y.; Yang, J. Distribution Characteristics of Phytoplankton Communities and Their Relationship with Water Environment in the Yellow River Estuary and Adjacent Waters. J. Ocean. Univ. China Nat. Sci. Ed. 2018, 48, 16–23. [Google Scholar]
- Bricker, S.B.; Longstaff, B.; Dennison, W.; Jones, A.; Boicourt, K.; Wicks, C.; Woerner, J. Effects of nutrient enrichment in the nation’s estuaries: A decade of change. Harmful Algae 2008, 8, 21–32. [Google Scholar] [CrossRef]
- OSPAR Commission. Second Integrated Report on the Eutrophication Status of the OSPAR Maritime Area; OSPAR Commission: London, UK, 2008. [Google Scholar]
Disclaimer/Publisher’s Note: The statements, opinions and data contained in all publications are solely those of the individual author(s) and contributor(s) and not of MDPI and/or the editor(s). MDPI and/or the editor(s) disclaim responsibility for any injury to people or property resulting from any ideas, methods, instructions or products referred to in the content. |
© 2023 by the authors. Licensee MDPI, Basel, Switzerland. This article is an open access article distributed under the terms and conditions of the Creative Commons Attribution (CC BY) license (https://creativecommons.org/licenses/by/4.0/).