1. Introduction
In recent times, the European Union (EU) has placed a growing emphasis on renewable energy due to concerns surrounding carbon emissions’ environmental impact, the instability of crude oil costs, and apprehensions related to energy stability. Consequently, integrating renewable energy has emerged as a pivotal element within the EU’s strategies to address worldwide temperature rise, tackle climate shifts, and diminish the reliance on non-renewable fuels.
The European Union has established ambitious targets for the near future, aiming to reduce greenhouse gas emissions by 55% by 2030 and ultimately achieve climate neutrality by 2050, positioning itself as a global leader in this endeavor [
1]. These goals necessitate a substantial escalation in the adoption of renewable energy resources across the region. To accomplish these objectives, the EU has formulated a comprehensive policy framework. This includes the Renewable Energy Directive, mandating that EU member states ensure that 32% of their energy consumption is derived from renewable sources by 2030 [
2]. Responding to the disruptions caused by Russia’s invasion of Ukraine and its impact on the global energy market, the European Commission unveiled the REPowerEU Plan on 18 May 2022. This strategic initiative focuses on intensifying the generation of clean energy, heightening energy efficiency, and broadening the spectrum of energy resources. The primary objective is to curtail the EU’s reliance on fossil fuels, especially its dependence on natural gas imports from Russia [
3].
The share of energy from renewable energy sources in European countries varies significantly, with considerable differences among member countries. According to the latest data from Eurostat, in 2021, renewable sources accounted for 21.8% of the gross final energy consumption within the EU-27. Nonetheless, the utilization of renewable energy varied widely among individual EU nations, with Sweden leading at 62.6% and Luxembourg lagging behind at 11.7%. Other member countries with high shares of renewable energy sources include Finland (43.1%), Latvia (42.1%), and Estonia (38.0%). In contrast, countries with the lowest shares of renewable energy sources include Malta (12.1%), the Netherlands (12.3%), and Ireland (12.5%) [
4].
To achieve the EU’s objectives mentioned above, it is crucial to analyze the determinants of renewable energy consumption in the European Union countries and identify the factors that could aid in accomplishing these goals. Although there is substantial research on the economic and environmental drivers of renewable energy consumption in both Europe and other parts of the world, the literature analyzing the factors behind renewable energy consumption is very limited. As argued by Cadoret and Padovano [
5], the significant variations in the share of energy from renewable sources across a group of quite homogeneous and closely linked EU economies raise concerns about the effectiveness of models that solely depend on economic and environmental factors. The determination and impact of renewable energy consumption within EU countries should also be influenced significantly by political commitment and factors at the national level. This study aims to expand upon existing research and enhance the body of knowledge regarding the factors influencing renewable energy consumption. It does so by investigating the influence of government ideology on the consumption of renewable energy within a selection of European Union countries.
The subsequent sections of this study are structured as follows:
Section 2 offers a comprehensive review of the existing literature. In
Section 3, we outline the primary theoretical rationales that connect government ideology with renewable energy consumption.
Section 4 details the research methodology and data sources. The estimation technique utilized in the analysis is expounded upon in
Section 5. The empirical findings are presented in
Section 6, and
Section 7 is dedicated to discussing the implications of these findings. Concluding this study, the last section summarizes the key outcomes and provides insights for policy considerations.
2. Literature Review
The body of research regarding renewable energy consumption is a segment within the larger scope of literature concerning energy consumption. Initially, investigations centered around investigating the co-movement between GDP and the utilization of renewable energy. Over time, these studies broadened their scope to encompass additional variables such as oil prices, electricity costs, and carbon dioxide emissions.
Sadaorsky’s [
6] panel cointegration findings revealed that higher real GDP per capita and increased CO
2 emissions per capita are significant contributors to per capita renewable energy consumption in the G7 countries. Conversely, rising oil prices exert a negative impact on per capita renewable energy consumption over the long term. Panel cointegration estimates by Sadaorsky [
7] for 18 emerging economies indicated a noteworthy positive connection between real GDP per capita and per capita renewable energy consumption in the long run. Notably, in ten subset countries with accessible electricity price data, reduced electricity prices prompted a rise in renewable energy consumption. Heterogeneous panel cointegration estimates by Apergis and Payne [
8] for Eurasia from 1992 to 2007 and by Apergis and Payne [
9] for OECD countries from 1985 to 2005 unveiled a bidirectional causal relationship between renewable energy consumption and economic growth in the short- and long-term. In a study spanning from 1997 to 2007, Menegaki [
10] employed a multivariate panel framework to scrutinize the causal nexus between economic growth and renewable energy consumption across 27 European nations. The study’s estimation results failed to confirm a causative link between renewable energy consumption and GDP. Furthermore, the panel cointegration analyses of Apergis and Payne [
11] encompassing 25 OECD countries from 1980 to 2011, as well as Apergis and Payne’s [
12] investigation spanning from 1980 to 2010 for seven Central American countries, suggested that increases in real GDP per capita, CO
2 emissions per capita, and real oil prices are associated with increases in per capita renewable energy consumption over the long run.
The literature has also initiated an exploration into the determinants of renewable energy consumption through the utilization of panel data models. Models employed in these studies often incorporate environmental and economic factors, such as carbon dioxide emissions, oil prices, real GDP, foreign direct investment, and trade openness.
Salim and Rafiq [
13] conducted research on six major emerging economies over the period between 1980 and 2006. Their findings indicated that real GDP growth and carbon dioxide (CO
2) emissions are the primary drivers of renewable energy consumption in Brazil, China, India, and Indonesia. Conversely, the Philippines and Turkey are primarily influenced by increases in real GDP for their renewable energy consumption in the long term. These researchers also noted a minor negative impact of oil prices on renewable energy consumption across all studied countries. Omri and Nguyen [
14] explored renewable energy consumption determinants across 64 nations from 1990 to 2011 using a dynamic system-GMM panel model. Their results suggested that an increase in CO
2 emissions and greater trade openness correlate with increased renewable energy consumption. Specifically focusing on middle-income countries, they identified a link between rising oil prices and reduced renewable energy consumption. Expanding on this theme, Omri et al. [
15] delved deeper into the interplay between renewable energy consumption and its key drivers across a diverse panel of countries. Their research revealed that higher per capita CO
2 emissions and greater per capita trade with foreign partners positively impact the per capita renewable energy consumption. In a distinct context, Ackah and Kizys [
16] concentrated on 12 oil-producing African nations, using panel data models and annual data from 1985 to 2010. They identified real GDP per capita, CO
2 emissions, energy prices, and energy resource depletion per capita as the primary influencers of renewable energy consumption in these countries. Focusing on China from 1980 to 2011, Lin et al. [
17] found that GDP per capita and financial development positively influence renewable energy consumption, while foreign direct investment and trade openness have a negative impact on renewable electricity consumption. Akar [
18] shifted the focus to Balkan countries, investigating the determinants of renewable energy consumption from 1998 to 2011. The results showed a statistically significant inverse relationship between economic growth and renewable energy consumption. Additionally, trade openness and natural gas rents were associated with higher renewable energy consumption. da Silva et al. [
19] studied 17 Sub-Saharan African countries between 1990 and 2014, revealing that per capita GDP promotes renewable energy consumption, while population growth impedes it. Examining a broad spectrum of countries from 1990 to 2012, Akarsu and Gümüşoğlu [
20] found that per capita income affects renewable energy consumption differently in low-income and high-income nations, with a negative impact on the former and a positive influence on the latter. Lastly, Nguyen and Kakinaka [
21] undertook a panel cointegration analysis involving 107 countries from 1990 to 2013. Their study uncovered nuanced associations: renewable energy consumption was negatively linked to carbon emissions in high-income nations, while the opposite was observed in low-income countries. Moreover, renewable energy consumption exhibited a positive correlation with real GDP in high-income nations, but a negative correlation in low-income nations.
Over the last twenty years, there has been a swift expansion in research concerning the economic and environmental factors influencing the adoption of renewable energy. However, it is only in recent times that investigations into the political and institutional influences on renewable energy consumption have recently begun to emerge.
Chang and Berdiev [
22] conducted an examination into the impact of government ideology and political factors on the regulation of energy in the electricity and gas sectors across 23 OECD countries from 1975 to 2007. Their findings indicated that left-wing governments showed a preference for regulating the gas and electricity industries. Utilizing a pooled regression technique and data covering the years between 1999 and 2009, Biresselioglu and Karaibrahimoglu [
23] delved into the connection between government orientation and the extent of renewable energy consumption in 33 European countries. Their analysis revealed a noteworthy positive relationship between the level of renewable energy consumption and the political orientation of the countries within the sample. Cadoret and Padovano [
5] explored the elements influencing the deployment of renewable energy in a study encompassing 26 EU countries during the timeframe from 2004 to 2011. Their estimations suggested that lobbying efforts by the manufacturing industry exerted a negative influence on the deployment of renewable energy. Conversely, measures of government quality were linked to a positive impact on renewable energy deployment. The study’s outcomes also indicated that left-wing political parties exhibited more support for the implementation of renewable energy compared to their right-wing counterparts. Uzar [
24] analyzed the correlation between institutional quality and the consumption of renewable energy across 38 developed and developing countries spanning from 1990 to 2015. The findings of the research indicated that institutional quality had a favorable and lasting effect on renewable energy consumption. In a study by Apergis and Pinar [
25], the relationship between party polarization and renewable energy consumption in 25 European Union countries from 2003 to 2017 was investigated. The study’s results indicated an adverse connection between party polarization and the consumption of renewable energy.
As outlined in our literature review, there exists a scarcity of research connecting political variables to the consumption of renewable energy. Therefore, the purpose of this study is to address this research gap and enhance the existing body of knowledge concerning the factors influencing renewable energy consumption. In particular, the focal point of this study is to investigate the influence of government ideology on the utilization of renewable energy within a sample of European Union nations.
This study differs from previous research on the nexus of government ideology and the consumption of renewable energy in four ways. First, unlike previous studies that used 1/0 type dummy variables to represent governing parties, this study utilizes real measures of governing parties. Second, different from prior research, our study investigates the distinct impact of political party families, such as greens and Christian democrats, on the consumption of renewable energy. Third, this study employs the largest period coverage (i.e., 49 years) to examine the issue. Fourth, this study adopts the panel quantile regression technique, which has several advantages over conventional OLS techniques.
3. Research Hypotheses
There are several theories that have been developed to understand and predict the impact of political factors on the environment, including the tragedy of the commons theory, the median voter model, the consensus hypothesis, and the partisan theory. These theories attempt to explain how the political landscape, institutions, and policies shape the way in which environmental issues are addressed and how they impact the environment. Some of the most prominent theories include the median voter model (or the consensus hypothesis) and the partisan theory.
The median voter model and the consensus hypothesis posit that the tendency of political parties to converge towards the preferences of the median voter in the context of electoral competition results in the alignment of policies towards the median voter’s position. In this regard, environmental issues have the potential to serve as non-partisan issues or valence issues, as they affect the lives of all individuals regardless of political affiliation. Thus, the consensus hypothesis argues that partisan differences among political parties have no effect on environmental issues. Therefore, a testable hypothesis based on the consensus hypothesis regarding renewable energy consumption could be that there are no differences among governments in their approach to renewable energy consumption [
26,
27,
28].
On the other hand, the partisan theory posits that the political parties in power influence policies and their outcomes through their ideological positions. The theory assumes that political parties strive to implement policies that align with their own preferences and ideology. This ideological inclination guides political parties in promoting policies that are in line with their government’s stance. As political parties have varying preferences and beliefs, their policy choices may have different economic implications. Differences in government ideology across political parties can generate distinct attitudes towards policy and affect the likelihood of reform. Thus, the ideological orientation of political parties plays a crucial role in explaining a country’s regulatory restructuring. In particular, differences in political ideology may account for the regulation of the energy industry [
22,
29,
30,
31].
The partisan theory suggests that a country’s political context, particularly that of influential parties, plays a significant role in shaping environmental protection policies and regulations. As political parties may hold differing views on environmental issues, significant differences can arise. Such differences in government ideology may impact the formulation of environmental policy. Furthermore, given that almost all environmental policies are developed and implemented in a political context, the ideological stance of the government can also impact the extent to which renewable energy is utilized. As a result, the ideological orientation of political parties in power can greatly influence the direction and implementation of environmental policies [
22,
30,
31].
The partisan theory is centered on the ideological divide between the left and the right. The classical version of this theory uses the left–right dichotomy as a fundamental basis for analysis, categorizing political parties in government as either left or right. This concept has its roots in earlier partisan theories, such as those developed by Hibbs [
32] and Alesina [
33]. These theories propose that left-wing parties prioritize policies that benefit the working class and their overall well-being, whereas right-wing parties prioritize policies aimed at controlling inflation and promoting economic growth [
29].
Regarding environmental issues, partisan theory argues that left-wing parties attach greater importance to environmental issues, environmental quality, and environmental protection than right-wing parties, and thus they tend to regulate and intervene the energy markets more than right-wing parties. Therefore, a testable hypothesis based on the partisan theory regarding renewable energy consumption could be that left-wing governments promote renewable energy consumption to a greater extent than right-wing governments.
The objective of this study is to explore the political factors that influence the consumption of renewable energy by examining the validity of both the consensus hypothesis and partisan theory. The consensus hypothesis suggests that there is no difference among governments in their approach to renewable energy consumption. On the other hand, the partisan theory argues that left-wing governments tend to promote renewable energy consumption more than right-wing governments. By analyzing a sample of European Union countries over a period of 49 years, this study seeks to shed light on the extent to which government ideology impacts renewable energy consumption.
4. Research Methodology and Data
This study analyzed the impact of government ideology on the consumption of renewable energy for 26 EU member countries (namely, Austria, Belgium, Bulgaria, Croatia, Cyprus, Czech Republic, Denmark, Estonia, Finland, France, Germany, Greece, Hungary, Ireland, Italy, Latvia, Lithuania, Luxembourg, The Netherlands, Poland, Portugal, Romania, Slovakia, Slovenia, Spain, and Sweden) using unbalanced panel data covering the years between 1972 and 2020. The sample did not include Malta due to the unavailability of data or the United Kingdom owing to Brexit.
In the light of the existing studies [
6,
13,
14,
20,
21] that have examined renewable energy consumption from a demand model perspective, the following two models were constructed and estimated to scrutinize the correlation between government ideology and the consumption of renewable energy for two distinct indicators (RENCONS1 and RENCONS2) of renewable energy consumption:
where the
i and
t subscripts represent the country and time, respectively. Meanwhile, we computed condition index (CI) values and variance inflation factor (VIF) values for the models given in Equations (1) and (2) to check the multicollinearity problem and the results are reported in
Table 1 below. As seen in
Table 1, the computed highest values of CI and VIF were less than 3. This implies that none of the models had a multicollinearity problem. In the study, all variables were used in their logarithmic forms.
The dependent variable of the study was renewable energy consumption, and two distinct indicators of renewable energy consumption were employed to verify the robustness of the findings. The first indicator, RENCONS1, is the primary energy consumption from renewable energy and is measured as a percentage share of renewable energy consumption in primary energy consumption. The second indicator, RENCONS2, is the per capita energy consumption from renewable sources in kWh-equivalent. The data for the RENCONS1 and RENCONS2 variables were obtained from Our World in Data based on the BP Statistical Review of World Energy and the UN Population Division, respectively.
The main variable of interest in this study was government ideology. This was determined using the relative power position of the relevant party wing (left-wing, right-wing, and center) in government based on their seat share in parliament, measured as a percentage of the total parliamentary seat share of all governing parties. Thus, government ideology was represented using three variables: RIGHT, LEFT, and CENTER variables. In addition, we confirmed our results using another indicator of government ideology: cabinet posts of relevant party wing as a percentage of the total number of cabinet posts. Government ideology variables were taken from Armingeon et al. [
34].
Additionally, three control variables were included in the model to mitigate for potential omitted variable bias and to verify the validity and robustness of our results. The control variables we added were GDP per capita (in constant 2015 US dollars) (PCGDP), inflation (measured as annual consumer price percentage change) (INF), and per capita CO
2 emissions (PCCO2). The INF and PCGDP variables were sourced from the World Development Indicators (WDI) provided by the World Bank, and the data on PCCO2 were acquired from Our World in Data based on the Global Carbon Project. The control variables were determined in accordance with economic theory and within a trivariate energy demand model, which is commonly used in renewable energy consumption models in the literature [
6,
13,
14,
21]. In this sense, GDP per capita represents the income effect, inflation reflects the own price effect, and the per capita CO
2 emissions measures the substitution effect in the model. As suggested by the demand model, a positive coefficient for the PCGDP variable was anticipated. As data on renewable energy prices were not available for the countries under consideration, we used inflation of consumer prices as a proxy for renewable energy prices, as has been performed in other studies in the literature (see, for instance, [
16,
20]). We anticipated a negative sign for the coefficient of the INF variable. Furthermore, since renewable energy is substituted with carbon-emitting fossil fuel energy, we expected to observe a negative coefficient for the PCCO2 variable.
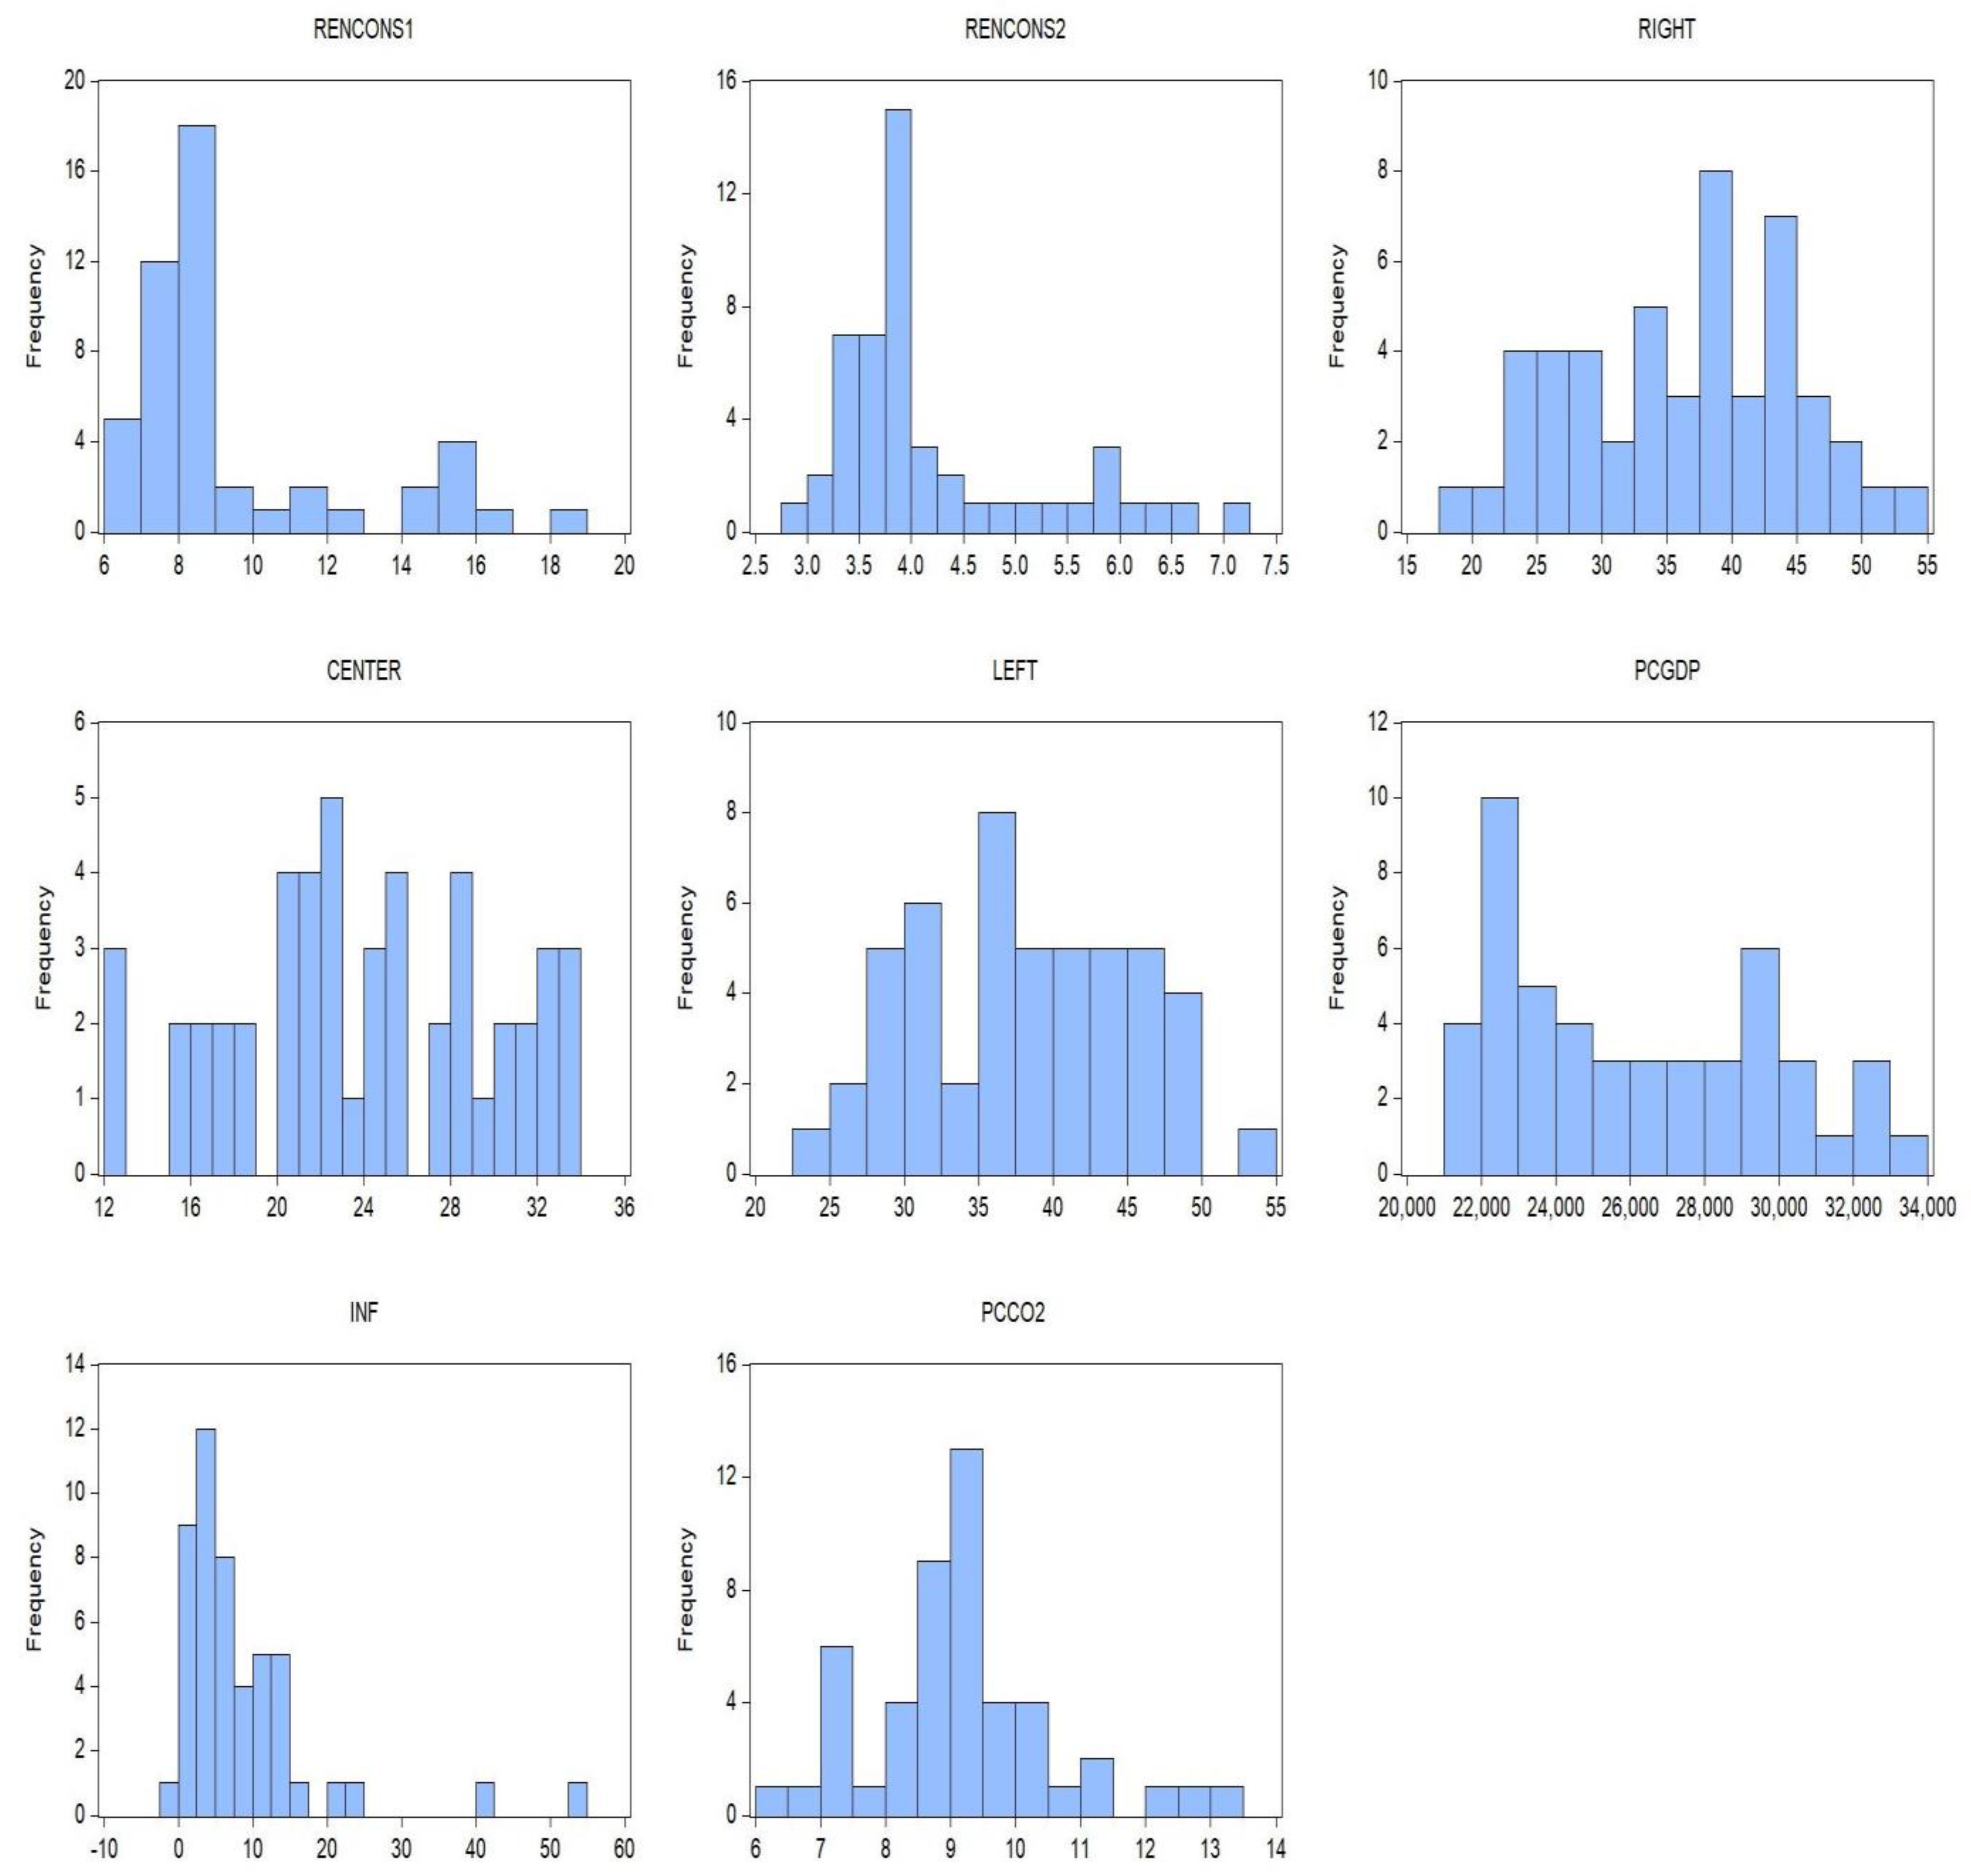
Table 2 below displays common sample descriptive statistics of the variables used in the analyses. The mean values of the RENCONS1 and RENCONS2 variables were 9.948 and 4.314, respectively, and the maximum values of the RENCONS1 and RENCONS2 variables were 51.058 and 30.443, respectively. Moreover, the mean values of RIGHT, CENTER, and LEFT variables were 38.073, 22.570, and 37.733, respectively. These figures indicate that, over the estimation period, the relative power position of right-wing parties in government was higher than left-wing parties or central-wing parties. The mean values of PCGDP, INF, and PCCO2 variables were 26,725.780, 7.968, and 8.805, respectively.
We calculated the mean values of both dependent and independent variables over the years. Using these mean values, we illustrated the frequency distribution of each variable in
Figure 1 below.
5. Estimation Methods
In this study, we used panel quantile regression method instead of conventional methods such as pooled OLS, Fixed Effect Model (FEM) regression, Random Effect Model (REM) regression, etc., to estimate models given in Equations (1) and (2) for a couple of reasons. It is common to observe that the statistical distribution of data possesses an unequal variation and, thus, the association between the relevant variables can differ depending on locations of the dependent variable’s conditional distribution. Therefore, as pointed out by Cade and Noon [
35], estimation methods relying on the mean values (e.g., pooled OLS, FEM, and REM methods) may generate incorrect results. On the other hand, unlike conventional OLS method, quantile regression method analyzes the different locations of the conditional distribution of the dependent variable and hence obtains more robust results and more complete picture with detailed insights of the association between the relevant variables. As discussed in Hübler [
36] and Chen and Lei [
37], conventional OLS estimation method leads to biased estimators in the presence of outliers, where one outlier may drastically alter estimation findings of OLS method, while quantile regression method, where the conditional distribution of the dependent variable is divided into different quantiles, is immune to such bias and generates results that are more robust to outliers. Moreover, as stated in Xu and Lin [
38], when the distribution of data is not normal, then estimators obtained from OLS method are not consistent, whereas estimators gathered from quantile regression method are consistent irrespective of distributional assumption. When OLS method does not satisfy its assumptions (i.e., assumption of linearity, homoscedasticity, independence, and normality) then quantile regression method is an alternative to OLS method. The conventional OLS method employs the method of least squares to estimate the conditional mean of the dependent variable, while quantile regression method utilizes the method of minimizing median absolute deviation to impute the conditional median or other quantiles of the dependent variable.
In this study, we employed panel quantile regression with non-additive fixed effects introduced by Powell [
39]. We estimated and reported findings for nine quantiles, namely, 10th, 20th, 30th, 40th, 50th, 60th, 70th, 80th, and 90th quantiles of the conditional distribution of renewable energy consumption. In this case, the lower quantiles were given by the countries with lower renewable energy consumption whereas the upper quantiles were given by the countries with higher renewable energy consumption. The adaptive Markov Chain Monte Carlo (MCMC) optimization method was utilized in estimations.
Table 3 displays the normality test results of Shapiro–Wilk W test and Shapiro–Francia W’ test. Test findings of both tests show that we obtained statistically significant test values for all variables; thus, both dependent and independent variables used in the study did not exhibit a normal distribution. As a result, the findings of Shapiro–Wilk W test and Shapiro–Francia W’ test revealed that conditional mean regression of OLS method could produce biased estimation results; therefore, it was considered better to utilize panel quantile regression, which provides robust estimation results in case of existence of non-normal distribution.
If our variables are not stationary, we may encounter the risk of spurious regression problems, which can lead to misleading estimation findings between renewable energy consumption and government ideology. Therefore, we checked the stationarity status of our dependent and independent variables by performing a Levin, Lin, and Chu (LLC) panel unit root test assuming common unit root process in the null hypothesis, and an ADF-Fisher (ADF-F) panel unit root test assuming individual unit root process in the null hypothesis for two different models, namely, constant model and constant and trend model. The test findings are presented in
Table 4. If a relevant variable was integrated of order zero based on at least one model (i.e., integrated of order zero for either constant model or constant and linear trend model), we assumed that the relevant variable was stationary. As seen in
Table 4, our variables were integrated of order zero at least for one model; hence, we concluded that they were stationary. Given the stationarity of our variables, we could infer that our models did not suffer from potential spurious regression problem.
6. Estimation Results
Table 5 displays the estimation results of the model given using Equation (1), where primary energy consumption from renewable energy was the dependent variable.
We found a positive and statistically significant association between the CENTER and LEFT variables and the RENCONS1 variable, as well as a negative and statistically significant relationship between the RIGHT variable and the RENCONS1 variable across all nine quantiles of the distribution of renewable energy consumption. In other words, regardless of the quantile we evaluated, an increase in the relative power position of right-wing parties in government was associated with a decrease in renewable energy consumption, while an increase in the relative power position of left-wing or center-wing parties in government was correlated with an increase in renewable energy consumption.
The magnitude of significant negative impact of right-wing governments on renewable energy consumption in terms of absolute term increased between the 10th and 20th quantiles, dropped between the 20th and 30th quantiles, augmented between the 30th and 40th quantiles, diminished between the 40th and 60th quantiles, increased between the 60th and 70th quantiles, declined between the 70th and 80th quantiles, and increased between the 80th and 90th quantiles. Meanwhile, in absolute terms, the largest negative effect of right-wing governments on renewable energy consumption was observed in the 20th quantile, while the smallest negative effect was seen in the 60th quantile.
On the other hand, the magnitude of the significant positive impact of center-wing governments on renewable energy consumption varied across different quantiles. It declined between the 10th and 20th quantiles, increased between the 20th and 30th quantiles, dropped between the 30th and 40th quantiles, augmented between the 40th and 50th quantiles, diminished between the 50th and 60th quantiles, increased between the 60th and 70th quantiles, and decreased between the 70th and 90th quantiles. Furthermore, we have identified that the largest positive effect of center-wing governments on renewable energy consumption occurred in the 10th quantile, while the smallest positive effect occurred in the 20th quantile.
Regarding left-wing governments, we observed that the magnitude of the significant positive impact on renewable energy consumption decreased between the 10th and 20th quantiles, then increased between the 20th and 30th quantiles, before decreasing again between the 30th and 40th quantiles. The impact increased between the 40th and 50th quantiles before declining between the 50th and 60th quantiles. It then increased again between the 60th and 70th quantiles, before decreasing between the 70th and 80th quantiles, and finally increasing between the 80th and 90th quantiles. The largest positive effect of left-wing governments on renewable energy consumption was observed in the 10th quantile, while the smallest positive effect takes place in the 20th quantile, which was similar to what we observed for center-wing governments. With the exception of the 10th and 90th quantiles, the positive impact of center-wing governments on renewable energy consumption was slightly greater than that of left-wing governments.
With regard to the control variables, as anticipated, the coefficient of the PCGDP variable was positive and statistically significant in all quantiles. The PCGDP variable had the largest positive effect on renewable energy consumption in the first three quantiles (i.e., the 10th, 20th, and 30th quantiles), while it had the smallest positive influence on renewable energy consumption in the 60th quantile. In line with our expectations, the INF variable had a statistically significant negative coefficient across all quantiles except the 80th quantile, where it was statistically non-significant. The INF variable had the largest negative impact on renewable energy consumption in the median quantile (i.e., the 50th quantile), while it had the smallest negative impact on renewable energy consumption in the 30th quantile. Moreover, the coefficient of the PCCO2 variable was statistically significant and had a negative sign in all quantiles. The largest impact of the PCCO2 variable on renewable energy consumption occurred in the 10th quantile, whereas its smallest effect on renewable energy consumption occurred in the 90th quantile. In terms of explanatory power across all independent variables, the PCCO2 variable ranked first, while the PCGDP variable ranked second.
Table 5 also reports the results of Wald test (Koenker and Bassett [
40]), where the statistical significance of the relevant model was tested and the null hypothesis of the test claimed that all the partial slope coefficients of the relevant model were equal to zero (i.e., the relevant model was statistically non-significant). The findings of Wald tests disclosed that each one of the nine estimated models was highly statistically significant.
We also estimated the model given in Equation (2) using another indicator of renewable energy consumption to assess the robustness of the findings presented in
Table 5.
Table 6 presents the estimation results of the model using Equation (2), where the per capita energy consumption from renewable sources was the dependent variable. As shown in
Table 6, the CENTER and LEFT variables had positive signs and were statistically significant, whereas the RIGHT variable had a negative sign and was statistically significant across all quantiles. Thus, the results in
Table 6 confirmed the robustness of the findings in
Table 5. With regard to the control variables, the coefficient of the PCGDP variable was positive and statistically significant, and the coefficient of the PCCO2 variable was negative and statistically significant across all quantiles. Moreover, the coefficient of the INF variable was negative and statistically significant across all quantiles except the 90th quantile.
7. Discussion
Our estimation results indicated that as right-wing parties gain more influence within the government, there is a corresponding decrease in the use of renewable energy. Conversely, when left-wing or center-wing parties gain more influence, there is an associated increase in renewable energy consumption. This pattern remained consistent across all quantiles under examination, and our results remained consistent when using two different indicators to measure renewable energy consumption. These results align with the partisan theory, which posits that ideological differences between political parties can lead to divergent policy preferences and outcomes.
Our estimation findings are broadly consistent with the outcomes reported by Cadoret and Padovano [
5], who found that left-wing parties tend to prioritize the deployment of renewable energy more than right-wing parties, using the left–right dichotomy where right-wing and center parties are classified under the right. However, our analysis provides additional insights into the role of center-wing parties in this context, revealing their crucial influence on promoting renewable energy. Our estimation results utilizing real measures of governing parties also reaffirm the findings of Biressioglu and Karaibrahimoglu’s [
23] study, which found that a ruling party or coalition from left-oriented or centrist-oriented governments tends to exhibit a greater degree of renewable energy consumption using 1/0-type dummy variables to represent governing parties. As a further contribution to the existing literature, our estimation results reveal that center-wing governments have a slightly greater positive impact on renewable energy consumption compared to left-wing governments, except for the 10th and 90th quantiles.
Additionally, to check the robustness of our findings, we used another indicator of government ideology, namely, the percentage of cabinet posts held by the relevant party wing, but we did not report the estimation results to save space. Using the same sample size (i.e., 1022 observations for 26 EU member countries, with a minimum of 21 observations and a maximum of 49 observations in relevant countries) and panel quantile estimation technique for nine quantiles, we detected a statistically significant negative relationship between the RIGHT and RENCONS1 variables, and a statistically significant positive relationship between the LEFT, CENTER, and RENCONS1 variables for all nine quantiles of the distribution of renewable energy consumption, except for the 10th quantile. We also obtained the same results when we used the RENCONS2 variable instead of the RENCONS1 variable as the dependent variable in most of the quantiles.
As stated previously, the sample of this study did not contain the United Kingdom owing to Brexit. We also analyzed the data before Brexit using unbalanced panel data covering the years between 1972 and 2019. The results did not change significantly in terms of the significance of parameters and the consistency across quantiles (see
Table 7 and
Table 8).
If we were to analyze party families individually instead of using the left–center–right categorization, our estimations could produce different results. Previous research has emphasized the unique contributions of green parties and Christian democratic parties to environmental quality (see, for example, [
28,
29,
30,
41]). Despite this, in the left–center–right categorization, green parties are typically grouped with left-wing parties, while Christian democratic parties are associated with center parties.
To analyze the contributions of green parties and Christian democratic parties to renewable energy consumption, we conducted separate analyses for each. For green parties, we used a sample of 342 observations from 19 countries, looking at the share of seats in parliament held by political parties classified as green. For Christian democratic parties, we used a sample of 242 observations from 12 countries, examining the total Christian Democratic governing party seats as a percentage of all legislative seats. We obtained the data from Teorell et al. [
42].
Based on the estimation results in
Table 9 and
Table 10, we found a statistically significant positive association between the representation of political parties categorized as green in parliament and the consumption of renewable energy.
Additionally, there was a statistically significant positive relationship between the total percentage of legislative seats held by Christian democratic governing parties and renewable energy consumption across all quantiles, except for the 50th and 90th quantiles when employing the RENCONS1 and RENCONS2 variables as dependent variables (see
Table 11 and
Table 12).
These results indicate that green parties and Christian democratic parties may be among the main driving forces for the significant positive coefficients for the LEFT and CENTER variables in our study. Our estimation outcomes align with the conclusions drawn by Wen et al. [
30], indicating that the presence of Christian democratic parties in government has a positive impact on environmental quality within OECD countries. Our findings are also in concordance with a study conducted by Jahn in 2022, which demonstrated that the involvement of green parties in government contributes to the improvement of environmental quality in 21 highly industrialized democracies. For the first time in the literature on factors influencing renewable energy consumption, our study presents the distinct role of green parties and Christian democratic parties in advancing the use of renewable energy.
Overall, our research highlights the important role that political ideology plays in shaping policies related to renewable energy deployment and underscores the need for continued research in this area to inform effective policy decision-making.
8. Conclusions and Policy Implications
The main objective of this study was to analyze the effect of government ideology on the consumption of renewable energy for 26 European Union (EU) member countries. Meanwhile, we aimed to test the validity of both the consensus hypothesis and partisan theory about renewable energy consumption. The consensus hypothesis posits that there is no difference among governments in their approach to renewable energy consumption, while the partisan theory argues that left-wing governments tend to promote renewable energy consumption more than right-wing governments. The research employed an unbalanced panel dataset that covers the period from 1972 to 2020 and utilized the panel quantile regression method.
The outcomes of our study substantiated the predictions put forth by partisan theory in relation to the consumption of renewable energy sources. More precisely, the results indicated that as the influence of right-wing parties within the government strengthens, there is a corresponding decline in the utilization of renewable energy. Conversely, an escalation in the influence of left-wing or center-wing parties within the government is linked to an augmentation in renewable energy consumption across all quantiles evaluated. This is in line with the predictions of the partisan theory, which posits that ideological differences between political parties can lead to divergent policy preferences and outcomes. The estimation results were robust to different indicators of renewable energy consumption and government ideology.
The findings of this research also demonstrated a statistically significant positive association between the proportion of parliamentary seats held by political parties categorized as green and the utilization of renewable energy. Moreover, a statistically significant positive correlation existed between the share of legislative seats occupied by Christian democratic governing parties in relation to the overall legislative composition and the consumption of renewable energy sources. This result suggests that green parties and Christian democratic parties may be key driving forces behind the positive coefficients for variables representing left-wing and center-wing parties in our study.
The findings of our study carry significant implications for policy makers, indicating the vital influence of political factors in propelling the adoption of renewable energy. Despite the progress made by the EU in the renewable energy sector, significant challenges still need to be overcome. These challenges encompass the requirement for increased investments in renewable energy infrastructure, the seamless integration of renewable sources into the grid, and the creation of inventive financial strategies to facilitate the implementation of renewable energy technologies. Achieving the ambitious goals of the EU in the renewable energy sector requires continued investment in renewable energy technologies, as well as the development of supportive policies and frameworks to encourage their deployment. The results of this study suggest that the promotion of renewable energy consumption in EU countries is influenced not only by economic and environmental factors, but also by government ideology and political considerations of equal significance. Tax exemptions, rebates, subsidies, low-interest credits for the production and consumption of renewable energy, renewable energy portfolio standards, renewable energy certificates, net metering policies, voluntary green programs, feed-in-tariffs, and renewable obligation schemes are among the policy tools for promoting renewable energy consumption. The successful implementation of policies promoting renewable energy consumption in the EU countries is largely dependent on the political stance of the government in power. Governments with a strong commitment to promoting renewable energy are more likely to implement policies that encourage investment in renewable energy infrastructure, offer incentives for the production and consumption of renewable energy, and support the deployment of renewable energy technologies. The primary constraint of this study lies in the availability of data. Improved data on government ideology and political factors may enhance the results of this study. Overall, we furnish proof that the government ideology held by political parties plays a vital role in advancing the adoption of renewable energy within EU countries. The findings could also inform future research on the topic and enrich our comprehension of the relationship between government ideology and sustainable energy practices. Future studies might also focus on singular countries or regions, include various political and institutional determinants of renewable energy consumption as control variables, and employ different econometric techniques.


