1. Introduction
Inefficient traffic management and the global growth of urban vehicles aggravate traffic congestion and adversely impact mobility safety, the environment, economy and social cohesion [
1]. City ports are overloaded with increasing tourism and freight demand. Demand growth in excess of infrastructure capacity generates traffic congestion and delays for transport users, causing environmental and social impacts that lead to increased fuel consumption, greenhouse gas (GHG) emissions and accidents [
2]. Road transport is responsible for 73.0% of the CO
2 emissions of the transport sector in Europe, constituting a main source of pollution and having negative environmental, air quality and health impacts [
3].
Traffic congestion on the urban road network and recurring delays at the vehicle/passenger control area of a city’s port threaten coastal urban area sustainability. To secure the environmental, social and economic efficiency of such urban areas, this paper develops and tests a dynamic management system of urban traffic and port control gates, utilizing intelligent transportation systems (ITS) and connected intelligent transportation systems (C-ITS). The new system takes advantage of new technology for continuous communication among connected vehicles and infrastructures, enabling the integration in traffic management [
4].
There is an abundance of traffic management methods for recurrent and non-recurrent traffic congestion, with the first incident detection algorithms being published in the 1970s. As early as 1985, incident detection logic could detect the majority of incidents, but their performance needed a substantial reduction in false alarms. Researchers were focused on developing more efficient algorithms to minimize these alarms [
5], which is still the case at present. The majority of incident detection algorithms are automatic algorithms, with a performance that is superior to that of non-automatic algorithms [
6]. Most automatic algorithms have been developed for motorways, with less research being focused on urban arterials.
Incident detection algorithms are also categorized based on the source of data. Fixed-sensor algorithms can be classified based on their operating principles into [
7]: comparative algorithms, comparing input data against threshold(s) [
8,
9]; statistical algorithms, using statistical models to estimate and forecast incidents [
10]; time-series algorithms, recognizing patterns over time to forecast incidents [
11]; filtering/smoothing algorithms, eliminating short-term noise or traffic data inhomogeneity [
12]; traffic modeling algorithms, using traffic flow theory and estimation [
13,
14]; image processing algorithms, via image and video recordings [
15]; and artificial intelligence algorithms, including fuzzy logic and artificial neural networks (ANNs) [
16,
17].
The most important advantage of ANNs is the storage of knowledge from the environment and the extraction of decisions based on this knowledge [
18]. Additionally, they have the ability to receive and process noisy data and present accurate detections. ANNs are used the most for traffic prediction, providing a reliable detection performance compared to other artificial-intelligence-based methods [
19]. Researchers have focused on improving the ANN architecture and training methods in the context of C-ITS [
20].
Probe-based algorithms [
21,
22] integrate transponders to obtain more accurate information about traffic conditions. These algorithms are based on the available data of each type of transponder and its operational capabilities. The majority of these algorithms use travel time recordings to recognize changes in traffic conditions and, therefore, incidents. Transponders can provide reliable information on the traffic conditions and detect traffic congestion without a high number of false alarms [
23].
Incident detection algorithms combine data from a mix of input sources (sensor fusion-based algorithms), i.e., from fixed sensors and transponders [
24,
25].
In recent years, IoT and C-ITS have offered the potential to process a large volume of data with high accuracy, thus enhancing the efficiency of incident detection algorithms [
26,
27,
28,
29]. Researchers have also focused on mining information related to traffic conditions through social media, as well as developing techniques to locate and process these data [
30].
To fill the literature gap, this study focuses on the incident detection of a complex coastal urban road network that leads to a city port. Such roads need special attention, as severe traffic congestion phenomena are often observed, especially during peak hours and the departure–arrival of daily ships and cruises, with their severity increasing owing to their connection with the transport hub. Traffic flow is restricted by the sea front, allowing open network only on one side of the coastal road, toward the urban fabric, thus causing congestion phenomena and accidents.
Two dynamic models and algorithms to detect congestion in coastal urban roads are developed in this research. The first model concerns the development of an ANN based on pattern recognition using real traffic data from confirmed recurring congestion conditions. The second one parameterizes a model identified in the literature, initially developed for motorways. The algorithm (with a higher detection performance) triggers the transmission of user notification messages related to congestion ahead of its occurrence through ITS and C-ITS, suggesting the diversion of users to alternative routes.
In this regard, studies have indicated that diverting drivers can reach 42.5% in the event that a message informs them of an incident ahead of its occurrence, while the percentage decreases to 16.0% in the event that the message informs them about the existence of road works [
31]. There is a strong correlation between a variable message sign’s (VMS) type of message and drivers’ response; thus, the message content is a critical control variable for increasing drivers’ response rate [
32]. In a survey conducted in Canada, 63.7% of drivers would divert if they were informed of adverse traffic conditions ahead of their occurrence [
33]. In Greece, 40.0% to 60.0% of drivers avoided using a major urban artery in Athens after a relevant VMS message announcing a traffic stop that was due to an incident [
34,
35]. The majority of drivers, regardless of demographics, prefer to receive messages with detailed information about an unexpected or dangerous situation and the alternative routes through connected vehicle systems (e.g., on-board units, OBUs, and human–machine interface, HMI) [
36]. In general, the response rate to C-ITS messages is 60.0–65.0% in Europe [
37].
In urban transport queuing modeling, recent research has sought to implement variations of the basic queuing models by exploiting modern data sources to optimize their performance [
38]. In the application of port facilities’ queuing systems, very few studies can be found, most related to cargo-only ports [
39]. To fill this literature gap, in this research, an algorithmic model of the management processes at the entry gates of the port control area is developed and tested with real-time data. The model identifies solution space’s and queuing systems’ results. The queuing systems deal with a wide range of operations (from single queue to multiple queues) and available gates (servers) for the real-time management of the port control area. The state of traffic in the port control area interacts with the traffic at the port area urban network.
The optimal dynamic model for the detection of traffic congestion, as studied in this work, and the algorithmic model leading to solution space’s and queuing systems’ results at the entry gates of the port control area are two fundamental components of the dynamic management system of urban traffic and port control gates, thus enhancing port cities sustainability. The performance of system components and the outcomes of the proposed system are assessed and discussed in the forthcoming sections, highlighting direct and indirect benefits. The benefits are identified from the perspective of both port users and drivers, and society, while the environmental impact is also analyzed. Case studies and scenarios of the implementation of the system are defined and analyzed.
This article is structured as follows: In
Section 2, the methodology and the modelling approach are presented; this is followed by a description of the study area and the data used in
Section 3; the results along with the case studies and scenarios are presented in
Section 4; and finally, the discussion and conclusions are provided in
Section 5.
2. Methodology and Modelling Approach
The dynamic management system of urban traffic and port control gates developed in this study benefits the users of the city port, the users who cross the port city road network—which is directly affected by the port—and citizens. The benefits arise by the reduction in travel delays and by favorable traffic conditions throughout the city network, while environmental and social aspects are also improved. The main components of the proposed system are described below.
Two dynamic models of congestion detection in urban roads are presented. The first one concerns the development of an artificial neural network (ANN) based on pattern recognition using real traffic data from confirmed recurring congestion conditions. The second one parameterizes a model identified in the literature that was initially developed for non-urban road networks. Each dynamic model is integrated in the real-time congestion detection algorithms proposed in this research, achieving dynamic urban traffic management. Detection performance metrics are used to assess algorithms based on real traffic data, resulting in the selection of the algorithm with the best performance. The selected algorithm is subsequently applied to a new dataset of real traffic data and triggers the transmission of user notification messages related to congestion ahead of its occurrence through ITS and C-ITS, suggesting the diversion of users to alternative routes. Following algorithm detections, diversion scenarios are tested via traffic microscopic simulation.
In parallel, an algorithmic model using real-time data, related to the processes at the entry gates of the port control area, is developed. The model identifies solution space’s and queuing systems’ results per specified time interval. The queuing systems address a wide range of queuing operations (from single queue to multiple queues) and available gates (servers) to be used for the real-time management of the port control area. The queuing systems’ evaluation is performed through the identification of the objective function, leading to a quick search for and the incremental selection of the best solution; depending on the properties of the solution space, the solution could also be optimal. This solution is suggested to the administrator of the port control area.
Congestion detection and diversion impacts, along with queuing systems’ selection impacts, are evaluated according to predefined evaluation indicators from the individual driver perspective, as well as from the perspective of society and the environment.
2.1. Dynamic Urban Traffic Management
2.1.1. Dynamic Congestion Detection with an Artificial Neural Network (ANN)
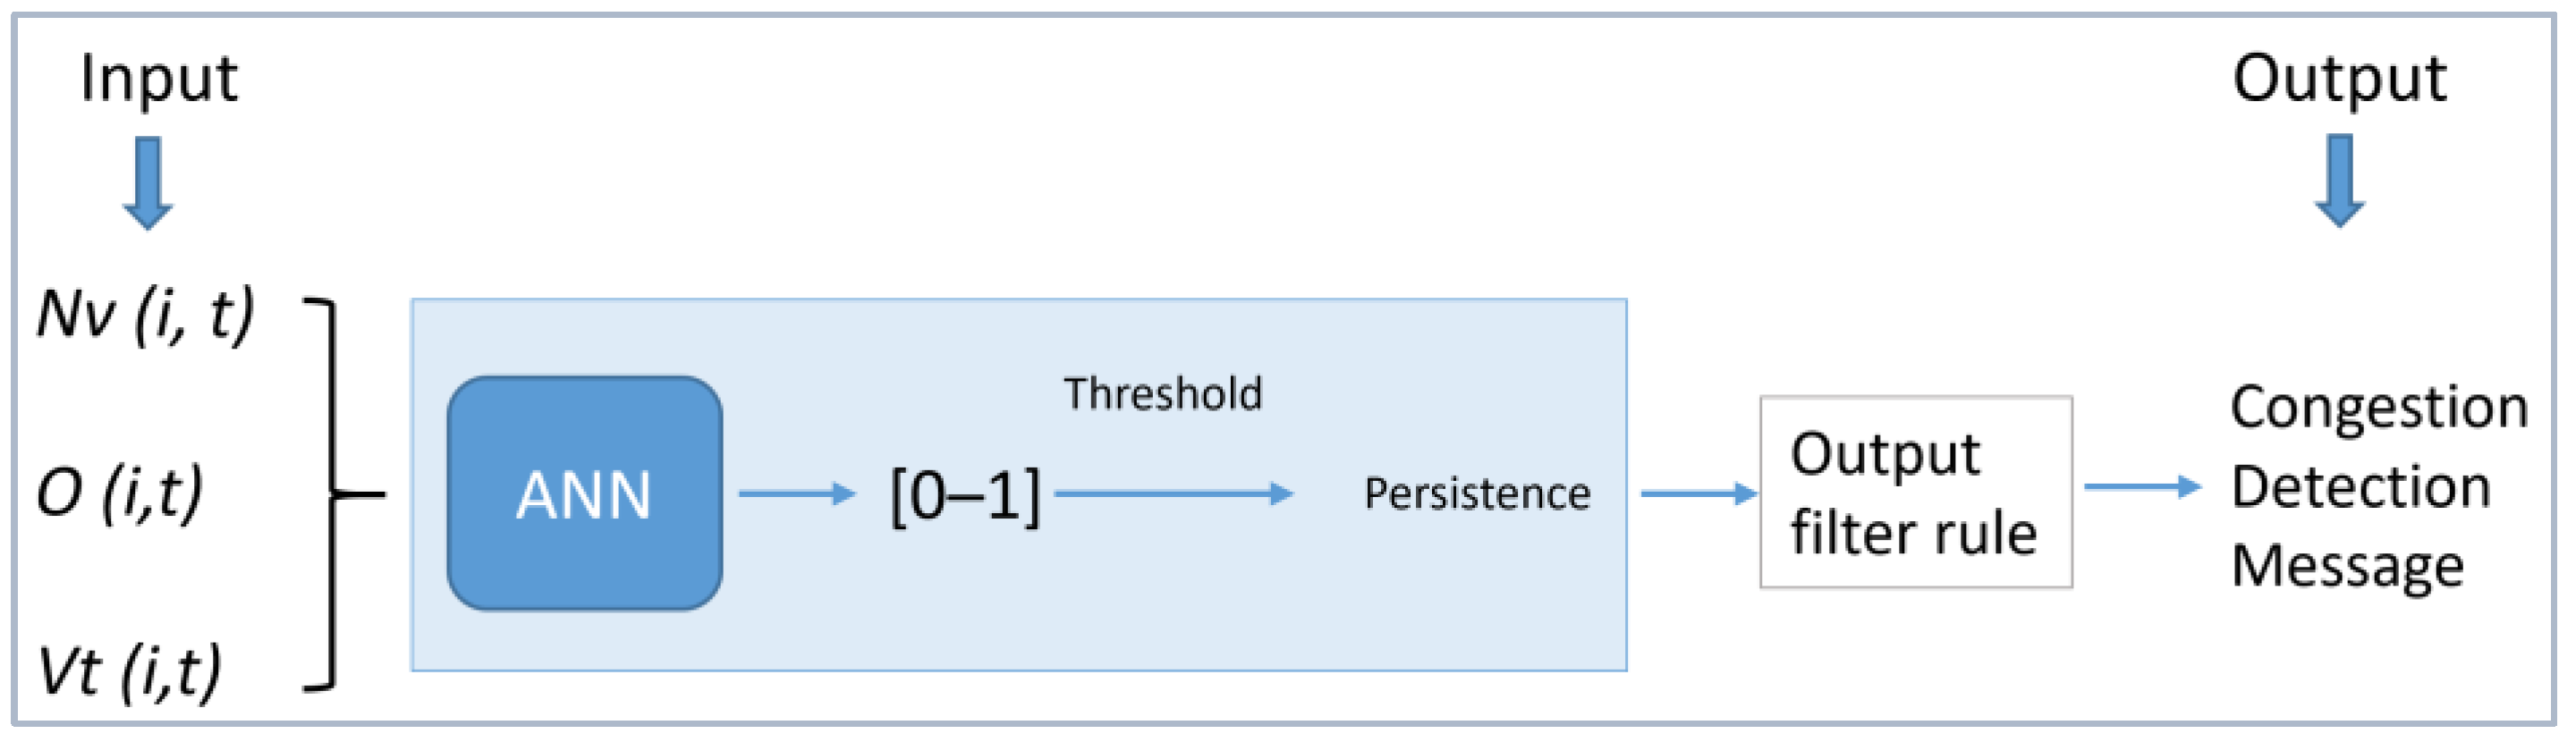
This section presents the ANN that was developed to perform congestion detection in an urban road section, as shown in the architectural diagram of
Figure 1. The input data to the ANN were collected from the traffic-data-recording stations installed in the field (e.g., machine vision systems) and their respective detectors. In particular, the collection of the following traffic data was needed:
Nv(i,t): Number of vehicles detected by detector i during the sampling–detection time interval t.
O(i,t): Time occupancy of detector i (%) during the sampling–detection time interval t.
Vt(i,t): Mean velocity (km/h) detected by detector i during the sampling–detection time interval t.
The proposed ANN, following a pattern recognition approach, was trained with a dataset of real traffic data of confirmed traffic conditions (recurring and non-recurring congestion). The training is critical for the ANN, since its successful implementation affects the ANN’s congestion detection performance when applied to new datasets.
The proposed ANN topology was a four-layer feedforward, fully-connected neural network (
Figure 2). The ANN was composed of one input layer, two hidden layers and one output layer.
The input layer, through which the input data are fed, had 3 neurons, which correspond to the three quantities that the detector generates at the end of every sampling-detection time interval, namely, Nv, O and Vt. Each of the two hidden layers had 180 neurons, and each neuron was equipped with a rectifier activation function. The output layer, at which the output of the ANN was generated, contained a single neuron that used a sigmoid activation function to produce a probability output ranging from 0 to 1 for binary classification (the occurrence of a particular congestion incident). This probability expresses the ANN confidence in the occurrence of a congestion incident.
The ANN training phase was conducted with field-labeled data in the form of [[Nv1, O1, Vt1], 0; [Nv2, O2, Vt2], 1; …]. Each 3-tuple [Nv, O, Vt] was associated with a binary label, where 1 denotes the occurrence of a congestion incident (during the data collection phase) and 0 denotes that the congestion incident did not occur (during the data collection phase). Prior to entering the input layer of the ANN, the values of each 3-tuple [Nv, O and Vt] were (0–1) normalized. Prior to training, the weights of each ANN were initialized to a small random numeral (between 0 and 0.05), generated from a uniform distribution. In this study, a logarithmic loss function was proposed for the training, which is the preferred loss function for binary classification and the efficient adaptive moment estimation (Adam) optimization algorithm for gradient descent.
For the decision of whether the ANN output indicates a congestion incident or not, a proper classification threshold should be adopted. If the ANN output is above the specified threshold, it is considered that a congestion incident occurs; thus, the detection is labeled as True State. If the output is below the specified threshold, it is considered that a congestion incident does not take place; thus, the detection is labeled as False State. In order to specify the classification threshold, we evaluated two basic detection performance metrics, namely, Detection Rate (DR) and False Alarm Rate (FAR), for several values of the classification threshold. The selected classification threshold should lead to a high DR and low FAR.
A persistence check was also conducted for the ANN output, i.e., a congestion detection message is generated only when a True State is observed for a specific number of consecutive sampling–detection time intervals to be specified. In the proposed methodology, the specification was made by evaluating the values of DR and FAR across the classification thresholds and persistence values with the aim of achieving a high DR and low FAR. Beyond these two basic performance metrics, the ANN performance was also evaluated on a dataset of field-labeled data based on accuracy metric, which is the fraction of correct detections that the ANN made. A detailed description of the detection performance metrics is presented in
Section 2.1.3.
2.1.2. Dynamic Congestion Detection with the Parameterized Model
This study also investigated whether the motorway congestion detection method developed by Stephanedes and Chassiakos [
40] could be adjusted to detect congestion in an urban road segment. The initially proposed method detects a congestion incident on a road section between two traffic-data-recording stations by analyzing the variations in spatial occupancy between the detectors of the stations and performing the test shown in Equation (1):
According to the test, at each sampling–detection time interval that a new spatial occupancy value is recorded, two smoothed occupancy values are calculated for each detector, denoted by
for the current and
for the past period. In a way similar to the California algorithm, a test is performed examining the current spatial occupancy difference to detect congestion between stations i and i + 1. The above difference is normalized by the maximum of
and
to reflect changes relative to previous traffic conditions, and is compared to the congestion test threshold T
1 [
40] (p. 227).
To adjust Equation (1) to the urban environment, the test was performed by substituting the spatial occupancy with other traffic variables and evaluating the detection performance on the real traffic data of confirmed recurring congestion conditions based on the performance metrics DR and FAR. The aim was, again, to achieve a high DR and low FAR. Time occupancy was finally selected. The proposed detection logic was as follows. The two stations record time occupancy values at every 20 s, and the proposed algorithm calculates the smoothed time occupancy (average value of the time occupancy values), for each station, at every 60 s. If, for over two consecutive times, the congestion test is true (True State), a congestion detection message is produced.
2.1.3. Detection Performance Metrics
For the performance assessment of the two congestion detection algorithms proposed in this study, two main detection performance metrics were applied, Detection Rate (DR) and False Alarm Rate (FAR). Both metrics are commonly used by transportation engineers. Their formulation is as follows:
Additionally, a secondary metric was Accuracy (%), defined simply as the number of congestion cases correctly detected by the algorithm divided by the total number of congestion cases detected by the algorithm [
41,
42].
2.1.4. Evaluation Indicators
According to the selected algorithm (the one with a higher detection performance), dynamic congestion detection triggers the transmission of user notification messages for the congestion ahead of its occurrence through ITS (e.g., VMS) and/or C-ITS (e.g., OBU, HMI) applications, suggesting drivers to divert using alternative routes. Drivers’ compliance with these messages leads to a reduced input traffic flow in the congested urban road section. The various user diversion scenarios hypothesizing such traffic flow reduction were tested through microscopic traffic simulation. Congestion detection and diversion impacts were evaluated by indicators that were quantified using the simulation results.
The evaluation indicators were defined to cover economic, social and environmental aspects. Depending on the perspective (individual driver or society), researchers may focus on some of the following indicators or use weighting coefficients [
43]. We concluded that “Travel Time” and “Fuel Consumption” are the most important evaluation indicators for the individual driver. On the contrary, “CO
2 Pollutant Emissions” and “Traffic Safety” were considered important evaluation indicators for the environment and society. The evaluation indicators are described below.
Travel Time (s) is defined as the mean travel time that drivers need to cross the urban road section, meaning the time to travel starting from the position of the first traffic-data-recording station and ending at the second one, as expressed in Equation (4).
Fuel Consumption reflects a personal expense for the vehicle owner. To estimate vehicle fuel consumption, we used the model of Akcelik [
44,
45]. This model estimates the fuel consumption based on the vehicle state, i.e., idle, accelerating at acceleration α (m/s
2) and speed V (m/s), and decelerating and cruising at a constant speed V (m/s), as shown in
Table 1, where, for each pre-defined type of fuel, F
i and F
d are the fuel consumption rate in ml/s for idling and decelerating vehicles, respectively; Δt (s) is the time duration of each state; c
1 (mL/s) and c
2 (mL-s
2/m
2) are constants related to the acceleration state; F
1 is the fuel consumption rate in l/100 km for vehicles traveling at the constant speed of V
1 = 90 km/h; and F
2 is the fuel consumption rate in L/100 km for vehicles traveling at the constant speed of V
2 = 120 km/h; V
m is the speed at which the fuel consumption rate is at a minimum for vehicles cruising at a constant speed (km/h or m/s). Further details on the units of V
m and the proposed values of the aforementioned constants are provided in
Table S1 of the Supplementary Materials.
Given that the proposed fuel consumption estimation model was applied during the traffic simulations, the evaluation indicator Fuel Consumption (L/vehicle) was defined as the average fuel consumption of the vehicles on the road network during the simulation, as shown in Equation (5).
Drivers’ safety while travelling on the road section was evaluated based on Traffic Safety (s) indicator according to Equation (6), considering the vehicles’ mean time headway.
The environmental impacts in terms of air quality degradation and the related citizens’ health issues (respiratory and cardiovascular) [
46] were evaluated through the CO
2 Pollutant Emissions indicator. To estimate the CO
2 emissions produced by vehicles on the road section as a function of acceleration α (m/s
2) and speed V (m/s), the model of Panis et al. [
47] was applied as described in Equation (7).
where E
0 is the minimum value of CO
2 emissions and f
1–6 are constants. Details about constants values can be found in
Table S2 of the Supplementary Materials. Similar to the fuel consumption estimation model, vehicle speed and acceleration play a significant role in estimating the vehicles’ pollutant emissions. These data are available through simulation. The evaluation indicator CO
2 Pollutant Emissions (g) was defined as the total CO
2 emissions produced on the road network during the simulation, as shown in Equation (8).
2.2. Dynamic Port Control Gates’ Management
2.2.1. Queuing Systems’ Algorithmic Model
The algorithmic model developed in this study for the dynamic port control gates management is described in this section. The algorithmic model uses real-time data related to the processes at the entry gates of the port control area. Data on the Vehicle arrival time at the port control area are the first input data required. Such data can be recorded by stationary detectors or recording stations installed in the field (e.g., by machine vision systems inspecting the entry into the port control area); in the case of connected vehicles and C-ITS applications, the vehicles can automatically transmit their arrival time through their OBU.
Service time (i.e., time needed for the execution of the security and ticket controls of each vehicle) was subsequently introduced into the algorithmic model. This type of data is directly associated to the vehicle class (e.g., motorcycle, private passenger vehicle, van, truck tractor, liquid tank truck or trailer truck). Therefore, the minimum and maximum service time per vehicle class are required for the model. These values can be specified using field measurements. Depending on the class of each vehicle, the model chooses a random value of service time within the range of service time of each class defined by the minimum and maximum values. To conduct this operation, the model must also receive data about the class of every vehicle entering the control area. This can be achieved through C-ITS applications in the case of connected vehicles; alternatively, vehicle class can be automatically calculated by the length/shape of each vehicle recorded by data collection stations, such as the machine vision systems installed in the field.
The model output data are the average service time, average waiting time (in queue), average time in the system, average number of vehicles not served, average queue length and average system length for each queuing system studied. The output data were calculated by the weighted average of the individual results per iteration for the whole model application period. The iteration duration can be specified by the relevant port authority based on the port current needs. In this study, the proposed duration was 15 min.
Following the proposed model, the algorithm tests port operating scenarios corresponding to several queuing systems with a wide range of queuing operations (from single queue to multiple queues) and available gates (servers). Then, their evaluation was performed through the objective function, leading to a quick search and incremental selection of the best solution. To ensure that the queuing systems’ comparative evaluation is not affected by the randomness of the service time choice, the service time of each vehicle was held constant across scenarios of same operating conditions. The suggested objective function is shown in Equation (9).
In preparation for minimizing the objective function, since not all variables values are of the same order of magnitude, a weighting factor of 100 was used for average system length, average queue length and average number of vehicles not served owing to delays in the control procedures.
2.2.2. Evaluation Indicators
The impacts of the dynamic port control gate management through the queuing systems’ selection were evaluated using the evaluation indicators described below. Similar to the traffic management evaluation indicators, the present evaluation indicators were defined to reflect impacts on economic, social and environmental aspects of life. The proposed indicators were divided into those who affect directly the driver (i.e., “Travel Time” and “Fuel Consumption”) and those who affect the environment and society (i.e., “CO2 Pollutant Emissions” and “Traffic Safety”). Indicators’ descriptions are as follows.
Travel Time (s) is the average time in the system, i.e., the average time spent by the vehicles and their passengers in the system, as expressed in Equation (10).
Modelling vehicles’ fuel consumption in queueing systems is complex. This is due to the fact that fuel consumption is affected by factors that cannot be easily recorded, such as detailed vehicle state (e.g., idle duration, number of stops and restarts, acceleration of every restart and duration of being stationary without engine running). Thus, the following assumption was made: vehicles are idle the entire time during which they remain in the queuing system. According to Akcelik [
44,
45], fuel consumption at the idle state is calculated as
, where F
i is the fuel consumption rate in ml/s for the idle state and Δt is the time in the system. F
i value depends on the type of fuel and vehicle category. To simplify modeling, an average
was proposed. Details about
estimation can be found in
Section S1 of the Supplementary Materials. The Fuel Consumption evaluation indicator is expressed in Equation (11).
Existing studies [
48,
49,
50,
51,
52] have shown that passengers’ uncertainty, anxiety, stress and anger is increased while waiting in a queue, resulting in passengers’ intense psychological–emotional state and, in some cases, reduced safety perception (feeling unsafe). Based on such conclusions, in this study, we defined Traffic Safety (s) as the average time spent by the vehicles and their passengers waiting in the system queue, i.e., the average waiting time.
Modelling vehicles’ CO
2 emissions in queueing systems is as complex as fuel consumption modelling. Thus, the same assumption as the previous one was made, i.e., in the idle state, vehicle speed and acceleration are equal to 0. To estimate CO
2 emissions, Equation (7) is CO
2 = f
1 (g/s), where f
1 is a constant that depends on the type of fuel and vehicle category. The use of an average
is suggested; details about it can be found in
Section S2 of the Supplementary Materials. The total CO
2 Pollutant Emissions (g) in the system were calculated according to Equation (13).
4. Results
The results reported in this section indicate the benefits of the suggested dynamic management system of urban traffic and port area on the individual driver, the environment and society. For quantifying the impacts from the application of the proposed system, a comparative evaluation of scenarios was conducted based on the defined indicators: “Travel Time”, “Fuel Consumption”, “Traffic Safety” and “CO2 Pollutant Emissions”.
4.1. Congestion Detection
First, the two proposed dynamic models of congestion detection, namely, the ANN and the parameterized model, were applied to the same set of real traffic data of confirmed traffic conditions (recurring and non-recurring congestion) on the road section under study. Their detection results were assessed based on the detection performance metrics, resulting in the selection of the best performing algorithm. The values of detection performance metrics are presented for each model in
Table 2.
The DR for the case of the ANN was equal to 81.2%, whereas for the parameterized model, it equalled 64.3%; thus, the ANN dominates. The FAR for the case of the ANN was equal to 1.3%, while for the parameterized model, it equalled 3.7%. Based on this metric, the ANN performed better than the parameterized model. On Accuracy, the ANN performance was better compared to that of the parameterized model. Given that a high DR and Accuracy, and a low FAR are desired, it is concluded that the performance of both models is satisfactory. Of them, the ANN was selected.
The ANN was applied to a new dataset of real traffic data and, after congestion detection, an algorithm triggered the transmission of user notification messages on the congestion ahead of its occurrence. The study period was a 9 h weekday, from 12.30 am to 21.30 pm. Drivers’ compliance with these messages leads to a reduced input traffic flow in the congested urban road section. Five diversion scenarios were tested via traffic simulation. A diversion percentage condition ranging from 20% of vehicles (Scenario a) to 40% of vehicles (Scenario e) to alternative routes was studied, along with Scenario 0 (base scenario) when no diversion occurs. The scenarios’ impacts on society and the environment, as well as on the individual driver, are presented in
Figure 4 based on the corresponding evaluation indicators.
Starting with the results related to the individual driver benefit,
Figure 4a illustrates the values of the evaluation indicator Travel Time (Equation (4)) for the base scenario and per diversion scenario. In Scenario a, corresponding to a diversion of 20% of vehicles, the indicator was equal to 132.36 s denoting a decrease of 54.13% compared to Scenario 0, in which Travel Time was equal to 288.53 s. For diversion rates greater than 20%, Travel Time remained almost the same, with slight reductions among Scenario b of 25% diversion (119.25 s), Scenario c of 30% diversion (118.11 s), Scenario d of 35% diversion (117.86 s) and Scenario e of 40% diversion (117.34 s), but reduced compared to Scenario 0, with a reduction percentage between 58.67% and 59.33%. Even with more drivers diverting, the remaining drivers on the road section—even if their number decreases considerably—cannot reach higher traveling speeds and lower travel times owing to the limitations imposed by road type and traffic lights. This explains the similar values of the Travel Time indicator for diversion rates of 25–40%.
In
Figure 4b, the values of the indicator Fuel Consumption (Equation (5)) for the base scenario and per diversion scenario are shown. Fuel Consumption was reduced for Scenario a as compared to Scenario 0. A reduction equal to 57.65% was noted; the indicator was reduced from 0.196 L/veh to 0.083 L/veh and subsequently positively affecting the cost of travel from the individual drivers’ perspective. For the rest of the diversion rates, the indicator’s reduction was in the order of 60% compared to the base scenario without diversion. Fuel Consumption was almost same for diversion rates of 25–40%. Even with more drivers diverting, the remaining drivers on the road section cannot change their driving behaviour (e.g., driving at a constant speed) and reduce the frequent stops/restarts (parameters affecting the fuel consumption estimation model) owing to the limitations imposed by road type and traffic lights.
From the society perspective, it can be noted in
Figure 4c that the Traffic Safety (Equation (6)) evaluation indicator increased by 39.73% for Scenario a compared to Scenario 0. Additionally, compared to Scenario 0, Traffic Safety increased by 45.21% for Scenario b; by 52.74% for Scenario c; by 55.14% for Scenario d; and by 61.30 for Scenario e. Traffic Safety increased as the number of vehicles reduced.
Regarding the evaluation indicator CO
2 Pollutant Emissions (Equation (8)) and the corresponding environmental impact, as depicted in
Figure 4d, the reduction in CO
2 emissions was remarkable, ranging between 52.57% and 54.70% for all diversion scenarios, compared to Scenario 0. After diversion, traffic conditions become smoother, resulting in a lower acceleration and fewer speed fluctuations, leading to a reduction in CO
2 emissions.
4.2. Port Area Management
The algorithmic model developed for the dynamic port control gates management was applied to a field dataset on a weekday, from 14.30 am to 17.30 pm; on this day, a ship departed at 17.30 pm. This three-hour period was included in the application period of the ANN congestion detection model.
The model tested several port operating scenarios (queuing systems) corresponding to multiple queues and two to eight active control gates (seven scenarios) (Case study 1) and to a single queue and one to eight active control gates (eight scenarios) (Case study 2). The port infrastructure consists of eight available control gates; thus, the scenarios do not involve more than eight control gates. In total, fifteen scenarios were tested at every 15 min (iteration period). Then, their evaluation was performed through the minimization of the objective function (Equation (9)), leading to a quick search for and the incremental selection of the optimal solution.
Table 3 demonstrates the optimal solution/scenario per iteration derived from the analysis of the queuing systems on multiple queues and on a single queue for the three-hour study period. Depending on the input data per iteration, the optimal solution varied. For example, in iteration 1, the optimal solution was the multiple queues with three active control gates. The objective function for the multiple queues was minimized when three control gates were active. Additionally, the value of the objective function for the case of multiple queues with three active control gates was lower than the case of a single queue with seven active control gates, which is the optimal solution among the eight scenarios studied under a single-queue queuing system.
The impacts on individual driver (Travel Time and Fuel Consumption), society (Traffic Safety) and the environment (CO
2 Pollutant Emissions) are depicted (
Figure 5) based on the corresponding evaluation indicators, as derived for the optimal solution per iteration on multiple queues (Case study 1) and on single queue (Case study 2) operating scenarios for the study period.
Figure 5 also shows the impact of multiple queues with four constantly active gates (base scenario) per iteration, which was the actual port operating system during the study period.
From the optimal solution results (
Figure 5a), based on the values of the evaluation indicator Travel Time (Equation (10)), the base scenario is the most unfavourable one in comparison with the optimal scenarios of Case study 1 and Case study 2, with very high values of Travel Time. In particular, from iteration 6 onwards, the base scenario’s Travel Time increases, with the highest value in iteration 8, at 1 h and 15 min prior to ship departure. For the optimal solutions of Case study 1′s operating scenarios, critically lower values of the evaluation indicator were observed compared to those of the base scenario. More specifically, in the first five iterations, the value of the indicator remains unchanged between Case study 1 and the base scenario, since demand does not require more than four gates in operation. From iteration 6 onwards, the model demands a higher number of active control gates; thus, significant differences in the values of the indicator were observed. The optimal solutions of Case study 2 also demonstrate lower values of the evaluation indicator compared to those of the base scenario. After iteration 8, when the drivers’ inflow increases owing to the imminent ship departure, Case study 1 outperforms Case study 2, affecting more positively the individual driver.
Continuing to the individual drivers’ benefits,
Figure 5b illustrates the value of the evaluation indicator Fuel Consumption (Equation (11)). The experimental conclusions that can be drawn are similar to those for the evaluation indicator Travel Time. Furthermore, Fuel Consumption on average was 0.07 L/veh higher in the base scenario compared to those of the optimal solutions of Case Study 1 and 0.05 L/veh higher compared to those of the optimal solutions of Case Study 2. Case study 1 outperforms the base scenario and Case study 2.
The values of the evaluation indicator Traffic Safety (Equation (12)) were equal to zero for Case study 1. Since this indicator is related to the waiting time of drivers at the port control area, it can be concluded that Case study 1′s performance is superb since drivers do not wait in a queue. On the contrary, in the base scenario, the values of the indicator are higher from iteration 6 onwards, with the highest value occurring 1 h and 15 min before ship departure (iteration 8). Afterwards, the differences gradually decrease. The same behaviour was noted for Case study 2, but with lower values than those of the base scenario. In Case study 2, Traffic Safety decreases on average of 80 s than in the base scenario.
Concerning environmental impact and the evaluation indicator CO2 Pollutant Emissions (Equation (13)), the experimental conclusions are similar to those of the evaluation indicators Travel Time and Fuel Consumption. The base scenario results in higher CO2 emissions from iteration 6 onwards. Case study 1 outperforms the base scenario and Case study 2. Total CO2 emissions for the base scenario were estimated to be higher by 59,225 g compared to those of the optimal Case study 1, indicating a reduction of 65%, while for Case study 2, the total CO2 emissions were estimated to be higher by 15,205 g compared to those of the optimal Case study 1.
5. Discussion and Conclusions
Port cities have special characteristics leading to intense transportation-related challenges. The regional growth of the city is the primary benefit derived by the operation of the port, whereas traffic congestion, traffic accidents and air pollution are the primary disadvantages from an environmental and societal point of view [
55]. To address the above drawbacks of the reciprocal relationship between the city and the port, research should focus on developing solutions and proposing measures for the efficient planning and dynamic management of both areas [
56,
57].
In the era of continuous technological advances, ICT applications enable researchers and policy makers to interact directly with citizens and urban infrastructure, exchanging valuable data. These data describe city real-time conditions and development, leading to useful conclusions on ways in which quality of life can be improved. Focusing on the transportation sector, ITS and C-ITS applications could assist in increasing the effectiveness of urban road network mobility and the efficiency of port operations [
58].
In this regard, the present study proposed a dynamic management system of urban traffic and port control gates in a port city environment. In particular, the proposed system aims to ease traffic congestion in the main coastal urban road of the city and improve port control operations, benefiting both citizens and travelers.
The system was applied on the main coastal urban road of Othonos-Amalias Avenue in Patras city, Greece, and the Southern Port of Patras. The proposed methodology and modelling of this study is considered to be easily replicable to other port cities with similar characteristics to the ones of the selected study area.
The adopted methodology incorporated algorithmic models to dynamically detect recurrent congestion and to select the optimal service system in the port control area with queuing model analysis. For the dynamic congestion detection, an algorithm based on ANN was developed using pattern recognition and real data from confirmed traffic conditions. A second algorithm was developed based on a parameterized model that was adapted for urban road environment. The detection performance of these algorithms was evaluated by set metrics and the algorithm with the highest performance was selected, namely, the one based on the ANN.
Following the congestion detection results, it is suggested to divert users prior to entry into the road section under study. In addition to the base scenario (no diversion), five diversion scenarios were tested via microscopic traffic simulation. A diversion percentage condition ranging from 20% of vehicles (Scenario a) to 40% of vehicles (Scenario e) to alternative routes was studied.
Regarding the dynamic management of the port control area, queuing systems’ analysis with an objective function was proposed. Several port operating scenarios (queuing systems) were tested, leading to a quick search for and the incremental selection of the optimal solution. In particular, the base scenario included multiple queues and four constantly active gates. The tested scenarios corresponded to multiple queues and two to eight active control gates (seven scenarios) and to a single queue and one to eight active control gates (eight scenarios).
All social and environmental impacts, as well as impacts on the individual driver, were analyzed based on the corresponding evaluation indicators.
The first finding was obtained by the comparative performance evaluation of the two congestion detection algorithms developed in this study. The application of the congestion detection algorithm based on the ANN had a higher detection performance according to all three set detection performance metrics (i.e., DR, FAR and Accuracy) compared to the performance of the algorithmic parameterized model. Given that a high DR and Accuracy, and a low FAR are desired, it is concluded that the performance of both models is satisfactory. However, among them, the ANN was selected.
The second conclusion concerns the dynamic traffic management of the urban road section by diverting drivers before entering the section owing to the congestion ahead of its occurrence. Following the ANN’s detection alarms, diversion scenarios simulated the drivers’ diversion at rates ranging from 20% (Scenario a) to 40% (Scenario e). Comparing the do-nothing initial situation and the diversion scenarios (Scenario a–Scenario e), an improvement of all evaluation indicators, Travel Time, Fuel Consumption, Traffic Safety and CO2 Pollutant Emissions, was observed. More specifically, the Travel Time indicator was reduced by over 50%; the same was achieved for the CO2 Pollutant Emissions indicator. As for the Fuel Consumption indicator, a high reduction of over 60% was observed, while the Traffic Safety indicator was improved for all diversion rates. At an increased rate, all indicators improved but the change was small.
Considering the comparative evaluation results across diversion rates, it is concluded that the diversion of 20% (Scenario a) is sufficient to cause significant benefits for the drivers who continue on the section, but also for society and the environment based on the set evaluation indicators. Owing to the limitations imposed by road type, traffic lights and the mixed use of the road, diversion rates higher than 20% do not offer further benefits. The diversion could be better exploited in a fully connected transport environment (i.e., all users drive connected vehicles) where diversion messages can be transmitted to a certain number of vehicles based on specific parameters, e.g., vehicle final destination and type [
59].
Regarding the dynamic management of the port control gates of the Southern Port of Patras, the evaluation indicators results were presented for fifteen tested queuing systems scenarios. For each system, the corresponding evaluation indicators, Travel Time, Fuel Consumption, Traffic Safety and CO2 Pollutant Emissions, were calculated. Very satisfactory results were obtained from testing multiple queues and two to eight active control gates. In this case, the algorithm selected the optimal number among all available gates and the service provided was of highest level based on all four evaluation indicators. The queuing operation with a single queue and one to eight active control gates follows in terms of serving performance based on all four evaluation indicators. Last ranked is the queuing operation with multiple queues and four continuously active servers, the base scenario, which corresponds to the actual no-action operation of the Southern Port of Patras. Based on the aforementioned findings, it is concluded that the most efficient operation system is the one in which the proposed algorithm selects the optimal number of gates per iteration that correspond better to the actual needs of the control area and users entering in real time, without limitations in queue formation (as in Case study 2) or a specific number of continuously active gates (as in the base scenario).
Considering the impacts on the individual driver moving towards the Southern Port of Patras via the Othonos-Amalias avenue to board a ship, as well as the wider social and environmental impacts, it is concluded that the parallel application of the proposed algorithms offers multiple benefits. Hypothesizing a diversion of 20% and focusing on the driver’s perspective, the individual driver gained almost 7 min and consumed 0.306 L less fuel. Focusing on the environmental benefits, a considerably high reduction of 1,445,132 g in CO2 pollutant emissions was achieved. Finally, focusing on the social benefits, there was an increase of 39.72% in traffic safety on the urban road, and drivers did not feel unsafe at all in the port control area, since they were served immediately upon their arrival.
Directions for further research include the following. First, future research may further study vehicle diversion impacts associated with congestion detection informative messages to drivers. Researchers can analyze new scenarios expanding the urban road network under study. In this case, mesoscopic or hybrid traffic simulation models may be needed instead of microscopic ones to extract the data required for the evaluation indicators’ calculation. From the literature, user acceptance of traffic informative messages for C-ITS messages is not yet thoroughly studied. More studies on this aspect would achieve a better understanding of drivers’ compliance, resulting in a more precise estimation of diversion impacts. Furthermore, it is suggested to take into consideration technologically advanced and fully automated control systems [
60,
61,
62] when analyzing the potential queuing systems in the port control area. Such systems considerably affect service time and, thus, the overall performance of the queuing system. However, their installation requires a high investment from the port authority; so, a cost–benefit analysis should be conducted. A final suggestion for further research would be to define additional evaluation indicators (e.g., related to other types of pollutant emissions [
63,
64] and noise pollution [
65]) to expand the environmental and societal aspects evaluated by the proposed methodology.


