Article

Temporal and Spatial Variations of Extreme Climate Events in Northwestern China from 1960 to 2020

1
Research Institute of New Urbanization and Human Settlement in Shaanxi Province, Xi’an University of Architecture and Technology, Xi’an 710055, China
2
Center for Glacier and Desert Research, College of Earth and Environment Science, Lanzhou University, Lanzhou 730000, China
3
College of Architecture, Xi’an University of Architecture and Technology, Xi’an 710055, China
*
Author to whom correspondence should be addressed.
Sustainability 2023, 15(20), 14882; https://doi.org/10.3390/su152014882
Submission received: 29 May 2023 / Revised: 2 October 2023 / Accepted: 11 October 2023 / Published: 15 October 2023

Abstract

:
In the context of global warming, the frequency and intensity of extreme weather and climate events have been increasing. Characterized by scarce water resources and fragile ecosystems, Northwest China has experienced a climate shift since the 1980s. In this study, spatial and temporal patterns of changes in the indices of climate extremes, based on daily maximum and minimum temperature and precipitation at 172 meteorological stations in Northwest China, were analyzed for the period 1960–2020. A total of 26 indices divided into two categories, 16 extreme temperature indices and 10 extreme precipitation indices, were used. Analysis of these indices revealed a general warming trend in the region, which consistent with global warming. The regional occurrence of summer days, tropical nights, growing season length, warm nights, warm days, and warm spell duration index increased by 0.22, 0.14, 0.29, 0.73, 0.46, and 0.11 days/decade, respectively. Over the same period, the occurrence of frost days, icing days, cool nights, cool days, and cold spell duration index decreased by −0.38, −0.21, −0.93, −0.44, and −0.13 days/decade, respectively. The decreasing trends in cold extremes were greater than the increasing trends in warm extremes. Additionally, many regions have experienced increasing trends in several precipitation indices. The annual total wet-day precipitation increased by 5.3 mm/decade. Increasing trends were also evident in simple daily intensity index, heavy precipitation days, very heavy precipitation days, very wet days, and extremely wet days. Consecutive dry days decreased by −1.5 days/decade, while no significant change was observed in consecutive wet days. In contrast to the remarkable spatial consistency of temperature extremes, precipitation extremes exhibited large and expected spatial variability. Most precipitation indices showed increasing trends in the western region of Northwest China and decreasing trends in the eastern part of Northwest China. These results indicate a transition from cold–dry to warm–wet in Northwestern China. Our findings suggest that Northwest China is experiencing more extreme climate events, which could consequently impact hydrological processes, ecological processes, and human health. These observations increase our understanding of the interactions between climate change and regional climate variability, which is conducive to improving disaster prevention.

1. Introduction

In recent decades, global climate has undergone tremendous changes with the growth of population and the rapid development of society. The Sixth Assessment Report of the Intergovernmental Panel on Climate Change (IPCC AR6) indicated that the average global air temperature between 2001 and 2020 increased by 0.99 °C compared with that during 1850–1900, and the temperature even increased by 1.09 °C during 2011–2020 [1]. Climate change is an urgent and presumably irreversible threat to human life and the planet [2,3,4]. A major concern with climate change is that extreme events will become more prominent with time [5,6]. It is widely accepted that extreme weather and climate events will impact the natural environment and humans profoundly [7]. For example, extreme precipitation events, heat waves, or prolonged dry periods cause extensive infrastructure and resource losses, posing a significant danger to human life, and have adverse effects on ecosystems, agriculture, industries, as well as cultural heritage [8,9,10,11,12,13]. Our ability to mitigate extreme climate events is vital for ensuring economic development and adequate living conditions for future generations.
We live in a world increasingly affected by climate change. It is imperative that we take immediate actions to address climate change and its significant implications, as emphasized by the UN Sustainable Development Goal 13. If we fail to take prompt decisive measures, the temperature will continue to rise and soon exceed the Paris Agreement targets of 1.5 °C, and even potentially 2 °C. Inaction also results in intensifying heatwaves, droughts, flooding, wildfires, sea-level rise, and famine. Mr. António Guterres, Secretary-General of the UN, has stated that “Climate action is the 21st century’s greatest opportunity to drive forward all the Sustainable Development Goals”. Therefore, it is imperative to gather more data regarding climate change from different countries and regions to make impactful decisions. Extreme climate events caused by climate change have been analyzed from regional [14,15,16,17,18,19,20] to global scales [21,22,23,24]. Regarding temperature extremes, there is a significant upward trend in nearly all regions. However, changes in precipitation extremes are spatially inconsistent with few statistically significant trends. Over the past century, the average climatic state and frequency of extreme climatic events have changed significantly in China [25,26,27,28,29,30]. Through the analysis of extreme climate events at the regional level, we can identify indicators contributing to environmental issues and extract valuable insights to formulate reasonable countermeasures.
Northwest China is located in the hinterland of Eurasia. It is a typical arid and semi-arid zone characterized by an extreme sensitivity to climate change and a fragile ecosystem [31]. Previous studies have suggested that as global warming accelerated, precipitation and temperature increased at the rates of 0.55 mm/year and 0.034 °C/year, respectively, in Northwest China from 1960 to 2013. The temperature increased faster than the national (0.025 °C/year) and the global (0.013 °C/year) averages during 1960–2010 [32,33]. The climate in Northwest China has changed from warm–dry to warm–wet. And this change also took place around 1986 [34]. In addition, the majority of prior research regarding extreme climate events in this region has shown that extreme climate events, such as storms and droughts, are becoming more frequent due to inhomogeneous precipitation [16,28,29,35,36,37]. Whether the climatic extremes have changed in accordance with the changes of the average temperature and precipitation remains to be studied. Then, an in-depth research of changes in climate extremes is crucial to better comprehend the regional responses to extreme climate events in arid zones, within the context of global change. Therefore, a more comprehensive assessment of the inhomogeneous spatiotemporal distribution of climate events and their potential causes and effects in Northwest China is required. This can provide a scientific basis for dealing with floods and droughts, protecting agricultural production, as well as formulating strategies to address climate risks.
This study aimed to quantify the changes in temperature and precipitation extremes between 1960 and 2020 in Northwestern China by analyzing the spatial and temporal variability of the changes in indices generated by the Commission for Climatology (CCl)/Climate Variability and Predictability (CLIVAR)/Joint WMO-IOC Technical Commission for Oceanography and Marine Meteorology (JCOMM) Expert Team (ET) on Climate Change Detection and Indices (ETCCDI) (http://cccma.seos.uvic.ca/ETCCDI accessed on 16 January 2023). We analyzed the spatial and temporal variability of the changes in these indices. Additionally, we addressed the possible reasons for such shifts in climate extremes and their effects.

2. Materials and Methods
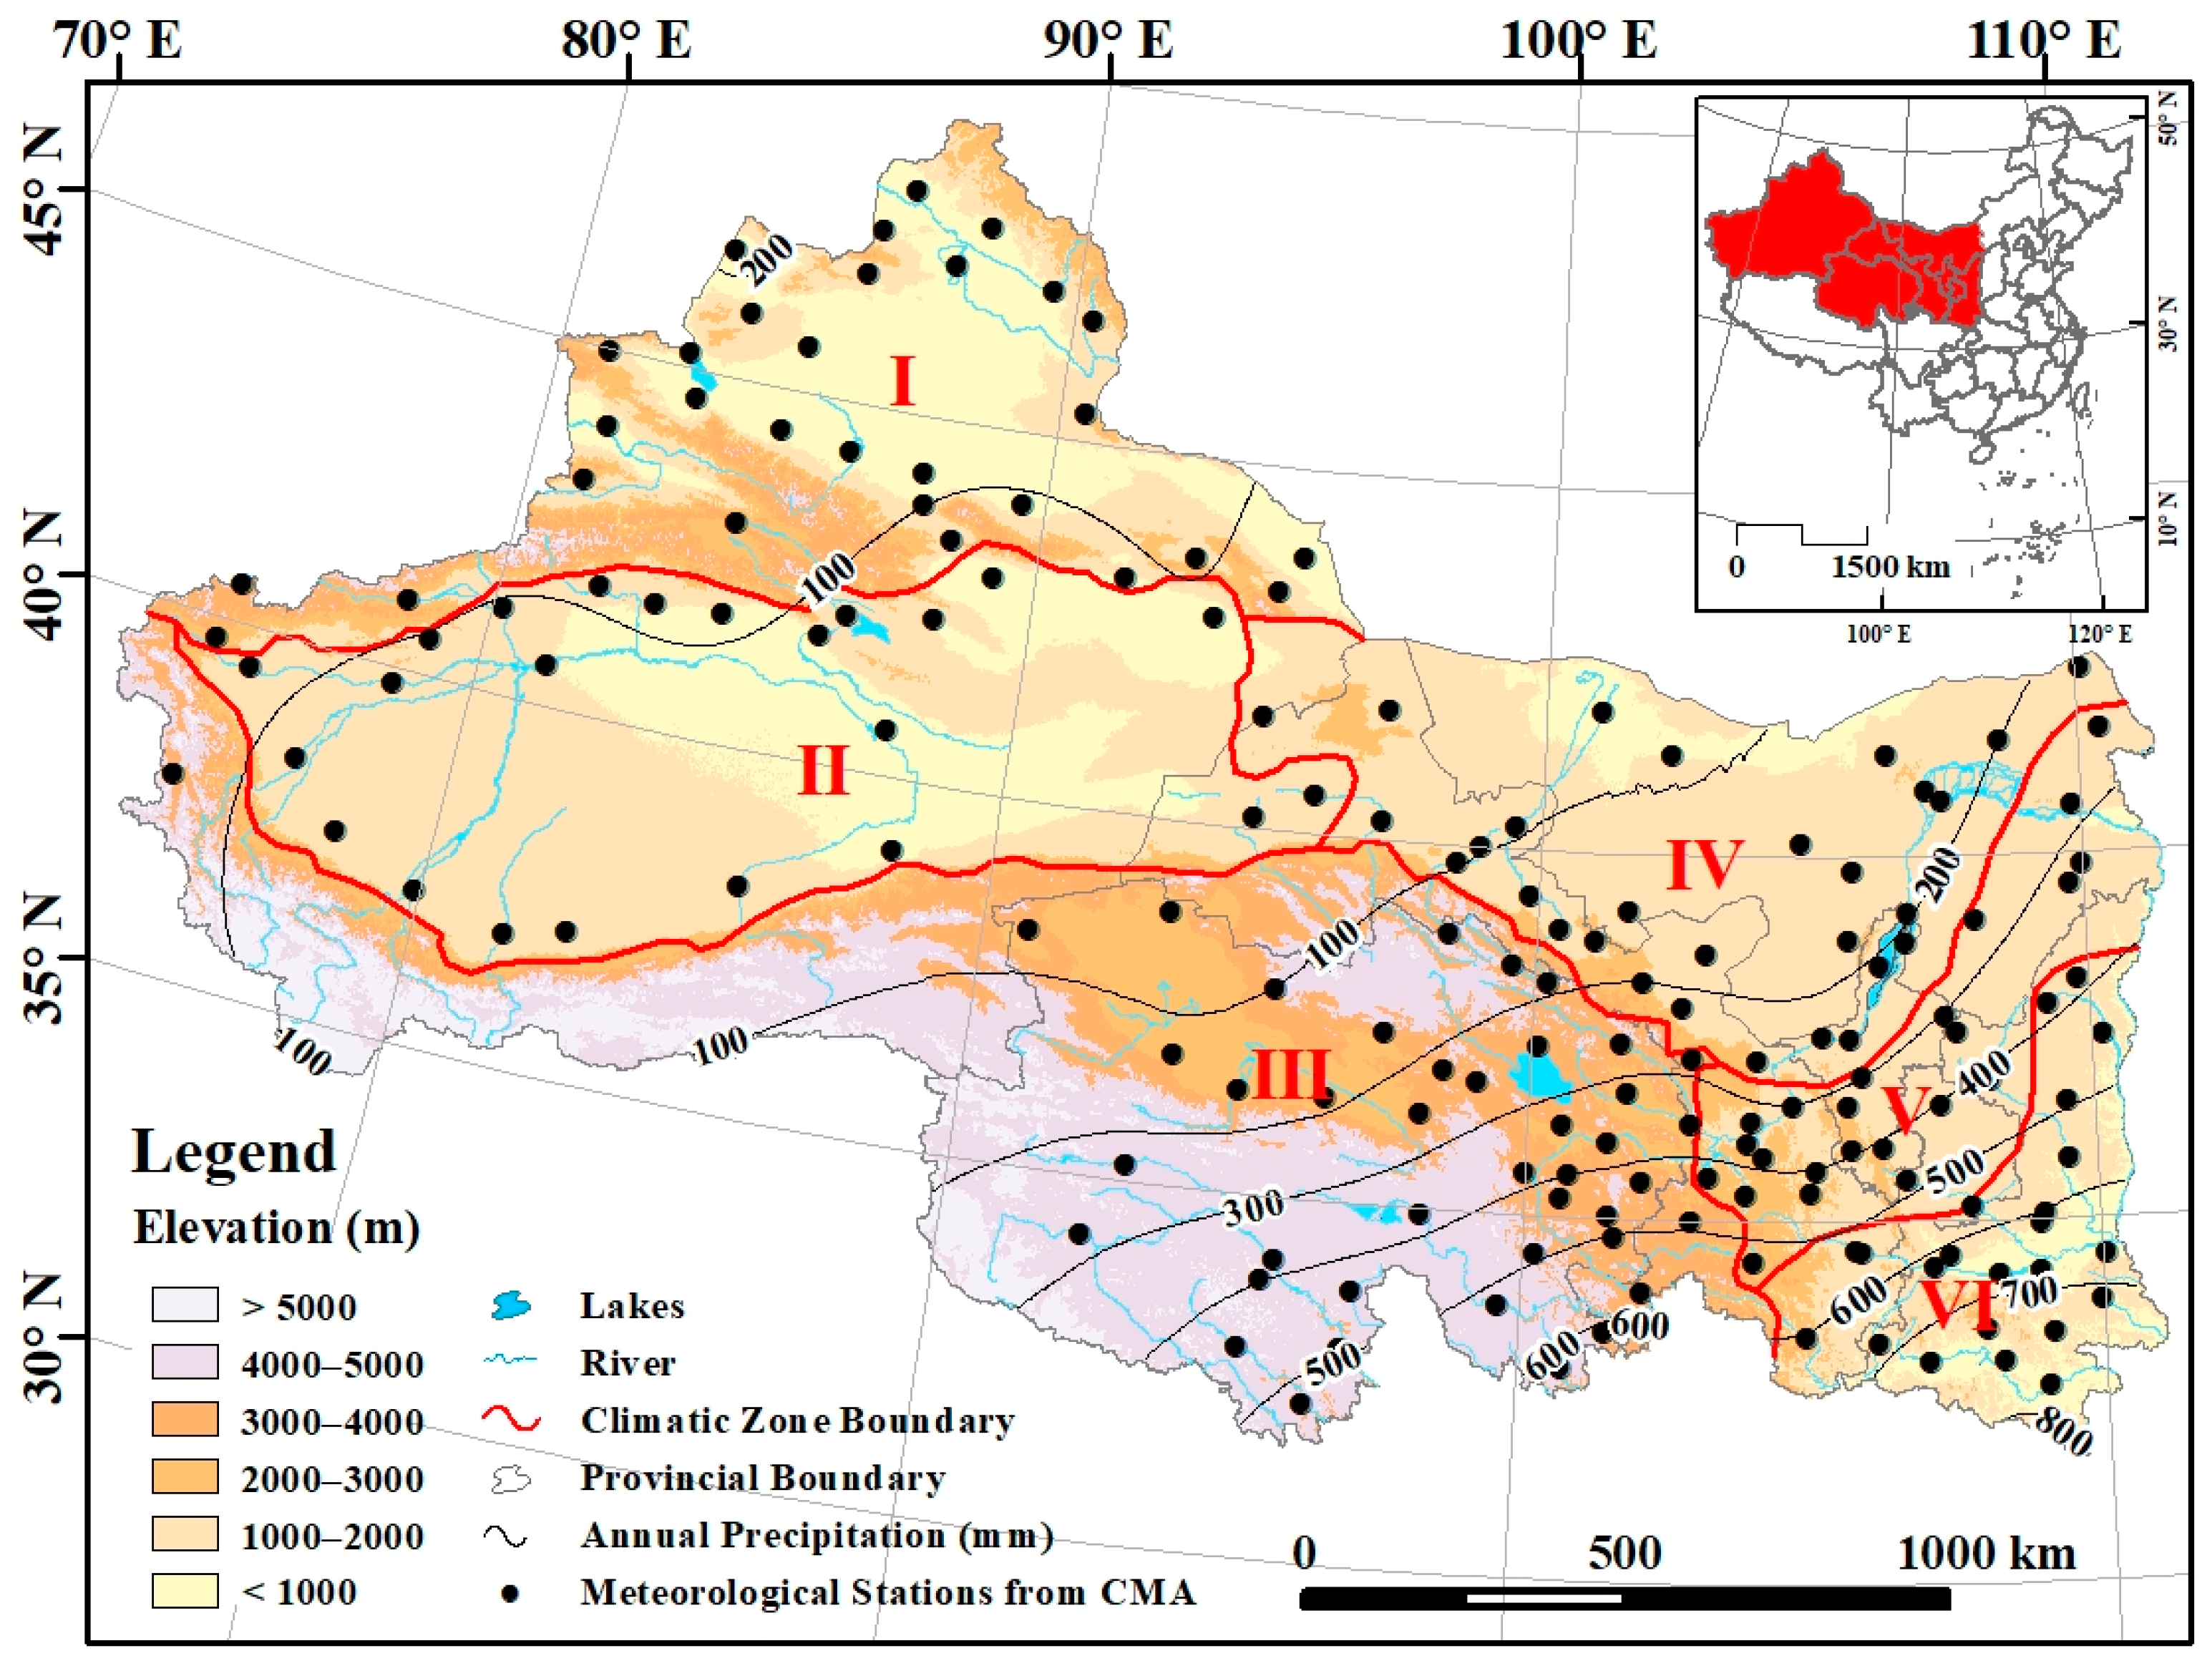
2.1. Study Area

Northwestern China, with an area of 3.53 × 10⁶ km2, includes the Xinjiang Uygur Autonomous Region, Qinghai, the Ningxia Hui Autonomous Region, Gansu, Shaanxi, and the western part of Inner Mongolia (Figure 1). Except for the southeastern part, which is a monsoon climate region, this area has a typical inner-continental climate with minimal influence of the East Asian Monsoon. The high mountains block the atmospheric circulation and form a series of vast desert basins in the rain shadow and other endorheic drainage basins. Consequently, low precipitation, low humidity, and wide ranges of temperatures characterize the climate in this area [38]. The annual precipitation is less than 50 mm in more than one third of the area, and the regional annual precipitation decreases from 800 mm in the southeast to 200 mm in the northwest. According to Zheng et al., Northwest China is divided into six climatic zones: Northern Xinjiang (zone I), Southern Xinjiang (zone II), Qinghai–Tibet Plateau (zone III), Hexi Corridor and western inner Mongolia (zone IV), semi-arid region (zone V), and sub-humid region (zone VI) [39].

2.2. Data Used and the Quality Examination

The daily precipitation, maximum temperature, and minimum temperature in Northwestern China were obtained from the National Climate Center, China Meteorological Administration (CMA) (http://data.cma.cn/, accessed on 12 December 2021). Most of the meteorological stations were progressively established from the 1950s onwards. To ensure the comparability of the time series data, we selected datasets from 1960 to 2020 and eliminated the sparse data available in the earlier years. The quality control of this dataset has been performed (e.g., internal consistency checks, spatial and temporal consistency checks or artificial checks) [40]. Additionally, these station observations underwent a series of quality tests to identify obvious problems and remove suspicious values [41,42,43]. This included the following:
  • Statistical outliers (based on multiples of the inter-quartile range);
  • Days where minimum temperature exceeds maximum temperature;
  • Unlikely large changes in temperatures between days (when minimum or maximum temperatures change by 20 °C or more);
  • More than 10 days with the same (nonzero) precipitation or identical temperatures;
  • Uncommonly precipitation and temperature values (precipitation less than zero or greater than 200 mm; temperatures higher than 50 °C).
The missing values and stations with too many missing values were screened out prior to analysis. If a station record contained more than 10% missing daily values in a year or contained more than 20% missing daily values over three months, the whole year was considered missing. Only stations with over 50 years of non-missing data were retained. For a few stations with missing temperature data for individual years, a linear correlation was used to interpolate between them to ensure their integrity and continuity. The final 172 meteorological stations available for the temperature annual indices after quality control and selection are shown in Figure 1.

2.3. Data Analysis

In order to detect changes in climate extremes, it is important to develop a set of indices that are statistically robust, cover a wide range of climates, and have a high signal-to-noise ratio. Thus, different, though sometimes overlapping, sets of indices have been developed in response to different objectives [44]. Among them, a suite of indices recommended by the World Meteorological Organization (WMO)’s Expert Team on Climate Change Detection and Indices (ETCCDI, http://etccdi.pacificclimate.org/list_27_indices.shtml, accessed on 16 January 2023) were widely used to evaluate many aspects of extreme temperature and precipitation events, including change in intensity, frequency, and duration. An important advantage of the ETCCDI indices has been the ability to combine regional information into a global product [45,46,47].
In this study, 16 extreme temperature indices (Table 1) and 11 extreme precipitation indices (Table 2) devised by the ETCCDI were utilized. These indices can be divided into two types: absolute indices and relative thresholds. For percentile indices, a 30-year climatological normal (1981–2010) was used as the base period. It has been shown that inhomogeneities exist at the boundaries of the climatological base period used to compute the thresholds for percentile indices, i.e., TN10p, TN90p, TX10p, and TX90p, due to sampling uncertainty [48]. Therefore, a bootstrapping method proposed by Zhang et al. was used to compute the indices analyzed in this paper [48]. The bootstrap procedure removes the inhomogeneities and thus eliminates possible bias in the trend estimation of the relevant indices. However, for stations at higher altitudes, summer days and tropical nights do not exist, and the growing season length was irrelevant to the Wudaoliang station in Qinghai Province. For all other stations, we calculated all the extreme climate indices by using MATLAB v. 9.1 (MathWorks, Natick, MA, USA).
Linear trends in the time series of each index at each meteorological station across the study period were extracted using the least-squares likelihood method. This trend is defined as the linear regression coefficient. All regional series were converted into trends per decade when describing the linear regression trends. The correlation coefficient method was used to evaluate the significance of the trend, and 5% significance level was selected to determine whether a trend was statistically significant [49]. Spatial distribution maps of extreme events were illustrated using ArcGIS for variation analysis.

3. Results

As shown in Table 3, the significant negative, nonsignificant, and significant positive trends for indices of climate extremes are summarized. Each indicator was evaluated according to the consistency of the trend direction and the proportion of stations showing this trend. Table 4 shows the average values of each indices at different climatic zone.

3.1. Temperature

3.1.1. Warm Extremes (SU, TR, GSL, TN90p, TX90p, and WSDI)

As shown in Table 3, the indices of warm extremes increased significantly at 55.8% to 97.1% of the stations.
The spatial distribution of decadal trends for the warm extremes indices is presented in Figure 2, and the range of trends in different climatic zone is shown in Figure 3. For the summer days (SU), 79% of the total stations showed significant increasing trends (Figure 2a). Several stations located in zones V and VI exhibited large trends (Figure 3). Similarly, increasing trends were observed on tropical nights (TR); 78.4% of stations, mainly located in Zone I and eastern climatic zones, had a significant upward trend at the 5% level (Figure 2b and Figure 3). The growing season length (GSL) results indicated that 99.4% of stations had a positive trend, with 81.9% of the stations showing a significant trend (Figure 2c and Figure 3). Furthermore, some indices showed significant increases at almost all stations, including warm nights (TN90p) and warm days (TX90p) (Figure 2d,e). There was little variation in range of trends for TN90p and TX90p between different zones (Figure 3). For the warm spell duration index (WSDI), approximately 55.8% of stations exhibited significantly increasing trends. Spatially, stations distributed in zone II and the Yellow River Basin displayed a significantly positive trend and zone I had the largest range of trend (Figure 2f and Figure 3).
The annual regionally averaged series for indices of warm extremes during 1960–2020 are provided in Figure 4. All warm extreme indices (i.e., SU, TR, GSL, TN90p, TX90p, and WSDI) displayed an increasing trend in Northwestern China. Figure 4a shows that SU experienced a rapid increase from the mid-1990s to 2010 and had a trend of 0.22 days/decade with significance at the 0.001 level. In terms of different climatic zones, SU in zone I was 151 days, which was longer than other zones. The regional average tropical nights (TR) was 11.5 days, of which the maximum was 31 days in zone VI (Table 4). It changed less before the mid-1990s and then a significant increase from 1993 onwards (Figure 4b). Moreover, the regional trend in GSL increased at a rate of 0.29 days/decade (p < 0.001), which maintained fluctuating variations until the late 1980s and drastically increased thereafter (Figure 4c). Both zone II and zone VI had a long GSL, but there is little precipitation in zone II (Table 4). The regional averaged trend in TN90p and TX90p increased at a rate of 0.73 and 0.46 days/decade (p < 0.001), respectively (Figure 4d,e). The WSDI displayed a slightly decreasing trend before the mid-1990s, but it increased rapidly thereafter. The regional trend for WSDI was 0.11 (p < 0.001) days/decade (Figure 4f). The average values of TN90p, TX90p, and WSDI varied little by regions (Table 4).

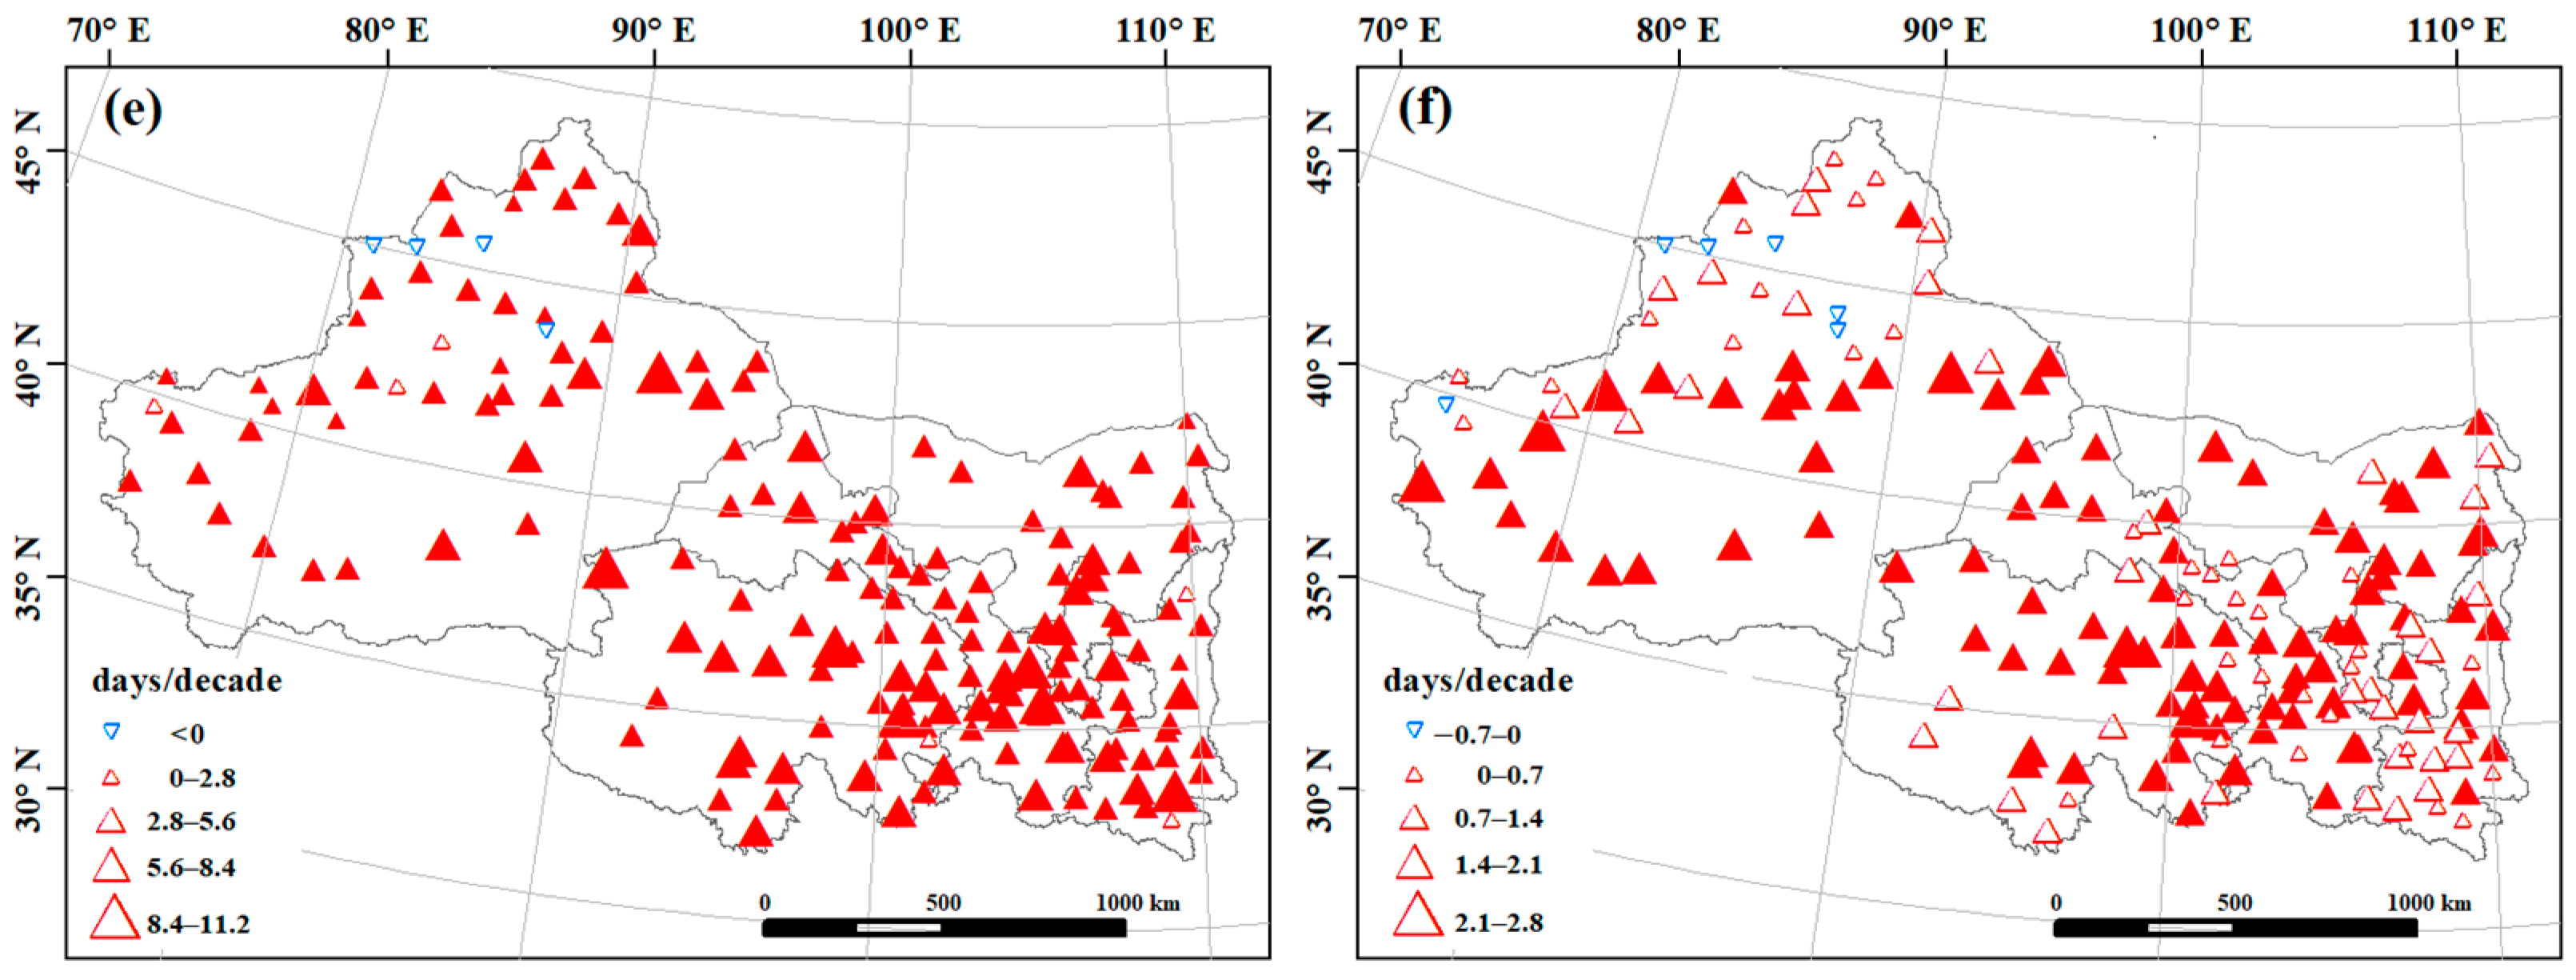
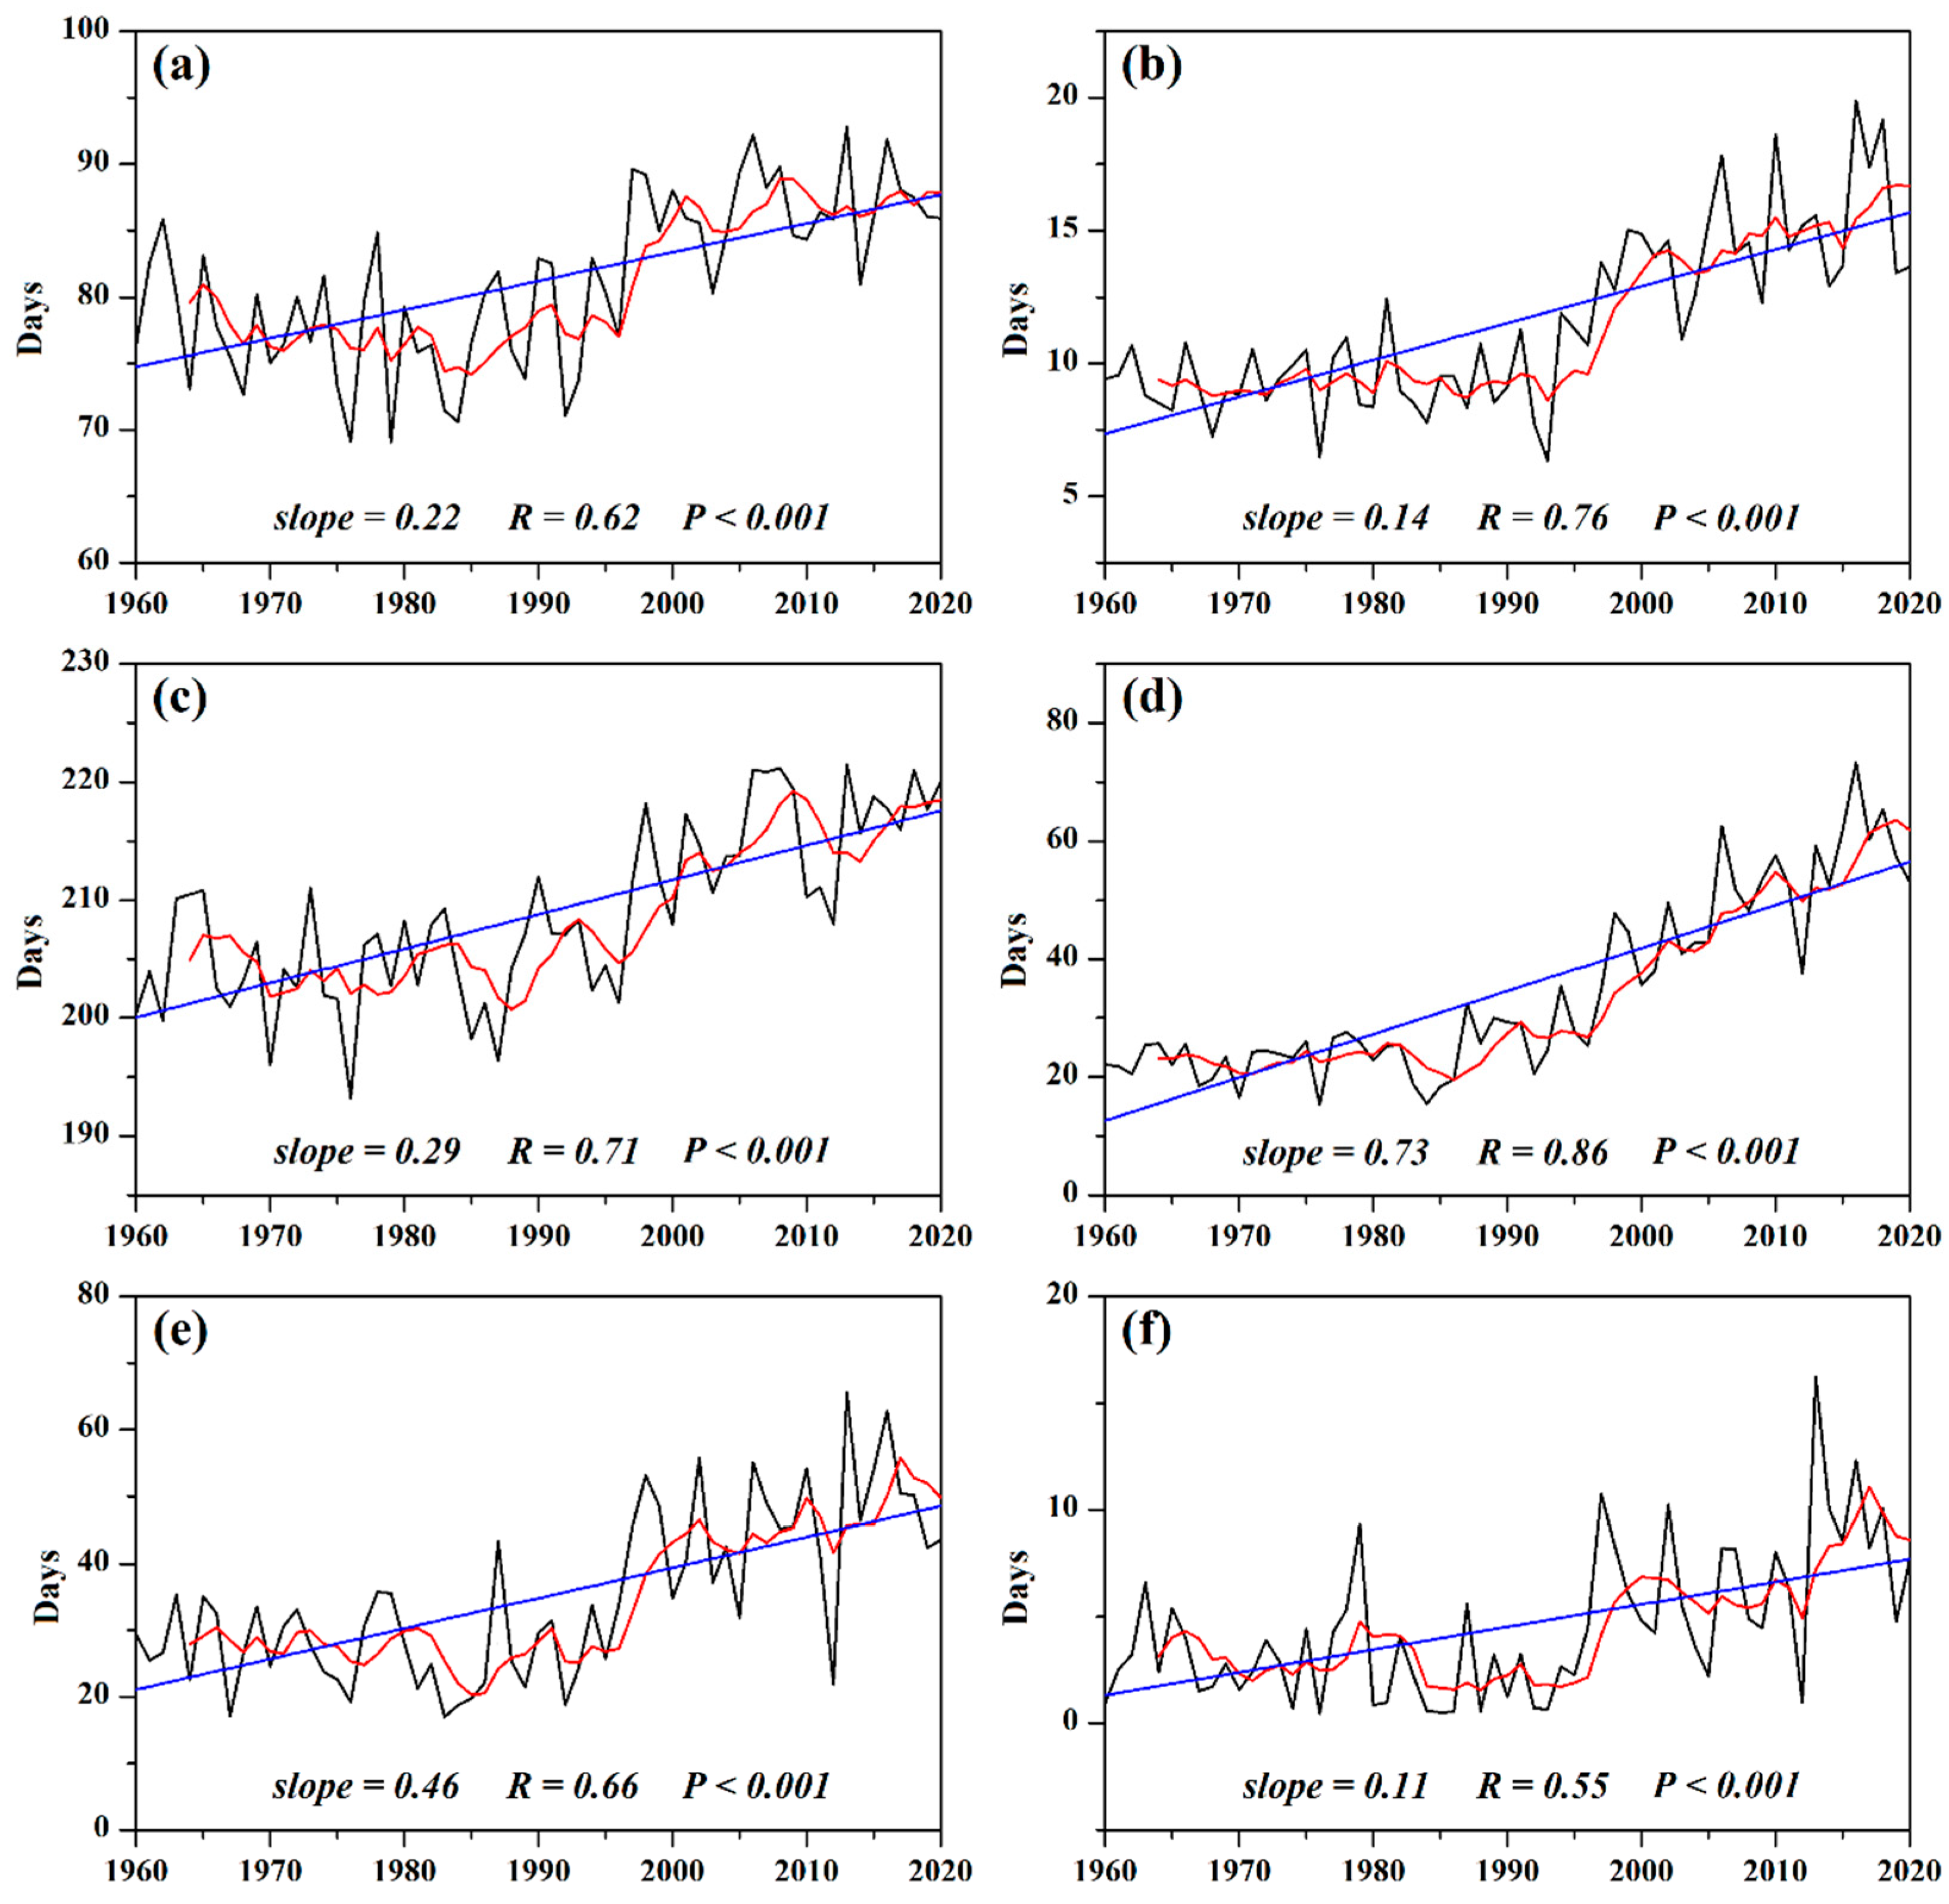
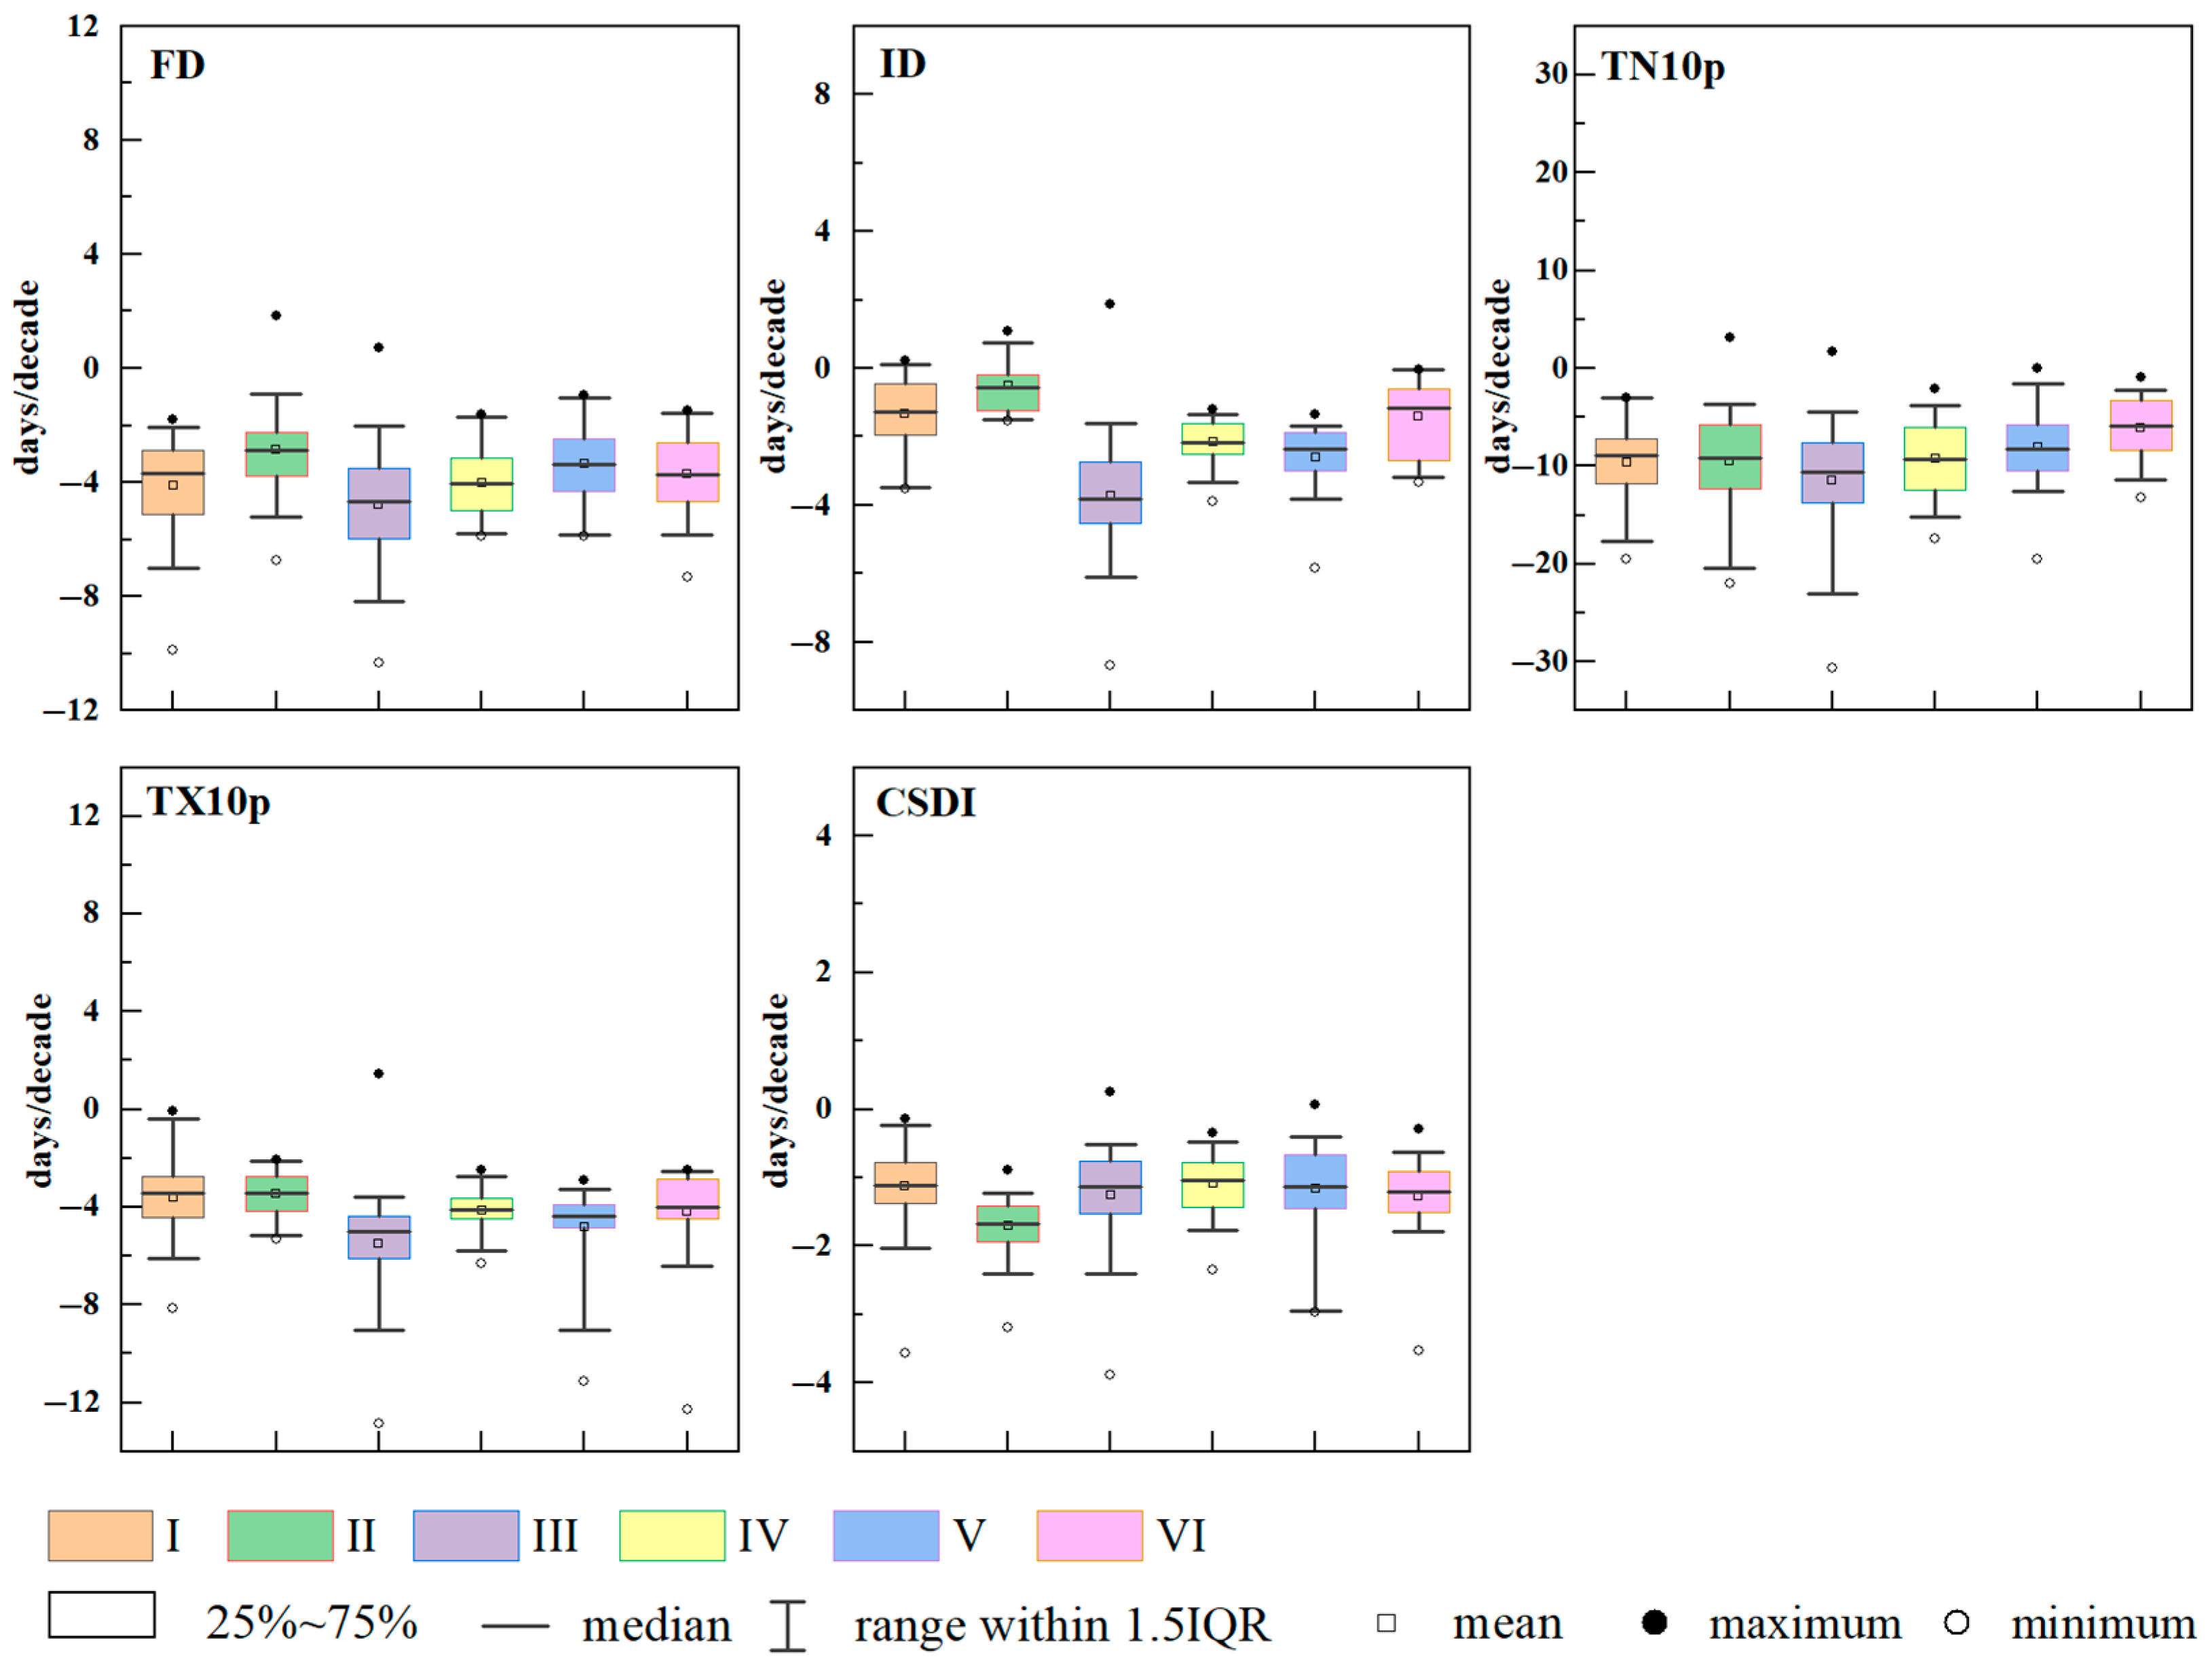
3.1.2. Cold Extremes (FD, ID, TN10p, TX10p, and CSDI)

In the last 61 years, nearly all stations in Northwestern China displayed decreasing trends for the cold extreme indices (Table 3 and Table 5). For the frost days (FD), 98.3% of the stations showed decreasing trends, of which 93.6% were significant. The stations in zone III had larger trend magnitudes (Figure 5a and Figure 6). Decreasing trends in icing days (ID) were observed for 95.9% of stations, with 58.1% being significant. The stations that did not show a significant trend were mainly distributed in the Xinjiang Uygur Autonomous Region (Figure 5b). For different climatic zones, except for zone III, the range of trends were all small (Figure 6). For cool nights (TN10p) and cool days (TX10p), there was a decreasing trend at 97.7% and 99.4% of the stations, respectively. The largest changes were observed in zone III and zone V (Figure 6). As for the cold spell duration index (CSDI), 98.8% of stations exhibited decreasing trends, with 50.6% showing significance, mainly in the eastern part of the region (Figure 5e). Zone V showed the largest range of trends (Figure 6).
Unlike those of warm extremes, indices of cold extremes showed significant declines (Figure 6). The regional annual trend series for FD was −0.38 days/decade (p < 0.001) with fluctuations before the late 1980s, followed by a remarkable decrease (Figure 7a). Zone III had a much longer FD than other zones (Table 4). The regional average ID was 52 days, of which the maximum was 93 days in zone I and the minimum was 15 days in zone VI (Table 4). It showed a fluctuating decreasing trend of −0.21 days/decade (Figure 7b). TN10p and TX10p showed decreasing trends with similar functions, especially in the 1970s and 2000s. These two indices had regional trends of −0.93 and −0.44 days/decade, respectively (Figure 7c,d). The regional average values varied between 38 and 45 days (Table 4). The CSDI decreased significantly by −0.13 days/decade. Overall, the fluctuation with decreasing trends was predominant before the 2000s, while there was a slightly increasing trend thereafter (Figure 7e). The values in different zones were relatively small, with a regional average of 6 days (Table 4).

3.1.3. Extremal Indices and Diurnal Temperature Range

The inter-annual trends for extremal indices and diurnal temperature ranges during 1960–2020 are presented in Table 5. During the past 61 years, all extremal indices (i.e., TXx, TNx, TXn, and TNn) exhibited an obvious increase throughout the year. The TNx and the TNn exhibited a significant increase throughout the year, with the largest increase in February. In contrast, the TXx and the TXn showed a slight increase, which was mainly attributed to an obvious and significant increase during spring and winter. The daily temperature range (DTR) displayed decreasing trends throughout the year, with the largest decrease in January and June and the smallest in spring and autumn. The decrease in DTR was mainly due to more obvious increases in the minimum temperatures than those at the maximum temperatures.

3.2. Precipitation

The spatial distribution of the decadal trends of extreme precipitation indices (Figure 8) indicate that there were increased trends in precipitation indices in most areas, except for consecutive dry days (CDD). A small fraction was statistically significant (Table 3).
For the annual total wet-day precipitation (PRCPTOT), approximately 80% of stations exhibited increases, occurring in most of the Northwest China, while the other 20% of stations showed decreasing trends, mostly located in zone VI (Figure 8a and Figure 9). The simple daily intensity index (SDII) was observed to increase at 82% of stations, with 12.2% having significant increases at the 5% level (Figure 8b). Zone I had a larger range of trends than the other zones (Figure 9). As a result, precipitation events have been intensifying throughout the region. About 77.3% of stations indicated an increase in heavy precipitation days (R10mm), and the distributions are similar to those of PRCPTOT (Figure 8c and Figure 9). Similarly, the number of very heavy precipitation days (R20mm) increased at approximately 71.9% of the stations. In contrast, the R20mm displayed very few significant trends and no clear spatial trends (Figure 8d). The range of trends in zones V and VI were relatively large (Figure 9). For very wet days (R95p) and extremely wet days (R99p), 81.5% and 76.2% of the stations showed increasing trends, respectively. However, only 13% of R95p and 7% of R99p were significant at the 5% level (Figure 8e,f). The few stations with decreasing trends were mainly concentrated in zone V (Figure 9). Nearly 47.1% of the stations showed decreasing trends for consecutive wet days (CWD), while stations in the southeastern part had larger trend magnitudes (Figure 8g and Figure 9). Conversely, there was a declining trend in CDD at 83.1% of the stations (Figure 8h). There was a small range of trends in zone II and zone IV zone. According to the distribution characteristics, dry spells shortened for most stations over time, while wet spells lengthened.
Figure 10 shows the annual regionally averaged time series of the precipitation indices. PRCPTOT showed greater trend magnitudes, with an increasing trend of 5.3 mm/decade. In the early 1980s, it showed a decreasing trend but has since begun to increase since the mid–late 20th century onwards (Figure 10a). From the average of each region, zone II had the least PRCPTOT of 51.2 mm, and zone VI has the most PRCPTOT of 624.8 mm (Table 4). In Figure 10b, SDII displays a statistically significant increasing trend of 0.07 mm/day per decade. Both R10mm and R20mm have increased by 0.2 days/decade and 0.1 days/decade, respectively. Consistent with the growth trend of PRCPTOT, from the 1980s to the 2000s, there was a decreasing trend and then an increase after the 2000s (Figure 10c,d). R95p and R99p also increased, but their magnitude and range differed. A consistent increase has been observed since the 1990s (Figure 10e,f). CWD and CDD differed across the region. A decrease of −1.5 days/decade in CDD was found, but no significant changes were observed in CWD (Figure 10g,h).
The inter-annual trends in other precipitation indices during 1960–2020 are shown in Table 6. The RX1day increases for nine months in a year, with the largest increase occurring in June at the rate of 0.8 mm/decade. The RX5day also showed the highest increase in June at the rate of 1.4 mm/decade. Conversely in October, a rate of −0.1 mm/decade decrease was observed. However, for RX1day and RX5day, most changes were not obvious, and only a few individual months showed statistical significance.

4. Discussion and Conclusions

This study examined changes in extreme climate indices over Northwestern China from 1960 to 2020 using indices developed by the joint CCl/CLIVAR/JCOMM ETCCDI. Due to the unique geographical location and physiographic characteristics, northwest China is particularly vulnerable to global warming. Analyzing the variability of extreme climate indices, which is used to define extreme climate events, demonstrates the general premise that regional climate dynamics is associated with the broader global climate change, and contributes to a deeper understanding of the complex interactions between them [50].
According to the results, asymmetrical changes in extreme temperature events is exhibited by both cold and warm extremes. Specifically, the cold extremes decreased significantly, while the warm extremes increased. Meanwhile, changes in cold extremes are more apparent than changes in warm extremes, in agreement with previous studies [51,52,53]. The diurnal temperature range was revealed to have decreased as a result of the larger increase in minimum temperature than in maximum temperature. In this case, anticyclonic circulation and abnormally high-pressure systems might be responsible for these changes [54,55]. A rise in temperature results in a longer growing season length. Although this might benefit ecological processes in Northwestern China, it can also negatively impact its hydrologic cycle [56,57]. Spatially, the extreme temperature indices changed more rapidly in the eastern part of Northwest China than in the western part. Despite regional variation, in general, all warm extremes showed significant positive trends, while all cold extremes showed significant negative trends across the past 61 years.
The reasons for the change in maximum temperature extremes are related to the surface albedo, latent heat flux, and cloud cover [58,59]. Studies have shown that significant decreases in cloud cover and surface albedo contribute to maximum temperature extremes [60,61]. Conversely, an increase in aerosols and changes in land surface contributed to minimum temperature extremes. Based on model simulations, land use change due to urbanization can intensify and expand areas experiencing extreme temperatures, but it primarily affects night temperatures [62]. Additionally, northern oscillation, North Pacific oscillation, and southern oscillations in North China also contribute to the changes in extreme temperatures [63].
Regarding precipitation, all extreme indices, except CDD, showed increasing trends for many of the regions across Northwestern China from 1960 to 2020, suggesting wetter conditions. It is consistent with the conclusions of previous studies on the “warming-wetting” trend in Northwestern China [34,64]. To some extent, this can alleviate droughts that frequently occur in Northwestern China, but it cannot change the natural water shortage in the region. Heavy rain also increased the frequency and intensity of hydrological events [65,66]. The pattern of extreme precipitation changes, however, is a complex process that affects both regional atmospheric circulation and local environmental conditions. Researchers have investigated the possible causes of the change in precipitation patterns in different parts of Northwest China [67]. For example, in the Qaidam Basin, the western circulation at mid-latitudes affects the precipitation in spring and winter [68]. And in the Qilian Mountains, the dryness/wetness conditions are affected by the East Asian summer monsoon [69]. There is also a significant increase in precipitation in Northwest China due to regional atmospheric circulations, such as the strengthening of the West Pacific Subtropical High (WPSH) and North America Subtropical High (NASH) [70]. Furthermore, a teleconnection between the El Niño–Southern Oscillation (ENSO) and the dryness/wetness conditions in Northwest China may also exist [71].
As a result of inhomogeneities in meteorological data, our results were uncertain [72,73]. For example, in the desert hinterlands and western Qinghai, due to the low density of stations, there is considerable uncertainty in that area. Future climate scenario data simulated by high resolution regional climate models may also be useful in analyzing and projecting future changes in extreme climate events. In addition, whether high elevations around the global have been warming faster or slower than nearby lower elevations or global averages is an inconclusive question [53,74]. Thus, the relationships between climate extremes and elevation still need further study. Meanwhile, non-climatic shifts, such as station relocations, instrument changes, and urbanization, can also cause inhomogeneity in meteorological series data [75,76,77,78,79], and further adversely affects the assessment and attribution of climate change.
Overall, there will be an increase in extreme weather events and increasingly devastating consequences in the changing climate. Thus, rapid concerted actions must be taken to mitigate climate change and adapt to its unavoidable consequences. The 2030 Agenda for Sustainable Development, “calls for the widest possible international cooperation aimed at accelerating the reduction in global greenhouse gas emissions and addressing adaptation to the adverse impacts of climate change”. To combat climate change and its impacts by 2030, urgent and transformative action is needed to meet the commitments under the Paris Agreement through mitigation and adaptation efforts. Our results provide scientific knowledge that is relevant to policy and decision makers for formulating strategies to address hazardous disasters and extreme events. It is also beneficial for improving the monitoring and early warning of droughts and flood disasters for achieving early detection and early prevention. Further research is needed to better understand how organizations can build capacities to learn and adapt after experiencing extreme events, an action especially important for economically underdeveloped areas where resources are limited. In addition, it is imperative to strengthen education and public awareness on climate change, aid the public to recognize the severity of climate change, and increase the climate budget allocated and mobilized by developed countries or regions towards developing countries or regions.

Author Contributions

Conceptualization, X.L. (Xiaoyan Liang) and Z.N.; data curation, X.L. (Xiaoyan Liang) and Z.N.; formal analysis, X.L. (Xiaoyan Liang); funding acquisition, X.L. (Xiaoyan Liang), and X.L. (Xiaolong Li); investigation, Z.N.; methodology, Z.N.; project administration, X.L. (Xiaoyan Liang); software, Z.N.; supervision, X.L. (Xiaoyan Liang) and X.L. (Xiaolong Li); validation, X.L. (Xiaoyan Liang) and X.L. (Xiaolong Li); visualization, Z.N.; writing—original draft, X.L. (Xiaoyan Liang) and Z.N.; writing—review and editing, Z.N. and X.L. (Xiaolong Li). All authors have read and agreed to the published version of the manuscript.

Funding

This research was funded by the Key R&D Program of Shaanxi Province “key industry innovation chain (group)” (No. 2020ZDLNY06-02), Think Tank Connotation Construction Project of Shaanxi Educational Committee (No. 21JT024), and New Urbanization and Human Settlement in Shaanxi Province Foundation (No. 2021SCHZ07).

Institutional Review Board Statement

Not applicable.

Informed Consent Statement

Not applicable.

Data Availability Statement

The data of weather station in Northwestern China are available from the National Climate Center, China Meteorological Administration (CMA) website.

Acknowledgments

The authors thank the National Climate Central, China Meteorological Administration, for providing meteorological data for this study.

Conflicts of Interest

The authors declare no conflict of interest.

References

  1. IPCC. Climate Change 2021: The Physical Science Basis. In Contribution of Working Group I to the Sixth Assessment Report of the Intergovernmental Panel on Climate Change; Cambridge University Press: Cambridge, UK, 2021. [Google Scholar]
  2. Chang, C.J.; Huang, C.P.; Chen, C.Y.; Wang, G.S. Assessing the potential effect of extreme weather on water quality and disinfection by-product formation using laboratory simulation. Water Res. 2020, 170, 115296. [Google Scholar] [CrossRef] [PubMed]
  3. Deere, D.; Leusch, F.D.L.; Humpage, A.; Cunliffe, D.; Khan, S.J. Hypothetical scenario exercises to improve planning and readiness for drinking water quality management during extreme weather events. Water Res. 2017, 111, 100–108. [Google Scholar] [CrossRef] [PubMed]
  4. Papalexiou, S.M.; Montanari, A. Global and Regional Increase of Precipitation Extremes Under Global Warming. Water Resour. Res. 2019, 55, 4901–4914. [Google Scholar] [CrossRef]
  5. Fischer, E.M.; Knutti, R. Anthropogenic contribution to global occurrence of heavy-precipitation and high-temperature extremes. Nat. Clim. Chang. 2015, 5, 560–564. [Google Scholar] [CrossRef]
  6. Karmalkar, A.V.; Bradley, R.S. Consequences of Global Warming of 1.5 °C and 2 °C for Regional Temperature and Precipitation Changes in the Contiguous United States. PLoS ONE 2017, 12, e0168697. [Google Scholar] [CrossRef]
  7. Katz, R.W.; Brown, B.G. Extreme Events in a Changing Climate: Variability Is More Important Than Averages. Clim. Change 1992, 21, 289–302. [Google Scholar] [CrossRef]
  8. Bencze, S.; Balla, K.; Varga, B.; Veisz, O. Effect of climate extremes on the grain yield and quality of cereals. Acta Agron. Hung. 2010, 58, 115–120. [Google Scholar] [CrossRef]
  9. Kumar, A.; Chen, M.; Hoerling, M.; Eischeid, J. Do extreme climate events require extreme forcings? Geophys. Res. Lett. 2013, 40, 3440–3445. [Google Scholar] [CrossRef]
  10. Manton, M.J. Trends in climate extremes affecting human settlements. Curr. Opin. Environ. Sustain. 2010, 2, 151–155. [Google Scholar] [CrossRef]
  11. Wang, X.; Qiu, B.; Li, W.; Zhang, Q. Impacts of drought and heatwave on the terrestrial ecosystem in China as revealed by satellite solar-induced chlorophyll fluorescence. Sci. Total Environ. 2019, 693, 133627. [Google Scholar] [CrossRef]
  12. Wuebbles, D.; Meehl, G.; Hayhoe, K.; Karl, T.R.; Kunkel, K.; Santer, B.; Wehner, M.; Colle, B.; Fischer, E.M.; Fu, R.; et al. CMIP5 Climate Model Analyses: Climate Extremes in the United States. Bull. Am. Meteorol. Soc. 2014, 95, 571–583. [Google Scholar] [CrossRef]
  13. Yang, J.; Yin, P.; Sun, J.; Wang, B.; Zhou, M.; Li, M.; Tong, S.; Meng, B.; Guo, Y.; Liu, Q. Heatwave and mortality in 31 major Chinese cities: Definition, vulnerability and implications. Sci. Total Environ. 2019, 649, 695–702. [Google Scholar] [CrossRef] [PubMed]
  14. Hu, J.; Yang, Z.; Hou, C.; Ouyang, W. Compound risk dynamics of drought by extreme precipitation and temperature events in a semi-arid watershed. Atmos. Res. 2023, 281, 1064774. [Google Scholar] [CrossRef]
  15. Robinson, W.A. Climate change and extreme weather: A review focusing on the continental United States. J. Air Waste Manag. Assoc. 2021, 71, 1186–1209. [Google Scholar] [CrossRef] [PubMed]
  16. Song, M.; Pei, Y.; Zhang, S.; Wu, T. Simulation Performance and Case Study of Extreme Events in Northwest China Using the BCC-CSM2 Model. Remote Sens. 2022, 14, 4922. [Google Scholar] [CrossRef]
  17. Thomas, T.S.; Schlosser, C.A.; Strzepek, K.; Robertson, R.D.; Arndt, C. Using a Large Climate Ensemble to Assess the Frequency and Intensity of Future Extreme Climate Events in Southern Africa. Front. Clim. 2022, 4, 787721. [Google Scholar] [CrossRef]
  18. Lucas, E.W.M.; Sousa, F.d.A.S.d.; Silva, F.D.d.S.; Rocha Júnior, R.L.d.; Pinto, D.D.C.; Silva, V.d.P.R.d. Trends in climate extreme indices assessed in the Xingu river basin—Brazilian Amazon. Weather Clim. Extrem. 2021, 31, 100306. [Google Scholar] [CrossRef]
  19. McGree, S.; Herold, N.; Alexander, L.; Schreider, S.; Kuleshov, Y.; Ene, E.; Finaulahi, S.; Inape, K.; Mackenzie, B.; Malala, H.; et al. Recent Changes in Mean and Extreme Temperature and Precipitation in the Western Pacific Islands. J. Clim. 2019, 32, 4919–4941. [Google Scholar] [CrossRef]
  20. Fan, Y.; Li, J.; Zhu, S.; Li, H.; Zhou, B. Trends and variabilities of precipitation and temperature extremes over Southeast Asia during 1981–2017. Meteorol. Atmos. Phys. 2022, 134, 78. [Google Scholar] [CrossRef]
  21. Xu, Z.; Chang, A.; Di Vittorio, A. Evaluating and projecting of climate extremes using a variable-resolution global climate model (VR-CESM). Weather Clim. Extrem. 2022, 38, 100496. [Google Scholar] [CrossRef]
  22. Coumou, D.; Rahmstorf, S. A decade of weather extremes. Nat. Clim. Change 2012, 2, 491–496. [Google Scholar] [CrossRef]
  23. Alexander, L.V.; Zhang, X.; Peterson, T.C.; Caesar, J.; Gleason, B.; Klein Tank, A.M.G.; Haylock, M.; Collins, D.; Trewin, B.; Rahimzadeh, F.; et al. Global observed changes in daily climate extremes of temperature and precipitation. J. Geophys. Res. Atmos. 2006, 111, D05109. [Google Scholar] [CrossRef]
  24. Frich, P.; Alexander, L.; Della-Marta, P.; Gleason, B.; Haylock, M.; Klein Tank, A.; Peterson, T. Observed coherent changes in climatic extremes during the second half of the twentieth century. Clim. Res. 2002, 19, 193–212. [Google Scholar] [CrossRef]
  25. Zhai, P.; Ren, F. On changes of China’s maximum and minimum temperatures in 1951–1990. Acta Meteorol. Sin. 1999, 13, 278–290. [Google Scholar]
  26. Chen, H.; Sun, J. Changes in climate extreme events in China associated with warming. Int. J. Climatol. 2015, 35, 2735–2751. [Google Scholar] [CrossRef]
  27. Yu, X.; Ma, Y. Spatial and Temporal Analysis of Extreme Climate Events over Northeast China. Atmosphere 2022, 13, 1197. [Google Scholar] [CrossRef]
  28. Liu, W.; Fu, Z.; Chen, X.; Qu, J.; Wang, J.; Peng, X. Inhomogeneity of precipitation and its influencing factors in Northwest China from 1961 to 2015. Theor. Appl. Climatol. 2019, 138, 1831–1844. [Google Scholar] [CrossRef]
  29. Wang, H.; Gao, T.; Xie, L. Extreme precipitation events during 1960–2011 for the Northwest China: Space-time changes and possible causes. Theor. Appl. Climatol. 2018, 137, 977–995. [Google Scholar] [CrossRef]
  30. Zhong, Y.; Yang, M.; Yuan, C. Temporal and Spatial Characteristics of Summer Extreme Precipitation in Eastern China and Possible Causalities. J. Geosci. Environ. Prot. 2020, 8, 36–46. [Google Scholar] [CrossRef]
  31. Gao, J.; Jiao, K.; Wu, S. Quantitative assessment of ecosystem vulnerability to climate change: Methodology and application in China. Environ. Res. Lett. 2018, 13, 094016. [Google Scholar] [CrossRef]
  32. Li, B.; Chen, Y.; Shi, X. Why does the temperature rise faster in the arid region of northwest China? J. Geophys. Res. Atmos. 2012, 117, D16115. [Google Scholar] [CrossRef]
  33. Yang, P.; Xia, J.; Zhang, Y.; Hong, S. Temporal and spatial variations of precipitation in Northwest China during 1960–2013. Atmos. Res. 2017, 183, 283–295. [Google Scholar] [CrossRef]
  34. Shi, Y.; Shen, Y.; Kang, E.; Li, D.; Ding, Y.; Zhang, G.; Hu, R. Recent and Future Climate Change in Northwest China. Clim. Change 2007, 80, 379–393. [Google Scholar] [CrossRef]
  35. Lu, S.; Hu, Z.; Yu, H.; Fan, W.; Fu, C.; Wu, D. Changes of Extreme Precipitation and its Associated Mechanisms in Northwest China. Adv. Atmos. Sci. 2021, 38, 1665–1681. [Google Scholar] [CrossRef]
  36. Wang, H.; Chen, Y.; Chen, Z. Spatial distribution and temporal trends of mean precipitation and extremes in the arid region, northwest of China, during 1960–2010. Hydrol. Process. 2013, 27, 1807–1818. [Google Scholar] [CrossRef]
  37. Wu, P.; Ding, Y.; Liu, Y.; Li, X. The characteristics of moisture recycling and its impact on regional precipitation against the background of climate warming over Northwest China. Int. J. Climatol. 2019, 39, 5241–5255. [Google Scholar] [CrossRef]
  38. Liu, C.; Chen, Y.; Xu, Z. Eco-hydrology and sustainable development in the arid regions of China. Hydrol. Process. 2009, 24, 127–128. [Google Scholar] [CrossRef]
  39. Zheng, J.; Bian, J.; Ge, Q.; Yin, Y. The climate regionalization in China for 1951–1980 and 1981–2010. Geogr. Res. 2020, 32, 987–997. (In Chinese) [Google Scholar]
  40. Liu, X.; Ren, Z. Progress in quality control of surface meteorological data. Meteorogical Sci. Technol. 2005, 33, 199–203. (In Chinese) [Google Scholar]
  41. Haylock, M.R.; Hofstra, N.; Klein Tank, A.M.G.; Klok, E.J.; Jones, P.D.; New, M. A European daily high-resolution gridded data set of surface temperature and precipitation for 1950–2006. J. Geophys. Res. 2008, 113, D20119. [Google Scholar] [CrossRef]
  42. Menne, M.J.; Durre, I.; Vose, R.S.; Gleason, B.E.; Houston, T.G. An Overview of the Global Historical Climatology Network-Daily Database. J. Atmos. Ocean. Technol. 2012, 29, 897–910. [Google Scholar] [CrossRef]
  43. Dunn, R.J.H.; Alexander, L.V.; Donat, M.G.; Zhang, X.; Bador, M.; Herold, N.; Barry, A.A. Development of an updated global land in-situ-based dataset of temperature and precipitation extremes: HadEX3. J. Geophys. Res. Atmos. 2020, 125, e2019JD032263. [Google Scholar] [CrossRef]
  44. Zhang, X.; Alexander, L.; Hegerl, G.C.; Jones, P.; Tank, A.K.; Peterson, T.C.; Trewin, B.; Zwiers, F.W. Indices for monitoring changes in extremes based on daily temperature and precipitation data. WIREs Clim. Change 2011, 2, 851–870. [Google Scholar] [CrossRef]
  45. Yan, Z.; Jones, P.D.; Davies, T.D.; Moberg, A.; Bergström, H.; Camuffo, D.; Yang, C. Trends of Extreme Temperatures in Europe and China Based on Daily Observations. Clim. Change 2002, 53, 355–392. [Google Scholar] [CrossRef]
  46. Klein Tank, A.M.G.; Wijngaard, J.B.; Können, G.P.; Böhm, R.; Demarée, G.; Gocheva, A.; Petrovic, P. Daily dataset of 20th-century surface air temperature and precipitation series for the European Climate Assessment. Int. J. Climatol. 2002, 22, 1441–1453. [Google Scholar] [CrossRef]
  47. Vincent, L.A.; Mekis, É. Changes in Daily and Extreme Temperature and Precipitation Indices for Canada over the Twentieth Century. Atmos.-Ocean 2006, 44, 177–193. [Google Scholar] [CrossRef]
  48. Zhang, X.; Hegerl, G.; Zwiers, F.W.; Kenyon, J. Avoiding Inhomogeneity in Percentile-Based Indices of Temperature Extremes. J. Clim. 2005, 18, 1641–1651. [Google Scholar] [CrossRef]
  49. Niu, T.; Chen, L.X.; Zhou, Z.J. The characteristics of climate change over the Tibetan Plateau in the last 40 years and the detection of climatic jumps. Adv. Atmos. Sci. 2004, 21, 193–203. [Google Scholar] [CrossRef]
  50. Deng, H.; Chen, Y.; Shi, X.; Li, W.; Wang, H.; Zhang, S.; Fang, G. Dynamics of temperature and precipitation extremes and their spatial variation in the arid region of northwest China. Atmos. Res. 2014, 138, 346–355. [Google Scholar] [CrossRef]
  51. Qi, Y.; Chen, H.Y.; Fang, S.B.; Yu, W.G. Variation Characteristics of Extreme Climate Events in Northwest China During 1961–2010. J. Arid. Meteorol. 2015, 33, 963–969. [Google Scholar]
  52. Wang, B.L.; Zhang, M.J.; Wei, J.L.; Wang, S.J.; Ma, Q.; Li, X.F. The Change in Extreme Events of Temperature and Precipitation over Northwest China in Recent 50 Year. J. Nat. Resour. 2012, 27, 1720–1733. [Google Scholar] [CrossRef]
  53. Wang, H.; Chen, Y.; Xun, S.; Lai, D.; Fan, Y.; Li, Z. Changes in daily climate extremes in the arid area of northwestern China. Theor. Appl. Climatol. 2012, 112, 15–28. [Google Scholar] [CrossRef]
  54. Horton, D.E.; Johnson, N.C.; Singh, D.; Swain, D.L.; Rajaratnam, B.; Diffenbaugh, N.S. Contribution of changes in atmospheric circulation patterns to extreme temperature trends. Nature 2015, 522, 465–469. [Google Scholar] [CrossRef] [PubMed]
  55. Zhang, G.; Zeng, G.; Li, C.; Yang, X. Impact of PDO and AMO on interdecadal variability in extreme high temperatures in North China over the most recent 40-year period. Clim. Dynam. 2020, 54, 3003–3020. [Google Scholar] [CrossRef]
  56. He, Z.; Du, J.; Zhao, W.; Yang, J.; Chen, L.; Zhu, X.; Chang, X.; Liu, H. Assessing temperature sensitivity of subalpine shrub phenology in semi-arid mountain regions of China. Agricult. For. Meteorol. 2015, 213, 42–52. [Google Scholar] [CrossRef]
  57. McMillan, A.M.S.; Winston, G.C.; Goulden, M.L. Age-dependent response of boreal forest to temperature and rainfall variability. Glob. Change Biol. 2008, 14, 1904–1916. [Google Scholar] [CrossRef]
  58. Dai, A.; Trenberth, K.E.; Karl, T.R. Effects of Clouds, Soil Moisture, Precipitation, and Water Vapor on Diurnal Temperature Range. J. Clim. 1999, 12, 2451–2473. [Google Scholar] [CrossRef]
  59. Feng, J.M.; Wang, Y.L.; Ma, Z.G.; Liu, Y.H. Simulating the Regional Impacts of Urbanization and Anthropogenic Heat Release on Climate across China. J. Clim. 2012, 25, 7187–7203. [Google Scholar] [CrossRef]
  60. Kaiser, D.P. Decreasing cloudiness over China: An updated analysis examining additional variables. Geophys. Res. Lett. 2000, 27, 2193–2196. [Google Scholar] [CrossRef]
  61. Liu, B.; Xu, M.; Henderson, M.; Qi, Y.; Li, Y. Taking China’s Temperature: Daily Range, Warming Trends, and Regional Variations, 1955–2000. J. Clim. 2004, 17, 4453–4462. [Google Scholar] [CrossRef]
  62. Wang, L.; Liu, B.; Henderson, M.; Shen, X.; Yang, L.; Lian, L. Warming across decades and deciles: Minimum and maximum daily temperatures in China, 1955–2014. Int. J. Climatol. 2017, 38, 2325–2332. [Google Scholar] [CrossRef]
  63. Gong, Z.; Wang, X.; Zhi, R.; Feng, G. Regional characteristics of temperature changes in China during the past 58 years and its probable correlation with abrupt temperature change. Acta Phys. Sin. 2009, 58, 4342–4353. [Google Scholar] [CrossRef]
  64. Wang, H.; Chen, Y.; Li, W.; Deng, H. Runoff responses to climate change in arid region of northwestern China during 1960–2010. Chin. Geogra. Sci. 2013, 23, 286–300. [Google Scholar] [CrossRef]
  65. Sun, G.; Chen, Y.; Li, W. Interannual and Interdecadal Variations of Extreme Hydrological Events and Response to Climate Change in Xinjiang. Sci. Geogr. Sin. 2011, 31, 1389–1395. [Google Scholar] [CrossRef]
  66. Xu, C.; Chen, Y.; Yang, Y.; Hao, X.; Shen, Y. Hydrology and water resources variation and its response to regional climate change in Xinjiang. J. Geogr. Sci. 2010, 20, 599–612. [Google Scholar] [CrossRef]
  67. Deng, H.; Tang, Q.; Yun, X.; Tang, Y.; Liu, X.; Xu, X.; Sun, S.; Zhao, G.; Zhang, Y.; Zhang, Y. Wetting trend in Northwest China reversed by warmer temperature and drier air. J. Hydrol. 2022, 613, 128435. [Google Scholar] [CrossRef]
  68. Qian, W.H.; Qin, A. Precipitation division and climate shift in China from 1960 to 2000. Theor. Appl. Climatol. 2007, 93, 1–17. [Google Scholar] [CrossRef]
  69. Wang, H.J. The Weakening of the Asian Monsoon Circulation after the End of 1970’s. Adv. Atmos. Sci. 2001, 18, 376–386. [Google Scholar] [CrossRef]
  70. Li, B.; Chen, Y.; Chen, Z.; Xiong, H.; Lian, L. Why does precipitation in northwest China show a significant increasing trend from 1960 to 2010? Atmos. Res. 2016, 167, 275–284. [Google Scholar] [CrossRef]
  71. Liu, Z.; Menzel, L.; Dong, C.; Fang, R. Temporal dynamics and spatial patterns of drought and the relation to ENSO: A case study in Northwest China. Int. J. Climatol. 2016, 36, 2886–2898. [Google Scholar] [CrossRef]
  72. Peng, D.; Zhou, T. Why was the arid and semiarid northwest China getting wetter in the recent decades? J. Geophys. Res. Atmos. 2017, 122, 9060–9075. [Google Scholar] [CrossRef]
  73. Zhou, B.; Xu, Y.; Wu, J.; Dong, S.; Shi, Y. Changes in temperature and precipitation extreme indices over China: Analysis of a high-resolution grid dataset. Int. J. Climatol. 2016, 36, 1051–1066. [Google Scholar] [CrossRef]
  74. Beniston, M.; Stephenson, D.B. Extreme climatic events and their evolution under changing climatic conditions. Glob. Planet. Change 2004, 44, 1–9. [Google Scholar] [CrossRef]
  75. Cao, L.; Zhu, Y.; Tang, G.; Yuan, F.; Yan, Z. Climatic warming in China according to a homogenized data set from 2419 stations. Int. J. Climatol. 2016, 36, 4384–4392. [Google Scholar] [CrossRef]
  76. Bertrand, C.; Ingels, R.; Journée, M. Homogenization and trends analysis of the Belgian historical precipitation time series. Int. J. Climatol. 2021, 41, 5277–5294. [Google Scholar] [CrossRef]
  77. Jiang, S.; Wang, K.; Mao, Y. Rapid Local Urbanization around Most Meteorological Stations Explains the Observed Daily Asymmetric Warming Rates across China from 1985 to 2017. J. Clim. 2020, 33, 9045–9061. [Google Scholar] [CrossRef]
  78. Li, Q.; Dong, W.; Jones, P. Continental scale surface air temperature variations: Experience derived from the Chinese region. Earth-Sci. Rev. 2020, 200, 102998. [Google Scholar] [CrossRef]
  79. Zhang, Y.; Ren, Y.; Ren, G.; Wang, G. Precipitation Trends Over Mainland China from 1961–2016 after Removal of Measurement Biases. J. Geophys. Res. Atmos. 2020, 125, e2019JD031728. [Google Scholar] [CrossRef]
Figure 1. Northwestern China and the locations of the meteorological stations utilized for this study.
Sustainability 15 14882 g001
Figure 2. Station-by-station decadal trends for warm extreme indices: (a) SU, (b) TR, (c) GSL, (d) TN90p, (e) TX90p, and (f) WSDI. The upward/downward-pointing triangles denote increasing/decreasing trends, and the size of the triangles is proportional to the magnitude of the trends. Solid red and blue triangles indicate significant changes at the 5% level.
Sustainability 15 14882 g002aSustainability 15 14882 g002b
Figure 3. Trends for warm extremes indices in different climatic zones.
Sustainability 15 14882 g003
Figure 4. Annual regional averaged series for warm extreme indices: (a) SU, (b) TR, (c) GSL, (d) TN90p, (e) TX90p, and (f) WSDI. The black line is the annual time series of warm extreme indices, the blue line is the linear regression, and the red line is the 5-year smoothed average. R is the correlation coefficient for the relationships, and P is the statistical significance.
Sustainability 15 14882 g004
Figure 5. Similar to Figure 2 but for cold extremes indices: (a) FD, (b) ID, (c) TN10p, (d) TX10p, and (e) CSDI.
Sustainability 15 14882 g005
Figure 6. Trends for cold extremes indices in different climatic zones.
Sustainability 15 14882 g006
Figure 7. Identical to Figure 4 but now showing cold extreme indices: (a) FD, (b) ID, (c) TN10p, (d) TX10p, and (e) CSDI.
Sustainability 15 14882 g007aSustainability 15 14882 g007b
Figure 8. Identical to Figure 2 but now showing precipitation indices: (a) PRCPTOT, (b) SDII, (c) R10, (d) R20, (e) R95p, (f) R99p, (g) CWD, and (h) CDD.
Sustainability 15 14882 g008aSustainability 15 14882 g008b
Figure 9. Trends for precipitation indices in different climatic zones.
Sustainability 15 14882 g009
Figure 10. Same as Figure 4 but for precipitation indices: (a) PRCPTOT, (b) SDII, (c) R10, (d) R20, (e) R95p, (f) R99p, (g) CWD, and (h) CDD.
Sustainability 15 14882 g010
Table 1. Definitions of the 16 ETCCDI extreme temperature indices used in this study 1.
IndexIndicator NameDefinitionsUnit
TXxmax TXMonthly maximum value of TX°C
TNxmax TNMonthly maximum value of TN°C
TXnmin TXMonthly minimum value of TX°C
TNnmin TNMonthly minimum value of TN°C
FDfrost daysAnnual count of days when TN < 0 °Cdays
SUsummer daysAnnual count of days when TX > 25 °Cdays
IDicing daysAnnual count of days when TX < 0 °Cdays
TRtropical nightsAnnual count of days when TN > 20 °Cdays
GSLgrowing season lengthAnnual count between the first span of at least 6 days with daily mean temperature TG > 5 °C and first span after July 1st of 6 days with TG < 5 °Cdays
TN10pcool nightsPercentage of days when TN < 10th percentiledays
TX10pcool daysPercentage of days when TX < 10th percentiledays
TN90pwarm nightsPercentage of days when TN > 90th percentiledays
TX90pwarm daysPercentage of days when TX > 90th percentiledays
WSDIwarm spell duration indexAnnual count of days with at least 6 consecutive days when TX > 90th percentiledays
CSDIcold spell duration indexAnnual count of days with at least 6 consecutive days when TN < 10th percentiledays
DTRdaily temperature rangeMonthly mean difference between TX and TN°C
1 TX, Maximum daily temperature; TN, minimum daily temperature; TG, daily mean temperature. The annual values were calculated between January and December.
Table 2. Definitions of the 10 ETCCDI extreme precipitation indices used in this study 1.
IndexIndicator NameDefinitionsUnit
R10mmnumber of heavy precipitation daysAnnual count of days when RR ≥ 10 mm days
R20mmnumber of very heavy precipitation daysAnnual count of days when RR ≥ 20 mmdays
R95pTOTvery wet daysAnnual total PRCP when RR > 95th percentilemm
R99pTOTextremely wet daysAnnual total PRCP when RR > 99th percentile mm
CDDconsecutive dry daysMaximum length of dry spell, maximum number of consecutive days with RR < 1 mmdays
CWDconsecutive wet daysMaximum length of a wet spell, maximum number of consecutive days with RR ≥ 1 mm days
RX1daymax 1-day precipitation amountMonthly maximum 1-day precipitationmm
RX5daymax 5-day precipitation amountMonthly maximum consecutive 5-day precipitationmm
SDIIsimple daily intensity indexAnnual total precipitation divided by the number of wet days (defined as precipitation ≥ 1.0 mm) in the yearmm/day
PRCPTOTannual total wet-day precipitationAnnual total precipitation in wet days with RR ≥ 1.0 mmmm
1 RR is daily precipitation.
Table 3. Percentage of stations showing significant negative, nonsignificant, and significant positive trends for indices of climate extremes during 1961–2020 1.
IndexNegativeNonsignificantPositive
Warm IndicesSU0.6 (1.8)20.479 (98.2)
TR1.5 (5.2)20.178.4 (94.8)
GSL0 (0.6)18.181.9 (99.4)
TN90p0.6 (1.2)2.397.1 (98.8)
TX90p0 (2.3)5.894.2 (97.7)
WSDI0 (3.5)44.255.8 (96.5)
Cold IndicesFD93.6 (98.3)5.80.6 (1.7)
ID58.1 (95.9) 41.90 (4.1)
TN10p95.3 (97.7)4.10.6 (2.3)
TX10p95.3 (99.4)4.70 (0.6)
CSDI50.6 (98.8)49.40 (1.2)
Wet IndicesPRCPTOT0.6 (20.3)70.928.5 (79.7)
SDII0 (18.0) 87.812.2 (82.0)
R10mm0 (22.7)81.418.6 (77.3)
R20mm0 (28.1)90.19.9 (71.9)
R95pTOT0 (18.5)87.512.5 (81.5)
R99pTOT0 (23.8)92.97.1 (76.2)
CWD1.2 (47.1)91.87.0 (52.9)
Dry IndicesCDD12.8 (83.1)87.20 (16.9)
1 Significant at the 5% level. Percentage of stations with negative and positive are also known in parentheses.
Table 4. Average values of extreme temperature and extreme precipitation indices at different climatic zone.
Indices (Unit)The Whole Zone Zone I Zone IIZone IIIZone IVZone VZone VI
SU (days)81861511310472108
TR (days)11.5132409331
GSL (days)207199242156214215264
TN90p (days)35333536343436
TX90p (days)35353435353536
WSDI (days)5564445
FD (days)16617213722616415494
ID (days)52933561514015
TN10p (days)43454443444340
TX10p (days)39393938393937
CSDI (days)67104655
PRCPTOT (mm)281.8178.551.2347.3126.9380.4624.8
SDII (mm/day)5.84.54.45.15.37.29.1
R10mm (days)841931219
R20mm (days)2102148
R95pTOT (mm)63.736.811.868.729.391.4156.8
R99pTOT (mm)23.514.69.821.117.733.650.2
CWD (days)4326346
CDD (days)766312674925743
Table 5. Inter-annual trends for extremal indices and diurnal temperature range of temperature indices during 1960–2020.
JanuaryFebruaryMarchAprilMayJuneJulyAugustSeptemberOctoberNovemberDecember
TXx0.30.4 **0.5 **0.3 *0.2 *0.10.3 **0.10.3 **0.3 **0.4 **0.2
TNx0.3 **0.6 **0.5 **0.4 **0.3 **0.4 **0.3 **0.2 **0.4 **0.3 **0.4 **0.4 **
TXn0.10.4 *0.3 *0.4 *0.10.10.20.10.3 **0.3 *0.40.4
TNn0.4 **0.6 **0.5 **0.6 **0.3 **0.5 **0.4 **0.4 **0.5 **0.5 **0.6 **0.5 **
DTR−0.3 **−0.2 *−0.1−0.1−0.1−0.3 **−0.1 **−0.2 **−0.1 *−0.1−0.1−0.2 **
Note: ** and * denote statistically significant trends at the 1% and 5% levels, respectively.
Table 6. Inter-annual trends for other indices of precipitation indices during 1960–2020.
JanuaryFebruaryMarchAprilMayJuneJulyAugustSeptemberOctoberNovemberDecember
RX1day0.1 **0.2 **00.10.30.8 **0.40.20.1000.1 *
RX5day0.2 **0.2 **000.41.4 **0.40.30−0.10.10.1
Note: ** and * denote statistically significant trends at the 1% and 5% levels, respectively.
Disclaimer/Publisher’s Note: The statements, opinions and data contained in all publications are solely those of the individual author(s) and contributor(s) and not of MDPI and/or the editor(s). MDPI and/or the editor(s) disclaim responsibility for any injury to people or property resulting from any ideas, methods, instructions or products referred to in the content.

