Abstract
Sulfate is of great importance in anaerobic digestion as its addition can help control the microbial community. In this study, the effect of sulfuric acid addition on the performance of a UASB reactor fed with hydrolyzed starch was investigated. The total organic carbon (TOC), Fe, SO42− removal and methane production were monitored under various chemical oxygen demand (COD) to SO42− ratios, hydraulic retention times (HRTs) and organic loading rates (OLRs). When the HRT was 16 h, and the OLR was equal to 2 g COD/LUASB-day, methane production was 0.24 L CH4/LUASB-day. After the addition of sulfuric acid, TOC removal reached 95%, and the population of Ruminococcus sp. that utilize soluble carbohydrates increased by 19.7%. Nitrogen removal was less than 25%, while the population of Ignavibacterium sp. accounted for 2.3%. When the HRT, OLR and COD/SO42− ratios were equal to 16 h, 2 g COD/LUASB-d and 3.72, respectively, methane production was 0.267 L CH4/LUASB-day. When the OLR increased to 5.94 g, the COD/LUASB-day and COD/SO42− ratios were equal to 12.5, and methane production was three times higher (0.84 L CH4/LUASB-day), with a methane content in the produced biogas greater than 70% due to the increased amount of Methanosaeta sp. and direct interspecies electron transfer. Sulfate addition increased the relative abundance of Desulfovibrio sp., accounting for 9.9% and an iron accumulation exceeding 98.0%. This study indicates that appropriate sulfate concentrations in the feed in combination with the presence of iron in the UASB lead to enhanced methane yields.
1. Introduction
High-strength wastewaters with high concentrations of sulfate, organic compounds and heavy metals produced during industrial processes are usually treated via anaerobic digestion. This bioprocess effectively reduces the pollutant load in the wastewater while simultaneously producing biomethane, which is a sustainable alternative energy source. Wastewater generated from potato processing industries contains a high amount of starch, which has a high viscosity and low solubility [1] and, for this reason, is considered highly polluted wastewater [2]. Due to its physicochemical characteristics, starch can cause operational harm in the industry’s wastewater treatment facilities; thus, it is separated from the wastewater influent stream. After its extraction, this by-product can be hydrolyzed, and the produced hydrolysates can be effectively treated under anaerobic conditions for energy production in the form of methane [3].
An upflow anaerobic sludge blanket (UASB) bioreactor is one of the most widely used processes in food processing wastewaters with high contents of carbohydrates [4] due to its low cost, high organic removal and recovery of methane, which can be used as a gaseous biofuel. One of the key factors in the effective operation of upflow anaerobic treatment systems is the generation of sludge in granular form. The latter can efficiently degrade various types of wastewater with high organic loads [5]. Each of these granules consists of many different types of anaerobic bacteria that operate symbiotically and in layers for the successful degradation of substrates. Due to their granular form, bacteria are highly tolerant to the toxic hydrogen sulfide [6].
In the last few years, many studies have focused on UASB systems treating starch wastewater [5,6,7]. He et al., 2019 [8] assessed the energy and economic benefits of three anaerobic bioreactors at various starchy influent COD concentrations. The authors estimated that the annual economic balance for the UASB reactor was achieved when the influent COD was 12,984 mg/L. With the utilization of biogas as a source of heat and a COD influent concentration higher than 15 g/L, the system was able to achieve annual energy and economic surpluses. In addition, Lu et al., 2015 [9] observed that when a lab-scale UASB reactor supplied with starch as the sole carbon source at a COD concentration of 1000 mg/L, a total COD removal of 98.7% was achieved with a methane yield of 0.33 L CH4/g CODremoved applying a hydraulic retention time (HRT) of 6 h and an organic loading rate (OLR) of 4 g COD/L-day.
Although anaerobic digestion has been widespread in recent years in the utilization of industrial wastewater, there are several challenges that need to be addressed. The content of inhibitors in the substrate, as well as the organic loading rate applied to the anaerobic bioreactor, could affect methane production [10]. According to Lu et al. [9], the OLR for treating low-strength starch wastewater should not exceed 8.0 g COD/L-d, with an HRT of over 3 h. Feeding with excessive starch at a high OLR resulted in a decrease in the mass transfer rate and a negative impact on the specific methanogenesis activity of granular sludge. Consequently, the performance of the UASB reactor was compromised in terms of both COD removal and biogas production. In addition, Musa et al., 2019 [11], who studied the treatment of high-strength cattle slaughterhouse wastewater in UASB reactors, noticed that the optimum OLR for organic removal efficiency >90% was 5 g COD/L-day. They also pointed out that at the highest OLR of 16 g/L-d, an HRT of more than 2 days could be proven adequate for achieving a 90% degradation efficiency of the waste. Methane production is also affected by the physicochemical properties of wastewater, such as carbohydrate and fat contents, C/N ratios and particle sizes [12]. Recently, efforts have been directed towards enhancing biogas production by adjusting nutrient content using trace elements (e.g., Fe, Zn, and Cu) and employing additives (e.g., biochar) that promote direct interspecies electron transfer (DIET); thereby, improving digestibility through increased adsorption potential [13,14].
Wastewater generated from potato processing industries, except for high organic load, usually has a high sulfate content which inhibits the production of methane during anaerobic treatment since the presence of sulfate affects the microbial diversity of the reactor [15]. Sulfate-reducing bacteria (SRB) that dominate in environments with high sulfate concentrations, use sulfate as an electron acceptor that reduces sulfate into sulfide, which is toxic for anaerobic microorganisms [16]. In addition, SRB competes with methanogens for energy sources such as acetate, starch and H2. In high sulfate environments, SRB outcompete methanogens since they can capture electrons more easily. Hence, the COD/SO42− ratio affects the microbial community and, consequently, the performance of the anaerobic digester [17]. According to stoichiometry, the COD/SO42− ratio must be more than 0.67 for a sufficient sulfate reduction. The following equations can describe the reduction of SO42− as well as the removal of COD during the anaerobic digestion process [18]:
Organics + SO42− → Cells + H2S + CO2 + Alkalinity
Organics → Cells + CH4 + CO2
Organics + SO42− → Cells + H2S + CO2 + CH4 + Alkalinity
In addition, Choi et al. [18], observed that SRB and methanogens are very competitive when the COD/SO42− ratio is below 2.7. They suggest a COD/SO42− ratio greater than 2.0 for a successful anaerobic treatment.
The presence of sulfate in anaerobic digestion has gained significant interest over the last few years. Using the Scopus database, we conducted a search using the keywords (“reactor”) AND (“sulfur” OR “sulfate”) AND (“anaerobic digestion”), resulting in 550 publications since 2000. Notably, there has been an upward trend in research on sulfur presence in anaerobic reactors, with 36% of the total publications emerging in the last 5 years. A graph illustrating the number of publications throughout the last 23 years is available in Figure S1 in the Supplementary Materials. Since the presence of high sulfur content in organic waste can result in the production of hydrogen sulfide which is toxic during anaerobic digestion, significant research efforts have been dedicated to addressing the removal of H2S emissions [19,20,21,22,23]. Although the vast majority of research has focused on the reduction in sulfate during anaerobic digestion, there are few studies examining biomethane production from high-sulfate-content wastewater. The effectiveness of the COD/SO42− ratio on methane production depends on many factors, including HRT, OLR and the presence of metals in the influent. Many anaerobic digestion studies using different substrates have reported that a COD/SO42− ratio of less than 12 can inhibit the production of methane [24,25,26,27]. Lu et al., 2016 [28] examined the treatment of a starchy wastewater in a UASB reactor under gradually decreasing COD/SO42− ratio. When the COD/SO42− ratio was less than 2, apart from the COD removal which was kept constant, and sulfate removal and methane production were decreased significantly at values less than 21.2% and 0.26 ± 0.37 L/L-day, respectively. However, when the ratio was more than 2, biogas production was stable near to 1.15 L/LUASB-day with a total COD removal of 73.5–80.3%. Moreover, Hu et al., 2015 [29] used a synthetic wastewater containing acetate, ethanol, and sulfate as substrate in a UASB reactor. The authors found out that when the COD/SO42− ratio was decreased from 20.0 to 0.5, the conversion of CODinfluent to CH4, dropped from 80.5% to 54.4%. Furthermore, Liu et al., 2015 [30] detected that zero-valent iron can enhance the methane production and sulfate reduction in anaerobic granular sludge reactors only when the COD/SO42− ratio is 2–4.5.
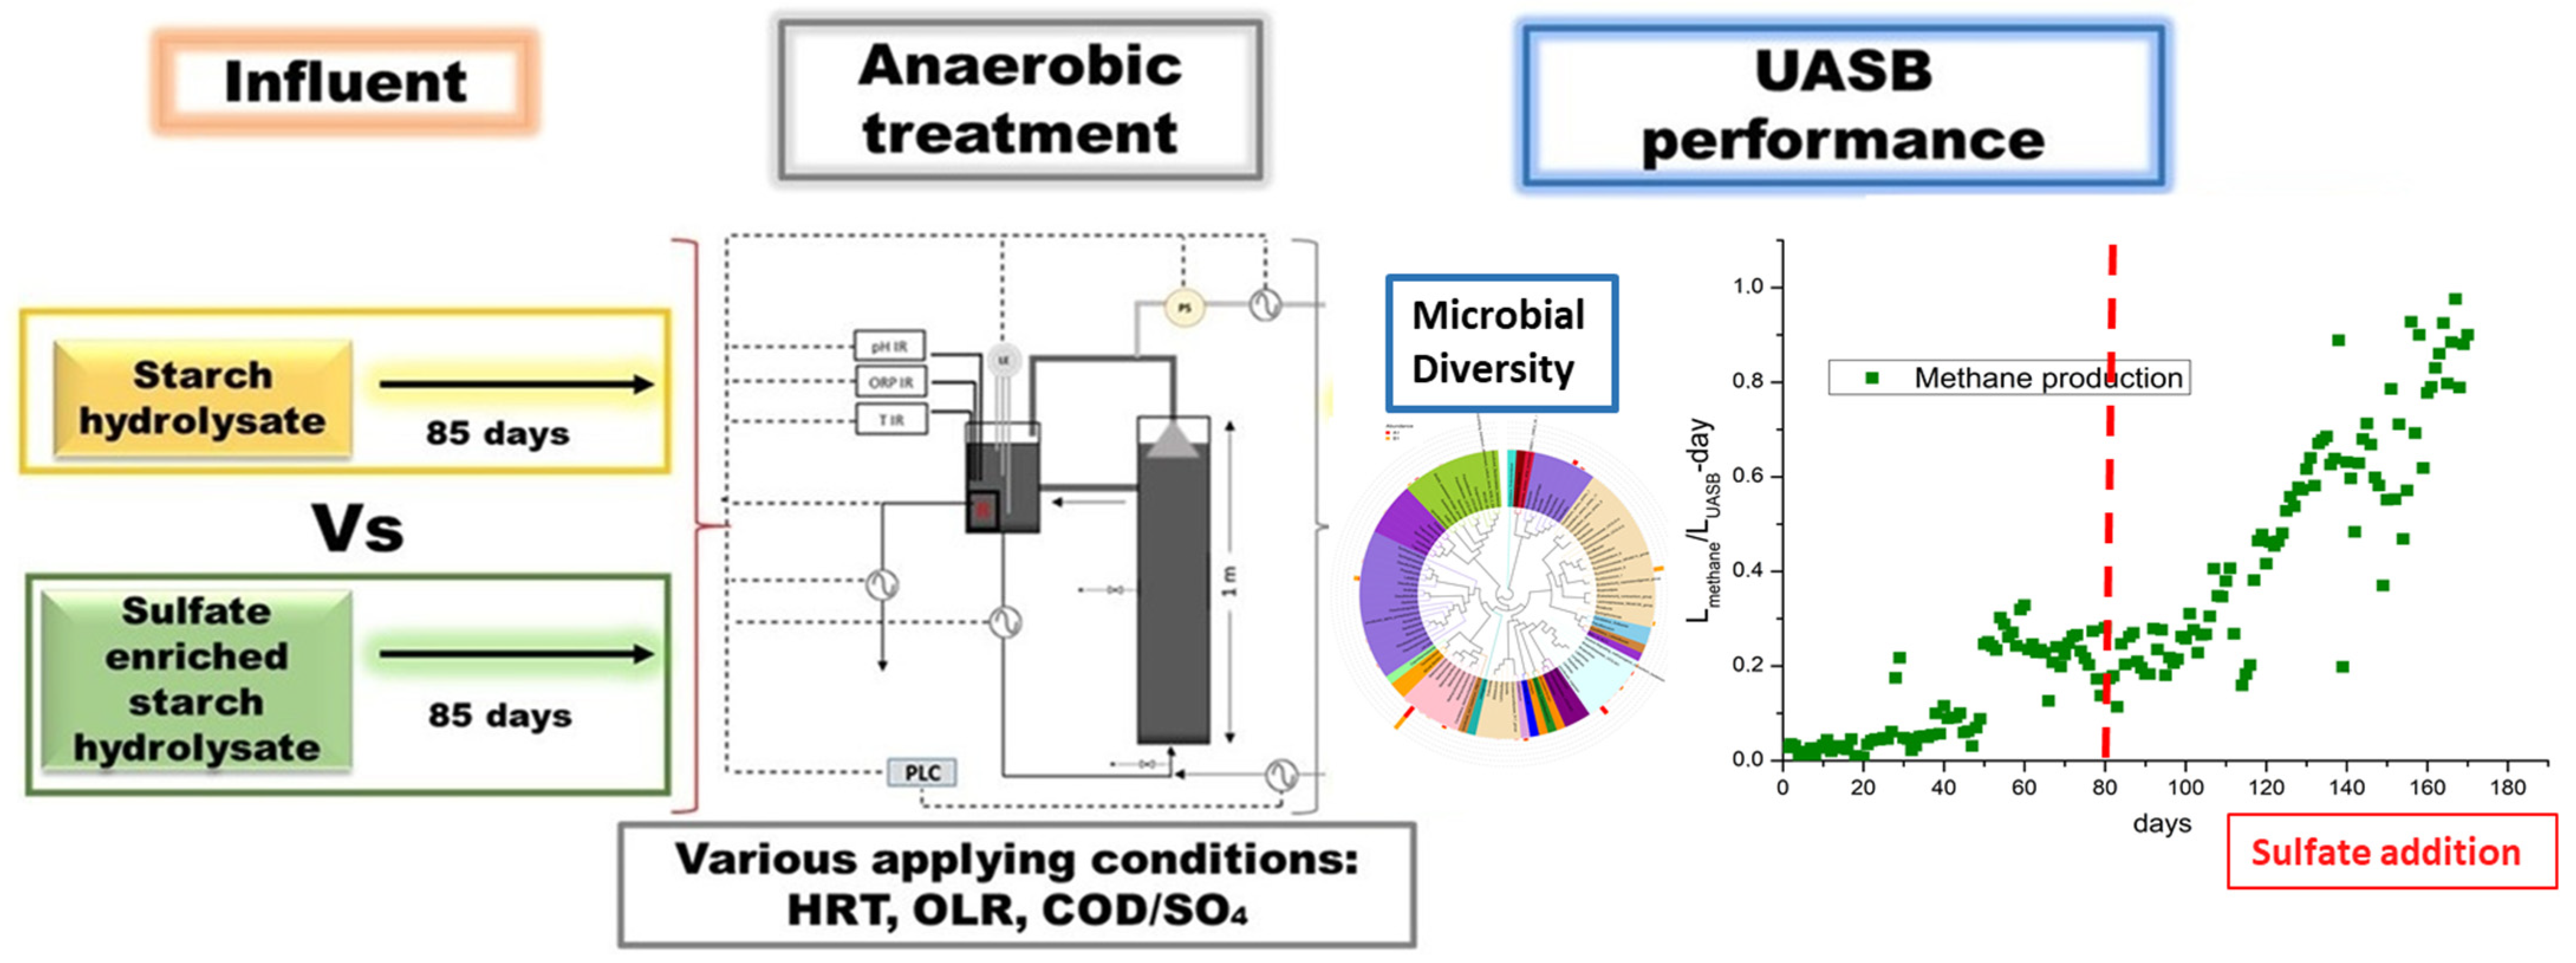
This study aims to improve methane production and the overall performance of a UASB reactor by adding sulfate in the form of sulfuric acid to the influent. The latter consists of starch hydrolysates. Apart from sulfate, the influent was also enriched with iron ions. The UASB performance was monitored under various conditions examining different OLRs, HRTs, sulfate and iron additions. Moreover, a 16S rRNA gene analysis was performed to investigate the microbial community changes before and after sulfate addition. Our work demonstrates that appropriate sulfate concentrations in the feed, along with the presence of iron, can lead to increased methane yields in the UASB reactor. Monitoring the UASB reactor under various feeding conditions can lead to the identification of suitable conditions where not only the pollutant load of the waste is reduced, but also biogas rich in methane is generated. This biogas can be utilized as an alternative form of energy, aiming for economically sustainable and environmentally friendly industrial waste management. Figure 1 illustrates the overall idea of this study.
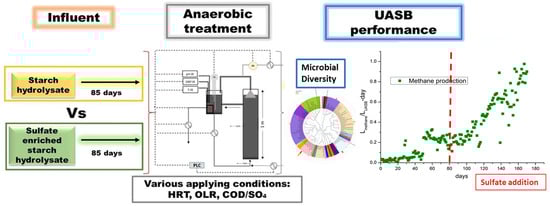
Figure 1.
Schematic diagram of the experimental procedure.
2. Materials and Methods
2.1. Materials
Ten (10) kg of industrial starch was obtained from Tasty Foods SA, a potato processing plant located in Athens (Greece) and brought to the Organic Chemical Technology Laboratory at NTUA and stored at 4 °C. Molasses was purchased at a local market in Athens and stored at room temperature. FeSO4·7H2O and H2O2 50% (w/w) that were used for feed pretreatment are described as ACS reagent, ≥99.0% and hydrogen peroxide solution 50 wt.% stabilized in H2O, respectively. Urea added to the substrate is characterized as: powder, BioReagent, for molecular biology, suitable for cell culture. Sulfuric acid, which was used as a source of sulfates, is described as ACS reagent, 95.0–98.0%. Table 1 shows the characteristics of the industrial starch as received from the industry.

Table 1.
Characteristics of industial starch.
2.2. Feed Pretreatment
The starch was hydrolyzed in order to be biodegradable and suitable for methane production as previously described [3]. Briefly, for its chemical oxidation, 31 g dry weight of starch was suspended in 1 L tap water, FeSO4·7H2O and H2O2 50% (w/w) were added at concentrations 1 g/L and 0.52 g/L, respectively, and the suspension was heated to 70 °C under stirring for 3 h.
After hydrolysis of starch and before feeding to the anaerobic digester, the hydrolyzed solution was diluted with deionized water for adjusting the organic loading rate (OLR) to the desired values. Furthermore, urea, and molasses were also added at concentrations varying from 0.08 to 0.28 g/L, and 0.10 to 0.25 g/L, respectively, as nitrogen and mineral sources.
2.3. Operational Conditions of the UASB Reactor
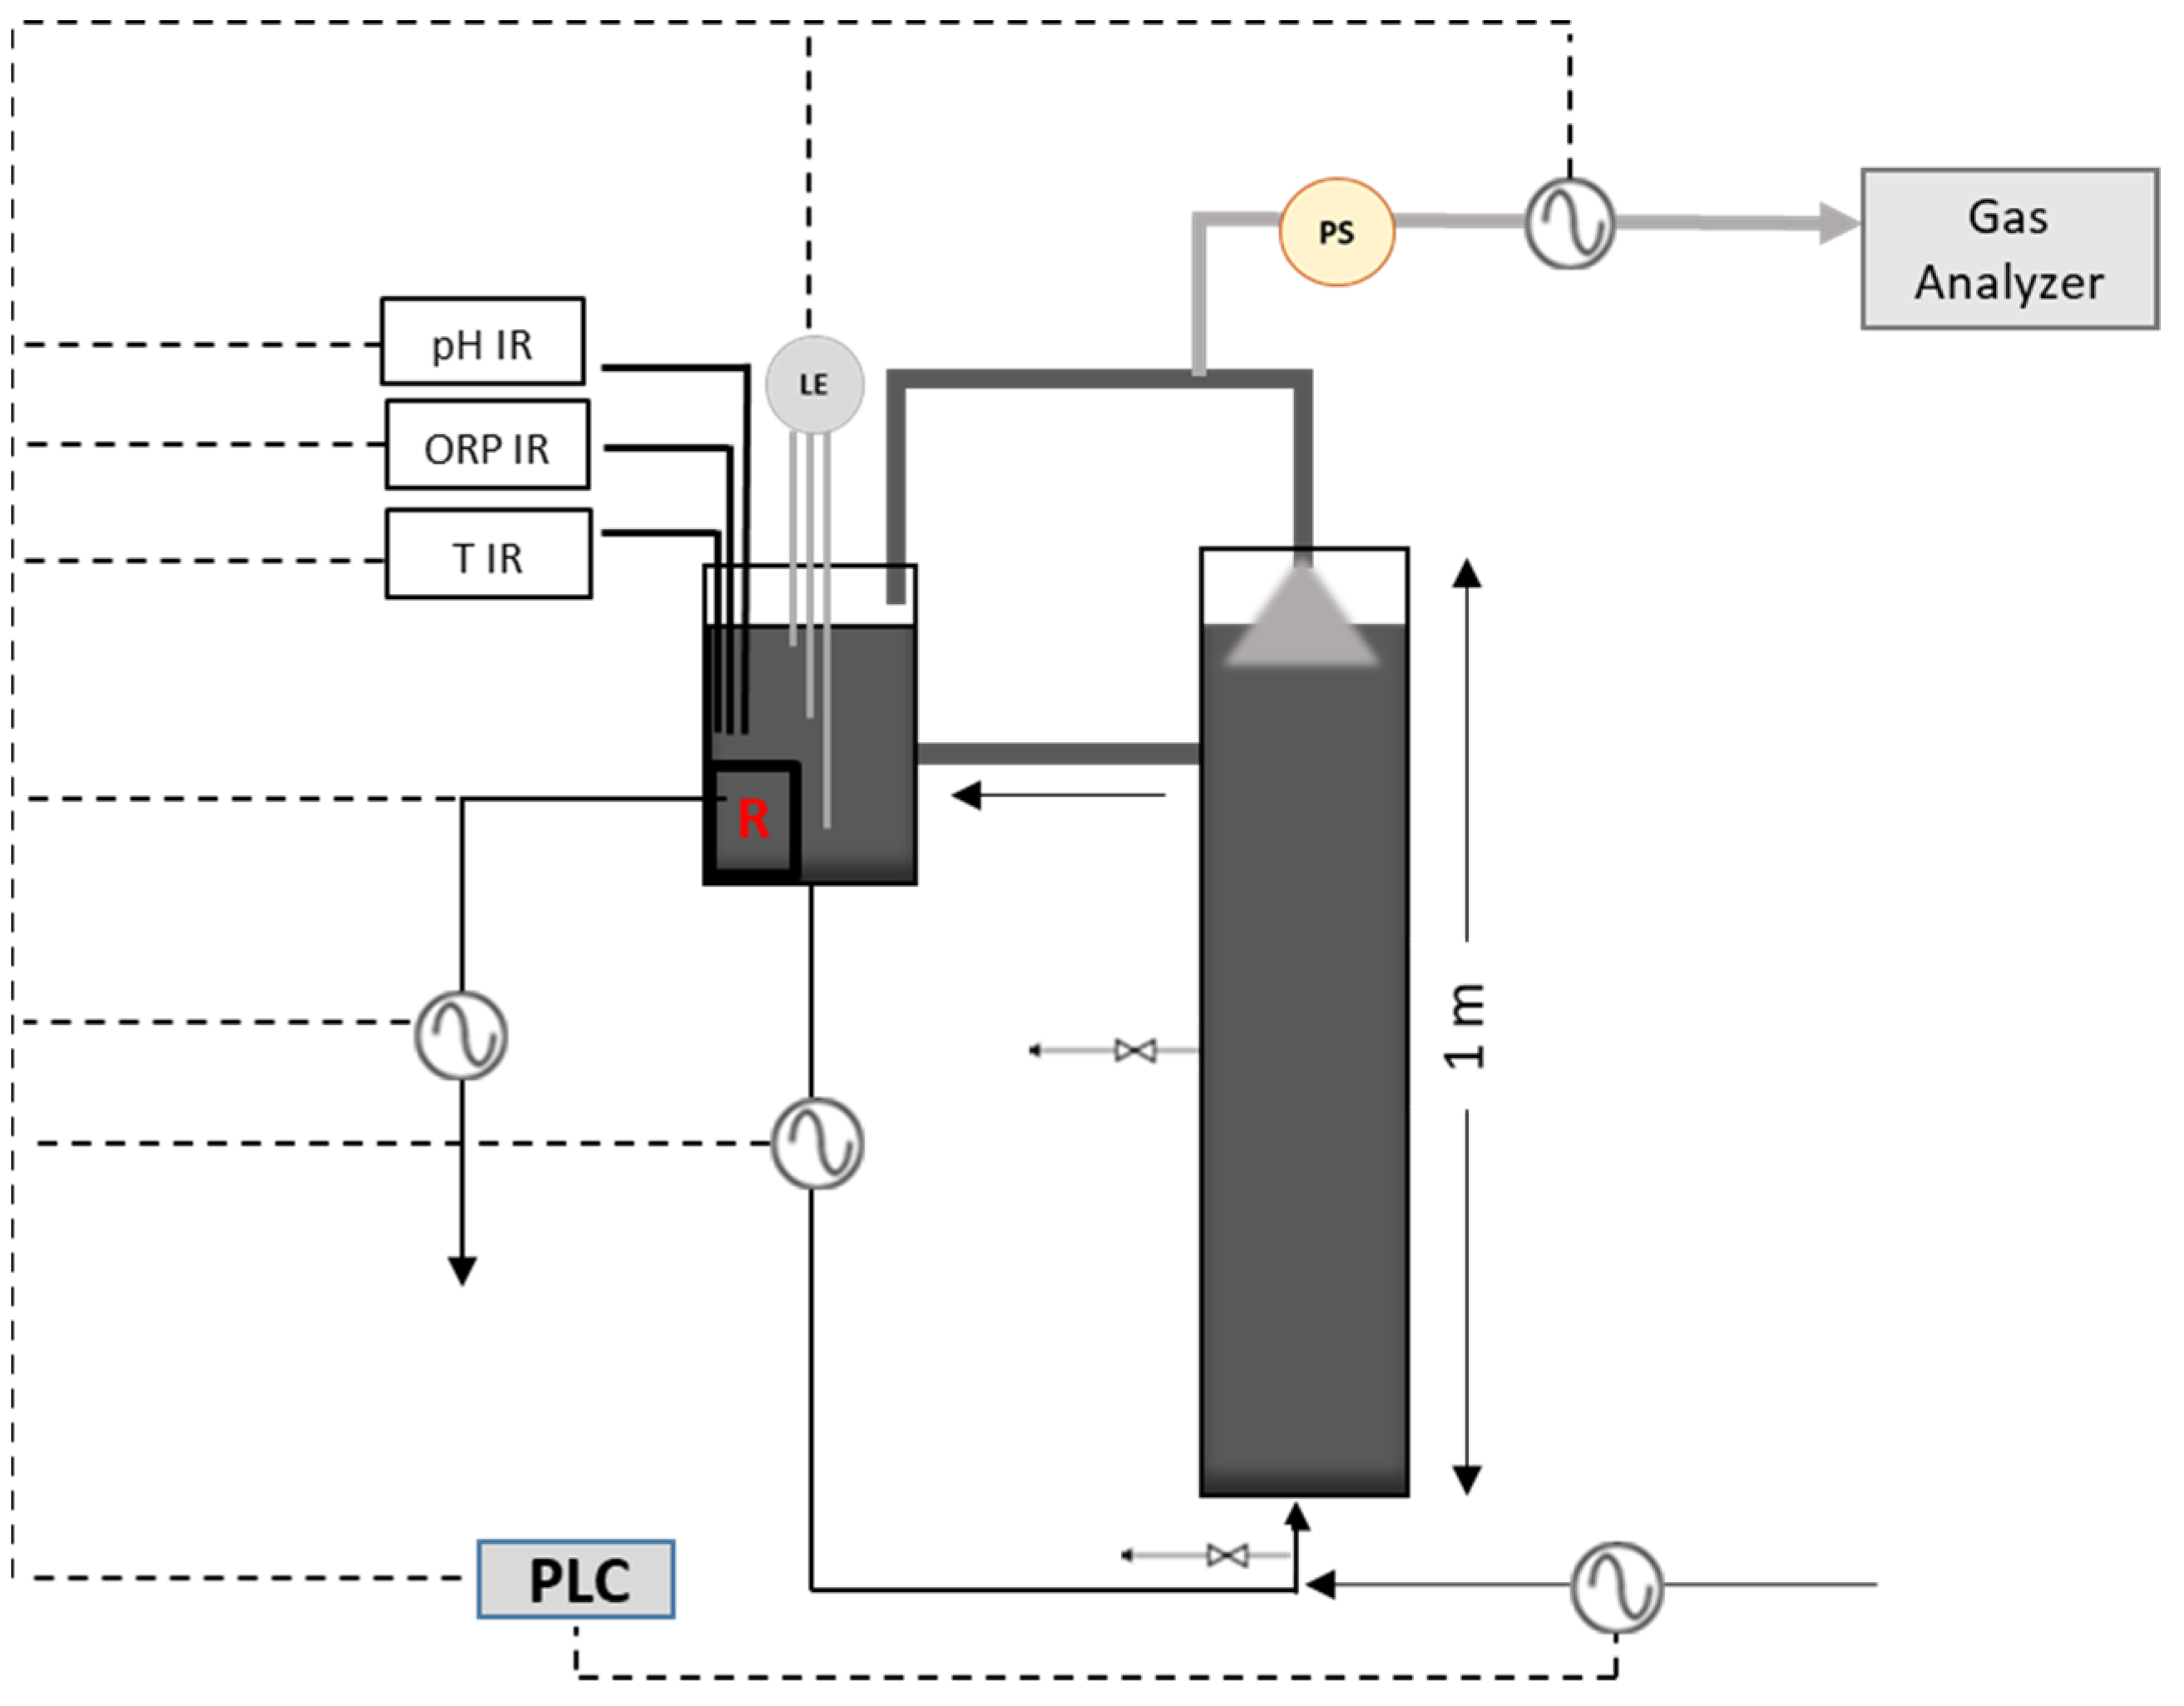
A cylindrical lab-scale UASB reactor was used for conducting the anaerobic digestion experiments, as illustrated in Figure 2. The reactor was made of Plexiglas, with a total and working volume of 11.3 L and 10.2 L, respectively, an internal diameter of 12 cm and a height of 1 m. The UASB system was also possessed a smaller recirculation cylindrical tank (total and working volume of 3.28 L and 2.26 L, respectively) in which all the necessary electrodes (pH, ORP, and level electrodes) were placed, as well as a thermocouple and a 200 W electric heating device. The entire system was automated by connecting all electrical sensors to a programmable logic controller (PLC). Furthermore, the reactor was equipped with two sampling ports—one at the bottom and one in the middle (50 cm). When biogas is produced, it accumulates in the headspace of the two vessels and the biogas line pressure is continuously increased. At a certain point, a low pressure switch activates a peristaltic pump, releasing the biogas pressure to a minimum point. The volume of biogas produced per day is measured by the peristaltic pump and a magnetic proximity sensor and recorded in the PLC. Air-sampling bags were used for the collection of biogas and the gas composition was automatically analyzed every 8 h, using a biogas analyzer (Gas analyzer, GFM 406 series; GAS DATA, Coventry, UK).
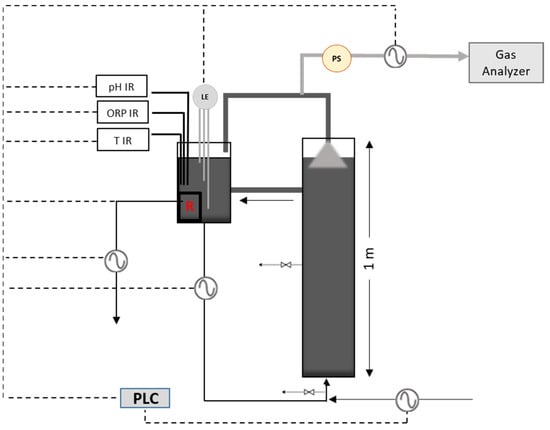
Figure 2.
Lab-scale UASB reactor performance testing system.
As inoculum, 3 L of anaerobic granular sludge derived from a full-scale UASB reactor of the potato processing industry, from where the starch was supplied, was used. In order to acclimate the inoculum to the operating conditions, the reactor was initially operated for three days using only water as substrate. A longer start-up period was not required since the sludge was already activated and acclimated to potato wastewaters.
An upflow velocity of 1 m/h was applied and kept constant during the whole period, to avoid the sludge precipitation and to achieve better contact between the anaerobic bacteria and the influent.
The UASB system was operated continuously for 170 days and the temperature was maintained constant at 35 ± 2 °C for the whole period. During the experiment, several operating conditions were examined at different values such as hydraulic retention time (HRT), OLR, COD/SO42− ratio and iron addition. To better illustrate the variation in the operating parameters, we separated the anaerobic digestion into 8 stages as shown in Table 2. Sulfuric acid was added to the influent from the 76th to 170th day to investigate the role of sulfate in UASB performance. The operating parameters for each stage were adjusted gradually, taking into account the reactor’s performance in the previous stage. Samples were obtained from the effluent on a daily basis; meanwhile, samples from the influent were collected periodically after each feed modification. All liquid samples, once collected, were stored at 4 °C for further analysis.
Table 2.
Operational parameters in each of the 8 stages.
2.4. Analytical Methods
Samples from the influent and effluent were filtered through a 0.45-μm glass fiber membrane, and measured in terms of chemical oxygen demand (COD) in the 5220 C section, sulfate in the 4500 C section, Fe in the 3500 B section, NH4+ in the 4500 A section, total amount of VFAs in the 5560 C section and alkalinity in the 2320 B section according to the Standard Methods for the Examination of Water and Wastewater [31]. The pH and REDOX potential were measured continuously using the pH electrode HI 3214P from Hanna Instruments, Co. (Athens, Greece) and the ORP electrode H1 2114P from Hanna Instruments, Co. and the results were recorded on a PLC. The TOC of the solid starch, the organic carbon in the starch solution as well as the total nitrogen (TN) in the substrate were measured using a TOC analyzer (Shimadzu, SSM-5000A, Shimadzu, TOC-L and TNL-M analyzer; Shimadzu Corporation, Kyoto, Japan).
Molasses’ characterization was applied in accordance with the Standard Methods above, using the atomic absorption spectrophotometer Shimadzu AA-7000 (Shimadzu, Kyoto, Japan) for Ca, Mg, Fe, Mn, Zn and Cu, and the Sherwood Flame Photometer 410 (Sherwood, Cambridge, UK) for K and Na analysis.
2.5. DNA Extraction and PCR Amplification
Before and after the addition of sulfate (85th and 170th day), 5 g samples of the sludge blanket were collected from the bottom of the reactor, washed and centrifuged and the precipitate was stored at −30 °C for further analysis. They were analyzed by 16S rRNA sequencing to investigate the shift in microbial community at genus level. For microbial DNA extraction, the Nucleo-Spin @ Soil Kit (MACHEREY-NAGEL, Dueren, Germany) was used in accordance with the kit manufacturer’s instructions. The nano-drop method was used to estimate the concentration and purity of the isolated DNA and the extract was delivered to Novogene Ltd. (Cambridge, UK), for amplicon pyrosequencing on Illumina MiSeq platforms. PCR products were mixed in equidensity ratios. Total genomic DNA from samples was extracted by the CTAB/SDS method. DNA concentration and purity were checked on 1% agarose gels. According to the concentration, DNA was diluted to 1 ng/μL with sterile water. Using the primer pair 341F/806R, the V3-V4 region of the bacterial 16S rRNA genes were amplified. According to Novogene, Bioinformatics Technology Co. (Cambridge, UK), all PCR reactions were carried out with Phusion® High-Fidelity PCR Master Mix (New England Biolabs, Ipswich, UK) and sequencing libraries were generated using NEB Next Ultra DNA Library Pre ®Kit for Illumina, according to the manufacturer’s recommendations. The quality of the library was assessed using the Qubit@ 2.0 fluorometer (Thermo Scientific, Waltham, MA, USA) and the Bioanalyzer 2100 system (Agilent Technologies, Santa Clara, CA, USA). Finally, the library was sequenced on an Illumina platform and 250 bp paired-end reads were generated. Sequence analysis was performed using Uparse software (Uparse v7.0.1001) [32]. Representative sequences for each operational taxonomy units (OTUs) were screened for further annotation. OTU abundance information was normalized using a standard of sequence number corresponding to the sample with the fewest sequences. In order to study phylogenetic relationship of the different OTUs, and the difference of dominant species in the 2 samples, multiple sequence alignment was conducted using the MUSCLE software (Version 3.8.31) [33]. Alpha diversity was applied to analyze the complexity of species diversity in a sample through indices, including Observed-species, Chao1, Shannon, Simpson, ACE and Good-coverage. All indices were calculated with QIIME (Version 1.7.0) bioinformatics platform software and displayed with R software (Version 2.15.3).
3. Results and Discussion
3.1. Influent Characterization and Operational Conditions
The TOC of the industrial starch was measured to be 0.441 g/g starch. Consequently, the initial starch suspension had a total TOC of 13.67 g/L. The applied starch hydrolysis conditions lead to a high hydrolysis rate of 99.5% and the hydrolysate can be used for biogas production via anaerobic digestion with a methane yield equal to 0.368 L-biomethane/g-COD as measured in a previous study [3].
The chemical composition of molasses was as follows: Cl, 36.73 mg/g; TN, 12.67 mg/g; Zn, 4.42 μg/g; Cu, 2.99 μg/g; Fe, 71.79 μg/g; Mn, 4.32 μg/g; Ca, 174.91 μg/g; K 3.8 mg/g, P, 0.75 mg/g; SO42−, and 40.11 mg/g, while the urea contained 46% of elemental nitrogen.
The operating parameters, for each stage before and after the addition of sulfate are shown in Table 2 and Table 3. At the first four stages, which lasted for 85 days, no sulfate was added to the feeding and the concentration of SO42− was less than 5.3 mg/L. The composition of the influent contained a TOC ranging from 188.42 ± 13.9 to 835.66 ± 103.12 mg/L, a phosphorus concentration between 0.08 and 0.15 mg/L, a nitrogen content between 30.6 and 46 mg/L and an iron content from 4.58 to 10.68 mg/L. In stage 3, the amount of iron in the influent was doubled in order to study its effect on the reactor’s performance before the sulfate addition. The OLR and HRT were studied at values ranging from 0.5 to 2.3 g COD/LUASB-day and 16–35 h, respectively, as shown in Table 3.
Table 3.
Operation conditions applied to UASB without sulfate addition (stages 1 to 4).
On day 86, the influent was enriched with sulfate in the form of H2SO4. In the stages from 5 to 8 (i.e., 86–170 days), the composition of the influent contained a COD/SO42− ratio varying from 3.72 ± 0.15 to 12.5 ± 0.70 with a sulfate concentration of more than 300 mg/L, an iron concentration ranging from 6.16 ± 0.08 to 23.07 ± 3.49 g/L, while TOC, phosphorus and nitrogen were 477.71 ± 90.81–1551.60 ± 88.24 mg/L, 0.8–0.15 mg/L and 69–105.32 ± 22.77 mg/L, respectively. The OLR were equal to 2.1, 3.0, 2.7 and 5.9 g COD/LUASB-day, with corresponding HRTs of 16, 11, 22 and 16 h, respectively, as illustrated in Table 4.
Table 4.
Operational conditions applied to UASB with sulfate addition (stages 5 to 8).
3.2. UASB Performance with and without the Addition of Sulfate
The performance of the UASB reactor for the first four stages (until day 85) is demonstrated in Table 5. COD/SO42− ratio was higher than 150, because the only amount of sulfate observed in the substrate was that resulting from the addition of molasses and ferrous sulfate; therefore, no sulfate was detected in the effluent. In addition, TOC removal ranged from 60.43 ± 7.32 to 83.27 ± 5.53%, while the methane percentage ranged from 42.43 ± 10.71 to 56.25 ± 8.52%. The highest iron accumulation (87%) was observed in stage 3, despite the high iron influent concentration. Maximum methane production was equal to 0.21 ± 0.07 L CH4/LUASB-day and observed at HRT 16 h and OLR 2.02 ± 0.26 g COD/LUASB-day. At this stage (stage 4), VFAs began to be produced due to the OLR increase.
Table 5.
Average value of each parameter during UASB operation before the sulfate addition.
In stages 5 to 8 (Table 6), the COD/SO42− ratio was gradually increased from 3.72 to 12.8 by the addition of sulfuric acid. The TOC removal was increased from 67.34 ± 5.81% to 94.81 ± 1.39%, while the methane content in the biogas varied from 69.43 ± 3.27 (stage 6) to 71.86 ± 1.21% (stage 5). It is noteworthy that the methane content was significantly improved with the sulfate addition from 56.25% in stage 4 to 71.9% in stages 5 and 8. Moreover, the methane production rate was increased by 40% (from 0.268 ± 0.07 L CH4/LUASB-day in stage 5 to 0.443 ± 0.135 L CH4/LUASB-day in stage 6) when HRT was reduced from 16 to 11 h and OLR was increased from 2.00 to 3.04 g COD/LUASB-day. Methane production was further increased to 0.608 ± 0.131 L CH4/LUASB-day (stage 7) and 0.837 ± 0.073 L CH4/LUASB-day (stage 8). In the latter stage, COD/SO42− was 12.5 ± 0.70 and the respective HRT, OLR and Fe concentrations were equal to 16 h, 5.94 ± 0.16 g COD/LUASB-day and 23.07 ± 3.49 mg/L. After the addition of sulfate (stages 5 to 8), pH and redox values remained at satisfactory levels for methane production, despite the accumulation of VFAs. Furthermore, the iron was accumulated in a percentage higher than 95% in the system, while the sulfate removal ranged from 59.61 ± 10.70 to 74.21 ± 13.09% in all applied COD/SO42− ratios after sulfate addition. Both output variables (COD and TOC removal%) appear to have approached their optimal values at COD/SO42− ratios equal to 7.90 ± 1.54 and 12.5 ± 0.70, respectively.
Table 6.
Average of each parameter during UASB operation after sulfate addition.
Figure 3 illustrates the performance of the UASB reactor during the 170 days. Figure 3A demonstrates the TOC removal in each of the eight stages. After the addition of sulfate, the TOC removal was increased. It is observed that in the last two stages where sulfate, iron and OLR were increased, the removal of the organic load reached its highest values (92.6% in stage 7 and 94.8% in stage 8). The latter was 12.2% higher than the maximum TOC removal from the first four stages obtained in stage 2. The methane yield in L of CH4/g CODremoved is shown in Figure 3B. A noticeable trend is observed whereby the methane yield was escalated when the OLR was reduced in stage 3 (from 0.67 to 0.47 g COD/L-day) and in stage 7 (from 3.04 to 2.65 g COD/L-day). The increase in methane yield can be attributed to the fact that the anaerobic bacteria have already acclimated to the OLR from the previous stage promoting the methane production. When the OLR was increased 4.3 times (stage 3 to 4) and 1.46 times (stage 5 to 6), the methane yield was decreased for the first 5–7 days until it increased again and stabilized at higher methane yield values. Nevertheless, when OLR reached the highest value of 5.94 g COD/L-day in stage 8, the methane yield dropped for 2 days and then started to increase during the first week (149th to155th day) before dropping to a value of about 0.16 L CH4/g CODremoved.
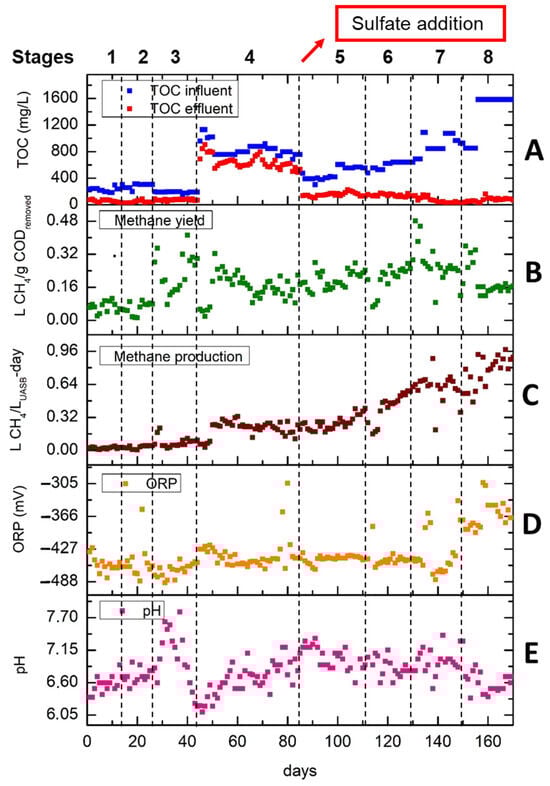
Figure 3.
UASB performance in all 8 stages. (A) TOC in the influent and effluent in mg/L; (B) methane yield in L CH4/gCODremoved; (C) methane production rate in L CH4/LUASB-day; (D) ORP in mV and (E) pH.
According to Figure 3C, after the addition of sulfate, the methane production rate (MPR) was gradually increased reaching values of more than 0.96 L CH4/LUASB-day. The MPR of stage 8 is almost four times higher than the one obtained in Stage 4. It is observed that when the OLR had risen more than 1 g COD/LUASB-day, the methane production rate was reduced for few days and then increased sharply (e.g., beginning of stage 6).
This behavior may be explained by the fast adaptation of anaerobic sludge to new conditions. Figure 3D,E depict the ORP and pH at each stage. Regarding ORP, it is observed that during the first seven stages there are no remarkable fluctuations, since the ORP values, except for single cases, are below −427 which is sufficient for methane production. In the last stage, ORP was increased due to the high OLR of 5.94 g COD/LUASB-day. Regarding Figure 3E, pH values vary between 6.1 and 7.8. It is observed that pH values are strongly related to OLR. The highest pH values are observed in stage 3 where OLR decreased slightly from 0.67 to 0.47 g COD/LUASB-day, while the sharp increase in OLR to 2 g COD/LUASB-day in stage 4 resulted in a decrease in pH from 6.6 to 6.1. Generally, the optimal conditions for ORP and pH under anaerobic conditions for methane production are lower than −300 mV and higher than 6.8, respectively [34].
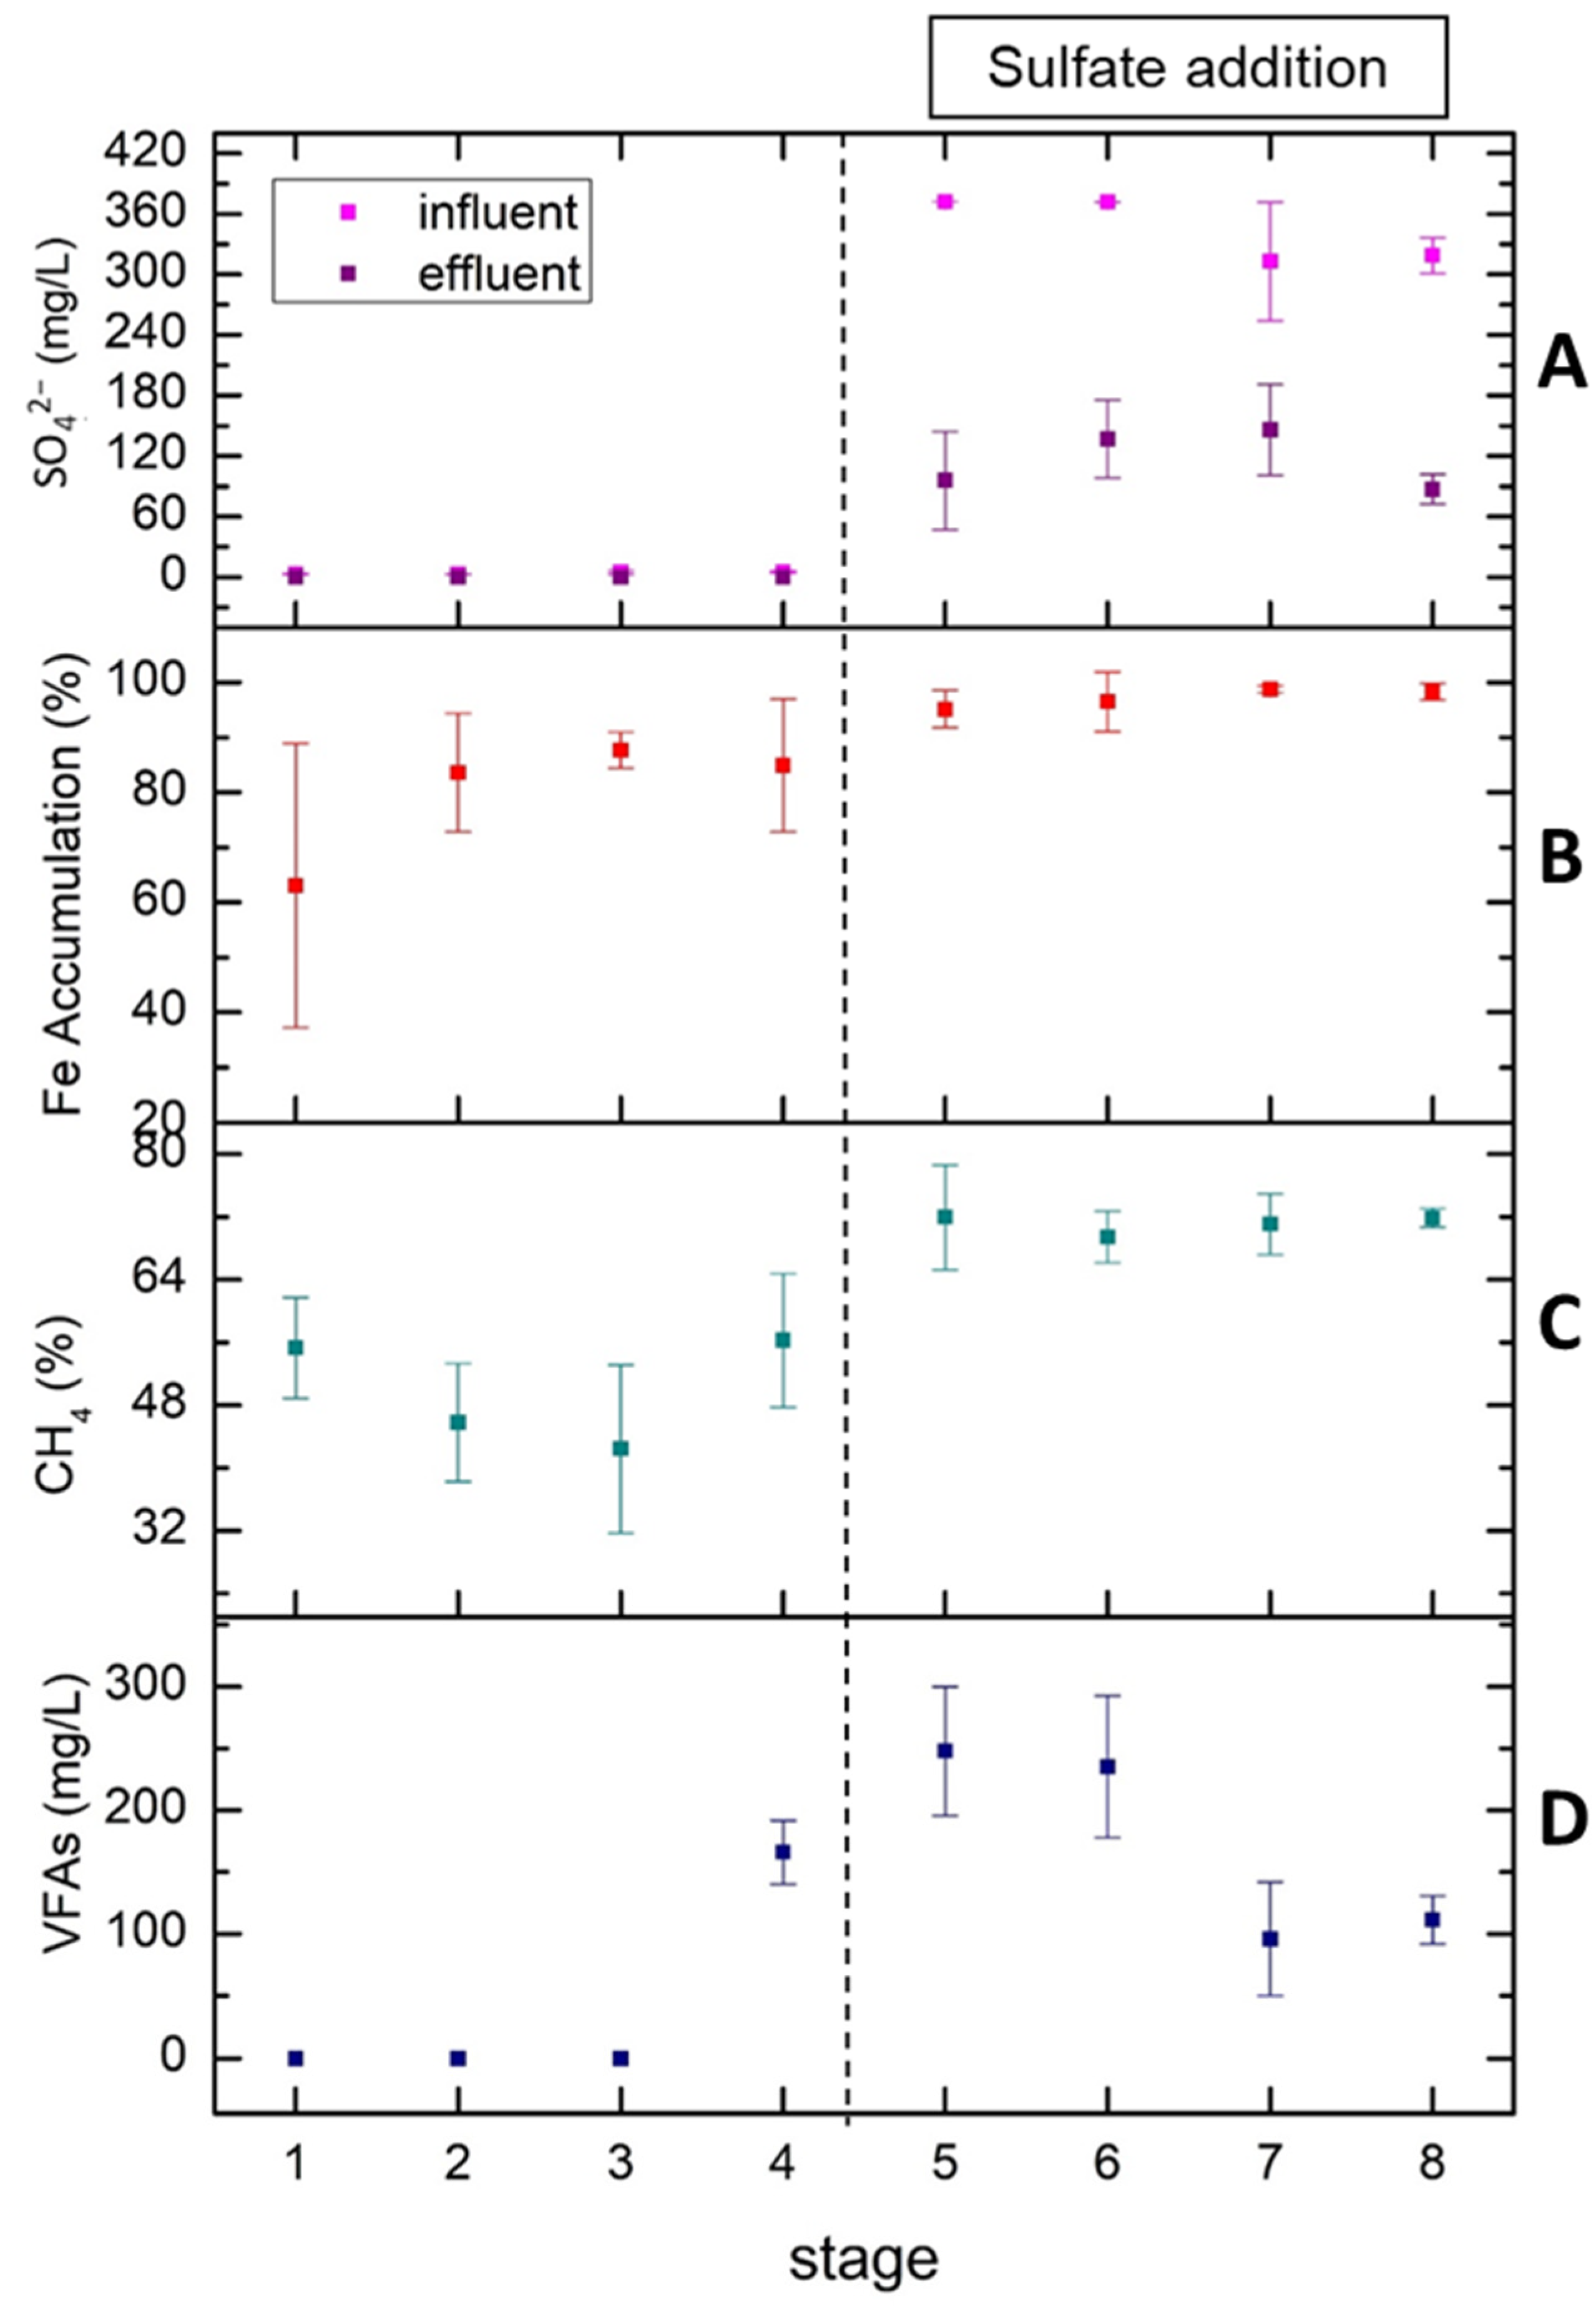
Figure 4A represents the sulfate removal as an average of measurements in each of the eight stages. As mentioned above, until stage 4, the only source of sulfate was molasses and as a result no sulfate was detected in the effluent. After the addition of sulfate in the form of sulfuric acid in stage 5, the sulfate concentration began to increase from 0 (stages 1 to 4) to 80–120 mg/L (stages 5 to 8). In stage 7, we decided to reduce the sulfate concentration in the influent from 360 mg/L to 300 mg/L due to the sulfate accumulation in stage 6. This reduction restored the system back to elevated sulfate removal values (72.2% in stage 8 and 74.2% in stage 5). According to Figure 4B, in the first four stages, the iron was accumulated in the system in a percentage ranging from 60 to 85% while the accumulation of iron approached 100% after the addition of sulfate. Although the influent iron concentration increased in stages 7 and 8, the iron in the effluent did not show any rise. It seems that the presence of sulfates enhanced the retention of iron within the bioreactor.
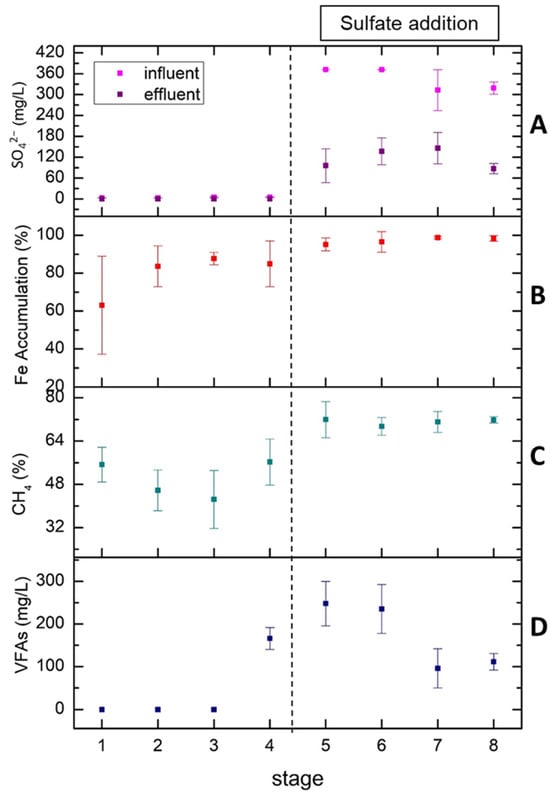
Figure 4.
Average values of sulfate in the influent and effluent (A), Fe accumulation (B), methane percentage in total biogas (C) and VFAs accumulation (D) at each of the 8 stages.
The percentage of methane in the total biogas produced is shown in Figure 4C. It can be seen that after the addition of sulfate, the methane percentage has the tendency to be stabilized at a remarkably high value of 71% with the deviation constantly decreasing from ±3.00 (stage 5) to ±0.50 (stage 8). The addition of sulfate into the system not only increases the methane content but also consolidates the biogas production rate. Finally, Figure 4D represents the total amount of VFAs produced in each stage. VFAs began to accumulate from 0 (stages 1 to 3) to 170 mg/L in stage 4 with OLR increasing from 0.47 to 2.02 g COD/LUASB-day. After the addition of sulfate, VFAs’ concentration was initially maintained at high levels (240–250 mg/L) in stages 5 and 6 before being reduced to low levels (100–110 mg/L) in stages 7 and 8. The low VFA concentrations in stages 7 and 8 are probably due to the higher iron concentration and COD/sulfate ratio [35]. In the final stages of the experiment, the system was so robust that even the sharp increase in OLR (stage 8) did not have negative impact, as VFAs and biomethane content remained at values close to 100 mg/L and 71%, respectively.
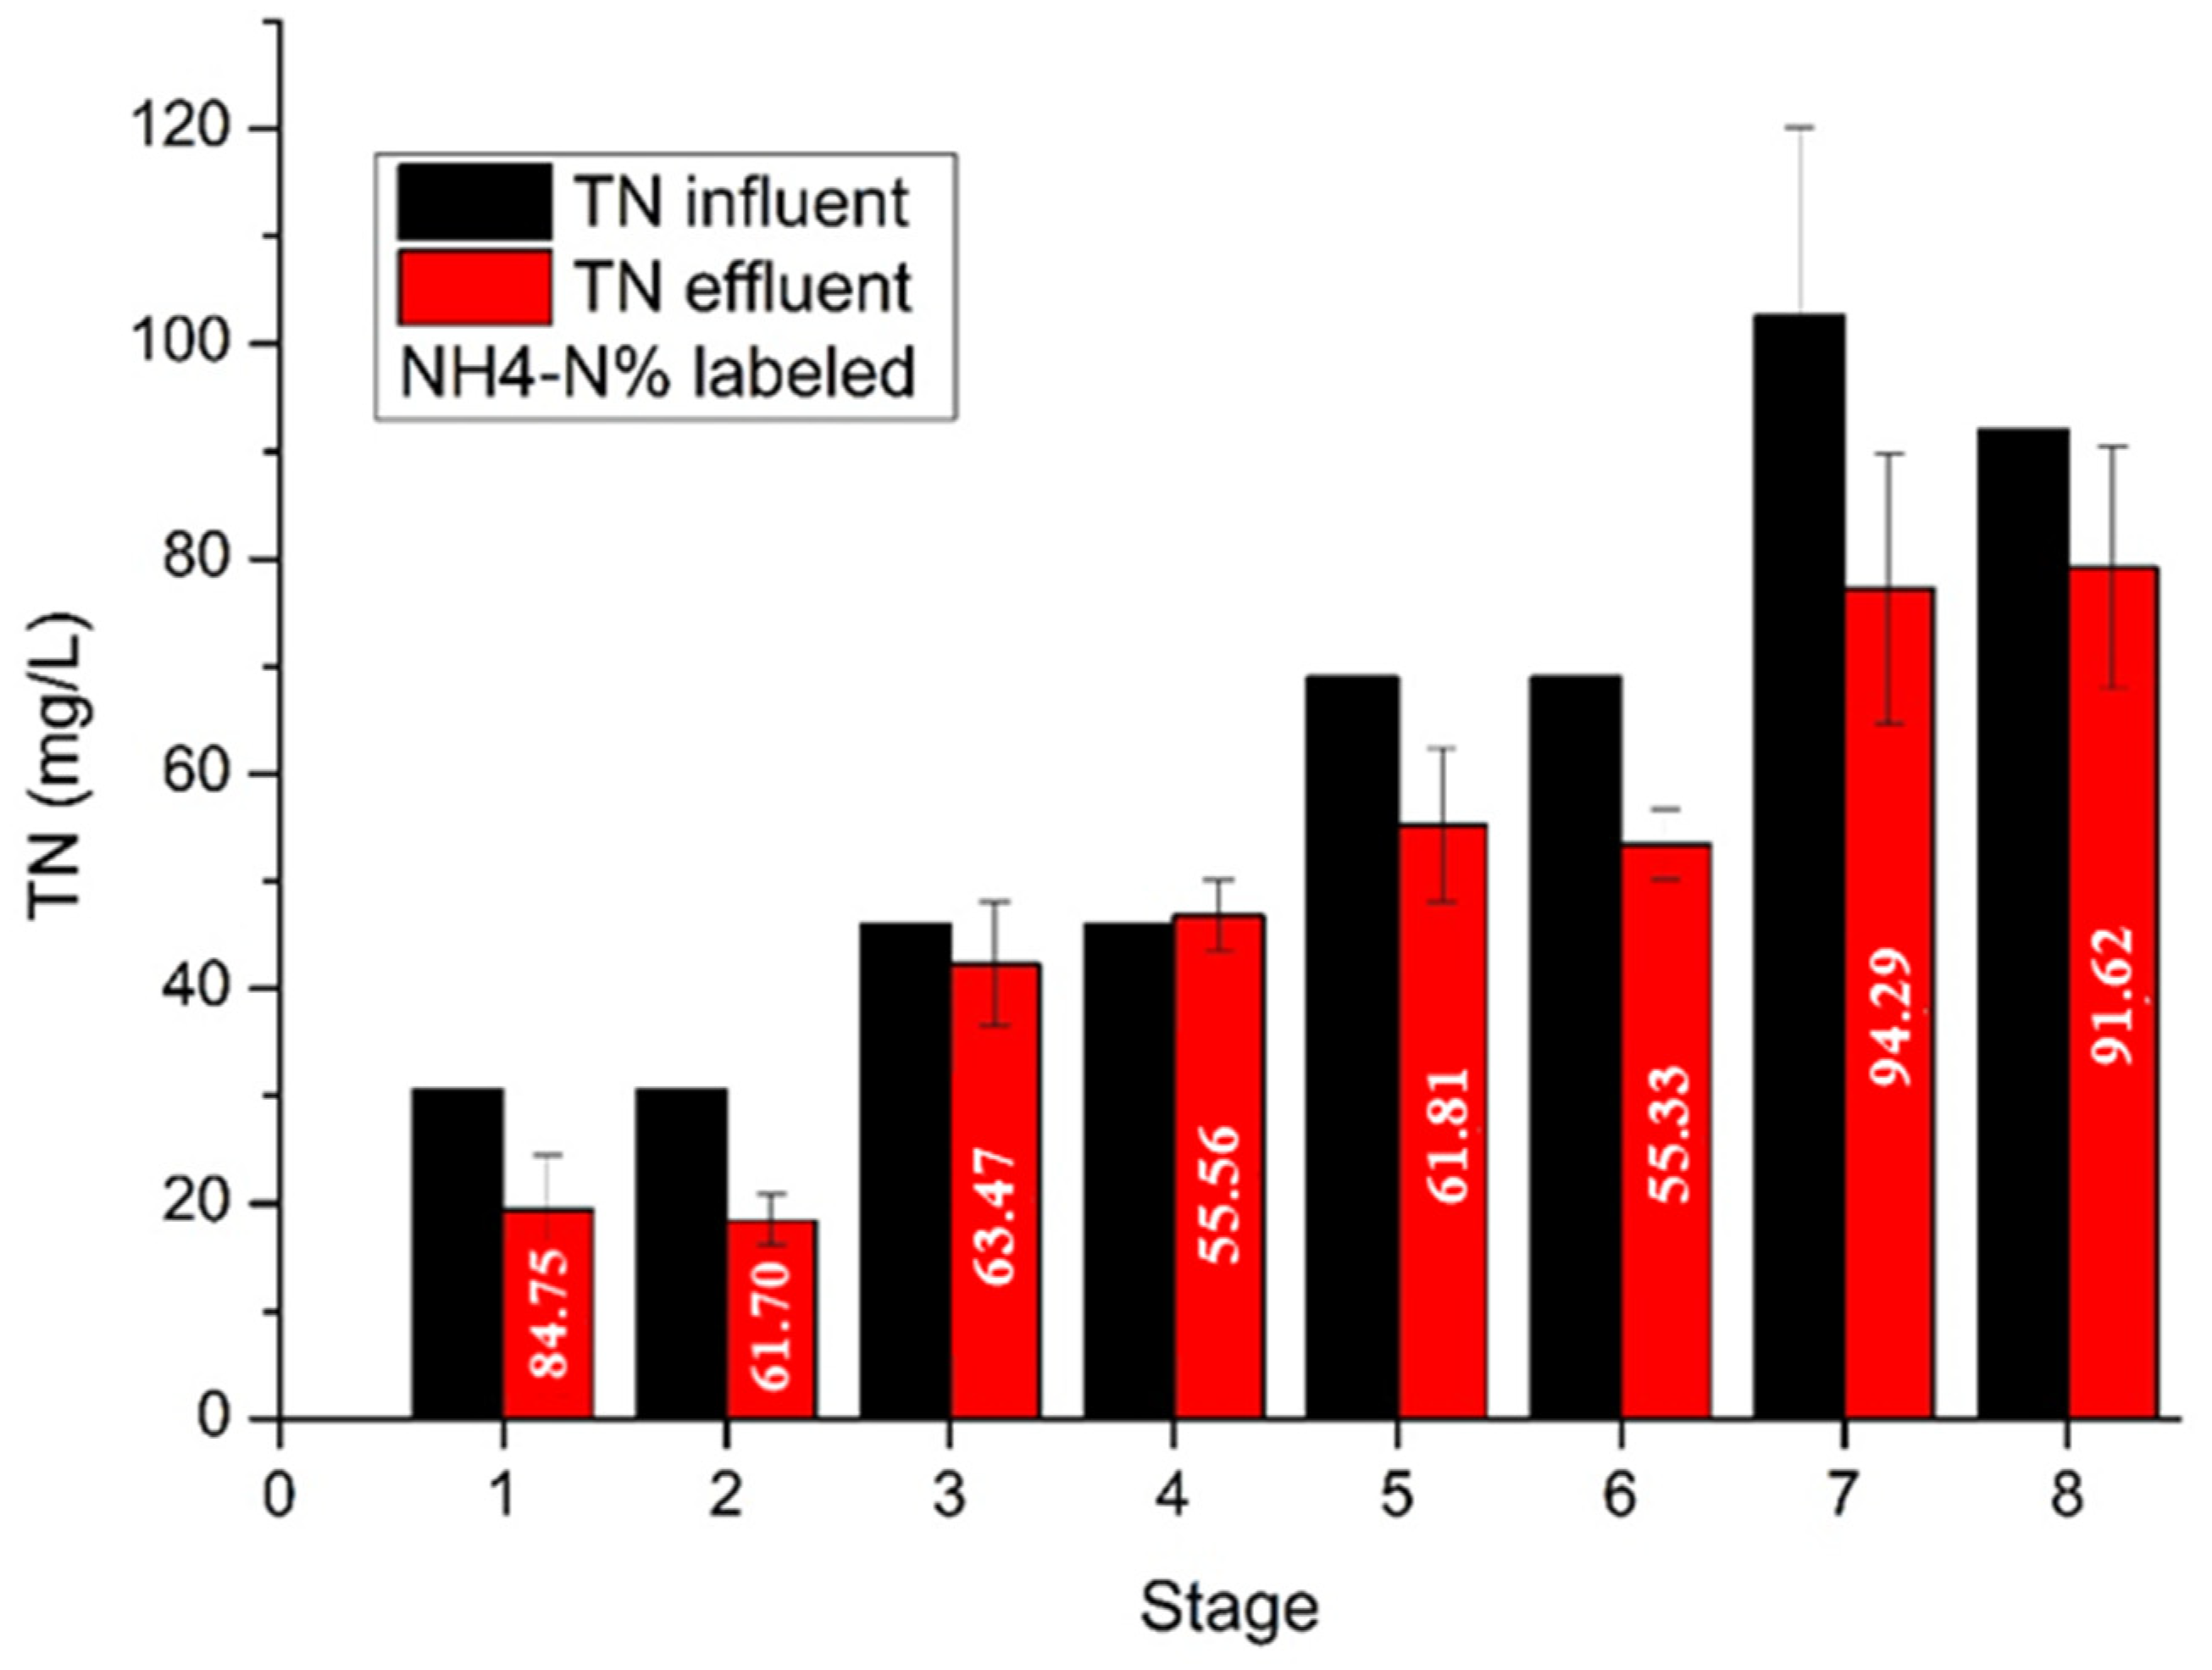
Figure 5 illustrates the nitrogen removal during the operation of the UASB reactor. It is observed that the nitrogen in the effluent was gradually raised as influent nitrogen was increased. In the first two stages, nitrogen was consumed at the high rate of 36.3% and 39.7%, respectively, due to microbial acclimation and biomass growth. In stages 3 and 4, nitrogen was accumulated in the reactor. After the sulfate addition, nitrogen removal was increased despite the increased nitrogen supply. More specifically, in stages 5 and 6 where the influent nitrogen concentration was 69 mg/L, nitrogen removal reached 19.87% and 22.58%, respectively, while in stages 7 and 8, where the influent nitrogen was 103 and 92 mg/L, the respective nitrogen removal had average values of 24.7% and 14.0%. In addition, the nitrogen in the effluent at stages 1, 7 and 8, was mainly in the form of ammonium, indicating the efficient activity of hydrolytic bacteria and the ammonification process in the reactor. The presence of accumulated ammonium in the UASB reactor can create a conducive environment for the growth of ammonium-oxidizing bacteria. In stages 2, 3, 4, 5 and 6, the ammonium concentration was low, ranging from 55% to 63% of the total nitrogen in the effluent. The accumulation of organic nitrogen in the effluent can be attributed to the limited activity of ammonifying bacteria, high amount of urea in the influent, washout of biomass, or insufficient contact time between the anaerobic bacteria and the feed.

Figure 5.
Total nitrogen in the influent and effluent. The percentage of NH4-N in the effluent is labeled.
The performance of the UASB reactor showed a relative stability from the first days of its operation. The anaerobic sludge utilized as inoculum was already activated and acclimated to potato wastewaters since it was obtained from the wastewater plant of the same industry from which the industrial starch was derived. The OLR did not exceed the value of 6 g/LUASB-day throughout the experimental period in order to avoid a decrease in COD removal efficiency and methane production due to the complex structure of starch [9]. During the first 85 days of the experiment, no considerable fluctuations were observed related to HRT modifications. The increased methane production L CH4/LUASB-day in stage 4 was due to the increase in OLR. After the sulfate addition, the COD/SO42− ratio was maintained higher than 3, in order to avoid sulfidogenesis [18] and maintain the sludge granule integrity [17]. Although in few other studies a low COD/SO42− ratio during anaerobic processes can result in a COD removal of less than 50%, in our study, the addition of sulfate and the increase in OLR increased both COD removal and methane production [36,37]. The increase in COD removal can be explained by the abundance of SRB in the system which utilize organic carbon for the production of new cell metabolites [38]. The stoichiometric ratio indicates that 1200 mg of COD is needed to reduce 1800 mg of sulfate [39]. It has been reported that among the different types of anaerobic reactors treating glucose at various COD/SO42− ratios, UASB achieved the highest organic matter and sulfate removal level [40]. Although the pH in the influent decreased after the addition of sulfate (from 6.7 to 4.5), the robustness of the UASB system maintained the pH at an appropriate level (6.3–7.4) for methane production. It has been reported that SRB can generate alkalinity that allows pH to increase [41,42]. The increased pH values in combination with high alkalinity promote acetogenesis and methanogenesis [43].
The use of sulfuric acid instead of other sulfate salts in this study allows for a more controlled and precise addition of sulfates. It helps maintain an optimal acidic environment minimizing pH fluctuations. Additionally, it is highly soluble in water, ensuring that it can easily react with other substances in the experiment. During the decomposition of H2SO4, hydrogen ions released that are not toxic for the anaerobic bacteria—since they can be used for microbial metabolism—and do not interfere with the overall performance of the system. This allows for a more accurate assessment of the specific impact of sulfates on the microbial community without introducing additional toxic effects that could confound the results. Moreover, sulfuric acid is commonly used in research and industrial applications due to its stability and availability. Several studies have focused on sulfuric acid pretreatment of substrates prior to anaerobic digestion in order to improve methane production [44,45]. Lastly, the use of sulfuric acid allows for more accurate dosing and easier adjustment of the sulfur content in the AD system. This flexibility is important for optimizing the process and ensuring efficient methane production. It is mentioned that sulfate released from sulfuric acid can be reduced by sulfate-reducing bacteria to form sulfide. This dissolved sulfide can then be oxidized to elemental sulfur by the action of ferric ions present in the system. Additionally, the released ferrous ions can react with the sulfide to form precipitates of iron sulfide [46].
The improved performance of the UASB reactor after the sulfate addition that was observed in this study is in agreement with Lu et al., 2016 [11], who stated that at COD/SO42− ratios of 3, 5 and 10, the respective average methane contents in a UASB reactor fed with starchy wastewater at an OLR of 4 g COD/LUASB-day were 67.2%, 64.0% and 61.6%. According to the authors, this improvement is due to the increase in the diversity of the microbial community which stimulates the hydrolysis–acidification of starch and promotes the degradation of propionate, ultimately resulting in enhanced acetoclastic methanogenesis. In addition, at COD/SO42− ratios between 2 and 10, they found a sulfate reduction of 52.7–77.1% and the sulfide produced was almost entirely aqueous. Our study demonstrates similar results regarding sulfate reduction (59.61 ± 10.70 to 74.21 ± 13.09%), indicating that there is no significant difference in sulfate removal among the various COD/SO42− ratios. However, when the iron addition was significantly increased (stage 8), the sulfate removal was high and more stable due to the precipitation of iron sulfides.
The improved and stabilized performance of the UASB reactor with low amount of VFAs in stages 7 and 8 is due to the long adaptation of the microbial community to the starchy substrate, the COD/SO42− ratio values (>7) and the increased iron influent concentration. The absence of high iron concentration in the influent in combination with added sulfate can play an important role in the increase in methane yield. The high iron accumulation in the UASB system after sulfate addition might be explained by the fact that in the presence of sulfate, iron precipitates as ferrous sulfide. As mentioned earlier, ferrous iron in the substrate can react with the sulfide produced by SRB, resulting in the precipitation of ferrous iron as FeS or FeS2 and reducing the negative impact of sulfide on methanogenesis [46,47]. In addition, iron precipitation has a positive impact on anaerobic granular sludge by enriching the microbial community [48,49] and granule stability [50].
The substrate was supplemented with nitrogen to maintain a low but adequate C/N ratio throughout the experimental period. Zhang et al., 2022 [51] reported that sulfate concentrations between 200 mg/L and 1200 mg/L can promote the organic removal and methane production during anaerobic digestion of nitrogenous wastewater. After the sulfate addition, nitrogen removal was increased due to the use of ammonium for microbial growth. Several studies have focused on the sulfate-reducing ammonium oxidation process, explaining that ammonium is used as an electron donor and sulfate as an electron acceptor producing nitrogen and elemental sulfur [52,53]. Other recent studies have explained the anoxic ammonia removal via Feammox processes, in which ammonium is converted to N2 using ferrous iron as an electron donor [54,55]. This fact can explain the high nitrogen removal in the last four stages, as there was an accumulated amount of iron within the reactor and the amount of iron in the substrate was high. In the current study, additional experimental data are required to comprehensively elucidate the significant phenomenon of nitrogen removal. This open field of research is extremely important to our research group and has great potential for further exploration.
3.3. Microbial Community with and without the Addition of Sulfate
The 16S rRNA gene sequencing was applied to investigate the impact of the sulfate addition on microbial diversity within the UASB reactor. Sequence analysis was performed based on similarity and representation of OTUs [56]. Sequences with ≥97% similarity were assigned to the same OTUs. The number of OTUs for sample A and B were 576 and 493, respectively, indicating good sampling from the UASB reactor. Alpha diversity was used to estimate the richness of microbial species within the sample. Table 7 shows the Shannon and Simpson indices, that indicate the diversity within the sample as well as the ACE and Chao1 estimators that reveal the microbial richness of the samples, before and after the sulfate addition. It is observed that microbial diversity and species richness decreased after 170 days of operation. According to Schloss et al., 2011 [57], high microbial diversity is observed when the Shannon index is high and the Simpson index has a low value. The Good’s Coverage, that expresses the ability of 16s rRNA to capture a greater percentage of microbial diversity including the rare diversity, was 99.9% for the two samples indicating that the sampling and sequencing effort conducted were sufficient to capture the majority of the bacterial diversity present.
Table 7.
Microbial diversity and richness estimators for the 2 samples.
Figure 6 illustrates the relative abundances in phylum level for the two samples. The phyla that predominate in the samples are Euryarchaeota, Firmicutes, Chloroflexi, Proteobacteria, Bacteroidetes, Caldiserica, Spirochaetes, Acidobacteria, Patescibacteria and Fusobacteria. However, the relative abundance of these bacteria changed before (Sample A) and after sulfate addition (Sample B). The relative abundance of the dominant Euryarchaeota which include methanogenic archaeal species, increased after the addition of sulfate from 32.50% to 35.46%, while the relative abundance of Chloflexi decreased from 25.97% to 13.98%. In addition, Proteobacteria decreased from 18.60% to 11.38%. Furthermore, after sulfate addition, the relative abundance of Firmicutes increased from 6.36% to 27.06%. This phylum can survive under extreme conditions such as highly acidic conditions and plays an important role in acidogenesis [58]. The relative abundance of Bacteroidetes increased from 4.72% to 5.02% while Caldiserica had a slightly lower relative abundance in sample B from 3.65% to 2.41%. The other phyla had a relative abundance of less than 1% before and after the sulfate addition; hence, we do not comment on them further. It has been reported that the phyla Euryarchaeota, Firmicutes, Chloroflexi, Proteobacteria, and Bacteroidetes predominate in anaerobic mesophilic reactors [59].
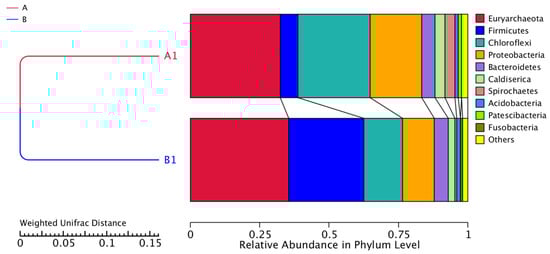
Figure 6.
Relative abundance in phylum level. Samples A1 and B1 were collected on days 85 and 170, respectively.
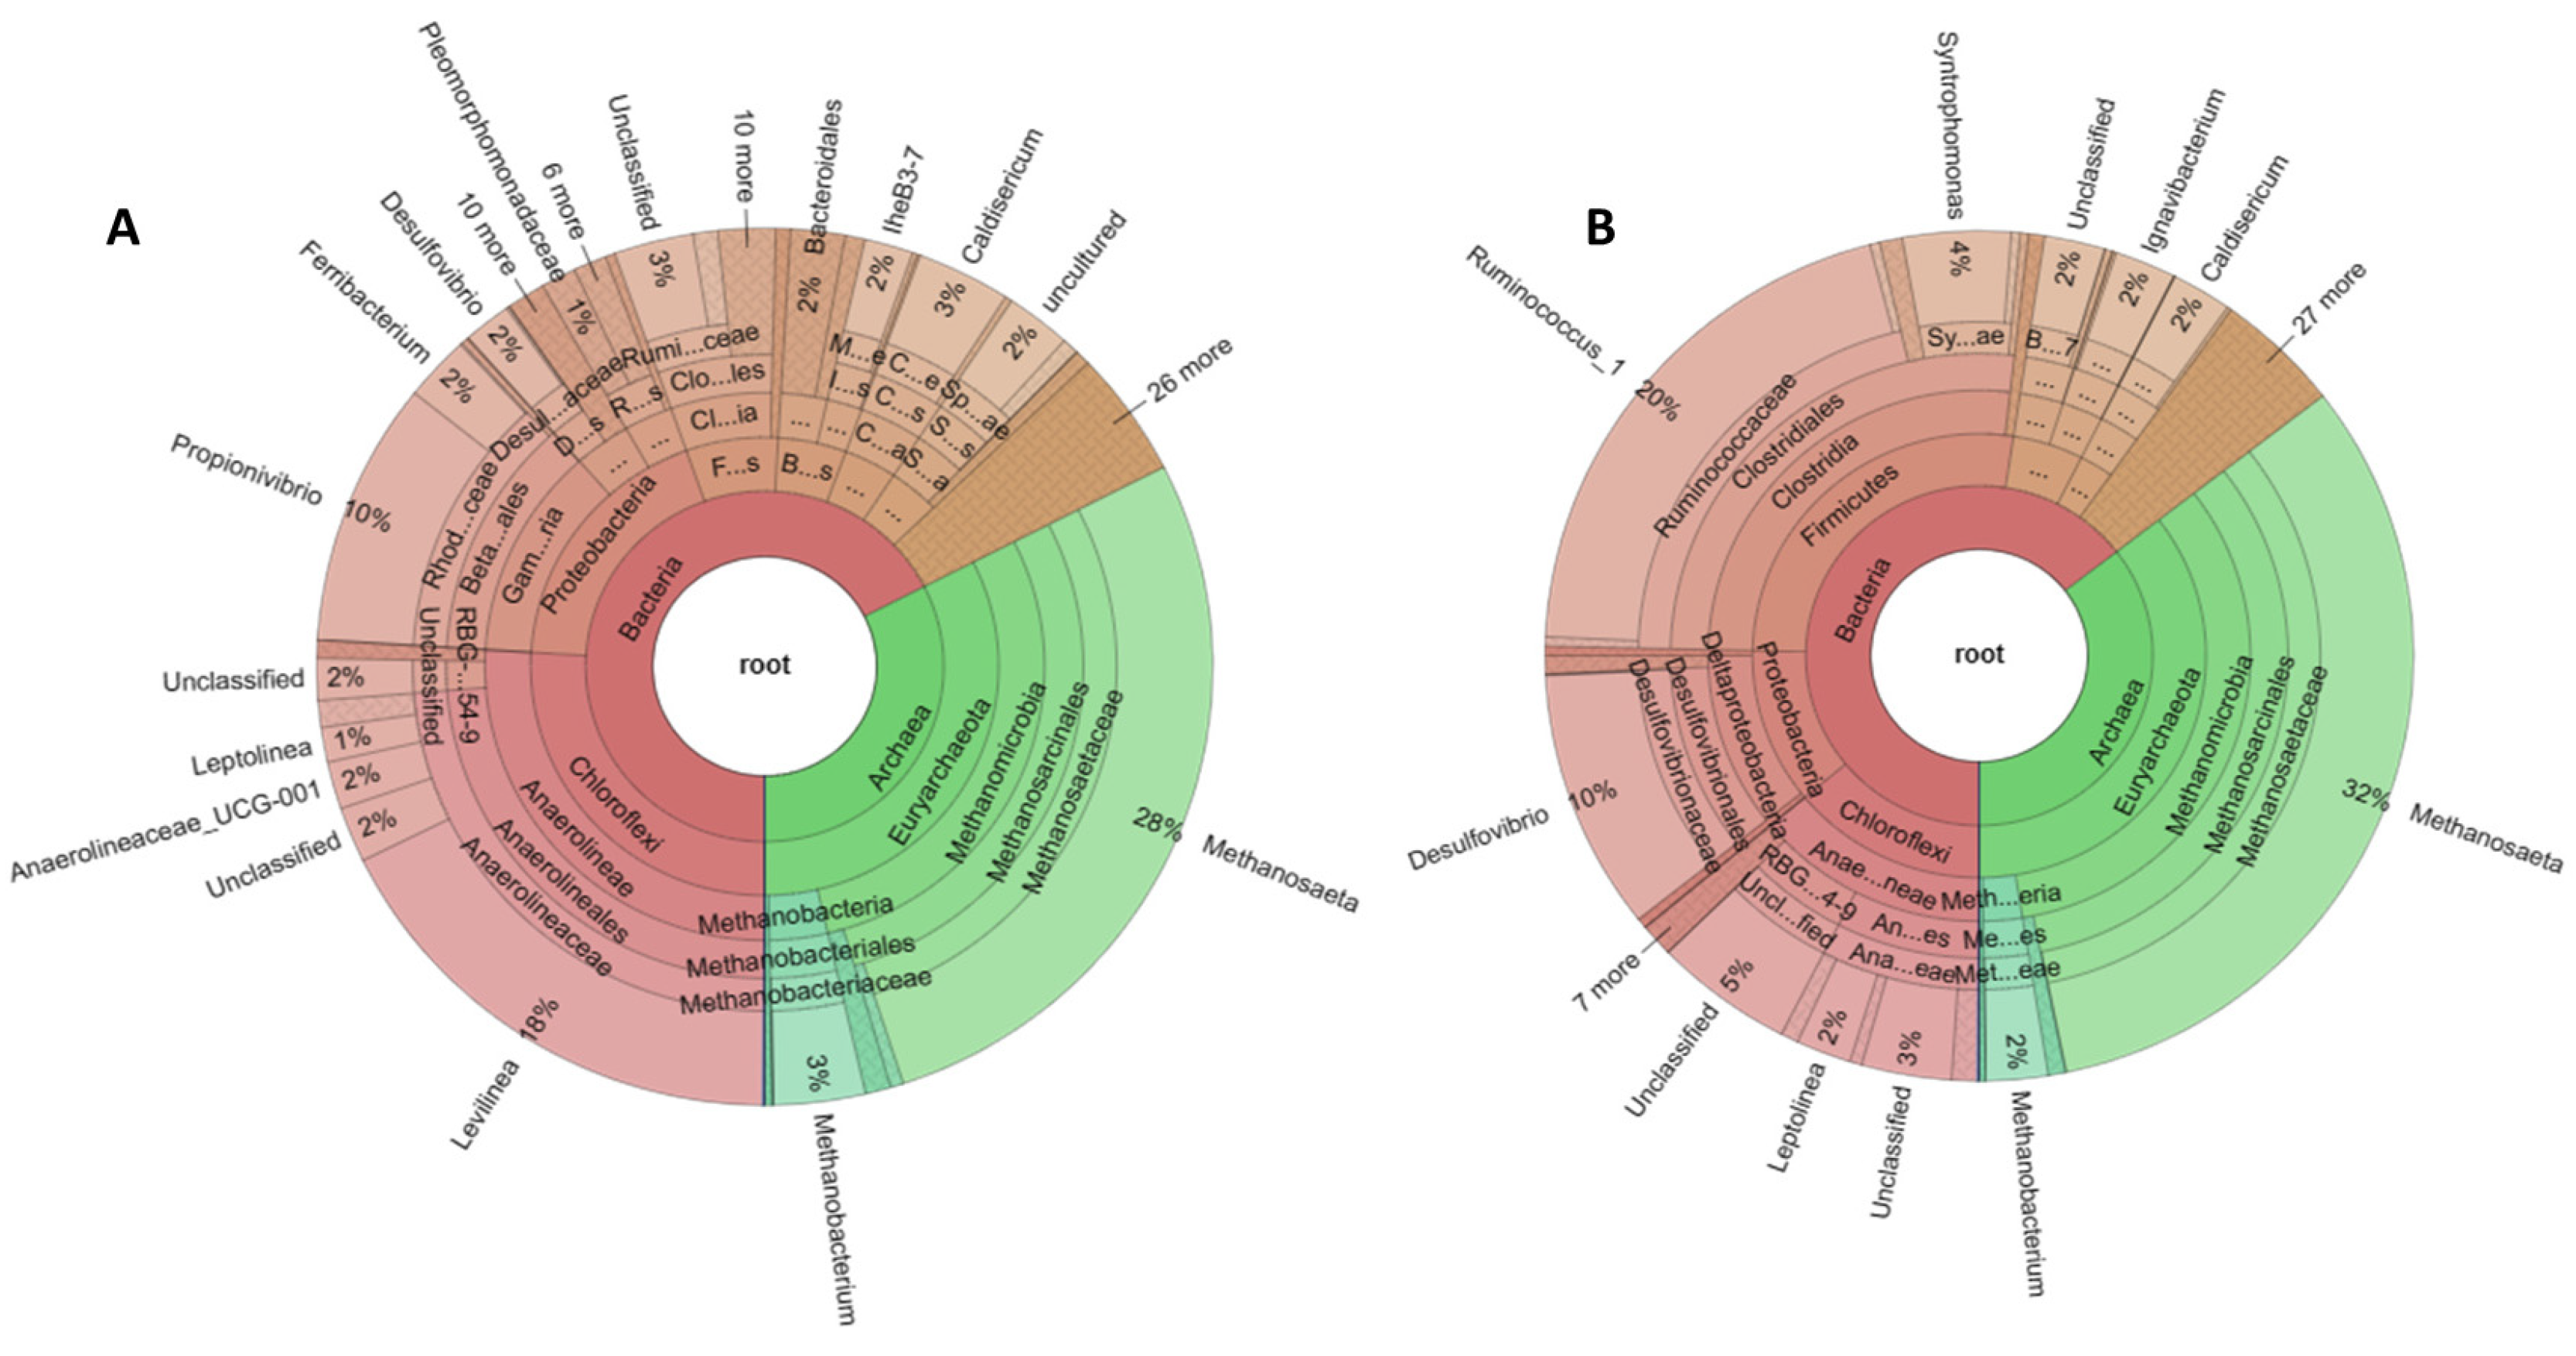
Krona graphs in Figure 7 represent the results of the taxonomic analysis for each sample depicting the predominant bacteria and archaea [60]. Each different circle in the graph corresponds to a different taxonomic rank. Before the addition of sulfate (Figure 7A), the predominant archaea at genus level were Methanosaeta sp with a relative abundance of 27.51%. followed by 3.3% for Methanobacterium sp., 0.49% for Methanospirillum sp., 0.47% for Methanosarcina sp. and 0.43% for Methanolinea sp. Regarding bacteria, Levilinea sp. dominated with a relative abundance of 17.7%, while Propionivibrio sp. had a high relative abundance of 9.75%. The relative abundance of Caldisericum sp., Ferribacterium sp., IheB3-7, Anaerolineaceae_UCG-001 and Desulfovibrio sp. is 3.4%, 2.4%, 1.76%, 1.48% and 1.74%, respectively.

Figure 7.
Krona graphs showing microbial community in the reactor. (A) corresponds to the sample collected before the addition of sulfate to the substrate (day 85); (B) corresponds to the sample collected after the addition of sulfate (day 170).
After the addition of sulfate to the substrate (Figure 7B), the predominant archaea are again Methanosaeta sp. but with an increased relative abundance of 32.25% followed by Methanobacterium sp. with 2.25% and Methanolinea sp. with 0.54%. Bacteria were dominated by Ruminococcus sp. with a relative abundance of 20.24% and Desulfovibrio sp. which belongs to SRB with 9.89%. Other bacteria with high relative abundance were Syntrophomonas sp. (4.02%), Ignavibacterium sp. (2.29%), Caldisericum sp. (2.25%), Leptolinea sp. (2.05%) and toluene-degrading methanogenic consortium bacterium (1.16%).
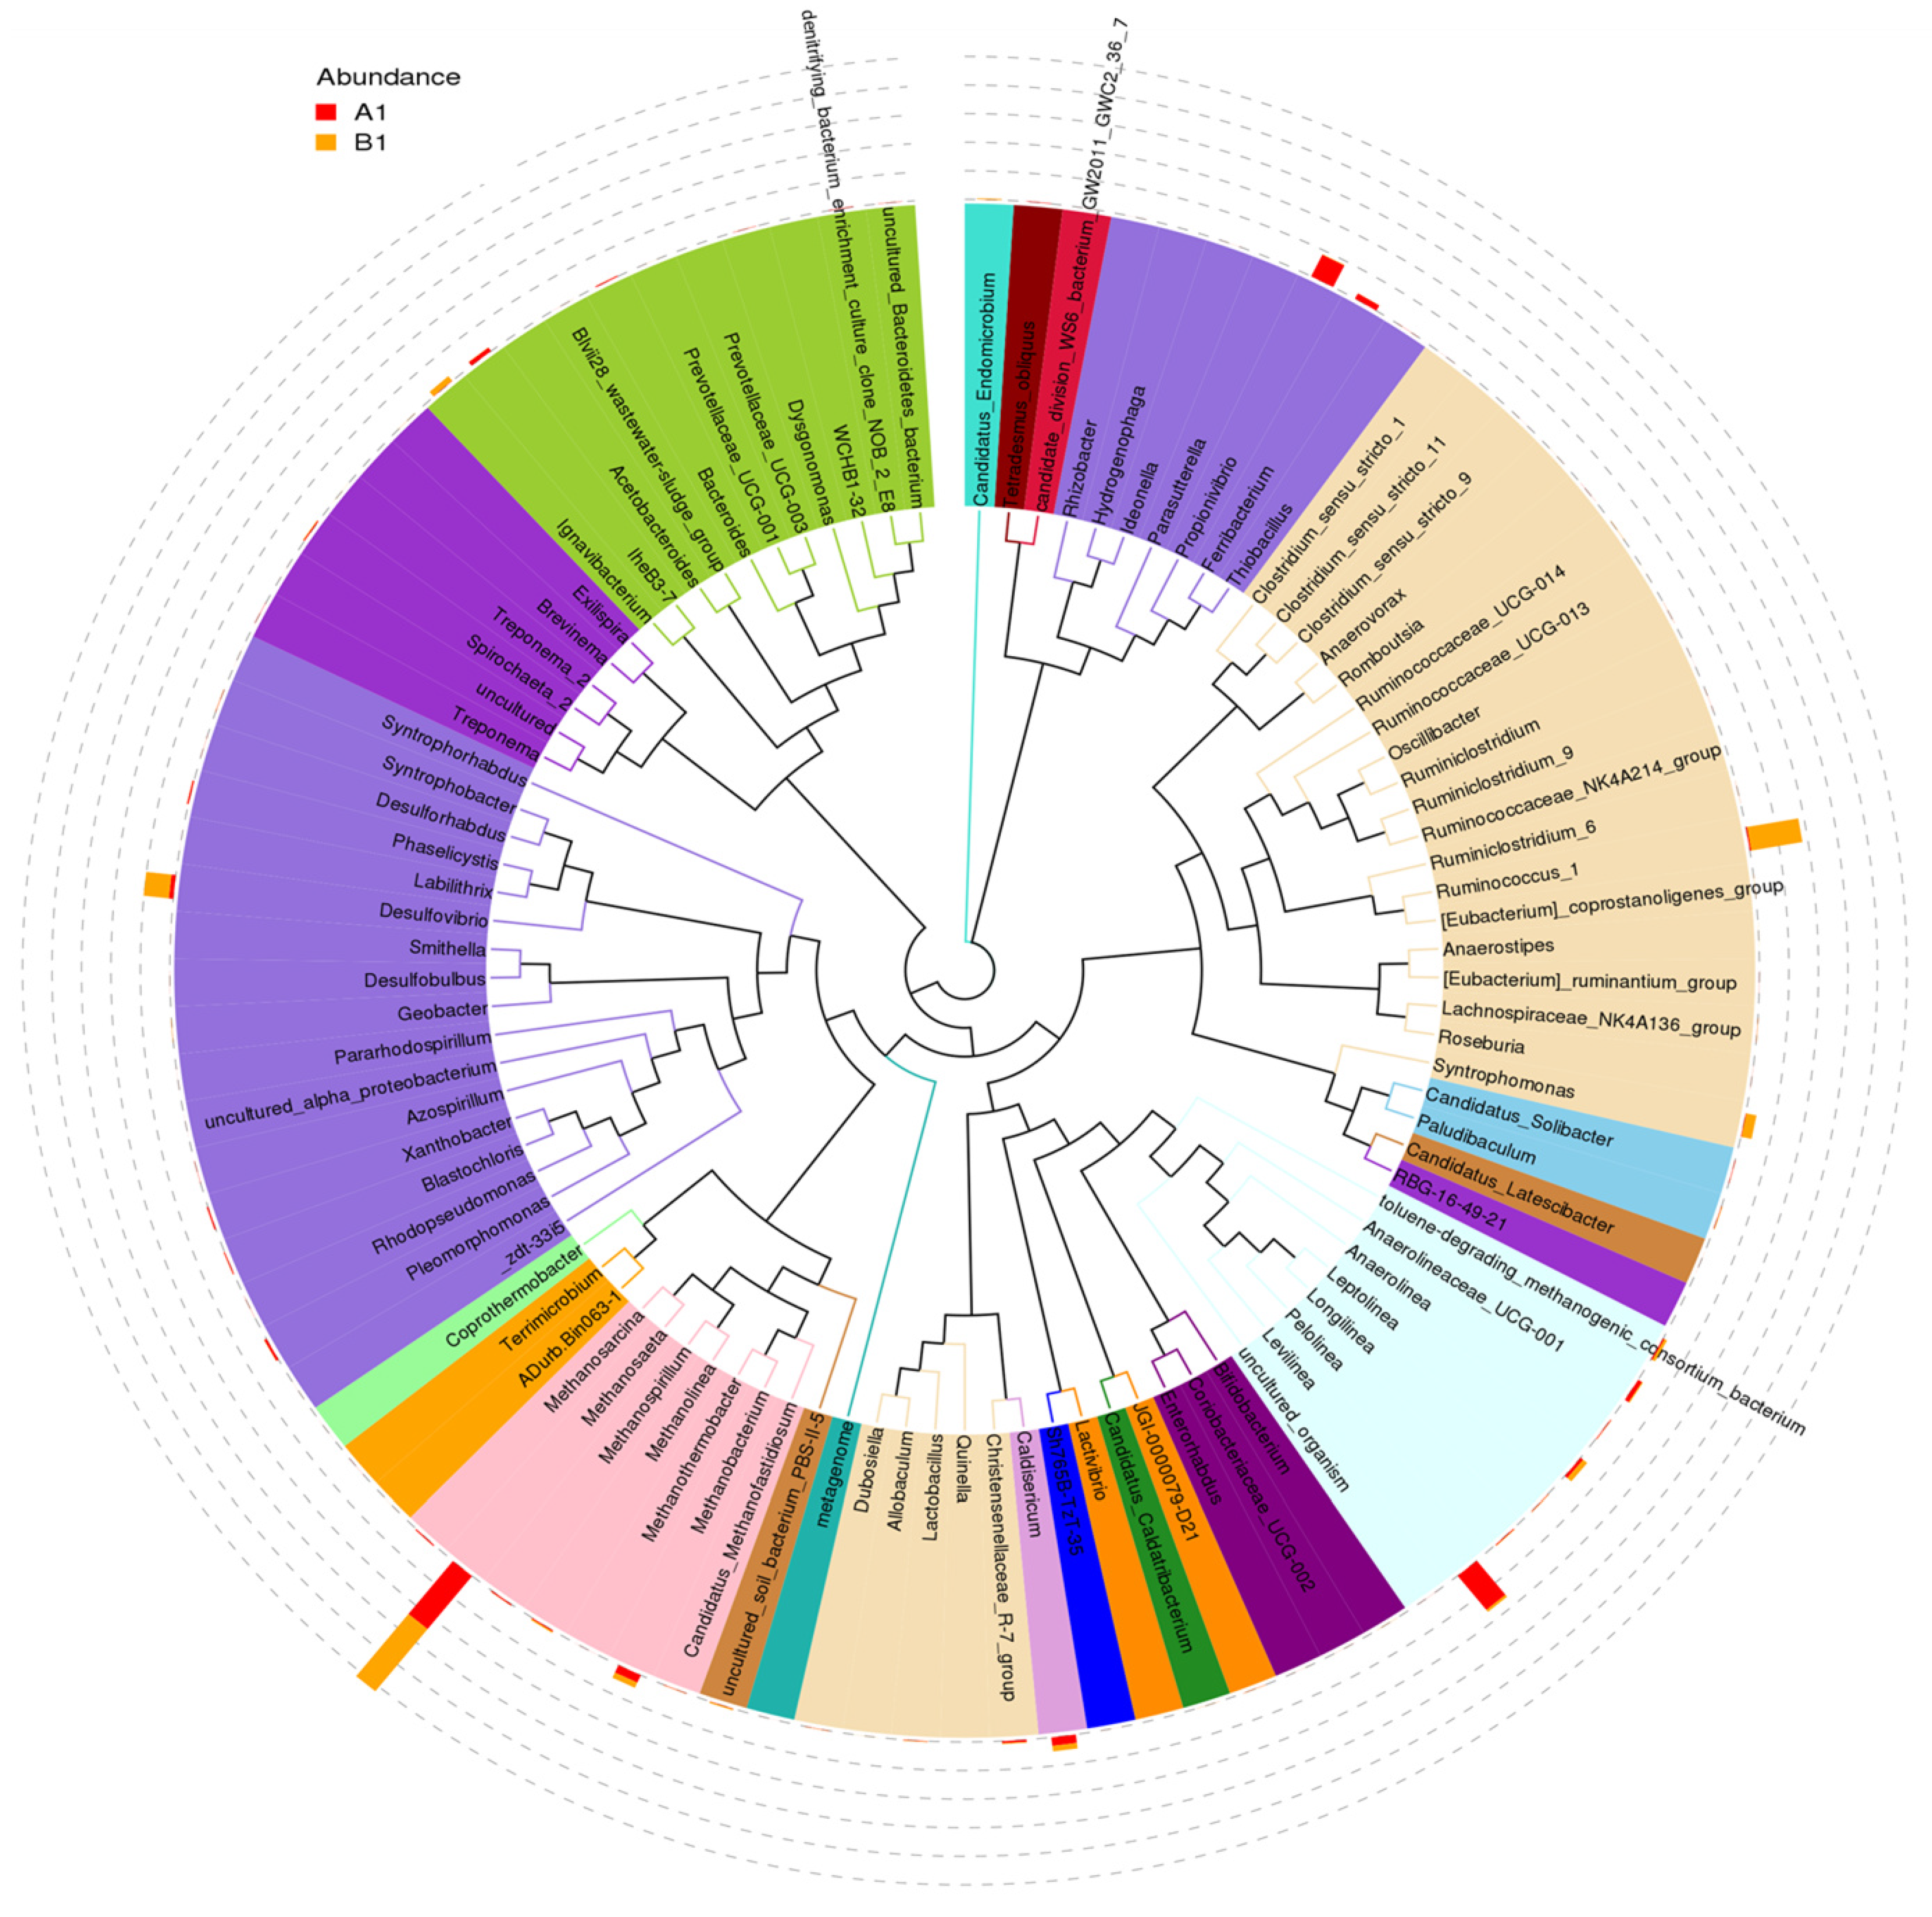
The distribution of the top 100 genera and the comparison between the relative abundance at genus level in the microbial community of samples A and B are shown in Figure 8. The red and orange bars correspond to microbial abundance before and after sulfate addition, respectively. In sample A, nine genera with relatively high abundance were observed. These are Methanosaeta, Methanobacterium, Levilinea, Caldisericum, Anaerilineaceae_UCG-001, Propionivibrio, Ferribacterium, IheB3-7, and Desulfovibrio. In sample B, seven genera with relatively high abundance were detected: Methanosaeta, Ruminococcus, Desulfovibrio, Syntrophomonas, Leptolinea, Ignavibacterium, and Caldisericum. After the addition of sulfate, Methanosaeta, Ruminococcus, Desulfovibrio, and Syntrophomonas showed higher abundance, while Levilinea, Propionivibrio, and Ferribacterium almost disappeared.
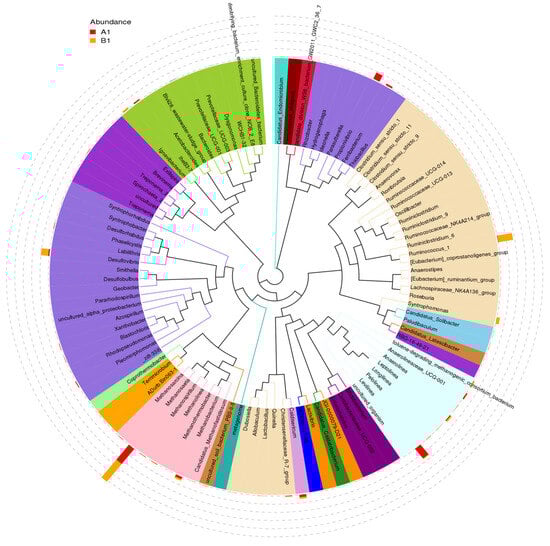
Figure 8.
The distribution of the top 100 genera and the relative abundance for the 2 samples. Sample A (labeled with red color) was collected before the sulfate addition. Sample B (labeled with orange color) was collected after the sulfate addition.
It is worth mentioning that the archaeal Euryarchaeota were the most abundant. This phylum participates in carbon conversion during anaerobic digestion and generates methane [61]. Microbial diversity at genus level indicates that most of the produced methane results from acetate reduction since the relative abundance of acetoclastic Methanosaeta sp. is higher than that of the other methanogens which use CO2 and H2 as a source of energy [62]. In addition, during the anaerobic fermentation of starch hydrolysates, monosaccharides are converted into acetate from Chloroflexi phylum. It is reported that the syntrophic relationship of Anaerolinae and Clostridia species improves the acidogenesis process. In the Anaerolinaceae family, many species have hydrolytic fermentative properties and can easily degrade glucose molecules. In addition, some of them help in the sludge granulation [43]. It can be noticed that Levilinea sp., which had the highest relative abundance among the bacterial genera, as acidogens can convert carbohydrates into organic acids [63,64]. Furthermore, the Rhodocyclaceae family which accounted for 12.23% in this study, is considered a very common microbial group in wastewater treatment processes [65]. Propionivibrio sp., which had a high relative abundance, accounting for 9.75%, utilizes sugars as an energy source and produces propionate. In this study, the organic acids produced during acidogenesis may be oxidized by Ferribacterium sp. (relative abundance of 2.4%) [66] using ferric iron from the substrate as an electron acceptor. The amount of iron in the substrate was already high due to the FeSO4·7H2O addition during the chemical oxidation of starch. In addition, some species from the Caldiserica phylum are associated with iron reduction in combination with sulfide oxidation [67]. Calsidericum sp., with a relative abundance of 3.4%, can reduce sulfur compounds such as elemental sulfur, thiosulfate or sulfite that were in the anaerobic system [68].
The low COD/SO42− ratio, the high OLR, as well as the increased iron concentration led to changes in microbial diversity, as indicated by the genomic analysis of sample B. Regarding the archaeal community, the relative abundance of Methanosaeta sp. was increased at 32.25% while all other archaea were diminished or remained at similar levels (Table 8). Consequently, the produced methane after the addition of sulfate derived from the acetate consumption instead of hydrogenotrophic metabolic pathway. Yang et al., 2015 [69], who studied the impact of sulfate addition (0.5–0.8 g/L) on methane production in a mesophilic anaerobic reactor feeding with acetate at an OLR of 4 g TOC/L-day, indicated that methane production was not affected by sulfate addition, while sulfate reduction became unstable (23–87%). In contrast to the present study, they noticed that with the increase in sulfate concentration in the substrate, hydrogenotrophic methanogenesis was promoted and the population of Methanosaeta sp. decreased. This fact could confirm the importance and necessity of iron in the anaerobic system. Ruminococcus sp. that showed the highest relative abundance in the bacterial community, belongs to acidogenic bacteria and produces H2 and short chain acids from soluble carbohydrates. Theoretically, 4 moles of H2 per mole of glucose can be produced [70]. This genus reduces a proton to hydrogen with the reduced electron carrier NADH or reduced ferredoxin [71,72]. Iron plays a crucial role in electron transfer and hydrogen formation since it is the active site of ferredoxin [73]. Yin et al., 2021 [74], who studied the hydrogen production from sewage sludge, showed that ferrous iron can improve the H2 yield as ferredoxin hydrogenase is activated by Fe2+ supplementation. The authors also pointed out that the addition of ferrous sulfate enhanced the degradation of organic compounds. In our study, the cumulative addition of iron seems to affect the acceleration of Ruminococcus sp. population. The increase in relative abundance of Desulfovibrio sp. should be directly related to the addition of sulfate. Desulfovibrio sp. bacteria belong to sulfate reducing bacteria (SRB) that reduce sulfate by using H2 as an electron donor [16]. In addition, some species of this genus also have the ability to reduce iron [75]. The increase in sulfate removal efficiency, except for the precipitation as ferrous sulfide, can also be explained by the increase in the SRB’s electron acceptors [41]. Paulo et al., 2015 [76] and Colleran et al., 1995 [77] have observed that SRB exhibit a higher affinity for H2 compared to methanogenic bacteria. This property gives a competitive advantage to SRB in environments where sulfates are abundant. In addition to that, Paulo et al., 2015 [76], mentioned that hydrogen offers a thermodynamic advantage over acetate as an electron donor for sulfate reduction. Niu et al., 2023 [78] investigated the sulfate removal rate under different influent sulfate concentrations in a UASB reactor treating acid mine drainage and observed that sulfate reduction by SRB was more favorable in communities with higher species diversity.
Table 8.
Relative abundance at genus level for Sample A and Sample B.
Furthermore, an increase in the Syntrophomonas sp. population from 0.3 to 4% was observed. This microbial group produces acetate from the degradation of fatty acids, and it is proved that it has a syntrophic role in the anaerobic oxidation of butyrate. Zhang et al., 2016 [79], investigated the DIET syntrophic methanogenesis in the presence of Fe3O4 in lake sediments and observed an acceleration of methane production due to iron. Syntrophomonas sp. was associated with methanogenic bacteria and bacteria that utilize hydrogen. Direct interspecies electron transfer (DIET) between bacteria that reduce iron and methanogenic archaea can enhance methane production [47]. Moreover, there was a noticeable increase in the relative abundance of Ignavibacterium sp., from 0.2% to 2.3%. Ignavibacterium species have been identified as potential participants in the Feammox process [80,81]. These bacteria can use ferric iron as an electron acceptor while oxidizing ammonium to nitrogen gas. This fact can confirm that the observed high nitrogen removal is due to N2 production by Ignavibacterium sp. It can be concluded that after the addition of sulfate, Ruminococcus sp. and Syntrophomonas sp. produce hydrogen and acetate, respectively, from carbohydrates supplied by starch hydrolysates that can be directly utilized by Desulfovibrio sp. The latter outcompete hydrogenotrophic methanogenic bacteria. Therefore, Methanosaeta sp. predominates in the microbial community and methane production is almost entirely derived from acetate.
In summary, all conditions applied after the sulfate addition affect the UASB performance as follows:
- Methane percentage in total biogas and methane production rate reached 71% and 0.84 L/LUASB-day, respectively, due to the increased amount of Methanosaeta sp. and direct interspecies electron transfer.
- The organic removal efficiency reached 95% due to the high amount of Ruminococcus sp. which utilize the soluble carbohydrates of the substrate.
- The amount of VFAs was kept low since some genera such as Syntorphomonas and Desulfovibrio can effectively use them as substrate.
- Sulfate removal reached 72% due to the reduction in sulfate by Desulfovibrio sp.
- Iron accumulation was increased to 98% probably due to precipitation as iron sulfide.
- At stages 5, 6, 7, and 8, nitrogen removal achieved values of 19.87%, 22.58%, 24.66%, and 13.92%, respectively, probably due to the oxidation of ammonium by Ignavibacterium sp.
4. Conclusions
This research reveals that after adding sulfate to the influent, the methane content of the biogas increases by 15% and methane production increases by three times. At low COD/sulfate ratios, Fe accumulation in the UASB reactor is increased because ferrous iron reacts with sulfide produced by SRB and precipitates. In addition, after sulfate addition, the population of Methanosaeta sp. increased while other methanogenic bacteria decreased indicating that methane was produced almost entirely by the acetatoclastic methanogenesis pathway. Improvement in methane production can be explained by the direct interspecies electron transfer (DIET) between methanogens and iron reducing bacteria. Finally, methane production and organic matter degradation in a UASB reactor treating starch hydrolysates can be significantly improved by using COD/SO42− ratios between 8 and 13, along with iron concentrations between 10 and 23 mg/L. Future recommendations in this field should be directed toward optimizing and analyzing the scalability of the UASB reactor for treating sulfuric acid enriched substrates at various COD to sulfate ratios. On top of that, future investigations should include the evaluation of the methane production potential of various organic substrates which already contain high levels of sulfate, such as the organic fraction of municipal solid waste and certain agro-industrial waste streams.
Supplementary Materials
The following supporting information can be downloaded at: https://www.mdpi.com/article/10.3390/su152014896/s1, Figure S1: number of publications investigating the effect of sulfur in anaerobic reactors over the last 23 years.
Author Contributions
Conceptualization, D.T.P. and A.G.V.; methodology, D.T.P. and K.P.; writing—original draft preparation, D.T.P.; writing—review and editing, A.A.V. and D.T.P.; supervision, A.G.V. and A.A.V. All authors have read and agreed to the published version of the manuscript.
Funding
This research is co-financed by Greece and the European Union (European Social Fund-ESF) through the Operational Programme «Human Resources Development, Education and Lifelong Learning» in the context of the project “Strengthening Human Resources Research Potential via Doctorate Research” (MIS-5000432), implemented by the State Scholarships Foundation (IKΥ).
Institutional Review Board Statement
Not applicable.
Informed Consent Statement
Not applicable.
Data Availability Statement
Not applicable.
Conflicts of Interest
The authors declare no conflict of interest.
References
- Li, J.; Zhou, M.; Cheng, F.; Lin, Y.; Shi, L.; Zhu, P.X. Preparation of oxidized corn starch with high degree of oxidation by fenton-like oxidation assisted with ball milling. Mater. Today Commun. 2020, 22, 100793. [Google Scholar] [CrossRef]
- Bouchareb, E.M.; Kerroum, D.; Arikan, E.B.; Isik, Z.; Dizge, N. Production of bio-hydrogen from bulgur processing industry wastewater. Energy Sources Part. A Recovery Util. Environ. Eff. 2021, 1–14. [Google Scholar] [CrossRef]
- Palimeri, T.D.; Papadopoulou, K.; Vlyssides, G.A.; Vlysidis, A.A. Hydrolysis optimization of by-products from the potato pro-cessing industry and biomethane production from starch hydrolysates. Sustainability 2023, 15, 14860. [Google Scholar]
- Daud, M.K.; Rizvi, H.; Akram, M.F.; Ali, S.; Rizwan, M.; Nafees, M.; Jinet, Z.S. Review of upflow anaerobic sludge blanket reactor technology: Effect of different parameters and developments for domestic wastewater treatment. J. Chem. 2018, 2018, 1596319. [Google Scholar] [CrossRef]
- Vlyssides, A.; Barampouti, E.M.; Mai, S. Determination of granule size distribution in a UASB reactor. J. Environ. Manag. 2008, 86, 660–664. [Google Scholar] [CrossRef] [PubMed]
- Fang, H.H.P. Microbial distribution in UASB granules and its resulting effects. Water Sci. Technol. 2000, 42, 201–208. [Google Scholar] [CrossRef]
- Hinken, L.; Huber, M.; Weichgrebe, D.; Rosenwinkel, K.H. Modified ADM1 for modelling an UASB reactor laboratory plant treating starch wastewater and synthetic substrate load tests. Water Res. 2014, 64, 82–93. [Google Scholar] [CrossRef]
- He, H.; Ji, X.; Xie, X.; Ding, X.; Wang, F.; Ding, J.; Hai, Z.; Tanget, R. Energy and economic evaluation of three generations of anaerobic reactors for starch wastewater treatment. Environ. Pollut. Bioavailab. 2019, 31, 252–260. [Google Scholar] [CrossRef]
- Lu, X.; Zhen, G.; Estrada, A.L.; Chen, M.; Ni, J.; Hojo, T.; Kubota, K.; Li, Y.Y. Operation performance and granule characterization of upflow anaerobic sludge blanket (UASB) reactor treating wastewater with starch as the sole carbon source. Bioresour. Technol. 2015, 180, 264–273. [Google Scholar] [CrossRef]
- Bouaita, R.; Derbal, K.; Panico, A.; Iasimone, F.; Pontoni, L.; Fabbricino, M.; Pirozzi, F. Methane production from anaerobic co-digestion of orange peel waste and organic fraction of municipal solid waste in batch and semi-continuous reactors. Biomass Bioenergy 2022, 160, 106421. [Google Scholar] [CrossRef]
- Musa, M.A.; Idrus, S.; Man, H.C.; Daud, N.N.N. Performance Comparison of Conventional and Modified Upflow Anaerobic Sludge Blanket (UASB) Reactors Treating High-Strength Cattle Slaughterhouse Wastewater. Water 2019, 11, 806. [Google Scholar] [CrossRef]
- Siddique, M.N.I.; Wahid, Z.A. Achievements and perspectives of anaerobic co-digestion: A review. J. Clean. Prod. 2018, 194, 359–371. [Google Scholar] [CrossRef]
- Rasapoor, M.; Young, B.; Brar, R.; Sarmah, A.; Zhuang, W.Q.; Baroutian, S. Recognizing the challenges of anaerobic digestion: Critical steps toward improving biogas generation. Fuel 2020, 261, 116497. [Google Scholar] [CrossRef]
- Wang, Z.; Wang, T.; Si, B.; Watson, J.; Zhang, Y. Accelerating anaerobic digestion for methane production: Potential role of direct interspecies electron transfer. Renew. Sustain. Energy Rev. 2021, 145, 111069. [Google Scholar] [CrossRef]
- Kot, A.M.; Pobiega, K.; Piwowarek, K.; Kieliszek, M.; Błażejak, S.; Gniewosz, M.; Lipińska, E. Biotechnological Methods of Management and Utilization of Potato Industry Waste—A Review. Potato Res. 2020, 63, 431–447. [Google Scholar] [CrossRef]
- Jing, Z.; Hu, Y.; Niu, Q.; Liu, Y.; Li, Y.Y.; Wang, X.C. UASB performance and electron competition between methane-producing archaea and sulfate-reducing bacteria in treating sulfate-rich wastewater containing ethanol and acetate. Bioresour. Technol. 2013, 137, 349–357. [Google Scholar] [CrossRef]
- Lu, X.; Ni, J.; Zhen, G.; Kubota, K.; Li, Y.Y. Response of morphology and microbial community structure of granules to influent COD/SO42− ratios in an upflow anaerobic sludge blanket (UASB) reactor treating starch wastewater. Bioresour. Technol. 2018, 256, 456–465. [Google Scholar] [CrossRef]
- Choi, E.; Rim, J.M. Competition and Inhibition of Sulfate Reducers and Methane Producers in Anaerobic Treatment. Water Sci. Technol. 1991, 23, 1259–1264. [Google Scholar] [CrossRef]
- Yang, G.; Zhang, G.; Zhuan, R.; Yang, A.; Wang, Y. Transformations, Inhibition and Inhibition Control Methods of Sulfur in Sludge Anaerobic Digestion: A Review. Curr. Org. Chem. 2016, 20, 2780–2789. [Google Scholar] [CrossRef]
- Lippens, C.; De Vrieze, J. Exploiting the unwanted: Sulphate reduction enables phosphate recovery from energy-rich sludge during anaerobic digestion. Water Res. 2019, 163, 114859. [Google Scholar] [CrossRef]
- Visser, A.; Beeksma, I.; van der Zee, F.; Stams, A.J.M.; Lettinga, G. Anaerobic degradation of volatile fatty acids at different sulphate concentrations. Appl. Microbiol. Biotechnol. 1993, 40, 549–556. [Google Scholar] [CrossRef]
- Zhang, C.; Lu, Q.; Li, Y. A review on sulfur transformation during anaerobic digestion of organic solid waste: Mechanisms, influencing factors and resource recovery. Sci. Total Environ. 2023, 865, 161193. [Google Scholar] [CrossRef] [PubMed]
- Zhang, L.; Schryver, P.; Gusseme, B.; Muynck, W.; Boon, N.; WVerstraete, W. Chemical and biological technologies for hydrogen sulfide emission control in sewer systems: A review. Water Res. 2008, 42, 1–12. [Google Scholar] [CrossRef] [PubMed]
- Gao, M.; Guo, B.; Zhang, L.; Zhang, Y.; Yu, Ν.; Liu, Y. Biomethane recovery from source-diverted household blackwater: Impacts from feed sulfate. Process Saf. Environ. Prot. 2020, 136, 28–38. [Google Scholar] [CrossRef]
- Li, W.; Niu, Q.; Zhang, H.; Tian, H.; Zhang, Y.; Gao, Y.; Li, Y.Y.; Nishimura, O.; Yang, M. UASB treatment of chemical synthesis-based pharmaceutical wastewater containing rich organic sulfur compounds and sulfate and associated microbial characteristics. Chem. Eng. J. 2015, 260, 55–63. [Google Scholar] [CrossRef]
- Jeong, T.Y.; Chung, H.K.; Yeom, S.H.; Choi, S.S. Analysis of methane production inhibition for treatment of sewage sludge containing sulfate using an anaerobic continuous degradation process. Korean J. Chem. Eng. 2009, 26, 1319–1322. [Google Scholar] [CrossRef]
- Hulshoff Pol, L.W.; Lens, P.N.L.; Weijma, J.; Stams, A.M.J. New developments in reactor and process technology for sulfate reduction. Water Sci. Technol. 2001, 44, 67–76. [Google Scholar] [CrossRef]
- Lu, X.; Zhen, G.; Ni, J.; Hojo, T.; Kubota, K.; Li, Y.Y. Effect of influent COD/SO42− ratios on biodegradation behaviors of starch wastewater in an upflow anaerobic sludge blanket (UASB) reactor. Bioresour. Technol. 2016, 214, 175–183. [Google Scholar] [CrossRef]
- Hu YJing, Z.; Sudo, Y.; Niu, Q.; Du, J.; Wu, J.; Li, Y.Y. Effect of influent COD/SO42− ratios on UASB treatment of a synthetic sulfate-containing wastewater. Chemosphere 2015, 130, 24–33. [Google Scholar] [CrossRef]
- Liu, Y.; Zhang, Y.; Ni, B.J. Zero valent iron simultaneously enhances methane production and sulfate reduction in anaerobic granular sludge reactors. Water Res. 2015, 75, 292–300. [Google Scholar] [CrossRef]
- Baird, R.; Eaton, A.D.; Rice, E.W.; Bridgewater, L.; American Public Health Association; American Water Works Association; Water Environment Federation. Standard Methods for the Examination of Water and Wastewater, 23rd ed.; American Public Health Association: Washington, DC, USA, 2017. [Google Scholar]
- Edgar, R.C. UPARSE: Highly accurate OTU sequences from microbial amplicon reads. Nat. Methods 2013, 10, 996–998. [Google Scholar] [CrossRef]
- Edgar, R.C. MUSCLE: Multiple sequence alignment with high accuracy and high throughput. Nucleic Acids Res. 2004, 32, 1792–1797. [Google Scholar] [CrossRef] [PubMed]
- Vongvichiankul, C.; Deebao, J.; Khongnakorn, W. Relationship between pH, Oxidation Reduction Potential (ORP) and Biogas Production in Mesophilic Screw Anaerobic Digester. Energy Procedia 2017, 138, 877–882. [Google Scholar] [CrossRef]
- Li, W.; Niu, Q.; Wu, J.; Luan, X.; Qi, W.; Zhang, Y.; Li, Y.Y.; Gao, Y.; Yang, M. Enhanced anaerobic performance and SMD process in treatment of sulfate and organic S-rich TMBA manufacturing wastewater by micro-electric field–zero valent iron-UASB. J. Hazard. Mater. 2019, 379, 120695. [Google Scholar] [CrossRef] [PubMed]
- Das, B.K.; Roy, S.; Dev, S.; Das, D.; Bhattacharya, J. Improvement of the degradation of sulfate rich wastewater using sweetmeat waste (SMW) as nutrient supplement. J. Hazard. Mater. 2015, 300, 796–807. [Google Scholar] [CrossRef]
- Li, J.; Wang, J.; Luan, Z.; Ji, Z.; Yu, L. Biological sulfate removal from acrylic fiber manufacturing wastewater using a two-stage UASB reactor. J. Environ. Sci. 2012, 24, 343–350. [Google Scholar] [CrossRef]
- Vossoughi, M.; Shakeri, M.; Alemzadeh, I. Performance of anaerobic baffled reactor treating synthetic wastewater influenced by decreasing COD/SO4 ratios. Chem. Eng. Process Process Intensif. 2003, 42, 811–816. [Google Scholar] [CrossRef]
- Maree, J.P.; Strydom, W.F. Biological sulphate removal from industrial effluent in an upflow packed bed reactor. Water Res. 1987, 21, 141–146. [Google Scholar] [CrossRef]
- Erdirencelebi, D.; Ozturk, I.; Cokgor, E.U.; Tonuk, G.U. Degree of sulfate-reducing activities on COD removal in various reactor configurations in anaerobic glucose and acetate-fed reactors. Clean—Soil Air Water. 2007, 35, 178–182. [Google Scholar] [CrossRef]
- Cunha, M.P.; Ferraz, R.M.; Sancinetti, G.P.; Rodriguez, R.P. Long-term performance of a UASB reactor treating acid mine drainage: Effects of sulfate loading rate, hydraulic retention time, and COD/SO42− ratio. Biodegradation 2019, 30, 47–58. [Google Scholar] [CrossRef]
- Costa, J.M.; Rodriguez, R.P.; Sancinetti, G.P. Removal sulfate and metals Fe+2, Cu+2, and Zn+2 from acid mine drainage in an anaerobic sequential batch reactor. J. Environ. Chem. Eng. 2017, 5, 1985–1989. [Google Scholar] [CrossRef]
- Antwi, P.; Li, J.; Opoku Boadi, P.; Meng, J.; Shi, E.; Xue, C.; Zhang, Y.; Ayivi, F. Functional bacterial and archaeal diversity revealed by 16S rRNA gene pyrosequencing during potato starch processing wastewater treatment in an UASB. Bioresour. Technol. 2017, 235, 348–357. [Google Scholar] [CrossRef]
- Kang, X.; Lin, R.; Li, L.; Wu, B.; Deng, C.; O’Shea, R.; Sun, Y.; Murphy, J.D. Assessment of pretreatment and digestion temperature on anaerobic digestion of whiskey byproducts and microbial taxonomy. Energy Convers. Manag. 2021, 243, 114331. [Google Scholar] [CrossRef]
- Syaichurrozi, I.; Villta, P.K.; Nabilah, N.; Rusdi, R. Effect of sulfuric acid pretreatment on biogas production from Salvinia molesta. J. Environ. Chem. Eng. 2019, 7, 102857. [Google Scholar] [CrossRef]
- Chen, L.; Zhang, Y.; Liang, J.; Li, Y.; Zhang, J.; Fang, W.; Zhang, P.; Zhang, G.; Ngo, H.H. Improvement of anaerobic digestion containing sulfur with conductive materials: Focusing on recent advances and internal biological mechanisms. Chem. Eng. J. 2023, 472, 144867. [Google Scholar] [CrossRef]
- Jin, Z.; Zhao, Z.; Zhang, Y. Insight into ferrihydrite effects on methanogenesis in UASB reactors treating high sulfate wastewater: Reactor performance and microbial community. Environ. Sci. Water Res. Technol. 2020, 6, 1794–1803. [Google Scholar] [CrossRef]
- Lin, H.; Zhu, L.; Xu, X.; Zang, L.; Kong, Y. Reductive transformation and dechlorination of chloronitrobenzenes in UASB reactor enhanced with zero-valent iron addition. J. Chem. Technol. Biotechnol. 2011, 86, 290–298. [Google Scholar] [CrossRef]
- Wang, S.M.; Tseng, S.-k. Dechlorination of trichloroethylene by immobilized autotrophic hydrogen-bacteria and zero-valent iron. J. Biosci. Bioeng. 2009, 107, 287–292. [Google Scholar] [CrossRef]
- Yoda, M.; Nishimura, S. Controlling granular sludge floatation in UASB reactors. Water Sci. Technol. 1997, 36, 165–173. [Google Scholar] [CrossRef]
- Zhang, H.; Zhang, X.; Chen, Z.; Liu, S.; Nai, C.; Ma, Y.; Zhang, H. Sulfate affects the anaerobic digestion process treating nitrogenous fertilizer wastewater. Biochem. Eng. J. 2022, 186, 108550. [Google Scholar] [CrossRef]
- Madani, R.M.; Liang, J.; Cui, L.; Zhang, D.; Otitoju, T.A.; Elsalahi, R.H.; Song, X. Novel simultaneous anaerobic ammonium and sulfate removal process: A review. Environ. Technol. Innov. 2021, 23, 101661. [Google Scholar] [CrossRef]
- Fdz-Polanco, F.; Fdz-Polanco, M.; Fernandez, N.; Urueña, M.A.; Garcia, P.A.; Villaverde, S. New process for simultaneous removal of nitrogen and sulphur under anaerobic conditions. Water Res. 2001, 35, 1111–1114. [Google Scholar] [CrossRef] [PubMed]
- Cisternas, J.; Rodríguez, C.; Serrano, J.; Leiva, E. Study of the key biotic and abiotic parameters influencing ammonium removal from wastewaters by Fe3+-mediated anaerobic ammonium oxidation (Feammox). Chemosphere 2023, 339, 139463. [Google Scholar] [CrossRef] [PubMed]
- Desireddy, S.; Sabumon, P.C.; Maliyekkal, S.M. Anoxic ammonia removal using granulated nanostructured Fe oxyhydroxides and the effect of pH, temperature and potential inhibitors on the process. J. Water Process Eng. 2020, 33, 101066. [Google Scholar] [CrossRef]
- Cheng, Z.; Hu, X.; Sun, Z. Microbial community distribution and dominant bacterial species analysis in the bio-electrochemical system treating low concentration cefuroxime. Chem. Eng. J. 2016, 303, 137–144. [Google Scholar] [CrossRef]
- Schloss, P.D.; Gevers, D.; Westcott, S.L. Reducing the Effects of PCR Amplification and Sequencing Artifacts on 16S rRNA-Based Studies. PLoS ONE 2011, 6, e27310. [Google Scholar] [CrossRef]
- Zhou, L.; Gao, Y.; Yu, K.; Zhou, H.; De Costa, Y.G.; Yi, S.; Zhuang, W.Q. Microbial community in in-situ waste sludge anaerobic digestion with alkalization for enhancement of nutrient recovery and energy generation. Bioresour. Technol. 2020, 295, 122277. [Google Scholar] [CrossRef]
- Magdalena, J.A.; Greses, S.; González-Fernández, C. Anaerobic degradation of protein-rich biomass in an UASB reactor: Organic loading rate effect on product output and microbial communities’ dynamics. J. Environ. Manag. 2020, 274, 111201. [Google Scholar] [CrossRef]
- Ondov, B.D.; Bergman, N.H.; Phillippy, A.M. Interactive metagenomic visualization in a Web browser. BMC Bioinform. 2011, 12, 385. [Google Scholar] [CrossRef]
- Ban, Q.; Zhang, L.; Li, J. Correlating bacterial and archaeal community with efficiency of a coking wastewater treatment plant employing anaerobic-anoxic-oxic process in coal industry. Chemosphere 2022, 286, 131724. [Google Scholar] [CrossRef]
- Zhang, Q.; Wang, M.; Ma, X.; Gao, Q.; Wang, T.; Shi, X.; Zhou, J.; Zuo, J.; Yang, Y. High variations of methanogenic microorganisms drive full-scale anaerobic digestion process. Environ. Int. 2019, 126, 543–551. [Google Scholar] [CrossRef]
- Zhang, Y.T.; Wei, W.; Huang, Q.S.; Wang, C.; Wang, Y.; Ni, B.J. Insights into the microbial response of anaerobic granular sludge during long-term exposure to polyethylene terephthalate microplastics. Water Res. 2020, 179, 115898. [Google Scholar] [CrossRef] [PubMed]
- Wu, J.; Jiang, B.; Kong, Z.; Yang, C.; Li, L.; Feng, B.; Luo, Z.; Xu, K.Q.; Kobayashi, T.; Li, Y.Y. Improved stability of up-flow anaerobic sludge blanket reactor treating starch wastewater by pre-acidification: Impact on microbial community and metabolic dynamics. Bioresour. Technol. 2021, 326, 124781. [Google Scholar] [CrossRef] [PubMed]
- Shi, L.; Liu, N.; Liu, G.; Fang, J. Bacterial community structure and dynamic changes in different functional areas of a piggery wastewater treatment system. Microorganisms 2021, 9, 2134. [Google Scholar] [CrossRef] [PubMed]
- Cummings, D.E.; Caccavo, F.; Spring, S.; Rosenzweig, R.F. Ferribacterium limneticum, gen. nov., sp. nov., an Fe(III)-reducing microorganism isolated from mining-impacted freshwater lake sediments. Arch. Microbiol. 1999, 171, 183–188. [Google Scholar] [CrossRef]
- Rissanen, A.J.; Peura, S.; Mpamah, P.A.; Taipale, S.; Tiirola, M.; Biasi, C.; Mäki, A.; Nykänen, H. Vertical stratification of bacteria and archaea in sediments of a small boreal humic lake. FEMS Microbiol. Lett. 2019, 366, fnz044. [Google Scholar] [CrossRef]
- Mori, K.; Yamaguchi, K.; Sakiyama, Y.; Urabe, T.; Suzuki, K.I. Caldisericum exile gen. nov., sp. nov., an anaerobic, thermophilic, filamentous bacterium of a novel bacterial phylum, Caldiserica phyl. nov., originally called the candidate phylum OP5, and description of Caldisericaceae fam. nov., Caldisericales ord. nov. and Caldisericia classis nov. Int. J. Syst. Evol. Microbiol. 2009, 59, 2894–2898. [Google Scholar] [CrossRef]
- Yang, S.L.; Tang, Y.Q.; Gou, M.; Jiang, X. Effect of sulfate addition on methane production and sulfate reduction in a mesophilic acetate-fed anaerobic reactor. Appl. Microbiol. Biotechnol. 2015, 99, 3269–3277. [Google Scholar] [CrossRef]
- Ntaikou, I.; Gavala, H.N.; Lyberatos, G. Modeling of fermentative hydrogen production from the bacterium Ruminococcus albus: Definition of metabolism and kinetics during growth on glucose. Int. J. Hydrogen Energy 2009, 34, 3697–3709. [Google Scholar] [CrossRef]
- Zheng, Y.; Kahnt, J.; Kwon, I.H.; Mackie, R.I.; Thauer, R.K. Hydrogen formation and its regulation in Ruminococcus albus: Involvement of an electron-bifurcating [FeFe]-hydrogenase, of a non-electron-bifurcating [FeFe]-hydrogenase, and of a putative hydrogen-sensing [FeFe]-hydrogenase. J. Bacteriol. 2014, 196, 3840–3852. [Google Scholar] [CrossRef]
- Nishio, N.; Nakashimada, Y. Hydrogen Generation from Food Industry and Biodiesel Wastes. In Food Industry Wastes, 1st ed.; Chapter 9; Kosseva, M., Webb, C., Eds.; Academic Press: Cambridge, MA, USA, 2013; Volume 1, pp. 157–170. [Google Scholar]
- Wu, H.; Wang, C.; Chen, P.; He, A.Y.; Xing, F.X.; Kong, X.P.; Jiang, M. Effects of pH and ferrous iron on the coproduction of butanol and hydrogen by Clostridium beijerinckii IB4. Int. J. Hydrogen Energy 2017, 42, 6547–6555. [Google Scholar] [CrossRef]
- Yin, Y.; Wang, J. Mechanisms of enhanced hydrogen production from sewage sludge by ferrous ion: Insights into functional genes and metabolic pathways. Bioresour. Technol. 2021, 321, 124435. [Google Scholar] [CrossRef] [PubMed]
- Lovley, D.R.; Roden, E.E.; Phillips, E.J.P.; Woodward, J.C. Enzymatic iron and uranium reduction by sulfate-reducing bacteria. Mar. Geol. 1993, 113, 41–53. [Google Scholar] [CrossRef]
- Paulo, L.M.; Stams, A.J.M.; Sousa, D.Z. Methanogens, sulphate and heavy metals: A complex system. Rev. Environ. Sci. Biotechnol. 2015, 14, 537–553. [Google Scholar] [CrossRef]
- Colleran, E.; Finnegan, S.; Lens, P. Anaerobic treatment of sulphate-containing waste streams. Antonie Van. Leeuwenhoek 1995, 67, 29–46. [Google Scholar] [CrossRef]
- Niu, L.; Sun, S.; Yu, F.; Zhang, X.; Fan, S.; Sun, Y.; Lin, W.; Wang, B.; Zhang, X. Performance of Sludge in the UASB Reactor for Treating Sulfate Wastewater: Sulfate Removal and Changes in the Community Structure Before and After Reaction. Water Air Soil. Pollut. 2023, 2023, 234–246. [Google Scholar] [CrossRef]
- Zhang, J.; Lu, Y. Conductive Fe3O4 nanoparticles accelerate syntrophic methane production from butyrate oxidation in two different lake sediments. Front. Microbiol. 2016, 7, 1316. [Google Scholar] [CrossRef]
- Iino, T.; Mori, K.; Uchino, Y.; Nakagawa, T.; Harayama, S.; Suzuki, K.I. Ignavibacterium album gen. nov., sp. nov., a moderately thermophilic anaerobic bacterium isolated from microbial mats at a terrestrial hot spring and proposal of Ignavibacteria classis nov., for a novel lineage at the periphery of green sulfur bacteria. Int. J. Syst. Evol. Microbiol. 2010, 60, 1376–1382. [Google Scholar] [CrossRef]
- Chen, Y.; Jia, F.; Liu, Y.; Yu, W.; Cai, W.; Zhang, X.; He, H.; Yao, H. The effects of Fe(III) and Fe(II) on anammox process and the Fe–N metabolism. Chemosphere 2021, 285, 131322. [Google Scholar] [CrossRef]


Disclaimer/Publisher’s Note: The statements, opinions and data contained in all publications are solely those of the individual author(s) and contributor(s) and not of MDPI and/or the editor(s). MDPI and/or the editor(s) disclaim responsibility for any injury to people or property resulting from any ideas, methods, instructions or products referred to in the content. |
© 2023 by the authors. Licensee MDPI, Basel, Switzerland. This article is an open access article distributed under the terms and conditions of the Creative Commons Attribution (CC BY) license (https://creativecommons.org/licenses/by/4.0/).