Abstract
This research examines the interrelationships among the scope of tourism, travellers’ food choices, and the restaurant business in European capitals. It employs a sustainable and electronic tool, Octoparse 8, to gather and analyse a substantial volume of data. The study utilises computerised data including a total of 10 million reviews pertaining to 21,885 eateries located in 27 European cities. The findings of the research indicate that a significant majority of travellers exhibit a preference for dining establishments that provide vegetarian-friendly and vegan alternatives, as well as gluten-free choices. Furthermore, these individuals tend to gravitate towards European and Mediterranean cuisine when selecting restaurants. There are a limited number of capital cities, like Madrid, Paris, and Rome, where visitors tend to choose local cuisine due to the renowned reputation and longstanding culinary traditions associated with these respective nations. When evaluating a restaurant, visitors do not rely on pricing as a determining factor. Additionally, when discussing captivating scenarios, it is important to examine the cities of Roma and Valetta.
1. Introduction
There is a growing interest among researchers in the study of food experience in the context of tourism [1]. Additionally, marketing practitioners are increasingly seeking to understand the behaviours and preferences of tourists in order to enhance decision-making processes and improve customer relationship management [2,3,4]. This interest is driven by the recognition that dining at restaurants is a fundamental need for tourists and ranks among the top five activities during their trips. Furthermore, food plays a crucial role in shaping the overall travel experience and has significant implications for budget allocation [5,6]. Furthermore, practitioners are also inclined to explore specific details such as the specific meals consumed by consumers for each meal type. This information is crucial for the development of targeted restaurant marketing strategies.
Limited research has been conducted on the attitudes of visitors towards cuisine in several tourist sites, including Belgium, Ghana, India, and Korea [7,8,9,10]. The scope of these research studies is restricted to some influential characteristics, such as the nationality and cultural background of visitors, which impact their choices and consumption patterns regarding food [11,12]. Moreover, these studies primarily concentrate on a limited range of food categories and certain segments within the tourist population. However, with regards to the macro-level connections between visitors’ choices and the overall tourist population, it is important to note that the existing research in this area is still in its early stages [13]. Moreover, the existing studies fail to provide a complete understanding of the links between different huge groups of visitors and their culinary preferences. These studies rely on conventional and ineffective research tools such as surveys and questionnaires.
Academic researchers place considerable emphasis on online resources that facilitate the sharing of travel experiences by tourists on various platforms, including TripAdvisor, Airbnb, and Yelp. These platforms serve as effective channels for gathering information on tourist preferences in a nonintrusive manner, as highlighted in studies conducted by other authors [14,15,16,17,18]. Restaurant evaluations often exist in the form of spontaneous writing, which implies that they lack a systematic format and are not explicitly prepared for immediate use.
This article aims to fill the research gaps identified in previous studies that have examined the behaviour of tourists when discussing their food preferences. These studies have primarily relied on the analysis of large-scale restaurant reviews obtained from online platforms. To address these gaps, we propose the utilisation of a novel instrument and an innovative approach for data collection and analysis. The research aims to achieve the following objectives: to develop a comprehensive framework capable of processing and analysing restaurant reviews, with the goal of providing in-depth insights into the food preferences and subjective opinions of tourists; and to validate the efficacy of the proposed method by conducting a study that utilises a substantial volume of data from restaurants located in European capitals.
The choice of EU capitals as the focus of our analysis was based on their prominence as tourist destinations, as shown by Eurostat figures in 2022 [3]. An examination of the findings, derived from a sample size of 21,885 eateries across 27 European cities, offers valuable insights into the overall habits and preferences shown by visitors.
The suggested methodology aims to provide academics and practitioners with valuable insights into visitors’ food choices. This will be achieved by using internet restaurant reviews as an alternate information source, in lieu of standard surveys and questionnaires often used to gather such preferences.
The following part presents a theoretical framework that encompasses pertinent literature on the culinary preferences of visitors, as well as an overview of research conducted on the behaviour of food tourists within the realm of European tourism. The third portion of this paper provides an overview of the constraints inherent in the previous studies. Additionally, it delves into the tools and methodology used to extract and analyse restaurant evaluations for the purpose of analysing food preferences. Furthermore, the study design is expounded upon in this section. The fourth portion of the research paper focuses on presenting the outcomes of the study conducted on tourists who visit European cities. This is followed by an analysis and discussion of the findings. Finally, the paper concludes by providing theoretical and managerial insights. The concluding portion of the research paper serves to summarise the main findings and implications of the study, while also outlining potential avenues for future research.
2. Theoretical Background
2.1. Framework
2.1.1. Food and Tourism
The consumption of local food has significant importance within the cultural tourism sector [19,20,21,22]. It is well recognised that partaking in local cuisine is a crucial aspect of the overall tourism experience. When engaging in travel, visitors actively seek genuine and distinctive encounters; partaking in the consumption of local cuisine serves as a technique to foster a tighter connection between tourists and the culture of the host destination. The study conducted in 2009 [1] provided evidence to support the notion that sampling local cuisine while travelling may provide individuals with opportunities to engage in local cultural experiences and encounter distinctive and authentic attractions. Furthermore, the culinary offerings of a tourist destination serve as a distinguishing characteristic and contribute to the competitive advantage of the tourism sector in many countries, as shown by the implementation of effective marketing tactics [23,24]. Furthermore, it is possible to establish a favourable correlation between cuisine and a certain location, since culinary offerings are often associated with national identities, such as Chinese, French, Italian, and Mexican cuisines [25,26].
Some authors [5,7,27,28] have directed their attention towards investigating the potential impact of nationality on the behaviour of visitors regarding food consumption. Additionally, these studies have explored the extent to which tourists are eager to engage with and sample culinary offerings from different cultural backgrounds [9,29,30].
The examination of restaurant attributes beyond food is a subject of scholarly investigation seeking to ascertain their impact on customer satisfaction [30,31,32]. These studies examined the significance of various factors such as service quality, cleanliness, atmosphere, health considerations, and pricing in the decision-making process of selecting a restaurant. Nevertheless, it is worth noting that the aforementioned research studies were conducted on a rather limited sample size of visitors, using conventional methods of data collecting and analysis, such as questionnaires and surveys.
Given the considerable attention devoted to European gastronomic tourism in various scholarly investigations [33,34,35,36,37], there exists a dearth of research examining the culinary inclinations of tourists who embark on journeys for purposes other than gastronomy. The significance and examination of food tourism have been increasingly recognised, with a plethora of studies focusing on the promotion of tourist destinations [38,39,40,41,42]. However, there is a dearth of research that specifically analyses the preferences of European tourists for various cuisines and local food.
Food tourism is driven by a multitude of motivations, including the desire to encounter new culinary traditions, gain insights into indigenous food cultures, savour exceptional and genuine gastronomic offerings, as well as the aspiration to acquire knowledge about the historical background and cultural customs associated with a certain gastronomy [21,43].
Food tourism offers several advantages for both locations and travellers. In terms of travel destinations, food tourism has the potential to contribute significantly to enhancing the generation of tourist income, making a positive impact on the advancement of sustainable development [44].
However, food tourism growth is accompanied by several obstacles and possibilities, including the imperative lying in guaranteeing the sustainability of food tourism while concurrently maximising its positive impact on local communities and also the inclusion of a diverse range of food choices to accommodate various dietary requirements and personal preferences [21,45].
Several prospects exist in the development of food tourism: the process of creating novel and inventive culinary tourism offerings and encounters, advocating for the expansion of culinary tourism into untapped markets, examining the interconnections between food tourism and several other tourist goods and attractions, and the use of food tourism as a means to facilitate sustainable development [44,45].
2.1.2. Analysis of Restaurant User-Generated Reviews
The prevalence of Internet technologies, social media platforms, and review mechanisms has led to user-generated reviews becoming a significant information source in the context of tourism consumption [46]. These reviews play a crucial role in influencing individuals’ decision-making processes when choosing between restaurants of similar types, with comparable pricing, and identical ratings on online platforms [47]. Moreover, the augmented quantity of favourable evaluations instils a greater sense of assurance in consumers about the restaurant’s service quality [47].
A recent research study has identified three primary factors contributing to the generation of user-generated reviews. Initially, it is evident that travellers exhibit concern for fellow customers, as they anticipate the dissemination of information on subpar products, so serving as a cautionary measure. Conversely, they also anticipate the promotion of restaurants that provide a good experience, thereby encouraging future patrons to make favourable choices. Furthermore, in accordance with established marketing principles, it is well recognised that a contented consumer is inclined to disseminate their positive experience to prospective customers. Furthermore, it has been observed that customers exhibit a genuine concern for the restaurant’s well-being and actively seek to enhance its reputation via the dissemination of favourable evaluations [48,49].
Research conducted in 2016 [50] put forth a hypothesis suggesting a favourable correlation between the quantity of online reviews and restaurant performance, specifically in relation to the number of patrons and financial outcomes. According to a recent research study [51,52], it has been shown that user-generated evaluations have a positive impact on the commercial value of restaurants. In relation to the hospitality industry, Tripadvisor is widely recognised as a prominent and reliable source of information. Consequently, numerous studies within the domain of restaurant-related research have focused on evaluating the dependability and efficacy of the information disseminated on Tripadvisor, with the aim of assisting prospective diners in making informed decisions regarding their choice of dining establishment [53].
Tripadvisor, Inc. is an online travel firm based in the United States that offers travel guides and user-generated reviews at no cost, as reported by Statista.com [54]. In the year 2021, the cumulative quantity of user reviews and opinions on Tripadvisor surpassed one billion, including evaluations of restaurants, hotels, vacation rentals, and attractions.
According to the research [53], Tripadvisor is deemed a dependable resource for both managers and consumers. However, the study also highlights the presence of fraudulent user-generated reviews on the platform, as well as the deliberate composition of positive comments aimed at enticing guests. In some cases, these restaurants may offer discounts as a form of reciprocation for such services.
In contrast, another research studies [47,55] have corroborated the reliability of reviews published on Tripadvisor, since these evaluations often serve as the primary information resource for those seeking guidance in making decisions about expenditures within the food and lodging sectors.
The use of restaurant user-generated ratings on a big scale is a topic that has received little attention in the tourist literature. Other authors [54,56,57,58,59,60,61,62] conducted studies to examine the relationship between restaurant performance and customer word-of-mouth (positive/negative) in order to develop a decision support model that aids visitors in their restaurant selection process. The studies just use restaurant ratings and other social data, neglecting the inclusion of review comments which provide crucial insights into visitors’ conduct and preferences. Nevertheless, there is a lack of study examining the food choice profile of visitors that may address the aforementioned inquiries. The existence of this study gap might perhaps be attributed to the difficulties associated with evaluating and processing unstructured user-generated evaluations, which are not amenable to established statistical methodologies [3]. This paper presents a comprehensive methodology for analysing user-generated reviews from a large-scale restaurant dataset, with a special focus on examining the cuisine preferences of tourists.
3. Methodology
3.1. Data Collection and Analysis
This study comprised the collection of data on restaurants in European Union cities. The data collection was carried out using the Octoparse 8 sustainable instrument, which extracted information from the Tripadvisor.com website. The method used for this data extraction is outlined in Figure 1.
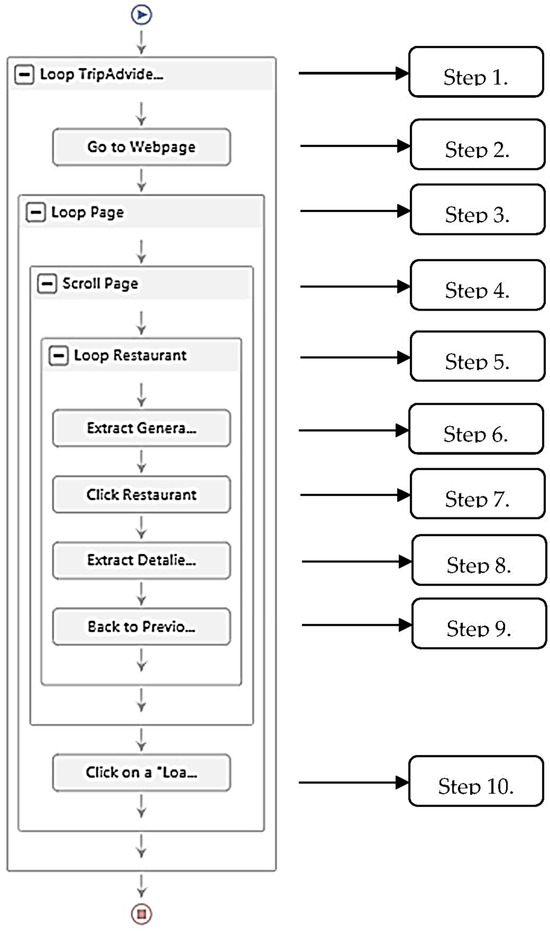
Figure 1.
Tripadviser automatic data collection algorithm with the Octoparse application (generated by the authors).
To enhance the comprehensiveness of the investigation, data pertaining to all restaurants on Tripadvisor.com that have received more than 100 reviews were gathered. The inclusion of 100 reviews was deemed significant for the study due to the presence of several locations with limited or non-existent evaluations, which has the potential to introduce bias into the acquired findings.
The mechanism of the algorithm is presented below in the Figure 2.
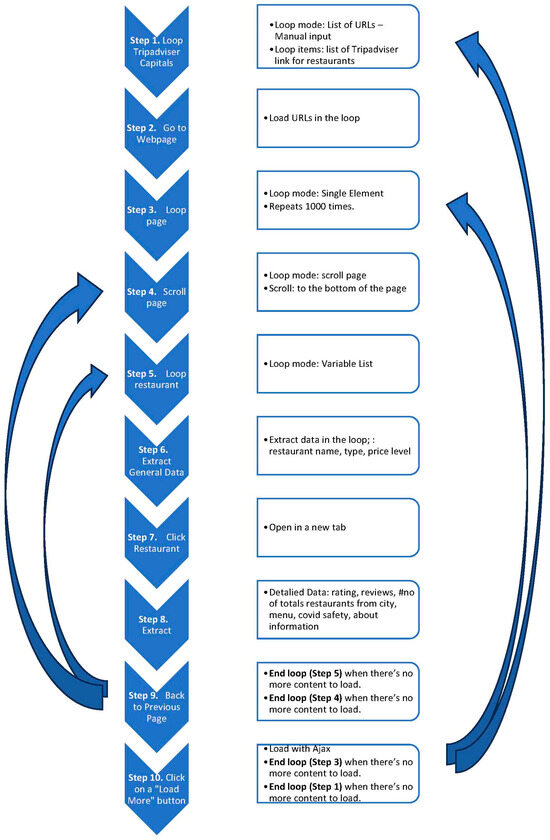
Figure 2.
The mechanism of the algorithm (authors’ own creation).
The process of automated data collecting was successfully conducted using Octoparse 8, a novel and environmentally friendly electronic tool, over the period of 10–20 December 2022. The data collection included many key variables, including the name of the restaurant, the total count of reviews received, the price level denoted on a scale of 1 to 3 (where 1 signifies affordability and 3 indicates a higher cost), the availability of a menu, the classification of the restaurant type, the implementation of COVID-19 safety measures, the rating assigned on a scale of 1 to 5 (with 1 indicating subpar quality and 5 denoting exceptional quality), and the range of alternatives offered by the establishment.
A comprehensive study was conducted on a total of 21,885 restaurants located in the capitals of the European Union.
In order to conduct a contextual analysis, we obtained data from Eurostat pertaining to the annual number of visitors, namely the number of nights spent at tourist accommodation establishments (NSTAE), as well as the population figures for the capitals of the European Union. Eurostat was used as the primary data source because of its status as an authoritative and constantly updated entity. For instance, the population figures for cities were recently updated in December 2022. Nevertheless, it should be noted that not all of the cities examined in the analysis had data for the year 2022. Consequently, we choose to use the most up-to-date data available. It is worth mentioning that Eurostat provides statistics for the period spanning from 2013 to 2022. The Eurostat data processing occurred on 27 December 2022.
Certain data fields, such as the kind of restaurant or the services supplied, may include many values. This is the reason that statistical analysis and word frequency assessment tools, such as Browserling, have been used [59].
Subsequently, the dataset underwent mistake rectification, underwent form processing, and was subjected to analysis as a data repository inside the Tableau Public 2022.4 platform. Also, several figures were made by the authors that represent the top ten capitals according to different criteria. The choice of this number is justified by the fact that ten is the optimal value of representativity for the sample analysed and because the rest of the values are non-representative.
3.2. Results Obtained
At the data collection stage, significant variations in the quantity of restaurants across the cities under analysis are observed (see Figure 3). Paris, Rome, Madrid, Ljubljana, and Nicosia are among the cities with varying numbers of restaurants. Paris has the highest number of restaurants, with a total of 4435 establishments. Following closely after is Rome, with 3907 restaurants, while Madrid offers a relatively lower count of 2154 restaurants. On the other hand, Ljubljana and Nicosia have the fewest number of restaurants, with just 99 and 51 establishments, respectively (see Table 1).
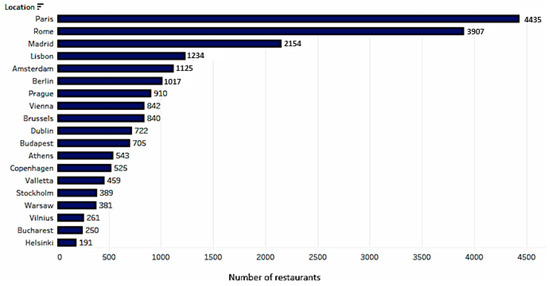
Figure 3.
Number of analysed restaurants for each EU capital (authors’ own calculation).

Table 1.
Number of analysed restaurants, nights spent at tourist accommodation establishments (NSTAE), and population of each EU capital.
According to worldwide data shown in Figure 4, it can be seen that the European restaurant type has the highest proportion at 45.7%. This is followed by the Mediterranean type at 24.52%, the Italian type at 21.41%, the pub type at 12.17%, and the pizza type at 10.55%.
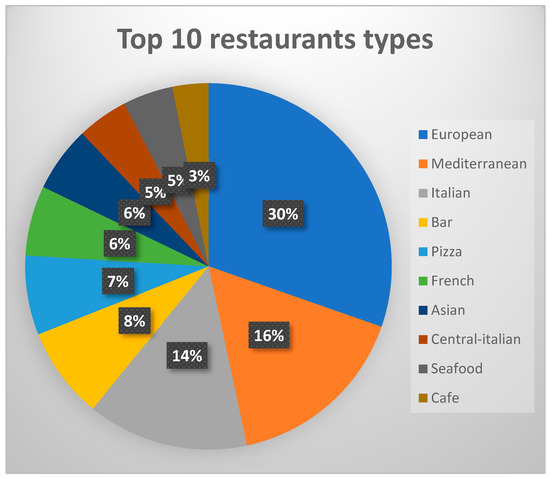
Figure 4.
Top 10 restaurant types by percentage of total (authors’ own calculation).
At the municipal level, there exists a general trend that is upheld, albeit with specific variations. For instance, in Amsterdam, the European style holds the highest prevalence at 48.18%, followed by Dutch at 25.51%, bar at 21.16%, Italian at 13.07%, and Asian at 12.8%. In Berlin, the European style predominates at 59.59%, followed by Mediterranean at 22.62%, German at 18.78%, Italian at 18.68%, and Central at 17.40%. In Madrid, the Mediterranean style takes precedence at 41.13%, followed by Spanish (39%).
The findings about the available alternatives at the restaurants under analysis are notably intriguing, as seen in Figure 5. The choice that garners the most level of popularity is the one that caters to vegetarian preferences, with 59.66%. This is closely followed by the availability of vegan alternatives, which accounts for 33.53% of the overall popularity. Additionally, there is a notable demand for gluten-free options, with a popularity rate of 27.63%. Additional significant choices include wheelchair accessibility, which accounts for 5.27% of the alternatives, complimentary internet, which constitutes 2.52% of the offerings, parking facilities, which make up 1.14% of the available amenities, live music, which comprises 0.54% of the options, and valet parking, which represents a mere 0.16% of the choices.
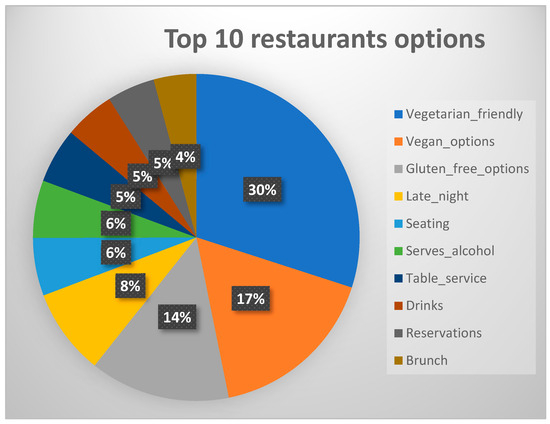
Figure 5.
Top 10 restaurant options by percentage of total (authors own calculation).
It is noteworthy that the available choices tend to be consistent across different cities. As an example, the choice of vegetarian-friendliness is presented as follows: Amsterdam has a vegetarian-friendliness rate of 63.38%, Berlin has a rate of 75.91%, Lisbon has a rate of 44.49%, Madrid has a rate of 41.13%, Paris has a rate of 53.26%, and Rome has a rate of 64.73%. The cities with the highest percentage of vegan alternatives among their dining selections are as follows: Amsterdam (37.42%), Berlin (43.95%), Lisbon (25.45%), Madrid (36.91%), Paris (22.53%), and Rome (35.78%). Gluten-free establishments emerge as a prominent choice in major urban centres, as seen by their prevalence in various cities. In Amsterdam, gluten-free options constitute 32.27% of the culinary landscape, while Berlin follows closely at 29.89%. Lisbon showcases a notable presence of gluten-free offerings at 25.85%, while Madrid boasts the highest proportion at 42.87%. Paris, on the other hand, exhibits a comparatively lower prevalence of gluten-free establishments at 7.85%. Rome aligns with Berlin, with gluten-free options accounting for 30.18% of its culinary scene.
In relation to the examination of the mean price for each capital city, it is evident that relatively minor disparities exist between cities characterised by lower prices, such as Rome (1.85), Lisbon (1.86), and Athens (1.87), as well as Berlin (1.90), and cities where prices are deemed higher, such as Luxembourg City (2.08), Bucharest (2.09), and Helsinki (2.10) (Figure 6).
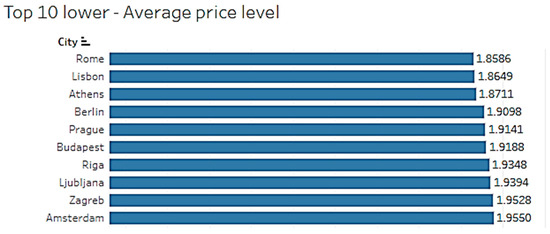
Figure 6.
Top 10 capitals by average price level (EUR) (authors’ own calculation).
As far as the policy of leaving reviews for restaurants is concerned (Figure 7), we observe quite large differences as follows: in Budapest we have the highest average (685.1) number of reviews per restaurant, followed by Rome (645), Prague (593), and finishing with Helsinki (309.1), Nicosia (301), and Luxembourg City (271.4).
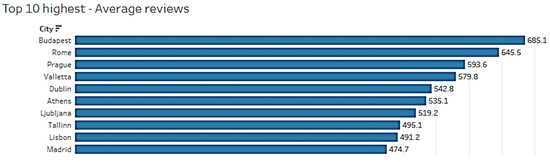
Figure 7.
Top 10 capitals by average number of reviews (authors own calculation).
In order to assess customer satisfaction, we computed the mean satisfaction scores for the eateries in each capital city. Valletta had the highest score of 4.24, with Warsaw closely following at 4.21. Conversely, Rome, Luxembourg City, and Brussels earned the lowest values of 3.94, 3.92, and 3.88, respectively (Figure 8).
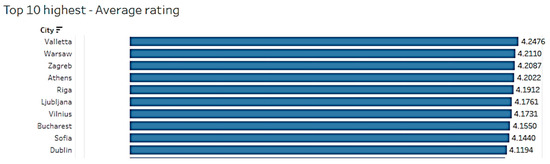
Figure 8.
Top 10 capitals by average rating of restaurant customer satisfaction (authors’ own calculation).
Subsequently, an examination was conducted to assess the correlation between the quantity of restaurants, NSTAE (number of standardised tourist accommodation establishments), and population inside each capital city under analysis (Figure 9).
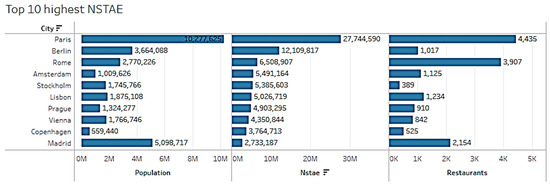
Figure 9.
Top 10 capitals by the number of restaurants, number of standardised tourist accommodation establishments (NSTAE), and population of each capital (authors own calculation).
In terms of the ratio of restaurants to population, it is seen that Valletta (0.001789) and Luxembourg City (0.001493) exhibit the largest proportions, while Bucharest (0.000117) and Sofia (0.000101) have the lowest ratios. In contrast, when examining the ratio between the number of restaurants and the combined population and NSTAE, it becomes evident that Rome has the highest position (0.000421), followed by Valletta (0.000283). The list concludes with Sofia (0.000063) and Stockholm (0.000055) (Table 2).
Table 2.
Number of restaurants as related to population, NSTAE and cumulated.
Related to these data, we observed that there are no Pearson correlations between these data, with values between −0.0147 and 0.0857 (Table 3).
Table 3.
Correlations between price, number of reviews, and rating.
The aforementioned relationships are inconsequential at the level of each capital. Table 4 reveals a notable finding, indicating a minimal association between price and rating for Vilnius (0.20) and Warsaw (0.13). A moderate connection is seen between the rating and review for Nicosia (r = 0.35), while a weak correlation is found for Dublin (r = 0.21). There exists a rather low association between price and review scores in the cities of Helsinki (0.18) and Stockholm (0.17).
Table 4.
Correlations between price, number of reviews, and rating.
Additional Pearson correlations were conducted (see Table 5) to examine the relationships between the number of restaurants, population size, and the number of NSTAE. As anticipated, there exists a significant positive link between tourism and population (r = 0.86), as well as between the number of restaurants and tourism (r = 0.77), and between the number of restaurants and population (r = 0.81). The correlation between the size of cities and their capability to accommodate visitors, as well as the number of restaurants available, may be elucidated. It is observed that bigger cities with higher population densities possess a stronger ability to welcome tourists and exhibit a higher prevalence of dining establishments.
Table 5.
Correlations between number of restaurants, population, and NSTAE.
4. Discussion
4.1. Theoretical Discussion
This study addresses the current knowledge gap in the academic literature by examining the preferences of culinary travellers. Prior studies have not placed significant emphasis on this particular problem, using the technique and equipment outlined in this study. Other scholarly investigations concentrate on the determinants that impact individuals’ choices between dining at one restaurant or another. These studies use conventional research techniques such as questionnaires and surveys, often administered to a limited sample size of visitors [7,8,9]. The current investigation serves as a first step since further research will be conducted on other user-generated review sites and various establishments within the hospitality industry.
The work demonstrates scientific novelty by using an innovative methodology for data collection and analysis in order to investigate the culinary preferences of visitors. The researchers used online restaurant evaluations sourced from Tripadvisor as a means to collect data pertaining to the culinary preferences of tourists. Subsequently, a framework was devised to undertake the processing and analysis of these evaluations, including the identification of essential themes and feelings articulated by visitors. The aforementioned strategy exhibits superior efficiency and scalability compared to prior methodologies, such as surveys and questionnaires.
The research goals have been achieved. Hence, visitors exhibit varying tastes when selecting restaurants, with a majority prioritising non-local cuisine above local fare. However, some globally renowned culinary traditions, such as French cuisine, garner considerable interest among tourists.
Moreover, it is worth noting that despite the tourists’ consideration of reviews in their restaurant selection process, they fail to establish a correlation between the pricing and the reviews [44,45].
Theoretical implications include the advancement of entrepreneurship theory. It may be inferred that when starting a restaurant venture in a European metropolis, the restaurant’s distinctiveness may not necessarily be rooted in local elements, but rather in the variety of vegetarian options offered.
From a scientific perspective, the research presents a fresh and original technique to hierarchizing restaurant kinds. The suggested methodology utilises user-generated reviews and current instruments, which represents a unique approach that has not been before used in the area of restaurant choosing.
One of the primary theoretical contributions of this work is in its extensive analysis of the many aspects that influence tourists’ evaluations. This study also identified issues that need more research attention from the viewpoints of researchers and marketing and tourism practitioners.
4.2. Managerial Implications
In terms of management consequences, it is recommended that restaurants devote attention to the particularities of their food offerings, including the incorporation of vegan-friendly alternatives.
The study has significant practical value as it might assist restaurant proprietors in enhancing their ability to meet the demands and preferences of travellers. The research revealed that visitors place significance on several criteria, including meal quality, pricing, environment, and diversity, while making decisions about restaurant selection. The insights derived from this study may be used by restaurant proprietors to implement modifications to their menus, pricing structures, and marketing tactics with the aim of enticing a larger number of visitors.
The results of the research are potentially valuable to scholars and professionals alike. The following are further considerations on the pragmatic significance of the research. This research has the potential to assist tourism boards and destination marketing organisations in devising more efficient marketing strategies aimed at attracting visitors with a specific interest in culinary tourism. This research may also facilitate the development of more focused marketing strategies by restaurants, enabling them to effectively target visitors who possess a particular interest in the unique culinary offerings they provide. The research might further assist restaurants in enhancing their customer service and eating experience, both of which play crucial roles in attracting and maintaining tourist clientele.
The findings of this study may be applied to any European urban centre that serves as a prominent tourist attraction. The results of this study may be used by restaurant owners in these cities to enhance the appeal of their establishments to visitors.
The study serves as a foundational resource for internet marketers and restaurant managers that want to enhance their ability to attract a larger number of visitors. The practical ramifications of this phenomenon include the need for internet marketing strategists to closely monitor and consider the prevailing patterns and dynamics associated with user-generated evaluations. Future study will be undertaken to further investigate the beneficial insights that may be derived from online user-generated evaluations.
The decision-making process of consumers in selecting a restaurant and subsequently influencing profitability is directly influenced by user-generated reviews. The authorities responsible for governing capitals should prioritise their attention towards the emerging trend of food tourism. Additionally, in the case of cities renowned for their cuisine, efforts should be made to actively promote them as desirable destinations for experiencing culinary delights.
Additionally, the findings of the study indicate that the inclusion of an additional alternative, such as vegan cuisine, provides restaurants with a supplementary competitive edge. Over time, this advantage becomes imperative, as failure to provide such an option may result in a loss of consumers. Therefore, it is advisable to include additional alternatives that are now popular among visitors, such as vegetarian-friendly and vegan options, as well as gluten-free choices. Furthermore, it would be beneficial to include new possibilities, such as other payment methods, free parking spots, and a disability ramp.
5. Conclusions
The study’s findings indicate that tourists originating from various countries exhibit distinct food preferences. Additionally, tourists demonstrate a keen interest in sampling local cuisine, while also attaching significance to other factors. Furthermore, tourists are inclined to provide positive feedback for restaurants that provide a diverse range of food choices, deliver satisfactory service, and offer an enjoyable dining atmosphere. The aforementioned discoveries possess novelty in the scientific realm as they contribute to a more extensive comprehension of visitor food preferences compared to prior scholarly investigations.
Our research is deemed to be very robust as it encompasses an extensive sample size of 21,885 restaurants, which were evaluated based on a substantial dataset of 10,549,363 reviews. The whole process of data collecting and analysis was conducted using an advanced electronic instrument, ensuring a sustainable and novel approach that eliminates the potential for human error.
The presence of substantial populations including both residents and visitors serves as a significant catalyst for the proliferation of many dining establishments. This phenomenon is characterised by strong positive associations between the quantity of restaurants, the size of the population, and the nights spent at tourist accommodation establishments (NSTAE).
It is not possible to establish a link between the price level and rating of a restaurant, indicating that price does not serve as a determining element in the assigned rating.
At a comprehensive level including all the units under analysis, it is evident that the most sought-after alternatives are as follows: vegetarian-friendly choices, which account for 59.66% of the total; subsequently, vegan options, which constitute 33.53% of the whole; and lastly, gluten-free options, which make up 27.63% of the total. In terms of restaurant categorizations, the prevailing categories are as follows: European establishments constitute the largest proportion at 45.7%, followed by Mediterranean restaurants at 24.52%, Italian restaurants at 21.41%, bar establishments at 12.17%, and pizza establishments at 10.55%. Naturally, the composition of the top five restaurant categories varies among countries, with a notable presence of establishments that showcase national culinary characteristics.
Rome presents an intriguing scenario characterised by a substantial concentration of restaurants accompanied by a multitude of evaluations. These establishments are notable for their affordability; however, they consistently occupy a lower position in the rankings in terms of customer ratings. Valletta, on the other hand, has the highest average rating among the locations under consideration, but accompanied by a slightly elevated average price level that positions it within the upper tertile of the ranking.
6. Future Research Directions and Limitations
Despite the appealing findings of our investigation, we faced other constraints.
The use of Tripadvisor may vary in different regions within the European Union. In addition to Tripadvisor, there exist several more programmes designed for the purpose of rating companies, events, hotels, and dining locations.
The interpretation of the price level may vary based on the nation and its corresponding quality of life.
Several possible limitations may arise in the execution of the findings from this research. The research was limited to European cities; hence caution should be used when attempting to generalise the findings to other regions. Furthermore, the research used internet restaurant evaluations as its primary data source, so potentially limiting the generalizability of the findings to the whole population of visitors.
Author Contributions
Conceptualization, F.R.L.-T., D.A.L.-T. and R.C.L.; methodology, R.C.L.; formal analysis, R.C.L.; investigation, R.C.L.; resources, F.R.L.-T. and D.A.L.-T.; data curation, D.A.L.-T.; writing—original draft preparation, F.R.L.-T. and D.A.L.-T. All authors have read and agreed to the published version of the manuscript.
Funding
The research was financed by Transylvania University of Brasov, Romania.
Institutional Review Board Statement
Not applicable.
Informed Consent Statement
Not applicable.
Data Availability Statement
Not applicable.
Conflicts of Interest
The authors declare no conflict of interest.
References
- Kim, Y.G.; Eves, A.; Scarles, C. Building a model of local food consumption on trips and holidays: A grounded theory approach. Int. J. Hosp. Manag. 2009, 28, 423–431. [Google Scholar] [CrossRef]
- Min, K.H.; Lee, T.J. Customer Satisfaction with Korean Restaurants in Australia and Their Role as Ambassadors for Tourism Marketing. J. Travel Tour. Mark. 2014, 31, 493–506. [Google Scholar] [CrossRef]
- Huy Quan, V.; Gang, L.; Law, R.; Zhang, Y. Exploring Tourist Dining Preferences Based on Restaurant Reviews. J. Travel Res. 2019, 58, 149–167. [Google Scholar]
- Lee, A.; Lambert, C.U.; Law, R. Customer Preferences for Social Value over Economic Value in Restaurants. Asia Pacific. J. Tour. Res. 2016, 17, 473–488. [Google Scholar]
- Pizam, A.; Jeong, G.H.; Reichel, A.; Boemmel, H.V.; Lusson, J.M.; Steynberg, L.; State-Costache, O.; Volo, S.; Kroesbacher, C.; Kucerova, J.; et al. The Relationship between Risk-Taking, Sensation Seeking, and the Tourist Behavior of Young Adults: A Cross-Cultural Study. J. Travel Res. 2004, 42, 251–260. [Google Scholar] [CrossRef]
- Correia, A.; Moital, A.; Costa, C.F.D.; Peres, R. The Determinants of Gastronomic Tourists’ Satisfaction: A Second-Order Factor Analysis. J. Food Serv. 2008, 19, 164–176. [Google Scholar] [CrossRef]
- Verbeke, W.; López, G.P. Ethnic Food Attitudes and Behaviour among Belgians and Hispanics Living in Belgium. Br. Food J. 2005, 107, 823–840. [Google Scholar] [CrossRef]
- Bruwer, J.; Lesschaeve, I.; Campbell, B.L. Consumption Dynamics and Demographics of Canadian Wine Consumers: Retailing Insights from the Tasting Room Channel. J. Retail. Consum. Serv. 2012, 19, 45–58. [Google Scholar] [CrossRef]
- Updhyay, Y. Culinary Preferences of Foreign Tourists in India. J. Vacat. Mark. 2014, 20, 29–39. [Google Scholar] [CrossRef]
- Joo, N.; Park, S.; Lee, B.; Yoon, J. Importance-Satisfaction Analysis of Street Food Sanitation and Choice Factor in Korea and Taiwan. Nutr. Res. 2015, 9, 296–303. [Google Scholar] [CrossRef]
- Kivela, J.; Crotts, J.C. Tourism and Gastronomy: Gastronomy’s Influence on How Tourists Experience a Destination. J. Hosp. Tour. Res. 2006, 30, 354–377. [Google Scholar] [CrossRef]
- Torres, R. Toward a Better Understanding of Tourism and Agriculture Linkages in the Yucatan: Tourist Food Consumption and Preferences. Tour. Geogr. 2002, 4, 282–306. [Google Scholar] [CrossRef]
- Chang, R.C.Y.; Mak, A.H.N. Food Preferences of Chinese Tourists. Ann. Tour. Res. 2010, 37, 989–1011. [Google Scholar] [CrossRef]
- Chaves, M.S.; Gomes, R.; Pedron, C. Analysing Reviews in the Web 2.0: Small and Medium Hotels in Portugal. Tour. Manag. 2012, 33, 1286–1287. [Google Scholar] [CrossRef]
- Crotts, J.C.; Peyton, P.R.; Davis, B. Measuring Guests Satisfaction and Competitive Position in the Hospitality and Tourism Industry. J. Travel Res. 2009, 48, 139–151. [Google Scholar] [CrossRef]
- Li, G.; Law, R.; Vu, H.Q.; Rong, J. Discovering the Hotel Selection Preferences of Hong Kong Inbound Travelers Using the Choquet Integral. Tour. Manag. 2013, 36, 321–330. [Google Scholar] [CrossRef]
- Li, G.; Law, R.; Vu, H.Q.; Rong, J.; Zhao, X. Identifying Emerging Hotel Preferences Using Emerging Pattern Mining Technique. Tour. Manag. 2015, 46, 311–321. [Google Scholar] [CrossRef]
- Kim, Y.; Eves, A. Construction and Validation of a Scale to Measure Tourist Motivation to Consume Local Food. Tourism Management. 2012, 33, 1458–1467. [Google Scholar] [CrossRef]
- Mason, M.C.; Paggiaro, A. Investigating the role of festivalscape in culinary tourism: The case of food and wine events. Tour. Manag. 2012, 33, 1329–1336. [Google Scholar] [CrossRef]
- Di-Clemente, E.; Hernández-Mogollón, J.M.; López-Guzmán, T. Culinary Tourism as An Effective Strategy for a Profitable Cooperation between Agriculture and Tourism. Soc. Sci. 2020, 9, 25. [Google Scholar] [CrossRef]
- Nistor, E.-L.; Dezsi, Ș. An Insight into Gastronomic Tourism through the Literature Published between 2012 and 2022. Sustainability 2022, 14, 16954. [Google Scholar] [CrossRef]
- Niedbała, G.; Jęczmyk, A.; Steppa, R.; Uglis, J. Linking of Traditional Food and Tourism. The Best Pork of Wielkopolska—Culinary Tourist Trail: A Case Study. Sustainability 2020, 12, 5344. [Google Scholar] [CrossRef]
- du Rand, G.E.; Heath, E.; Alberts, N. The role of local and regional food in destination marketing: A South African situation analysis. J. Travel Tour. Mark. 2003, 14, 97–112. [Google Scholar] [CrossRef]
- Lan, L.W.; Wu, W.W.; Lee, Y.T. Promoting food tourism with Kansei cuisine design. Procedia-Soc. Behav. Sci. 2012, 40, 609–615. [Google Scholar] [CrossRef][Green Version]
- Okumus, B.; Okumus, F.; McKercher, B. Incorporating local and international cuisines in the marketing of tourism destinations: The cases of Hong Kong and Turkey. Tour. Manag. 2007, 28, 253–261. [Google Scholar] [CrossRef]
- Okumus, F.; Köseoglu, M.A.; Putra, E.D.; Dogan, I.C.; Yildiz, M. A Bibliometric Analysis of Lodging-Context Research from 1990 to 2016. J. Hosp. Tour. Res. 2019, 43, 210–225. [Google Scholar] [CrossRef]
- Pizam, A.; Sussmann, S. Does Nationality Affect Tourist Behavior? Ann. Tour. Res. 1995, 22, 901–917. [Google Scholar] [CrossRef]
- Cohen, E.; Avieli, N. Food in Tourism: Attraction and Impediment. Ann. Tour. Res. 2014, 31, 755–778. [Google Scholar] [CrossRef]
- Eric, F.; Ramos, A.; Amuquandoh, F.E. Traditional Food Preferences of Tourists in Ghana. Br. Food J. 2014, 115, 987–1002. [Google Scholar] [CrossRef]
- Choi, J.; Zhao, J. Factors Influencing Restaurant Selection in South Florida: Is Health Issue One of the Factors Influencing Consumers’ Behavior when Selecting a Restaurant? J. Foodserv. Bus. Res. 2010, 13, 237–251. [Google Scholar] [CrossRef]
- Abdelhamied, H.H.S. Customers’ Perceptions of Floating Restaurants in Egypt. Anatolia Int. J. Tour. Hosp. Res. 2011, 22, 1–15. [Google Scholar] [CrossRef]
- Liu, C.H.S.; Su, C.S.; Gan, B.; Chou, S.F. Effective Restaurant Rating Scale Development and a Mystery Shopper Evaluation Approach. Int. J. Hosp. Manag. 2014, 43, 53–64. [Google Scholar] [CrossRef]
- Bessiere, J. Local development and heritage: Traditional food and cuisine as tourist attractions in rural areas. Sociol. Rural. 1998, 38, 21–34. [Google Scholar] [CrossRef]
- Ellis, A.; Park, E.; Kim, S.; Yeoman, I. What is food tourism? Tour. Manag. 2018, 68, 250–263. [Google Scholar] [CrossRef]
- Sanchez, S.; Castillo-Canalejo, A. A comparative study of tourist attitudes towards culinary tourism in Spain and Slovenia. Br. Food J. 2015, 117, 2387–2411. [Google Scholar] [CrossRef]
- Bekir, B.D.; Shi, F.; Okumus, B. Communication sources, local food consumption, and destination visit intention of travellers. Curr. Issues Tour. 2022, 26, 1763–1778. [Google Scholar]
- Mariani, M.; Okumus, B. Features, drivers, and outcomes of food tourism. Br. Food J. 2022, 124, 401–405. [Google Scholar] [CrossRef]
- Buhalis, D. Marketing the competitive destination of the future. Tour. Manag. 2000, 21, 97–116. [Google Scholar] [CrossRef]
- Echtner, C.M.; Prasad, P. The context of third world tourism marketing. Ann. Tour. Res. 2003, 30, 660–682. [Google Scholar] [CrossRef]
- Faulkner, B. A model for the evaluation of national tourism destination marketing programs. J. Travel Res. 1997, 35, 23–32. [Google Scholar] [CrossRef]
- Gretzel, U.; Yuan, Y.; Fesenmaier, D. Preparing for the new economy: Advertising strategies and change in destination marketing organizations. J. Travel Res. 2000, 39, 146–156. [Google Scholar] [CrossRef]
- Hudson, S.; Miller, G. The responsible marketing of tourism: The case of Canadian mountain holidays. Tour. Manag. 2005, 26, 133–142. [Google Scholar] [CrossRef]
- Rousta, A.; Jamshidi, D. Food tourism value: Investigating the factors that influence tourists to revisit. J. Tour. Manag. 2020, 81, 104140. [Google Scholar] [CrossRef]
- Barzallo-Neira, C.; Pulido-Fernández, J.I. Identification of the Main Lines of Research in Gastronomic Tourism: A Review of the Literature. Sustainability 2023, 15, 5971. [Google Scholar] [CrossRef]
- Angelakis, G.; Vecchio, Y.; Lemonakis, C.; Atsalakis, G.; Zopounidis, C.; Mattas, K. Exploring the Behavioral Intentions of Food Tourists Who Visit Crete. Sustainability 2023, 15, 8961. [Google Scholar] [CrossRef]
- Yim, E.S.; Lee, S.; Kim, W.G. Determinants of a restaurant average meal price: An application of the hedonic pricing model. Int. J. Hosp. Manag. 2014, 39, 11–20. [Google Scholar] [CrossRef]
- Anderson, C. The impact of social media on lodging performance. Cent. Hosp. Res. 2012, 5, 7–11. [Google Scholar]
- Jeonga, E.; Jang, S.S. Restaurant experiences triggering positive electronic word-of-mouth (eWOM) motivations. Int. J. Hosp. Manag. 2011, 30, 356–366. [Google Scholar] [CrossRef]
- Jang, S.; Eves, A. Tourism and Tourism at Home: A Qualitative Study of Relationships between Tourism and Ethnic Restaurants. J. Tour. Hosp. Manag. 2019, 7, 169–185. [Google Scholar] [CrossRef]
- Kim, Y.S.; Bergman, C.; Raab, C. Factors That Impact Mature Customer Dining Choices in Las Vegas. J. Foodserv. Bus. Res. 2016, 13, 178–192. [Google Scholar] [CrossRef]
- Abdullah, S.; Van Cauwenberge, P.; Vander Bauwhede, H.; O’Connor, P. User-generated reviews and the financial performance of restaurant. Int. J. Contemp. Hosp. Manag. 2022, 34, 3697–3714. [Google Scholar] [CrossRef]
- Tepavčević, J.B.; Bradić, M. Qualitative analysis of guest reviews of Italian restaurants on TripAdvisor. Marketing 2018, 49, 83–92. [Google Scholar] [CrossRef]
- Chua, A.Y.; Banerje, S. Reliability of reviews on the Internet: The case of TripAdvisor. In Proceedings of the World Congress on Engineering & Computer Science, San Francisco, CA, USA, 23–25 October 2013. [Google Scholar]
- Statista. Available online: https://www.statista.com/topics/3443/tripadvisor/ (accessed on 15 December 2022).
- Twill, A.; Bidan, M.; Safaa, L. Exploring destination’s negative e-reputation using aspect based sentiment analysis approach: Case of Marrakech destination on Tripadvisor. Tour. Manag. Perspect. 2021, 40, 100892. [Google Scholar]
- Zhang, Z.; Zhang, Z.; Law, R. Positive and Negative Word of Mouth about Restaurants: Exploring the Asymmetric Impact of the Performance of Attributes. Asia Pac. J. Tour. Res. 2014, 19, 162–180. [Google Scholar] [CrossRef]
- Zhang, H.-Y.; Ji, P.; Wang, J.-Q.; Cheng, X.H. A Novel Decision Support Model for Satisfactory Restaurants Utilizing Social Information: A Case Study of TripAdvisor.com. Tour. Manag. 2017, 59, 281–297. [Google Scholar] [CrossRef]
- Eurostat. Available online: https://ec.europa.eu/eurostat (accessed on 15 December 2022).
- Browseling. Available online: http://www.browserling.com/tools/word-frequency (accessed on 15 December 2022).
- Rhee, H.T.; Yang, S.B.; Kim, K. Exploring the Comparative Salience of Restaurant Attributes: A Conjoint Analysis Approach. Int. J. Inf. Manag. 2016, 36, 1360–1370. [Google Scholar] [CrossRef]
- Kim, S.; Park, E.; Lamb, D. Extraordinary or ordinary? Food tourism motivations of Japanese domestic noodle tourists. Tour. Manag. Perspect. 2019, 29, 176–186. [Google Scholar] [CrossRef]
- Kim, W.G.; Li, J.J.; Brymer, R.A. The impact of social media reviews on restaurant performance: The moderating role of excellence certificate. Int. J. Hosp. Manag. 2016, 55, 41–51. [Google Scholar] [CrossRef]


Disclaimer/Publisher’s Note: The statements, opinions and data contained in all publications are solely those of the individual author(s) and contributor(s) and not of MDPI and/or the editor(s). MDPI and/or the editor(s) disclaim responsibility for any injury to people or property resulting from any ideas, methods, instructions or products referred to in the content. |
© 2023 by the authors. Licensee MDPI, Basel, Switzerland. This article is an open access article distributed under the terms and conditions of the Creative Commons Attribution (CC BY) license (https://creativecommons.org/licenses/by/4.0/).