Abstract
Over the past several decades, urbanisation has spread rapidly over the globe. Research on the viability of urban stormwater drainage systems and the search for solutions to the related problems constitute an important prerequisite for their sustainability evaluation. The Government of India’s sub-committee for the development of “National sustainable habitat parameters on urban stormwater management” has proposed twenty key indices to promote and monitor the sustainable urban stormwater management paradigm. Their evaluation may be taken up at various stages of development, including planning/design, execution, post-operation audits, impact assessment, etc. Eleven of these sustainability indices, including the “Natural drainage system index (NDSI), the Drainage coverage (constructed) index (DCI), the Permeability Index (PI), Water bodies rejuvenation index (WBRI), Water body vulnerability index (WBVI), Water logging index (WLI), Area vulnerability index (AWI), Stormwater discharge quality index (SWDQI), and Rainfall intensity index (RII)” were evaluated for three Tier I cities (Delhi, Mumbai, and Chennai) and three Tier II cities (Varanasi, Chandigarh, and Roorkee) in India based on the available data for 2010 as the datum year and 2020 as the test year. All the considered cities serve as economically and institutionally important urban centres, fall in different climatic zones, and are distributed in two major categories based on the scale of development and population density. All the indices enumerated individually fell within the range of 0 to 1, the two extremities of the sustainability range. Further, ranking of various indices was done employing the Analytical Hierarchy Process, and after deriving the weights for each, aggregation of all these indices was performed to yield an “Overall sustainability index” for each city. Different values were demonstrated along the sustainability scale for all the cities based on performance with regard to various constituent indices in a standalone mode and their interplay in an aggregated mode. The findings are expected to provide important insights to meet the goal of the developing sustainable urban drainage systems (SuDSs).
1. Introduction
The rate of urbanisation throughout the globe has accelerated recently. The rapid drainage of stormwater from populated areas is one of the many difficult issues that have arisen because of expanding urbanisation. According to [1,2], urbanisation has significant negative impacts on water resources, including an increase in flood peaks and volumes, a drop in the base flow, hydraulic stress and morphological damage, and water pollution. Unfortunately, in urban centres, managing water has turned into a conflict between the water supply and the cities’ infrastructure [3,4]. It is imperative to view an urban drainage system within the perspective of sustainable surface water management in today’s world, where water is becoming a scarce resource, in order to combat diffuse pollution and also increase resource availability.
By 2050, 66% of the world’s population, with a sizable concentration in coastal cities, is expected to live in urban regions, up from the current rate of about 54%. According to a revision of the “World Urbanisation Prospects 2014” report by the population division of the United Nations Department of Economic and Social Affairs (UNDESA), there will be substantial urban expansion, especially in India, China, and Nigeria [5,6]. Due to the interaction between human activities and the natural water cycle, drainage systems are very important in urban settings. There are two primary types of this interaction. The first is the extraction of water for different uses, such as water supply, and the second is the diversion of rainfall via the neighbourhood’s natural drainage system, which prevents groundwater recharging [7]. Under the influence of a changing climate, these urban systems, which are essential to contemporary civilizations, experience disruptions and have a significant effect on urban dwellers’ everyday life [8].
In land areas, there have been more heavy precipitation occurrences, according to the IPCC Assessment Report 5 of the Intergovernmental Panel on Climate Change (IPCC). Precipitation trends and extremes vary significantly between regions and seasons in the Asian area [9]. Cities situated in climate-sensitive regions, such as flood plains and coastal zones, are disproportionately impacted by these climatic changes. Among the most important consequences of climate change on cities are water availability, flooding (from heavy precipitation, including pluvial, fluvial, and coastal floods), increased surface and stream erosion, and overloading of stormwater treatment facilities during high flow events. When components of urban stormwater networks are overloaded, surface runoff accumulates, creating risks like floods.
According to research, drainage systems respond differently to expected climatic changes depending on the location [10,11,12,13,14]. To improve the current infrastructure and create new stormwater systems, local decision makers must consider the consequences of these circumstances for managing stormwater and floodplains on a site-specific basis [15,16,17]. Urban stormwater management and flood mitigation are receiving more attention in sensitive areas, especially in emerging nations like India. Recent climate impact assessment studies [18,19,20,21] offer useful insights into incorporating climate change information into local planning and decision-making processes, promoting an integrated approach to sustainable urban water management.
To stop the development of waterborne infections in big cities, an effective drainage and sewage infrastructure is essential. According to the 2011 census, 33% of dwellings used open drainage systems, whereas 48.9% of households nationwide lacked drainage infrastructure [22]. According to the National Family Health Survey-5 (2019–2021), 74.2% of urban households now have “improved sanitation”, which includes flush or pour toilet latrines linked to piped sewer or septic systems. However, 7.2% of families still depend on public latrines, and another 10.8% practice open defecation, since 14.60% of homes still do not have latrines on site. Additionally, slum regions are home to more than 28% of the urban population [23].
If stormwater is not effectively drained, it can result in flooding, resulting in damage and health issues [24]. To ensure a safe disposal of stormwater, it is essential to have sufficient drainage capacity. Hence, various hydrologic models can be employed to evaluate the capacity of drainage systems [16].
Extreme hydrological events in recent decades have shown that urban areas are more prone to catastrophic effects. Urban flooding has been on the rise in India over the last several years, severely impacting its large cities. The most prominent of these floods were in “Delhi in 2002 and 2003, Chennai in 2004, Mumbai in 2005, Surat in 2006, Kolkata in 2007, Jamshedpur in 2008, Delhi in 2009, and Guwahati and Delhi in 2010” [25]. Evaluating the sustainability of a stormwater drainage system entails utilizing sustainability indices to gauge the environmental, economic, and social dimensions of water management and treatment projects, as well as creating comprehensive frameworks, which account for decision uncertainty, the context of the decision, and multi-scale, multi-purpose appraisal methodologies [26].
Based on the tenet “What gets measured gets managed”, the Government of India’s subcommittee for developing “National Sustainable Habitat Parameters on Urban Stormwater Management” has developed a method to audit and verify the implementation of sustainable stormwater management. In this method, important parameters are proposed, mostly in the form of simple ratio-based indices (Table 1), which serve the objective of a systematic and scientific evaluation of the current as well as the past conditions, the progress attained, development-related flaws, and the challenges in the attainment of the envisaged goal. Two sets of values are prescribed, the first for the ideal scenario and the second for the least-desired scenario, in order of importance [27,28]. Interestingly, various stages of the development process, including planning/design, execution, post-operation audits, and impact assessment, may take these values into consideration. It is further postulated that, whereas enumeration of these indices in an individual standalone mode may provide a perspective of the system performance according to separate parameters, a composite aggregation of these indices may also be attempted to provide holistic insight into the overall process. In line with this view, the present study attempted to employ these indices in both the standalone and aggregated modes, for the first time to the knowledge of the authors, for six Indian cities.

Table 1.
List of various stormwater management indices [27,28].
2. Materials and Methods
2.1. Description of Cities
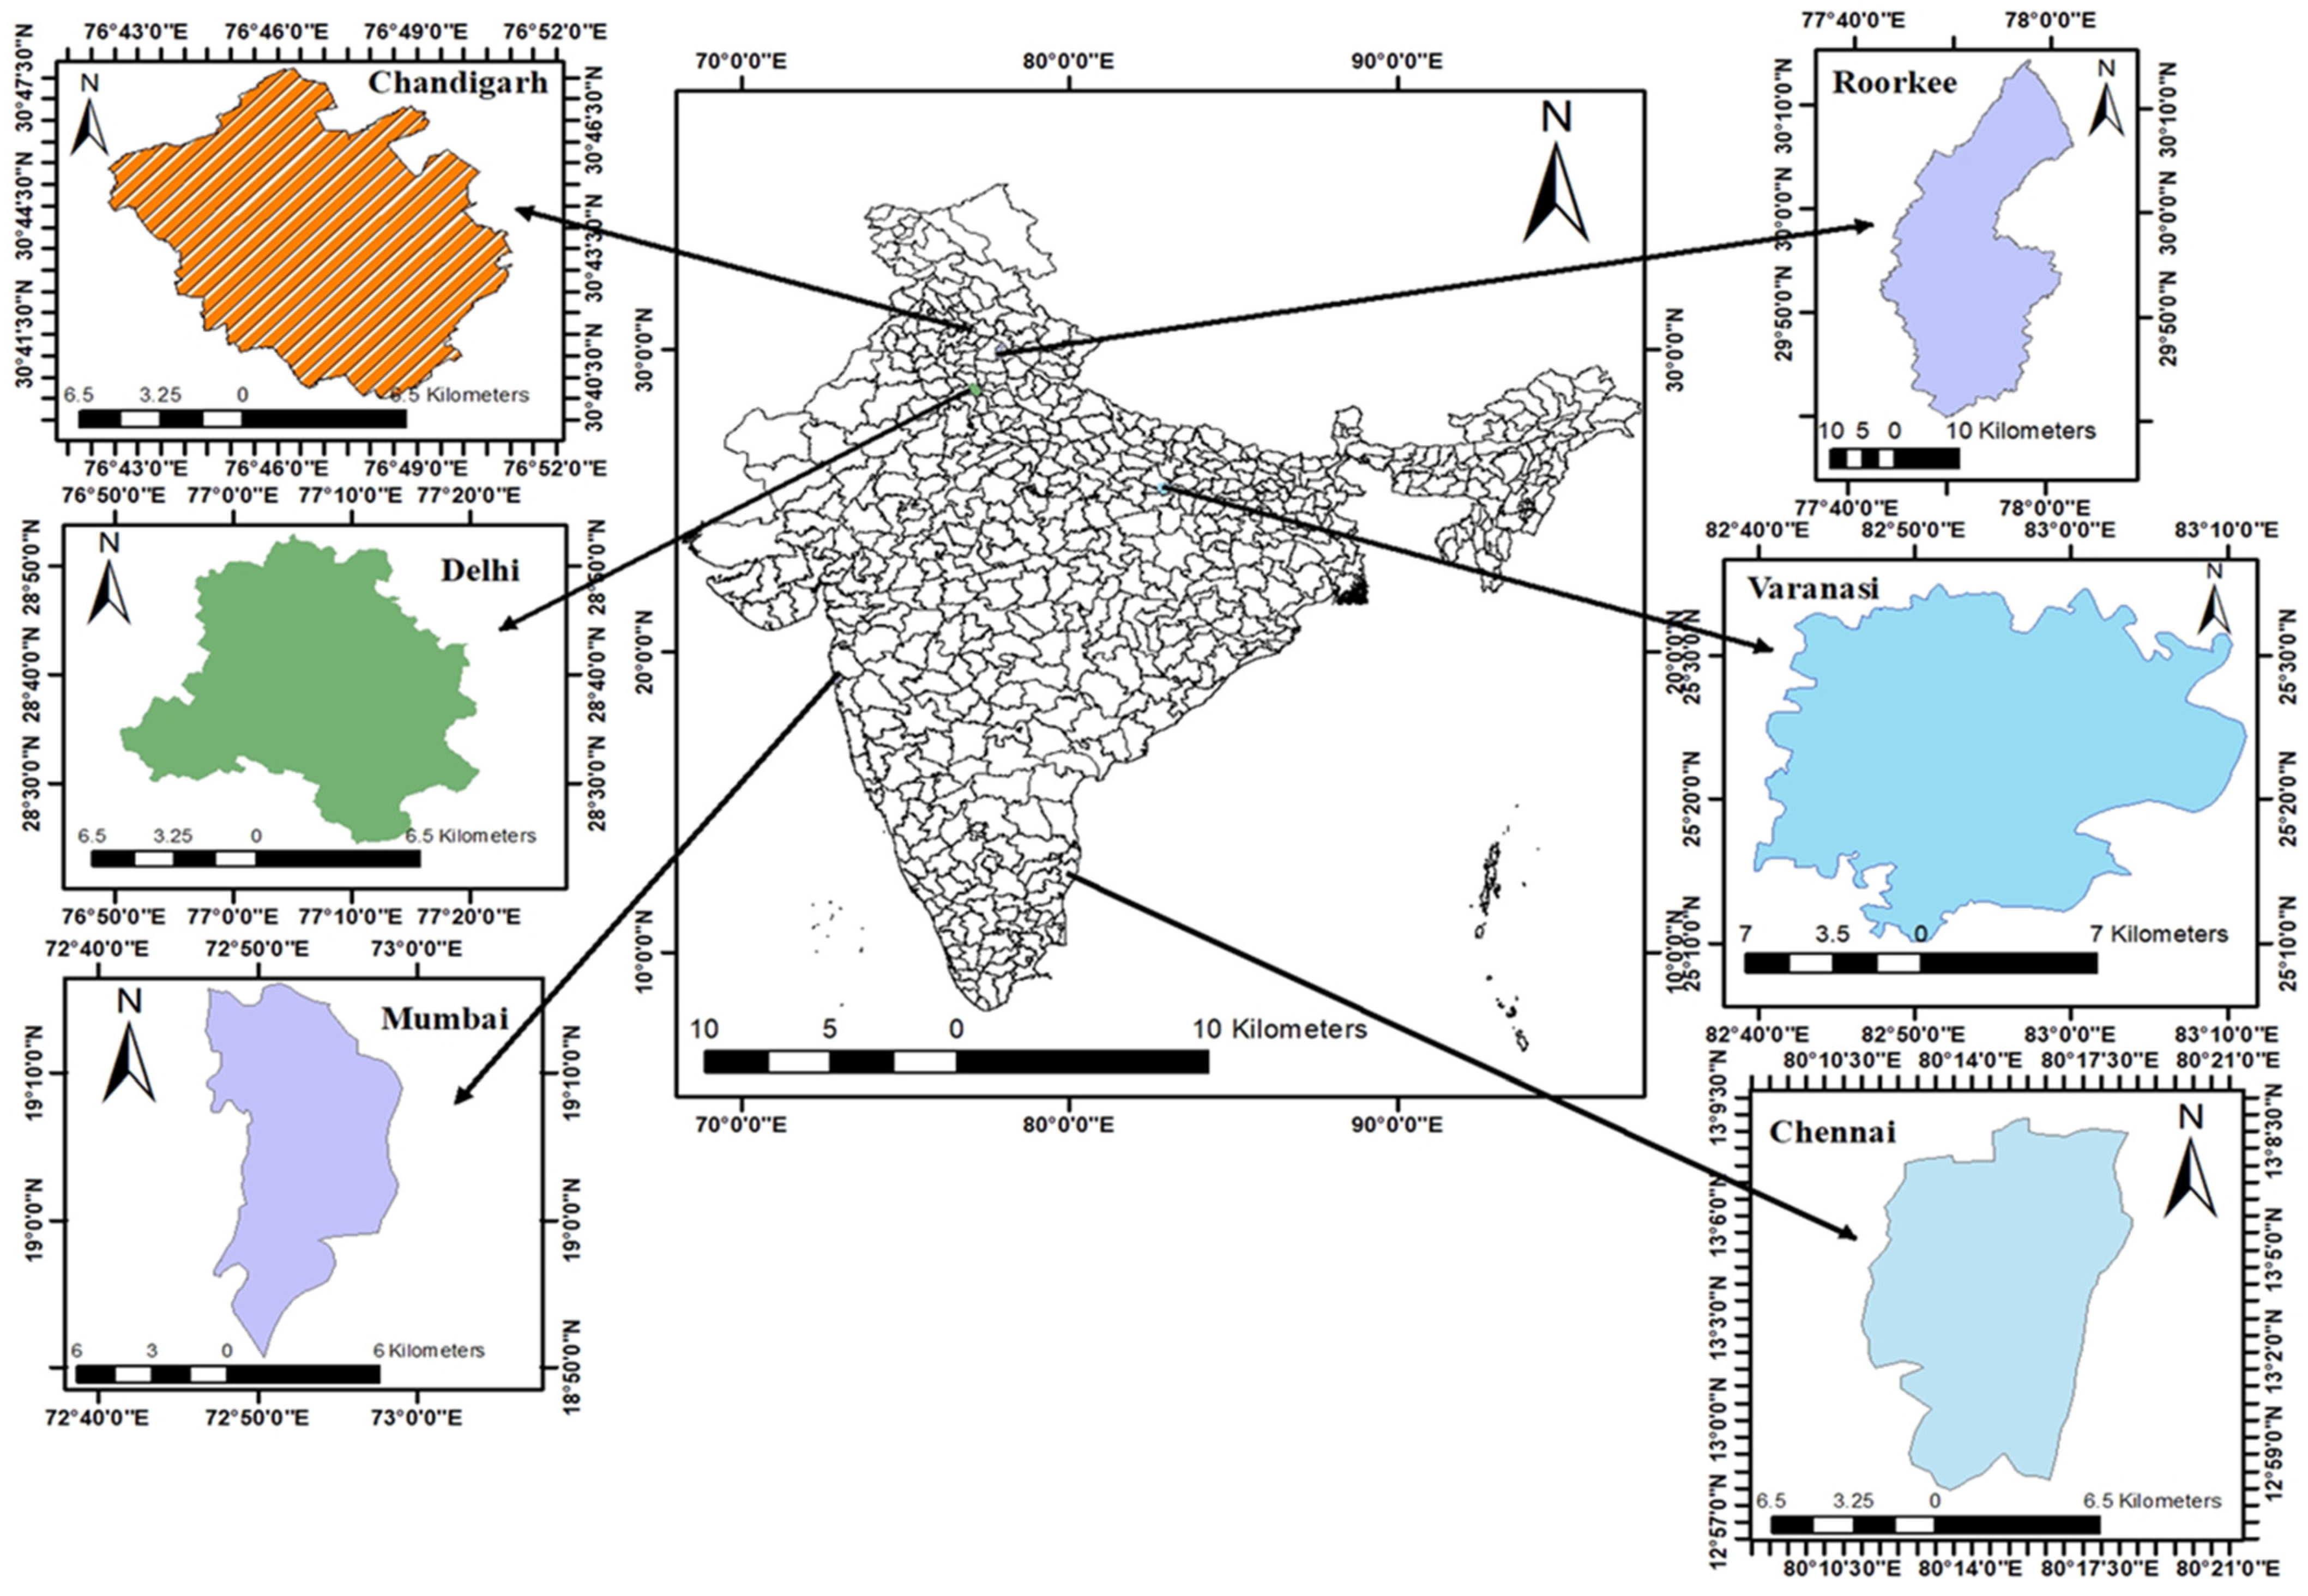
Three Tier I cities (Delhi, Mumbai, Chennai) and three Tier II cities (Chandigarh, Varanasi, Roorkee) were considered. All the considered cities are economically and institutionally important urban centres, fall in different climatic zones, and are distributed in two major categories based on scale of development and population density. Salient features of all the cities are provided in the following paragraphs; Figure 1 represents them graphically.
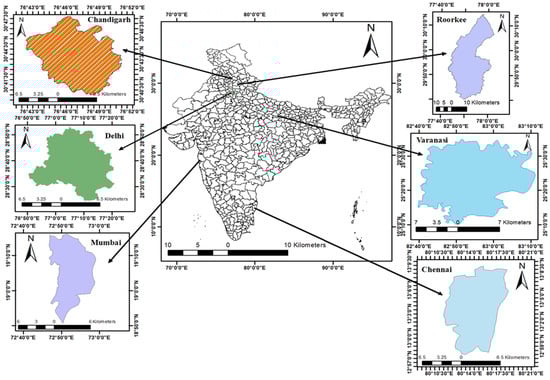
Figure 1.
Map of study areas (cities).
Delhi: Located in the northern part of India, Delhi lies between the latitudes 28°24′17″ N–28°53′00″ N and longitudes 76°50′24″ E–77°20′37″ E, with an average elevation of 233 m above the mean sea level (MSL) and a range between 213 and 305 m. The climate in Delhi is characterized by extreme temperatures, with hot summers ranging from 32 °C to 45 °C, and cold winters ranging from 3.5 °C to 22.2 °C. The humidity is high during monsoons and low in summers, and the city receives an average annual precipitation of 797.3 mm [29]. Between 2001 and 2011, Delhi witnessed a significant 20.44 percent growth in its urban area, accompanied by a surge in the number of urbanized villages and census towns. According to the 2011 Census, an overwhelming 97.50 percent of Delhi’s population lived in urban regions, outpacing the national population growth rate by 3.5 percent. Looking ahead, Delhi is expected to experience further population growth, increasing from 16.78 million to 26.59 million, resulting in a higher population density of 17,930 persons per square kilometre from 2021 to 2036.
To facilitate the current study, the National Capital Territory (NCT) of Delhi was partitioned into three primary natural drainage basins. These basins include the Trans Yamuna basin with 34 drains, the Barapullah basin with 44 drains, and the Najafgarh basin with 123 drains. Among these basins, the Najafgarh basin is the largest, covering nearly two-thirds of the area of the NCT of Delhi. Much of the stormwater generated in Delhi is ultimately discharged into the Yamuna River through various outfall points located along its course through the city [30]. Delhi has seen ten significant floods since 1900, nine of which occurred when the Yamuna River rose beyond its danger threshold of 204.83 m, in the years 1924, 1947, 1976, 1978, 1988, 1995, 1998, 2010, 2013 and 2023. According to historical data, the greatest flood to hit Delhi occurred in 1978. Most communities located near the Yamuna River are at risk from flooding. The Irrigation and Flood Control Department, Government of NCT of Delhi, recognized East Delhi as being in the flood plain zone and being susceptible to floods in a research report on “Urban Flooding and its Management” [31]. Floods occur along the Yamuna in low-lying places during the monsoon.
Mumbai: Mumbai, previously known as ‘Bombay’, is one of the largest metropolitan cities, with a rapidly growing economy in both financial and demographic terms. Mumbai is located on the western part of India, between latitudes 18°53′ N to 19°15′ N and longitudes 72°48′ E to 73°00′ E. Originally, Mumbai was a group of islands that were later reclaimed to meet the increasing demand for space. In 2021, the population of the Mumbai metropolitan area reached 20,668,000, reflecting an 11.93% increase compared to the 2011 figure. The Mumbai Metropolitan Region (MMR) encompasses Mumbai, the capital of Maharashtra, and its satellite towns. This region comprises 8 municipal corporations, including Greater Mumbai, Thane, Kalyan-Dombivali, Navi Mumbai, Ulhasnagar, Bhiwandi-Nizamapur, Vasai-Virar, and Mira-Bhayandar. Additionally, there are 9 municipal councils and more than 1000 villages in Thane and Raigad Districts (source: https://mmrda.maharashtra.gov.in/about-mmr (accessed on 1 January 2021)). On 26 July 2005, Mumbai experienced the heaviest rainfall in the last 100 years in suburban Mumbai and Thane, resulting in severe waterlogging. According to [32,33], the 944 mm of rain that fell over the course of 24 h, beginning about 8:30 a.m. on 26 July and continuing into the next day, made this rainfall the sixth largest ever recorded in India. Future increases in rainfall volume or intensity may raise the danger of catastrophic floods.
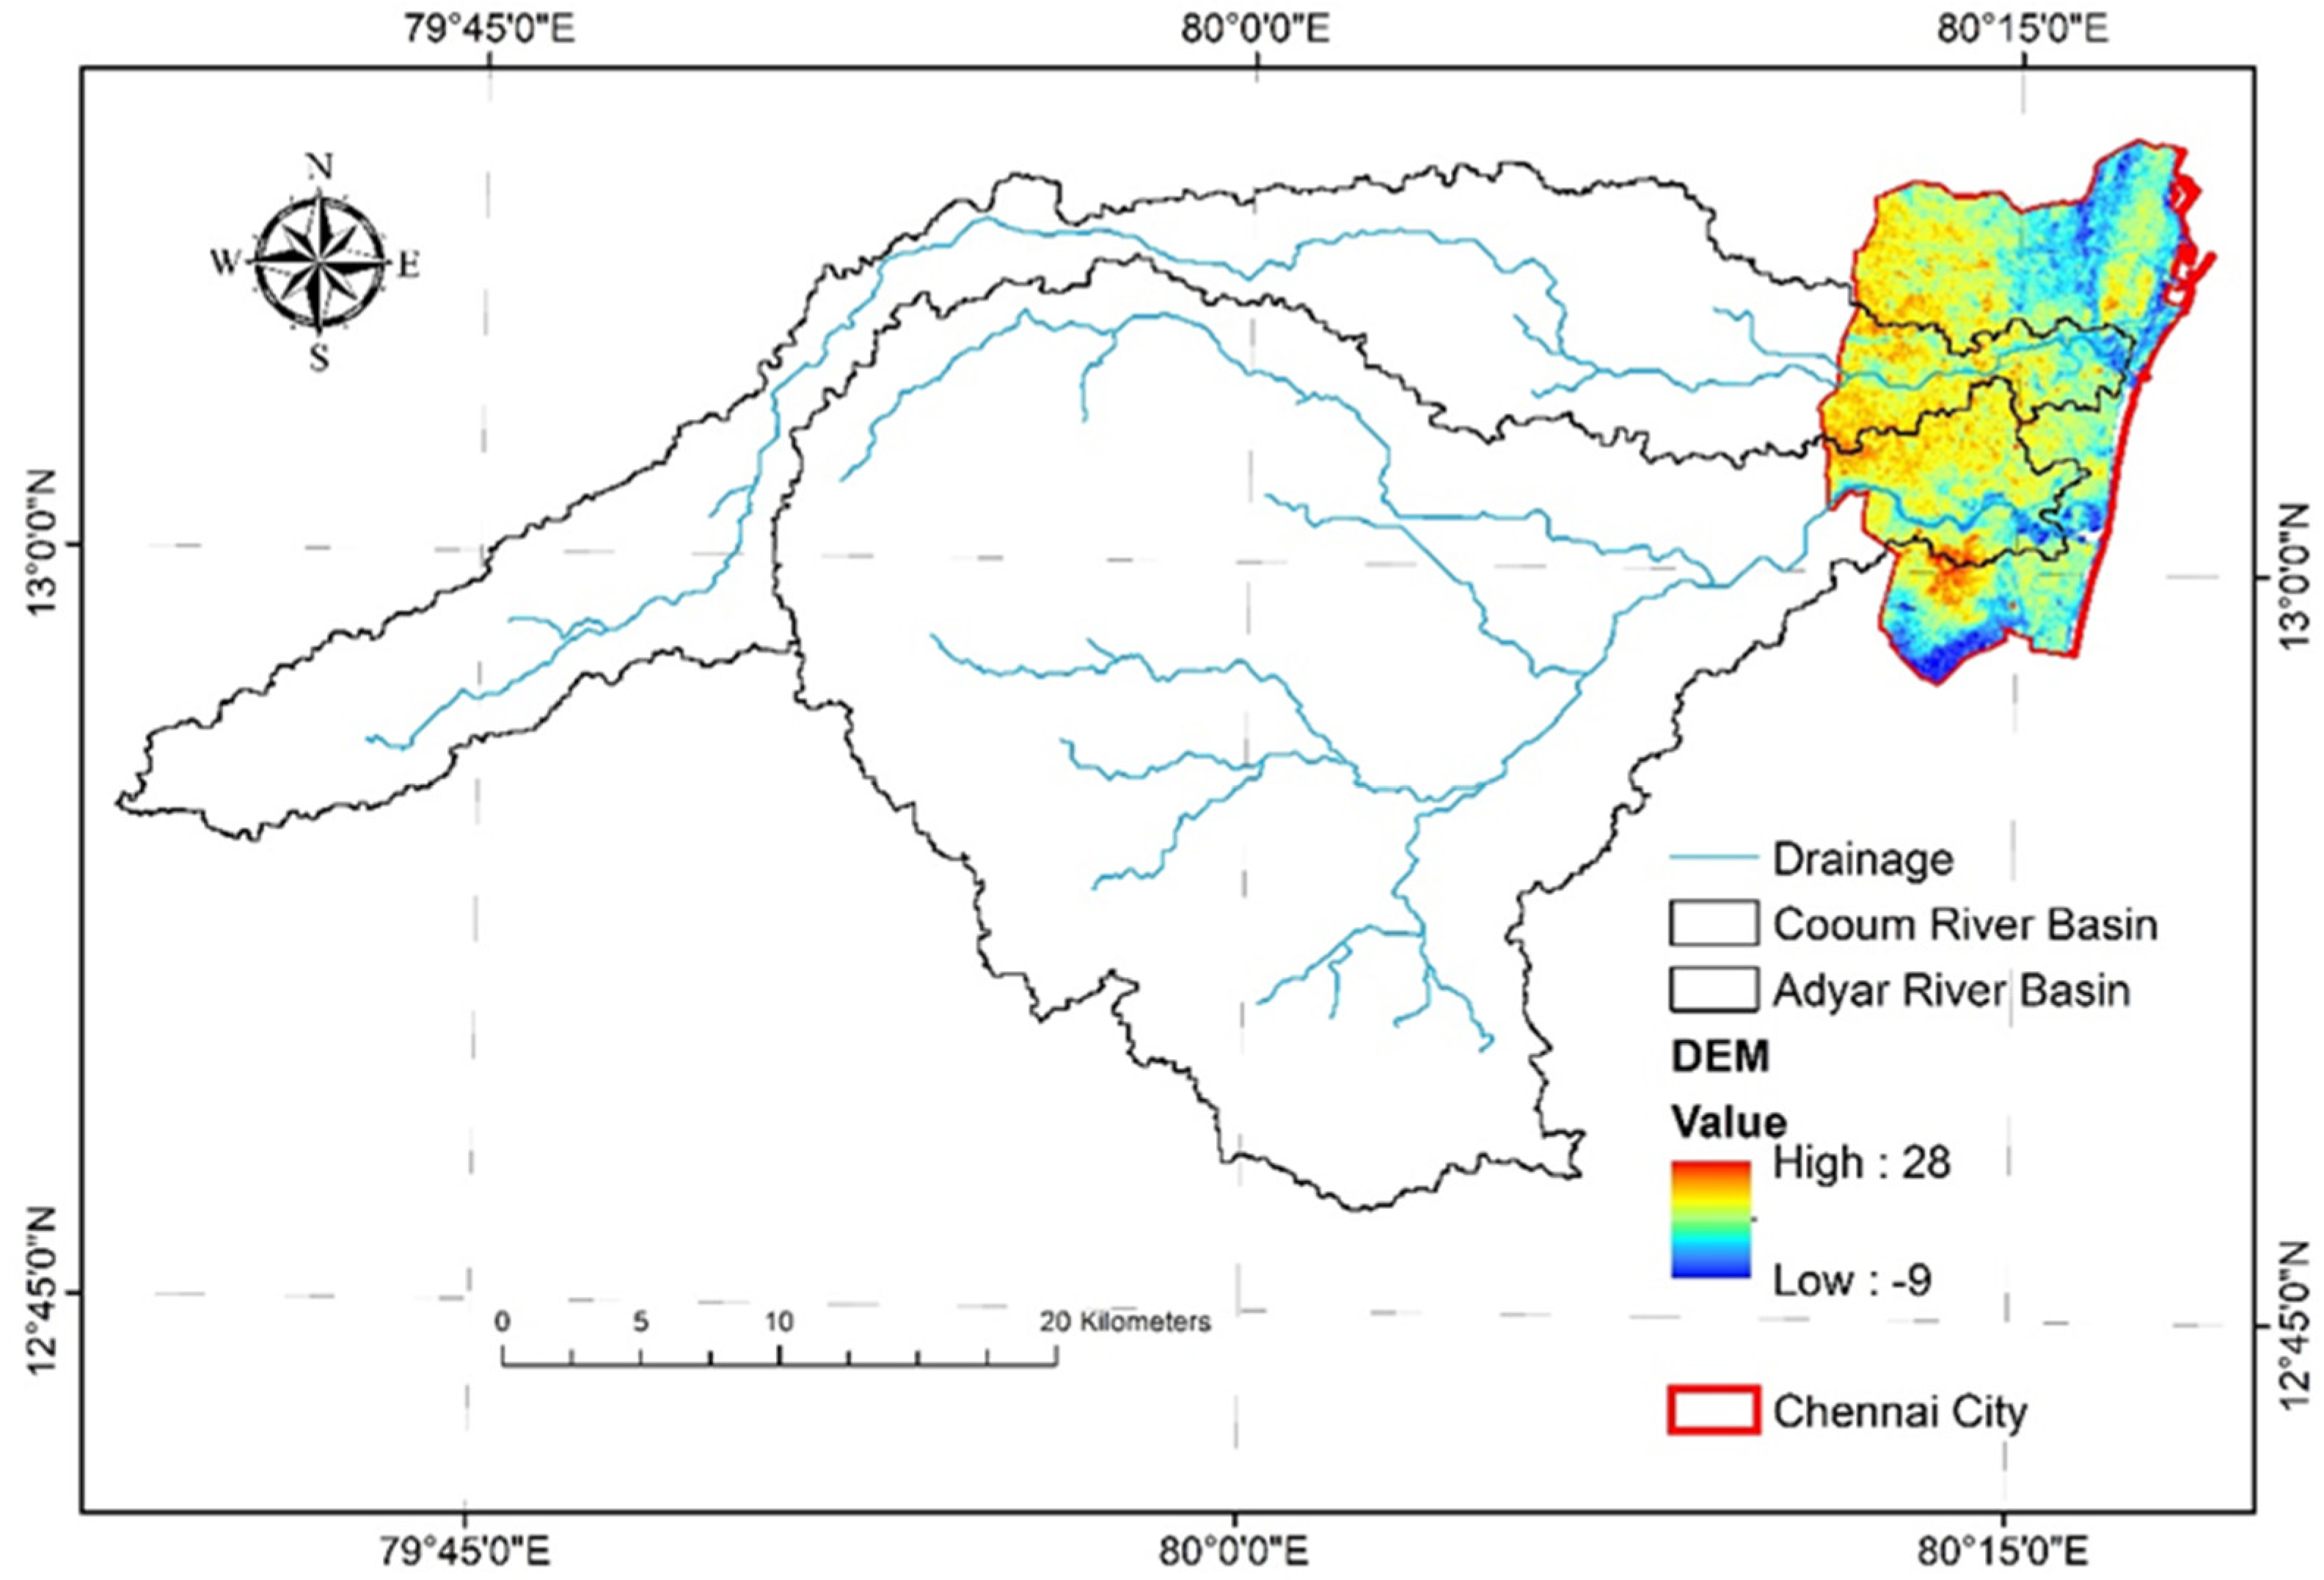
Chennai: Chennai, the state capital of Tamil Nadu, is located on the eastern coast of South India and is intersected by three watercourses: the Cooum River, the Adyar River, and Buckingham Canal. With a total population of nearly 4.7 million, Chennai is the fourth-largest metropolitan city in India, with a population density of 26,903 per sq. Km and a growth rate of 13%. Chennai’s population has increased eightfold in the last century. It is located on the plain terrain along the eastern coast of South India. The city is bounded by the Bay of Bengal to the east and has an average elevation of 6.7 m above sea level. Chennai experiences most of its rainfall during October to December, associated with depressions and frequent cyclones during this period. The region receives between 1200 and 1300 mm of rainfall annually due to its coastal location. The city is drained by two rivers, the Cooum River and Adyar River, in addition to many major and minor drainage channels through the Buckingham Canal to the Sea. Chennai also has more than 50 temple tanks and natural water bodies to capture floodwater and act as groundwater recharging wells. Additionally, the Pallikaranai swamps, Madhavaram and Manali jheels, and Adyar and Couum estuaries are some of the other wetland sources apart from natural and manmade waterbodies in the city.
However, the city is regularly flooded because of the high rain brought on by depressions and cyclones, resulting in disastrous floods that caused substantial damage in 1976, 1985, 1996, 1998, 2005, 2008, and 2010. Chennai is not in need of rain, but rather of water, because of poor water storage management. In 2010, the months of October through December brought roughly 760 mm of rain to Chennai, while the most recent day of maximum rainfall was October 27, 2005, with 423 mm. Occasional flash floods bring disruptions in everyday life.
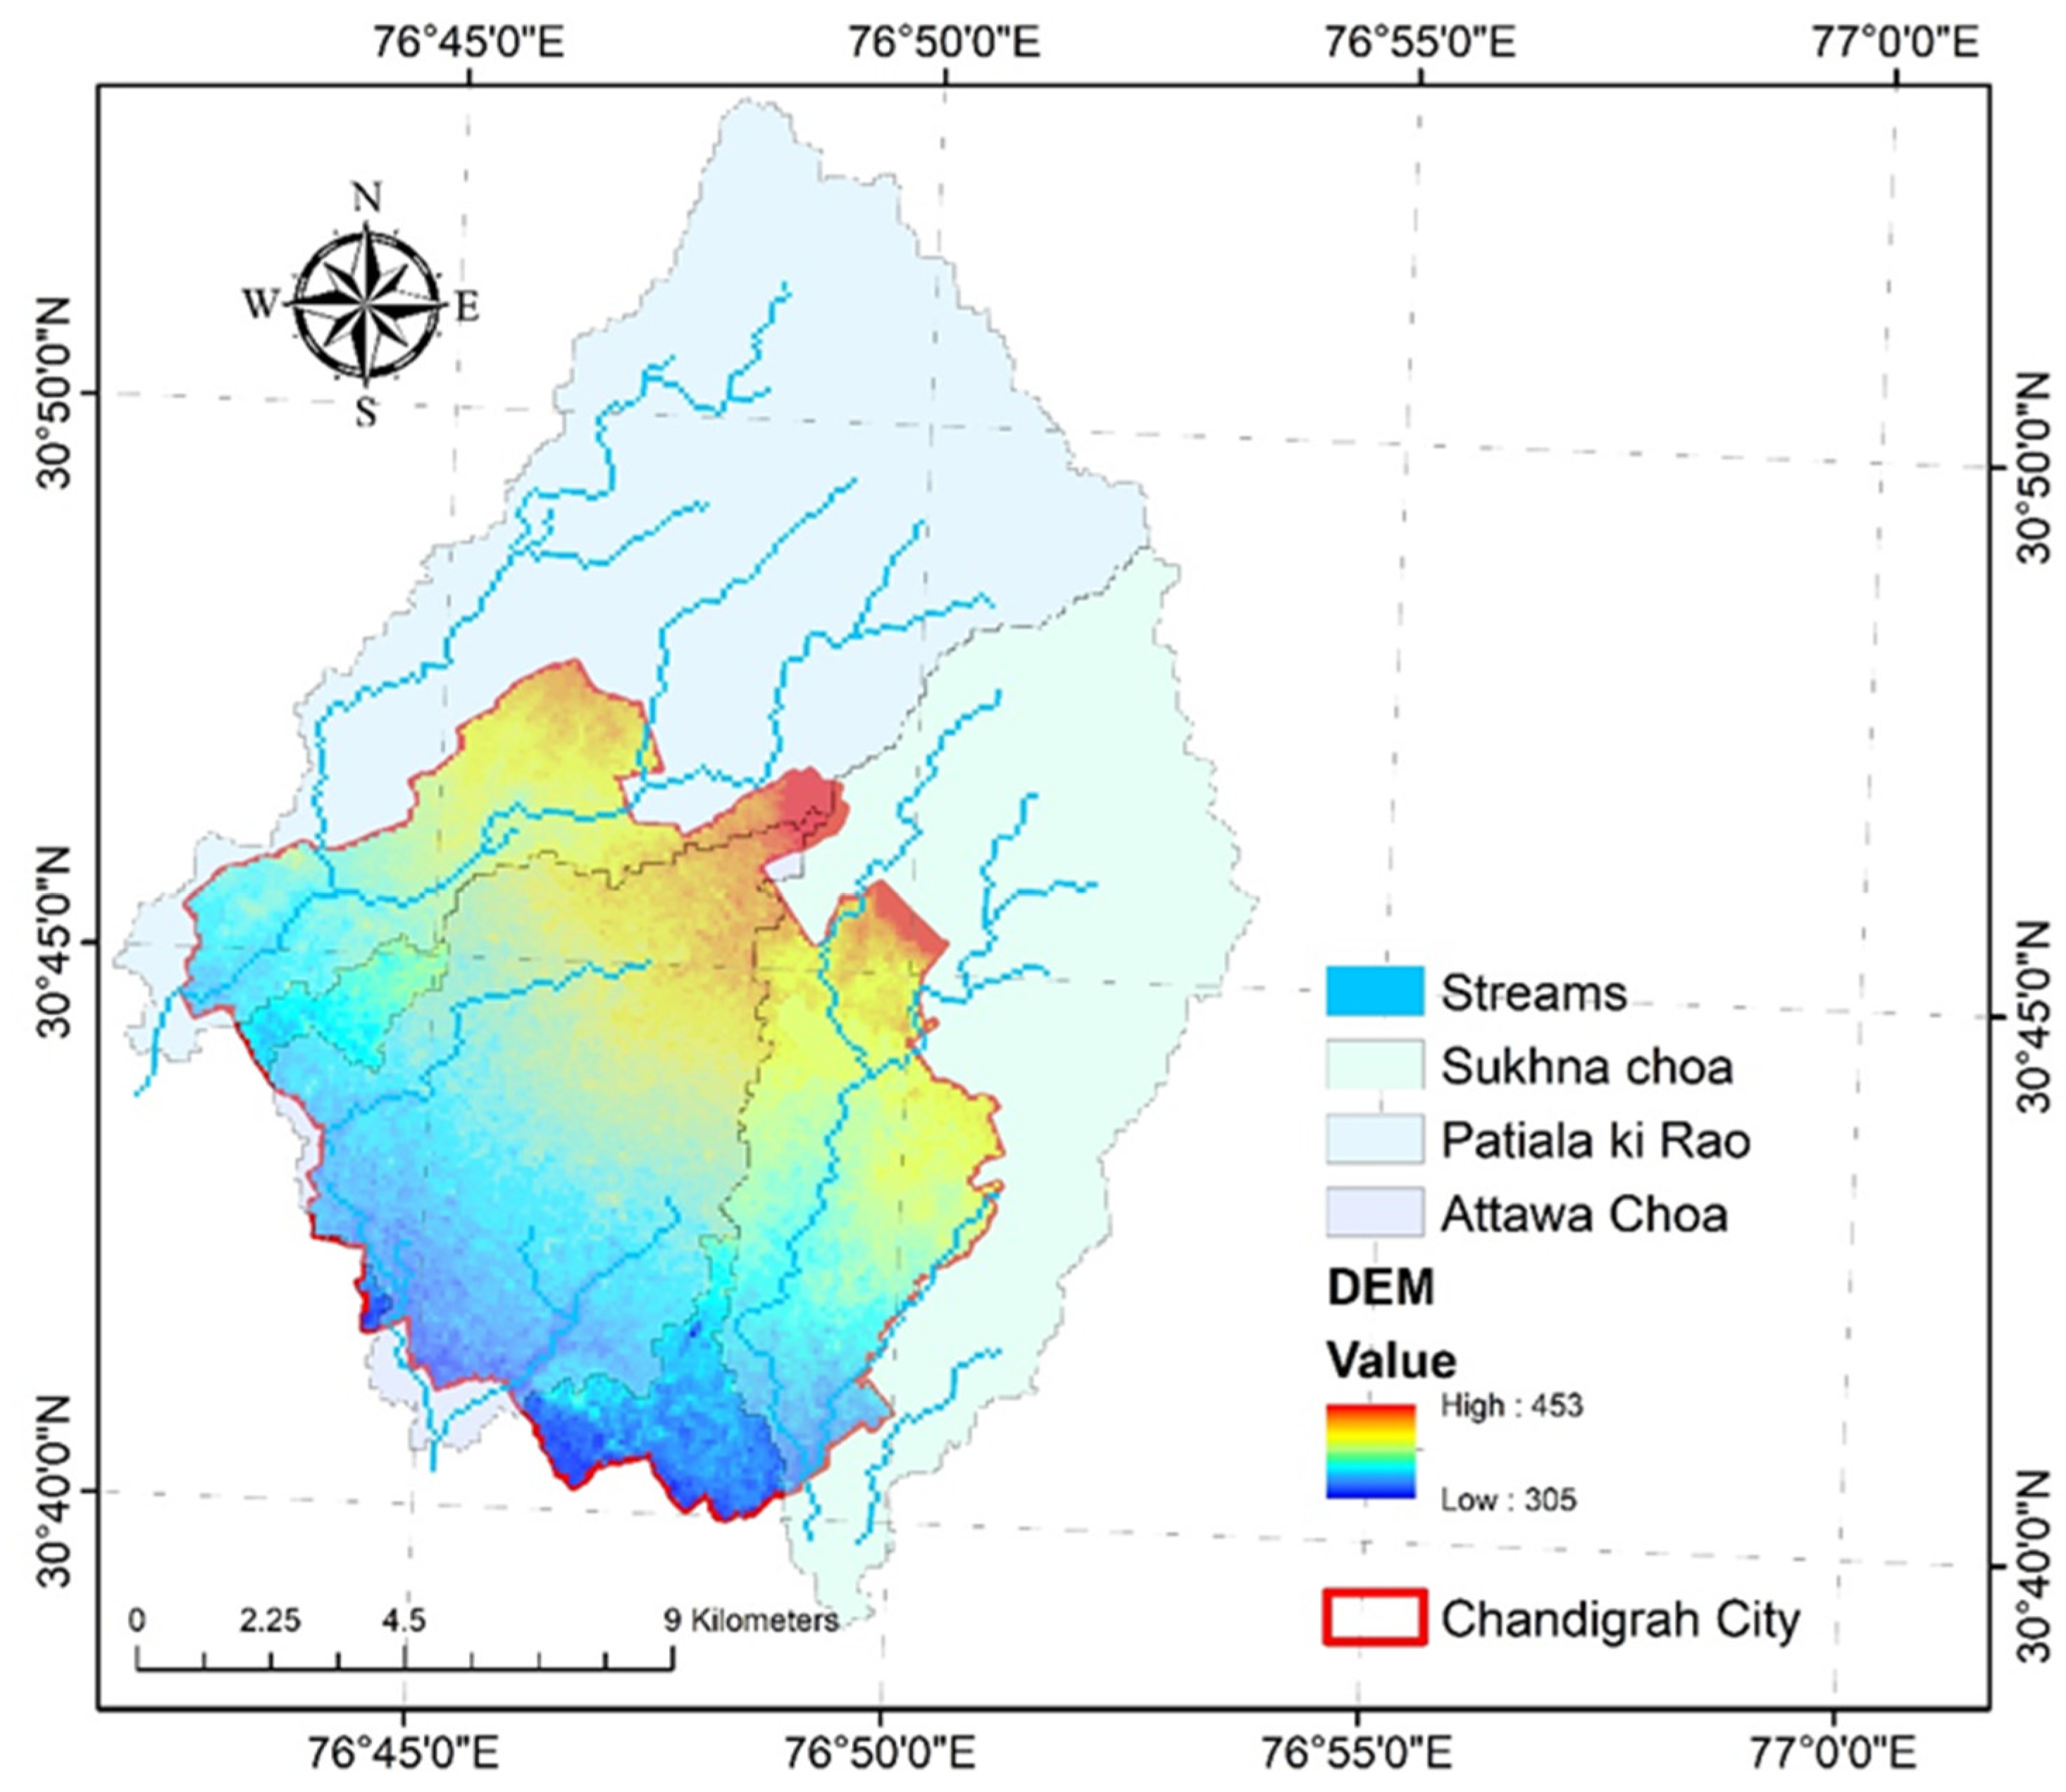
Chandigarh: According to the 2011 census, Chandigarh, a city on the borders of the Shivalik range at 30°43′ N latitude and 76°46′ E longitude, had a population of 10, 55,450. As of 2021, the population of the Chandigarh metropolitan area reached 1,169,000, showing a significant 19.65% increase since 2011. As per the annals of history, this city was planned by the Swiss-born architect Le Corbusier along with others, and most of the city was completed in the early 1960s. Due to economic constraints, the city’s master plan was divided into two phases, catering to a total population of half a million. Phase-I encompassed 30 low-density sectors, covering 9000 acres (Sectors 1 to 30) and accommodating 150,000 people. In contrast, Phase-II comprised 17 considerably high-density sectors (Sectors 31 to 47), spreading over 6000 acres and designed for a population of 350,000. The city is a few miles south of the Shiwalik Hills and is located in the Indo-Gangetic plain, flanked to the north and south by the seasonal hill torrents Sukhna Choe and Patiali Rao. The soil is alluvial and covers around 114 km2 of flat, productive terrain. In addition to Punjab to the north and west, Chandigarh also borders the states of Haryana to the east and south. The average annual rainfall is roughly 105 cm, and the temperature ranges between 0 °C and 44 °C. In addition, the region sometimes experiences winter rain because of western disturbance. Chandigarh experienced an all-time high rainfall of 302.2 mm in the period before 8:30 a.m. on 9 July 2023, as per the 24 h figures.
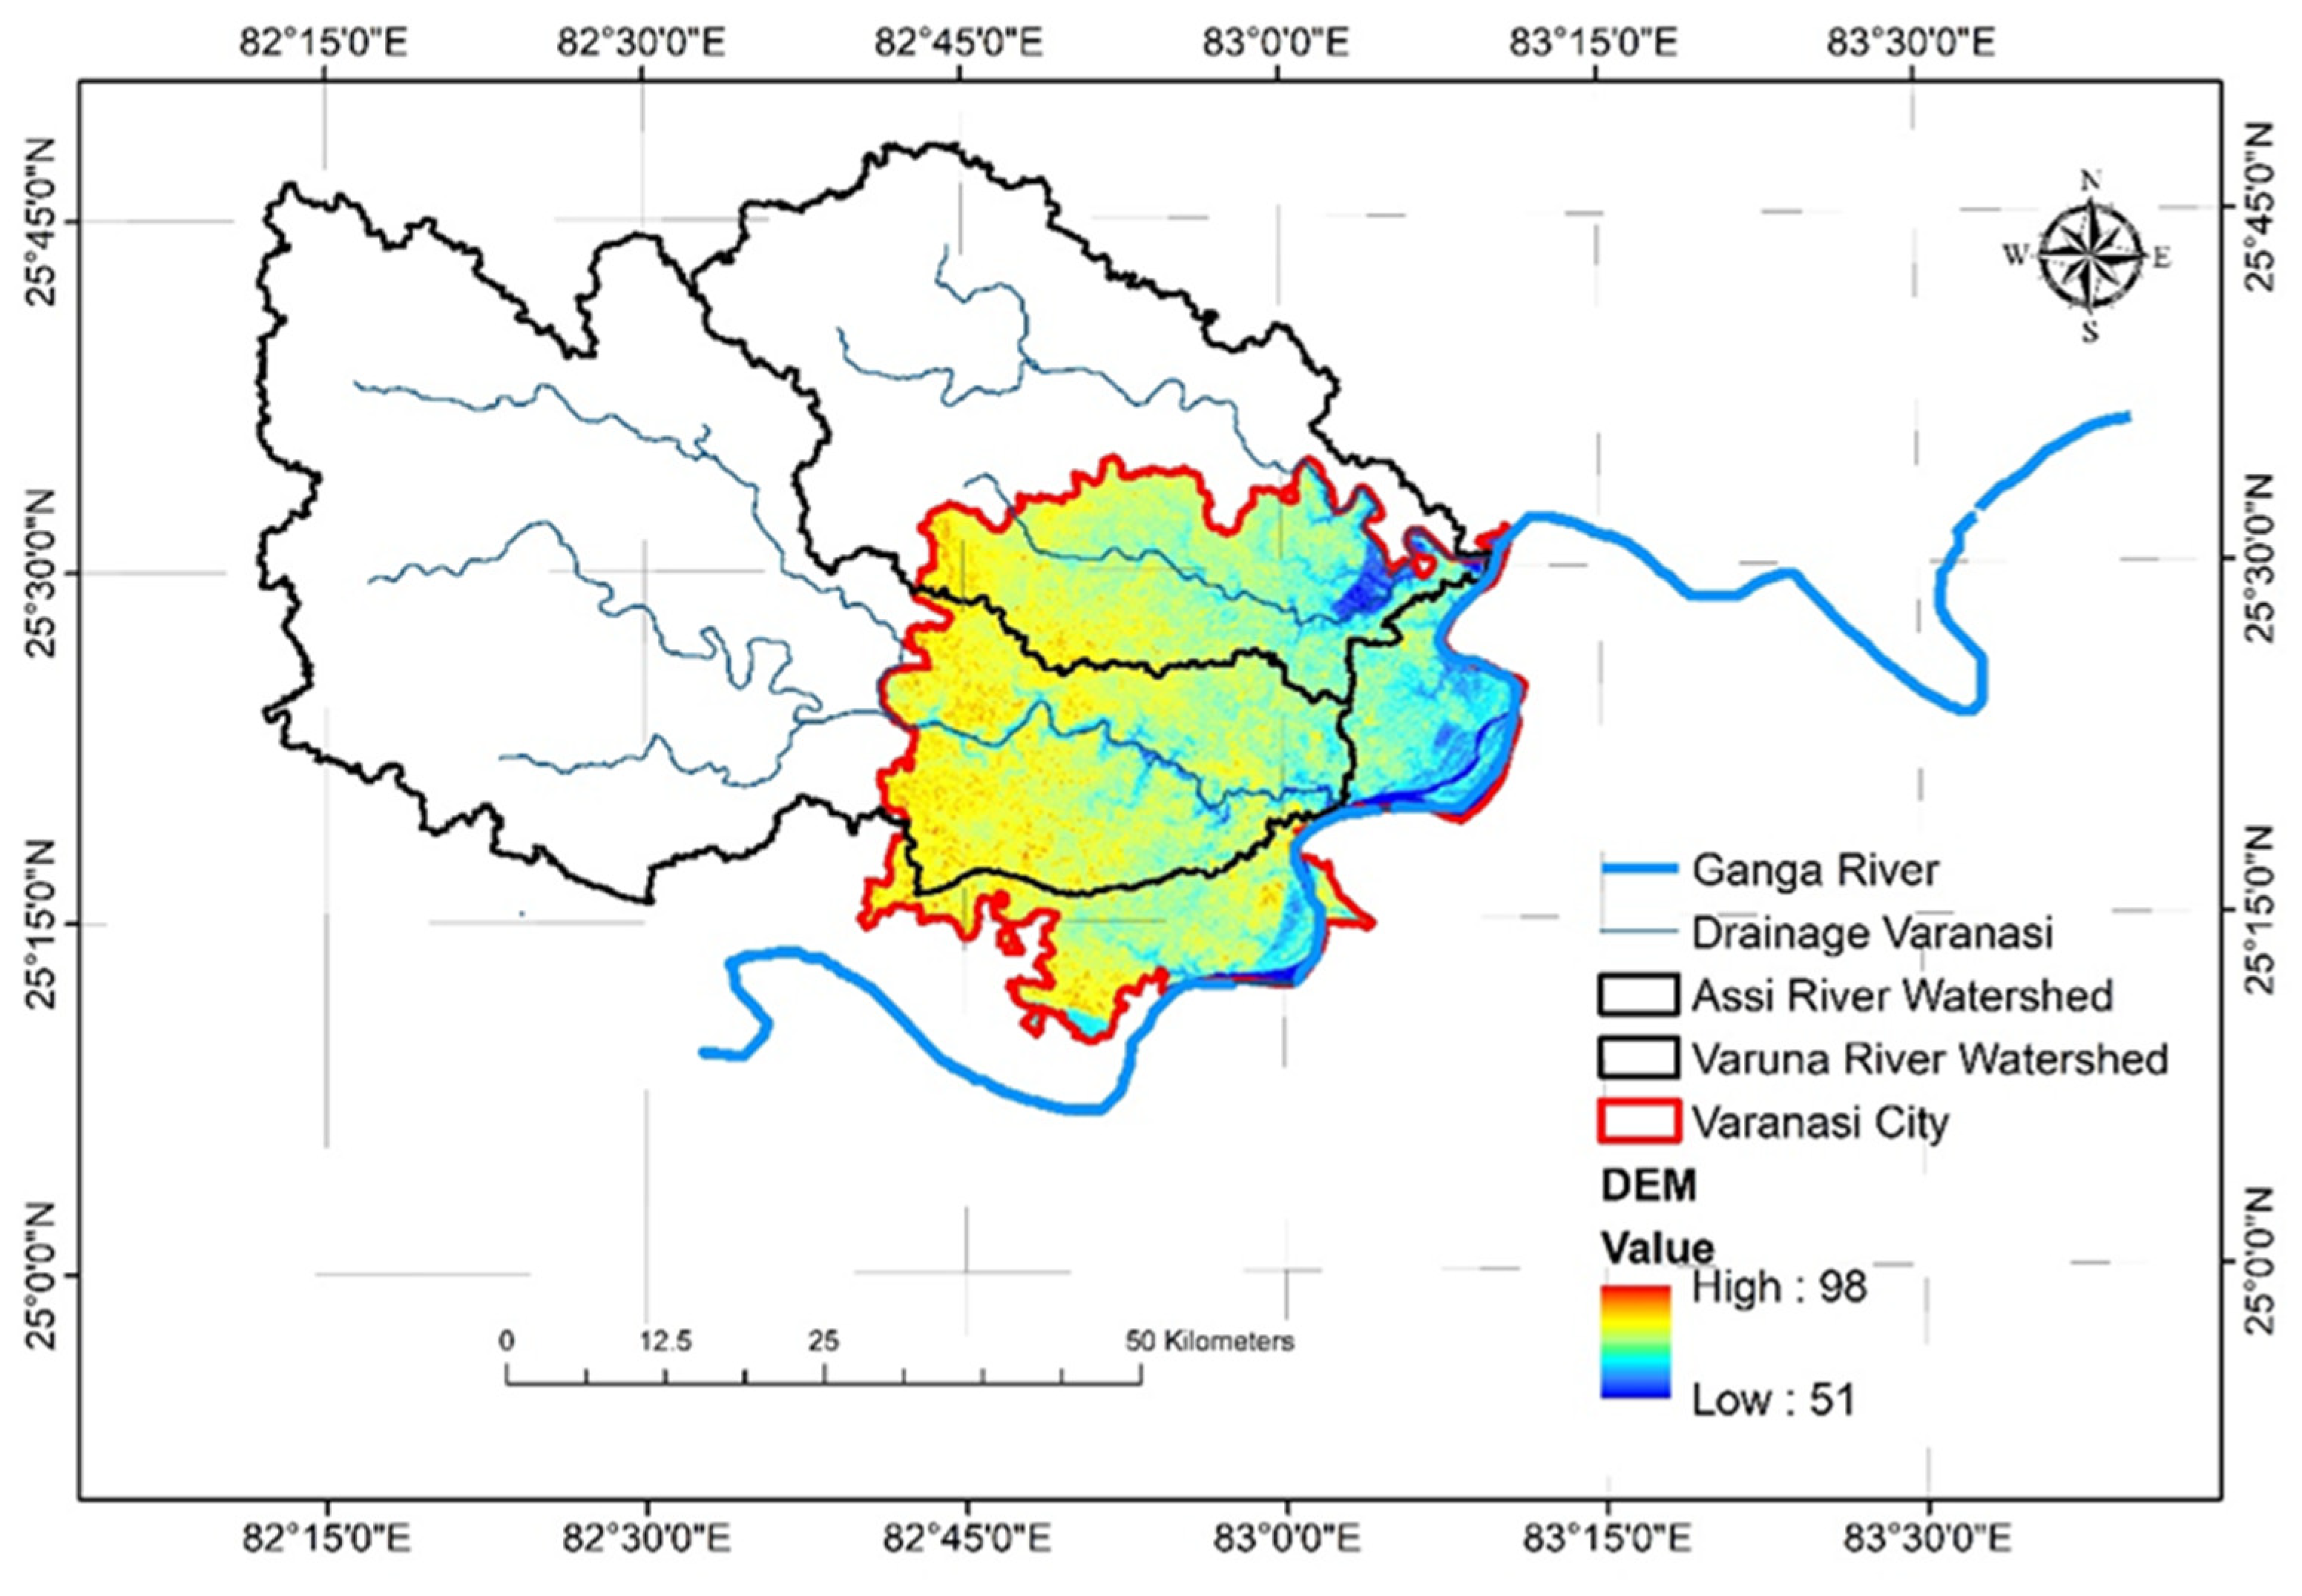
Varanasi: Varanasi sits on the left bank of the Ganga River, between longitudes 82°93′ E and 83°05′ E and latitudes 25°24′ N and 25°38′ N. Located atop a natural levee—a prominent feature along the concave sides of big flowing rivers in wide floodplains—the historic district of the city provides the highest possible ground for habitation. As of 2011, the total population of Varanasi city stood at 1,599,260. The city’s population growth rate is notably high at 26.87%, surpassing both the Varanasi district (17.14%) and the Uttar Pradesh state (20.09%). From 2010 to 2020, substantial growth primarily occurred in the northwestern (NW) and southwestern (SW) regions of the city [34]. The historic city centre faces considerable development pressure, with population density reaching as high as 500 to 700 persons per hectare. Varanasi attracts around half a million Indian pilgrims, along with approximately 125,000 tourists from abroad. The current Master Plan designates residential land use as 52% of the total land area. Varanasi’s peri-urban zone, which is around 145–150 km2, has extended into the flood basin from the natural levee. The primary cause of floods in Varanasi is waterlogging due to a faulty, outdated, or non-existent drainage and sewage infrastructure. The situation worsens, however, when actual floods occur in the Ganga River and other minor flood-plain streams draining from the west to the east towards the city. The Indian city of Varanasi is on a floodplain that generally slopes to the east and north-northeast. Although floodplains are mostly featureless, they do offer some interesting characteristics. Prudhvi Raju [35] provide a thorough description of the geomorphology of the city of Varanasi and its environs. Because of its elevation above a natural levee, Varanasi features a distinct flood plain. There is an obvious flood basin collecting runoff from the hinterland; the formation of small to large ponds is a natural occurrence. Varuna, a floodplain tributary of the Ganga in Varanasi, runs through the city’s northern half and eventually meets the Ganga in the city’s northeast. Similarly, the Assi, a small floodplain affluent, flows through the city’s southeastern part before emptying into the Ganga farther south. Varanasi saw its second-highest flood in August 2013 at 72.94 m amsl [36] after the biggest recorded flood in September 1978 at 73.90 m amsl (http://indiawater.gov.in/ffs/hydrograph/ (accessed on 1 January 2021)).
Roorkee: Roorkee is a city in the Indian state of Uttarakhand’s Haridwar district. The region is located close to the Himalayan foothills, between 29°5′ N latitude and 77°63′ E longitude, on the right bank of the Ganga River’s tributary, the Solani River. The upper Ganga Canal splits the town in half across the middle. The older neighbourhoods make up most of the land on the west (right) side of the canal, while the civil lines, IIT campus, C.B.R.I. campus, the cantonment area, etc., are on the east (left) side of the canal. The elevation of Roorkee is 274 metres above mean sea level. At present, the population within the metropolitan area of Roorkee has reached 392,000, indicating a growth rate of 3.16% when compared to the previous year, i.e., 2022.
Physiographically, Roorkee city is located on the northern edge of the Gangetic plain, and the surrounding agricultural fields and ground surface are almost plain in nature, with a slight slope towards the Solani River. The altitude ranges from 250.00 m to 269.20 m. A contour map was created using ArcView GIS after the spot level data of numerous places evenly spaced over the whole research region were gathered from different sources [37]. In the studied region, the main drainage flows southeastward towards the Solani River. The Malakpaur Cut, which flows eastward through the eastern section of the town, is the other drain [38]. The city has a subtropical climate, with significant seasonal temperature variations in both summer and winter. In the summer (May and June), the temperature can sometimes reach 40 °C, while in the winter (December and January), it can drop to 5 °C. Beginning around the middle of June and ending in the first week of September is the monsoon season. The majority of the region’s 1100 mm yearly rainfall falls between the middle of June and the middle of September. The humidity levels during this season are quite high (maximums around 100% and minimums around 60%) [39].
2.2. Selection of Indices for the Study
A total of eleven out of twenty indices were considered for this study (Table 1), which are directly related to our study objective of comprehensive and pertinent technical examination of stormwater systems based on the most important elements. It may be noted that though all the indices provide valuable information on several associated domains of sustainability, the reasons for not selecting indices for this study fall into one of the following categories: (a) non-availability of data/information; (b) complexity/difficulty of enumeration; (c) more focus on operation/management rather than technical status assessment. Table 1 also presents the status of inclusion of indices along with a justification for exclusion.
2.3. Data Availability
The required spatial inputs were derived using geospatial data sets collected from a variety of sources [40]. The details of the spatial and other data sets are as follows:
- Landsat 7 OLI satellite image analysis employing 1 to 7 bands in ArcGIS 10.4.
- Landsat 8 OLI satellite image analysis employing 1 to 7 bands in ArcGIS 10.4.
- Shuttle Radar Topographic Mission (SRTM) 30 m resolution Digital Elevation Model (DEM).
- Rainfall data for the period from 1991 to 2019 observed using the self-recording Rain Gauge (SRRG) at the Department of Hydrology, IIT Roorkee for Roorkee site and IMD 0.25 degree grided data as secondary data for other sites.
- Population data derived from past census records.
- Physio-chemical parameters of stormwater as analysed for Roorkee and collected through various research and reports for other sites as secondary data.
2.4. Processing of Data
Identification and demarcation of the main drainage system: Discovering and demarcating the research area’s natural streams was the first step. SRTM DEM (30 m × 30 m) was used to establish the primary natural drainage system, and ArcGIS 10.1’s drainage map was used to demarcate it. The Digital Elevation Model (DEM) was used to determine the topographical characteristics of the research region.
Measurement of Drain Cross-Sections: Using ArcGIS 10.1’s drainage maps, we identified and measured the drains within the research area, enabling us to establish their cross-sectional profiles.
Identification and demarcation of waterlogged areas: To comprehend the connections between humans and their environment, both geographically and ecologically, we conducted a thorough investigation of the flooded regions. Data from the US Geological Survey’s (USGS) Landsat 7 Thematic Mapper (TM), the Advanced Spaceborne Thermal Emission and Reflection Radiometer (ASTER), and the Digital Elevation Model (all from 2020) were utilized. After running the DEM through Arc GIS 10.1 and factoring in the random elevations found throughout the study area and its environs, we were able to create a series of maps showing the topographic features of the area under investigation. These included a relief map showing elevation variations and contour lines within the study area, as well as a slope map showing the topographic features of the slope, a canal density map showing the distribution of canals, and an embankments distribution map showing the distribution of embankments. Once again, we used the GLOVIS ASTER data to generate a DEM with the aid of Arc GIS 10.1 and then used it to construct a relief map. The digital numbers (DNs) from different spectral bands were converted to top of atmosphere (TOA) radiance values employing ArcGIS 10.1 and ERDAS Imagine 9.1. Thereafter, an unsupervised classification of the study area was performed to identify and delineate waterlogged areas using Landsat 7 TM imagery from 2020.
Delineation of study area: DEM was delineated with the help of Arc GIS 10.1 software.
Contour map of study area: A surface contour map was created using Arc GIS 10.1.
Calculation of depression storages: The average depth of water across the drainage basin is a popular measure of size of the depression storage, which varies according to soil cover, natural terrain, and ground slope. According to reports, normal depression storage ranges from 1.0 to 3.0 mm on paved surfaces and to 7.5 mm on wooded ones [41]. But on level, undulating ground and in areas with blind drainage, such as big depressions, the storage capacity may be much greater. The depression storage for lawns is between 3.0 and 5.0 mm. Linsley [42] provided an expression for the volume of water in depression storage areas (Vs):
where,
Vs = depression storage per unit area, mm;
Sd = depression storage capacity, mm;
Pe = depth of precipitation in excess of interception and infiltration.
The given calculation does not take evaporation into account. The parenthetical components in this equation suggest that Pe = 0 and the storage capacity of the depressions is equal to their actual capacity if all depressions are filled.
According to the results of the experiments, the depression storage of an impervious surface ranges from 3 mm for a slope of 1% to 1.3 mm for a slope of 3%. Sd ranges from 10 to 50 mm in natural basins; for grass and turf, depression storage is around 5 mm, as shown. The rate of depression storage during rainfall can be expressed by
where,
I = rainfall intensity, mm/h;
f = infiltration rate, mm/h [43].
2.5. Enumeration of Individual Indices in Standalone Mode
2.5.1. Natural Drainage System Index
This index was calculated by delineating the study area and determining the natural streams in that area, as represented in Figure 2, Figure 3, Figure 4, Figure 5, Figure 6 and Figure 7.
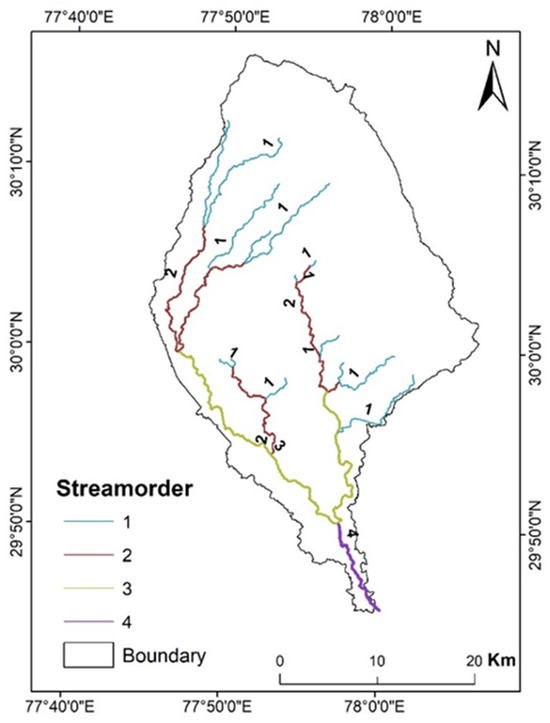
Figure 2.
Drainage map of Roorkee.
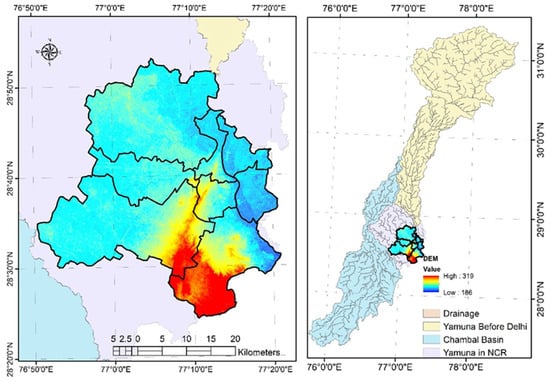
Figure 3.
Drainage map of Delhi.

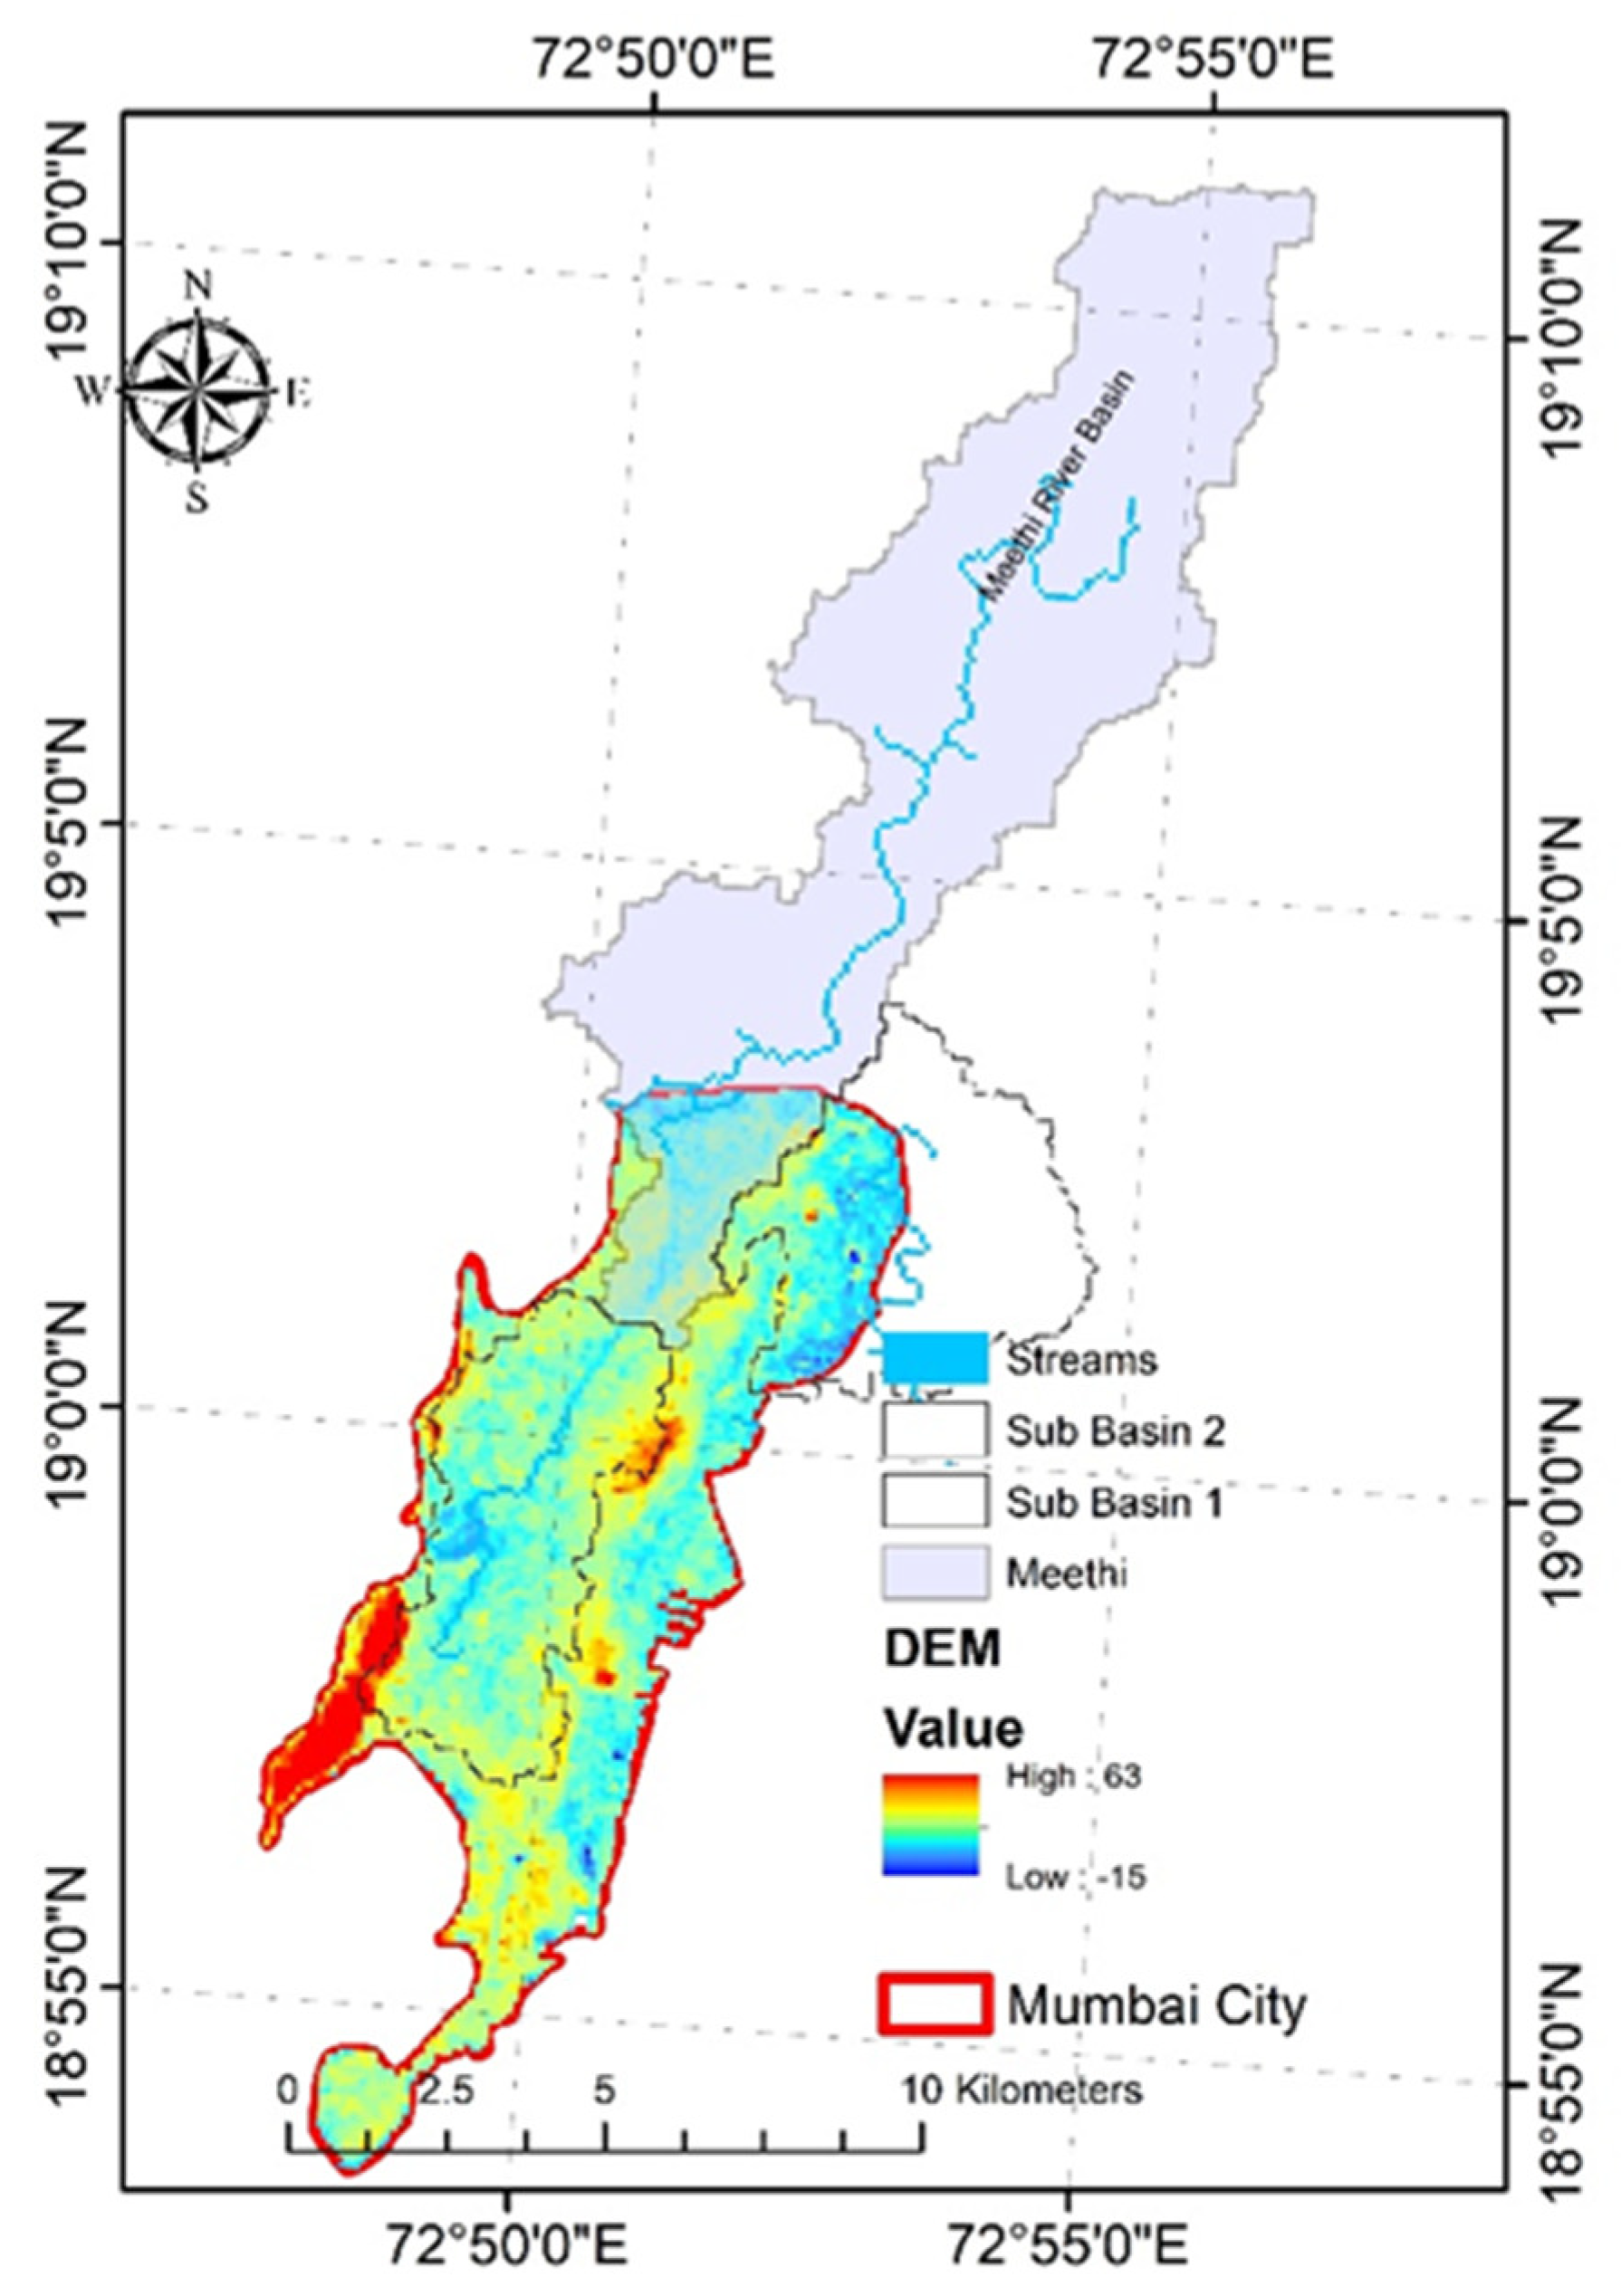
Figure 4.
Drainage map of Mumbai.
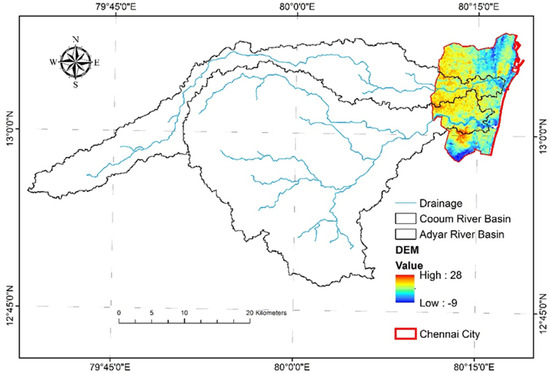
Figure 5.
Drainage map of Chennai.

Figure 6.
Drainage map of Chandigarh.
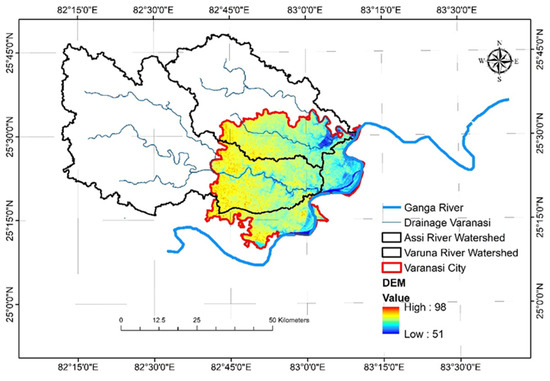
Figure 7.
Drainage map of Varanasi.
2.5.2. Drainage Coverage Index
This index was calculated by determining the ratio of the drainage network on a historical datum date to the need of total drainage at the present date.
2.5.3. Permeability Index
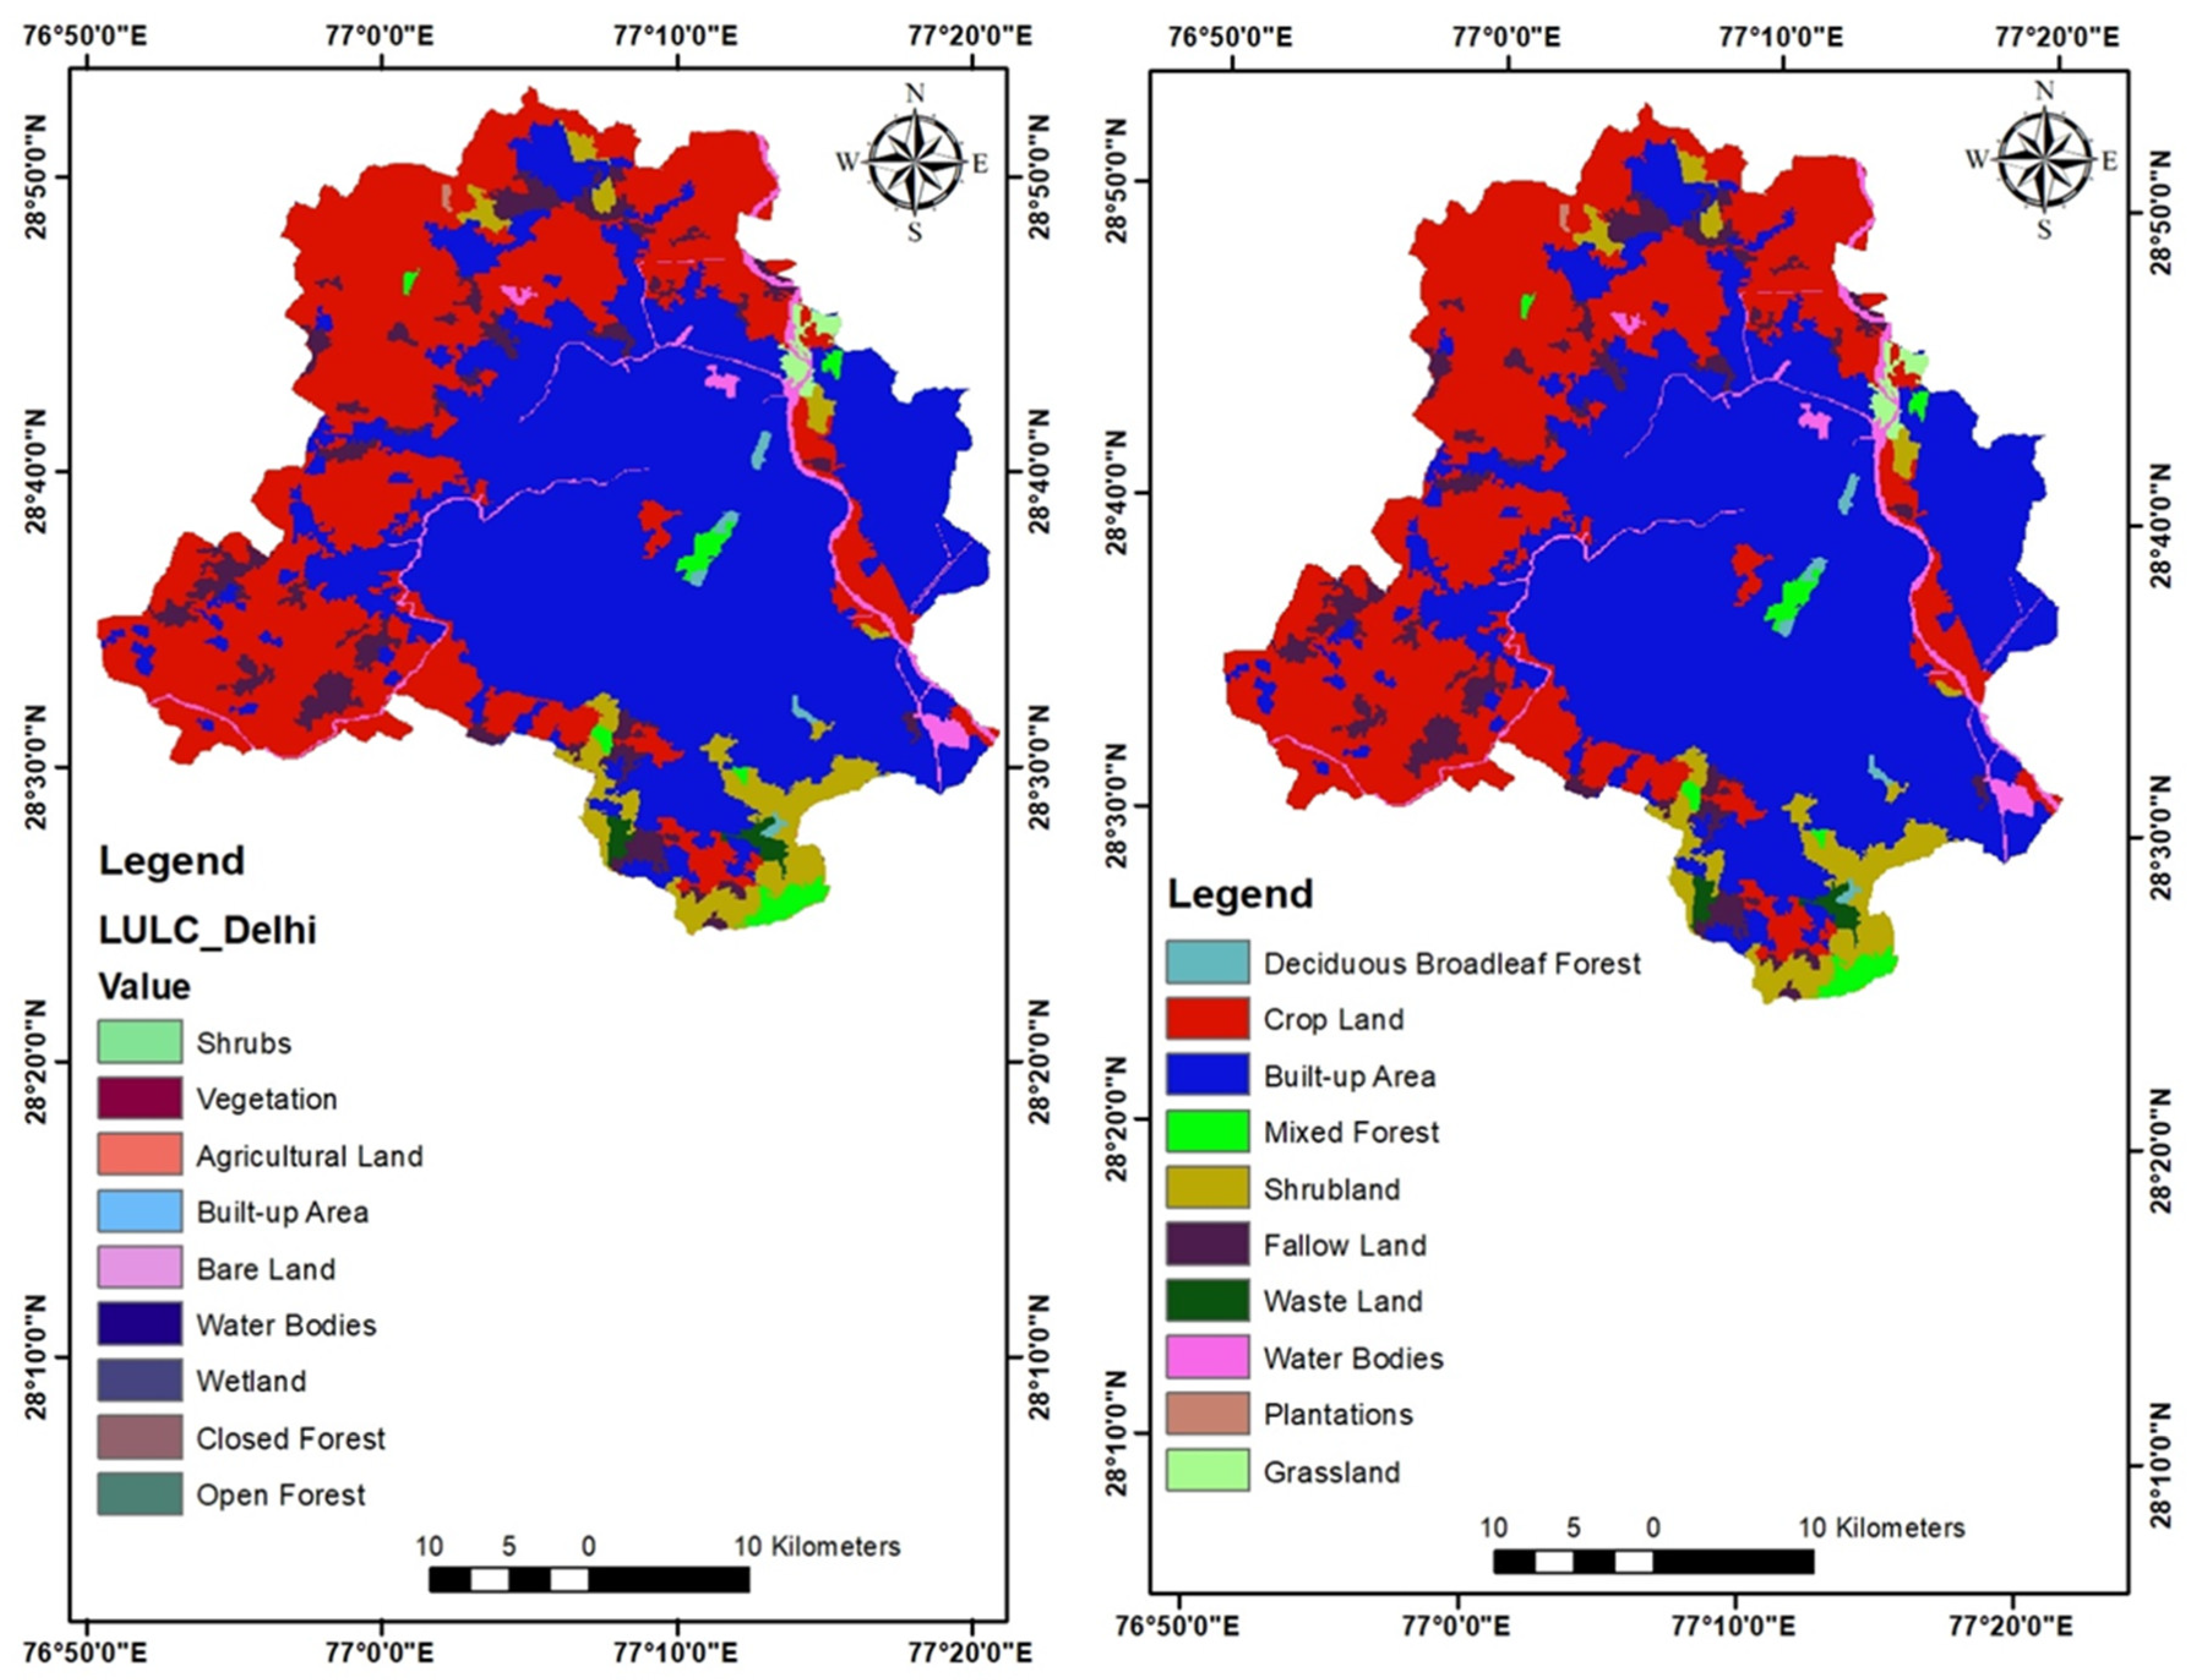
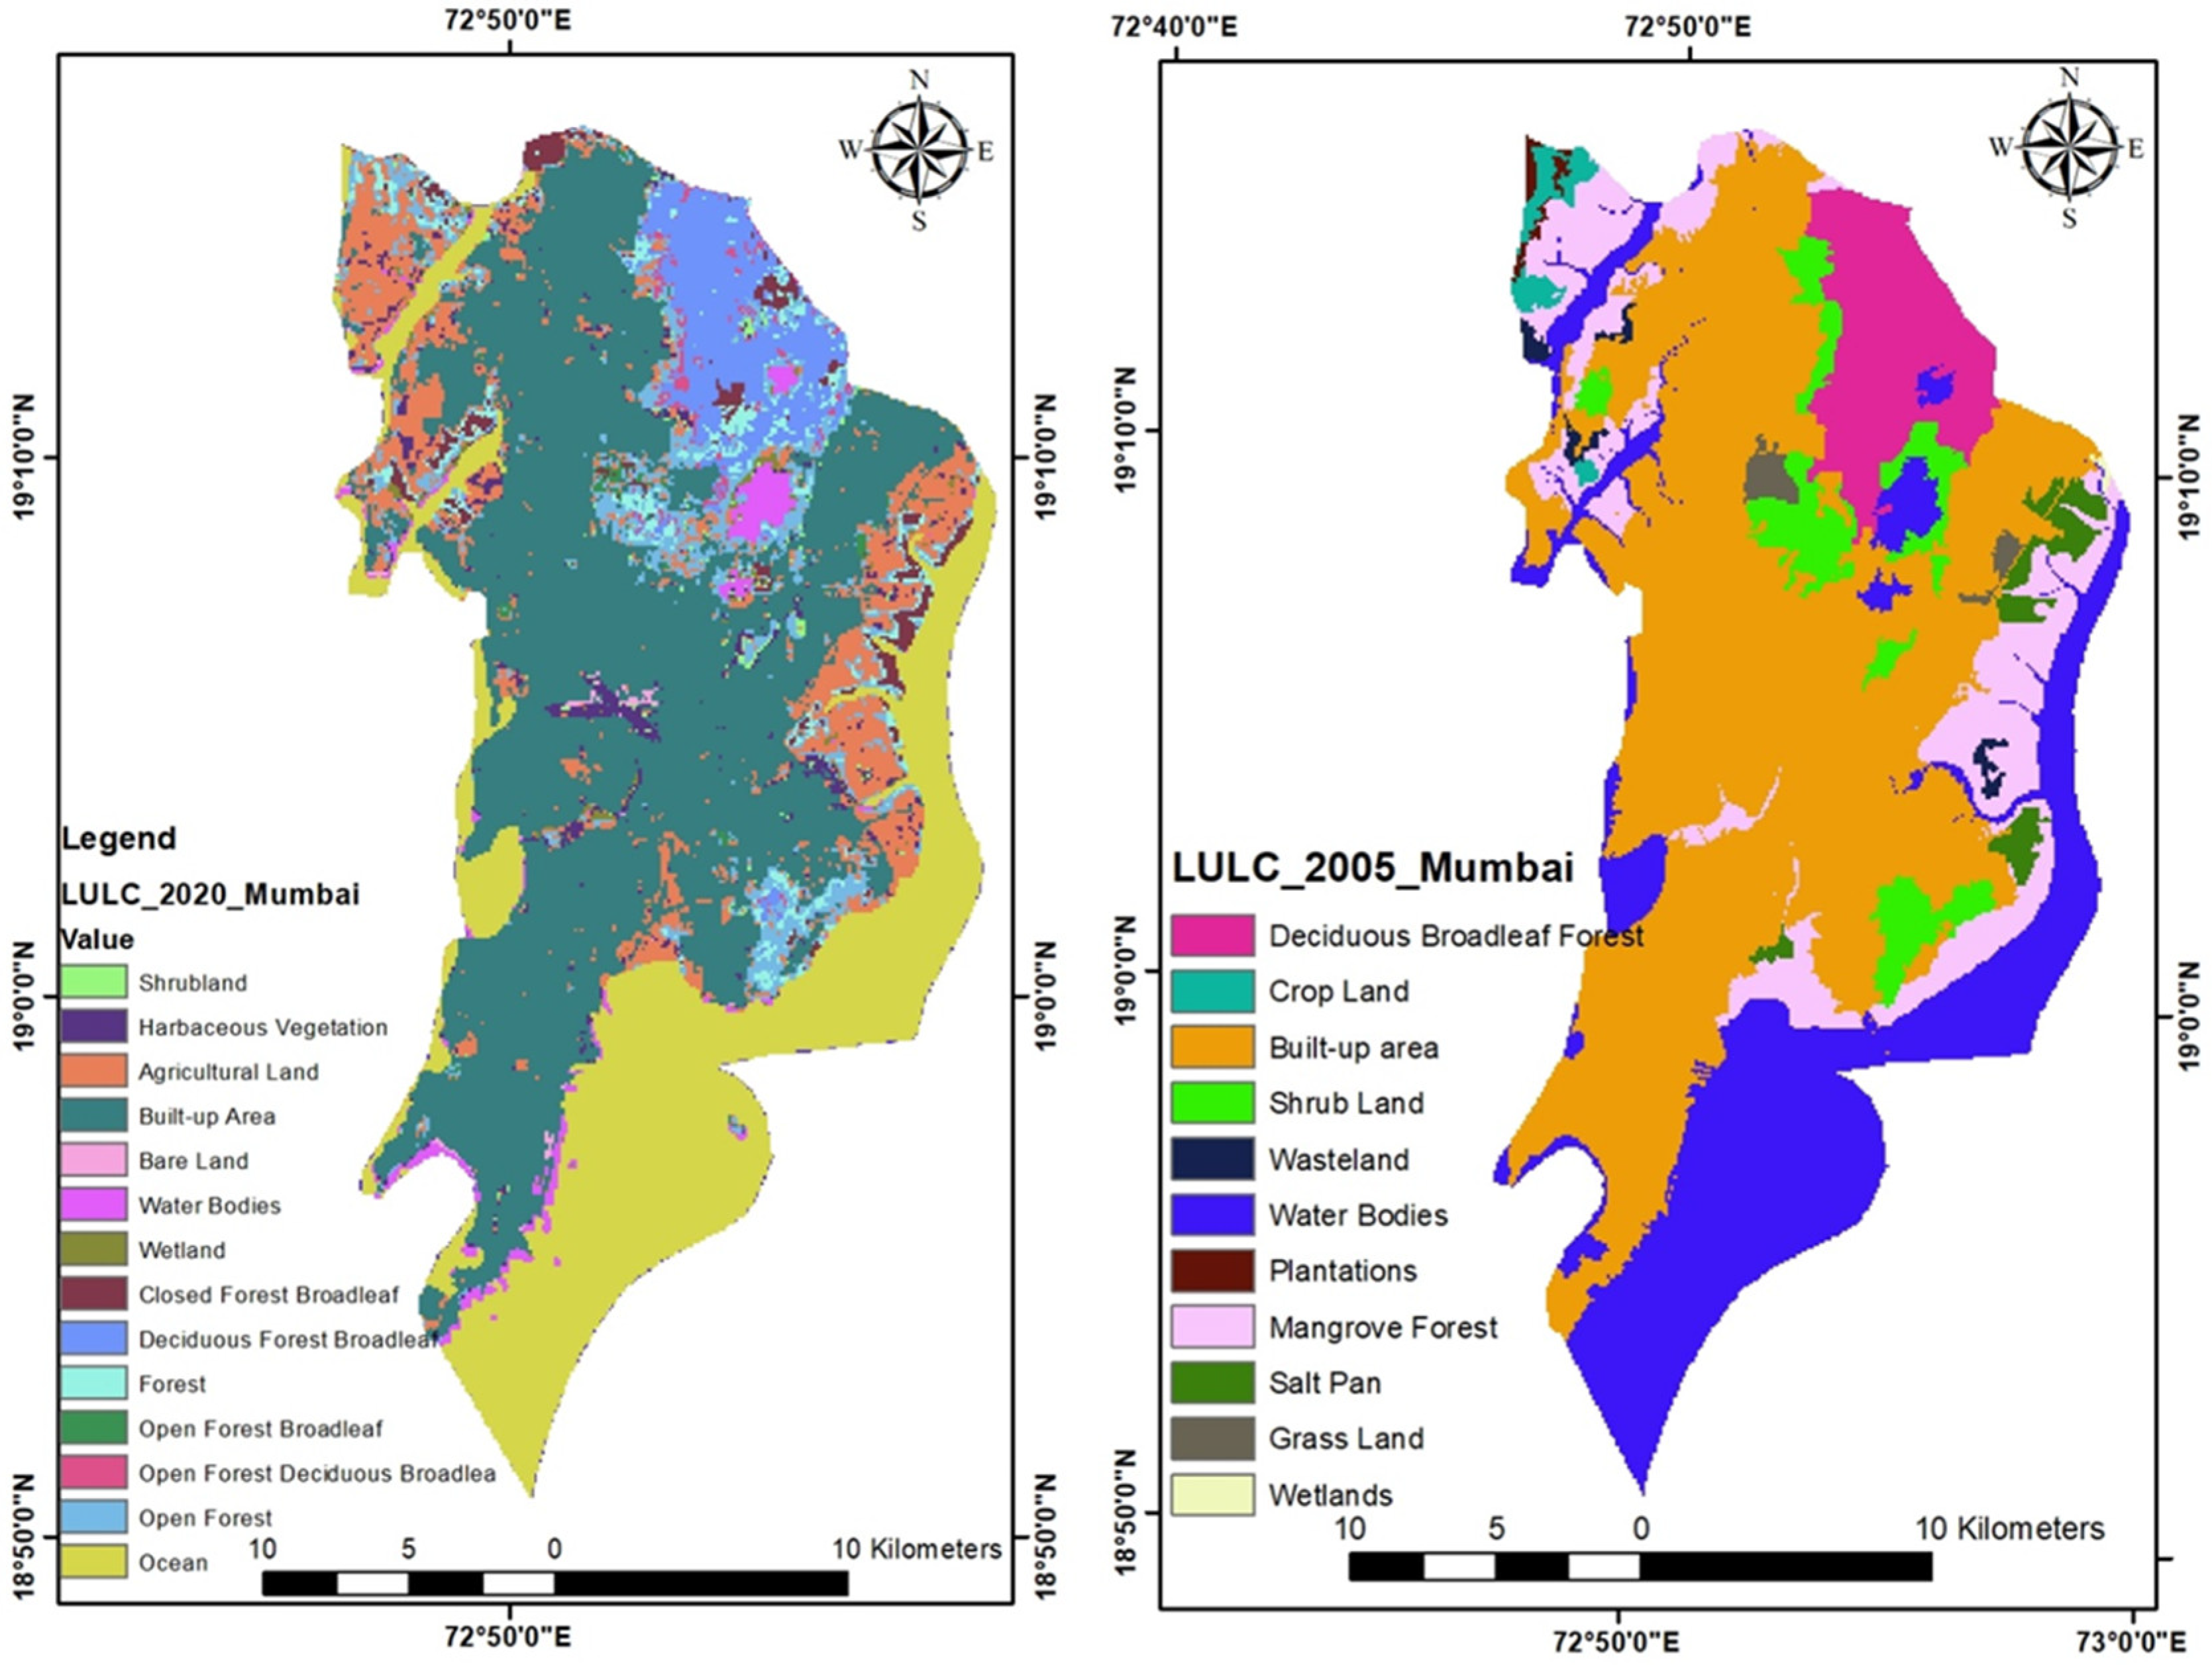
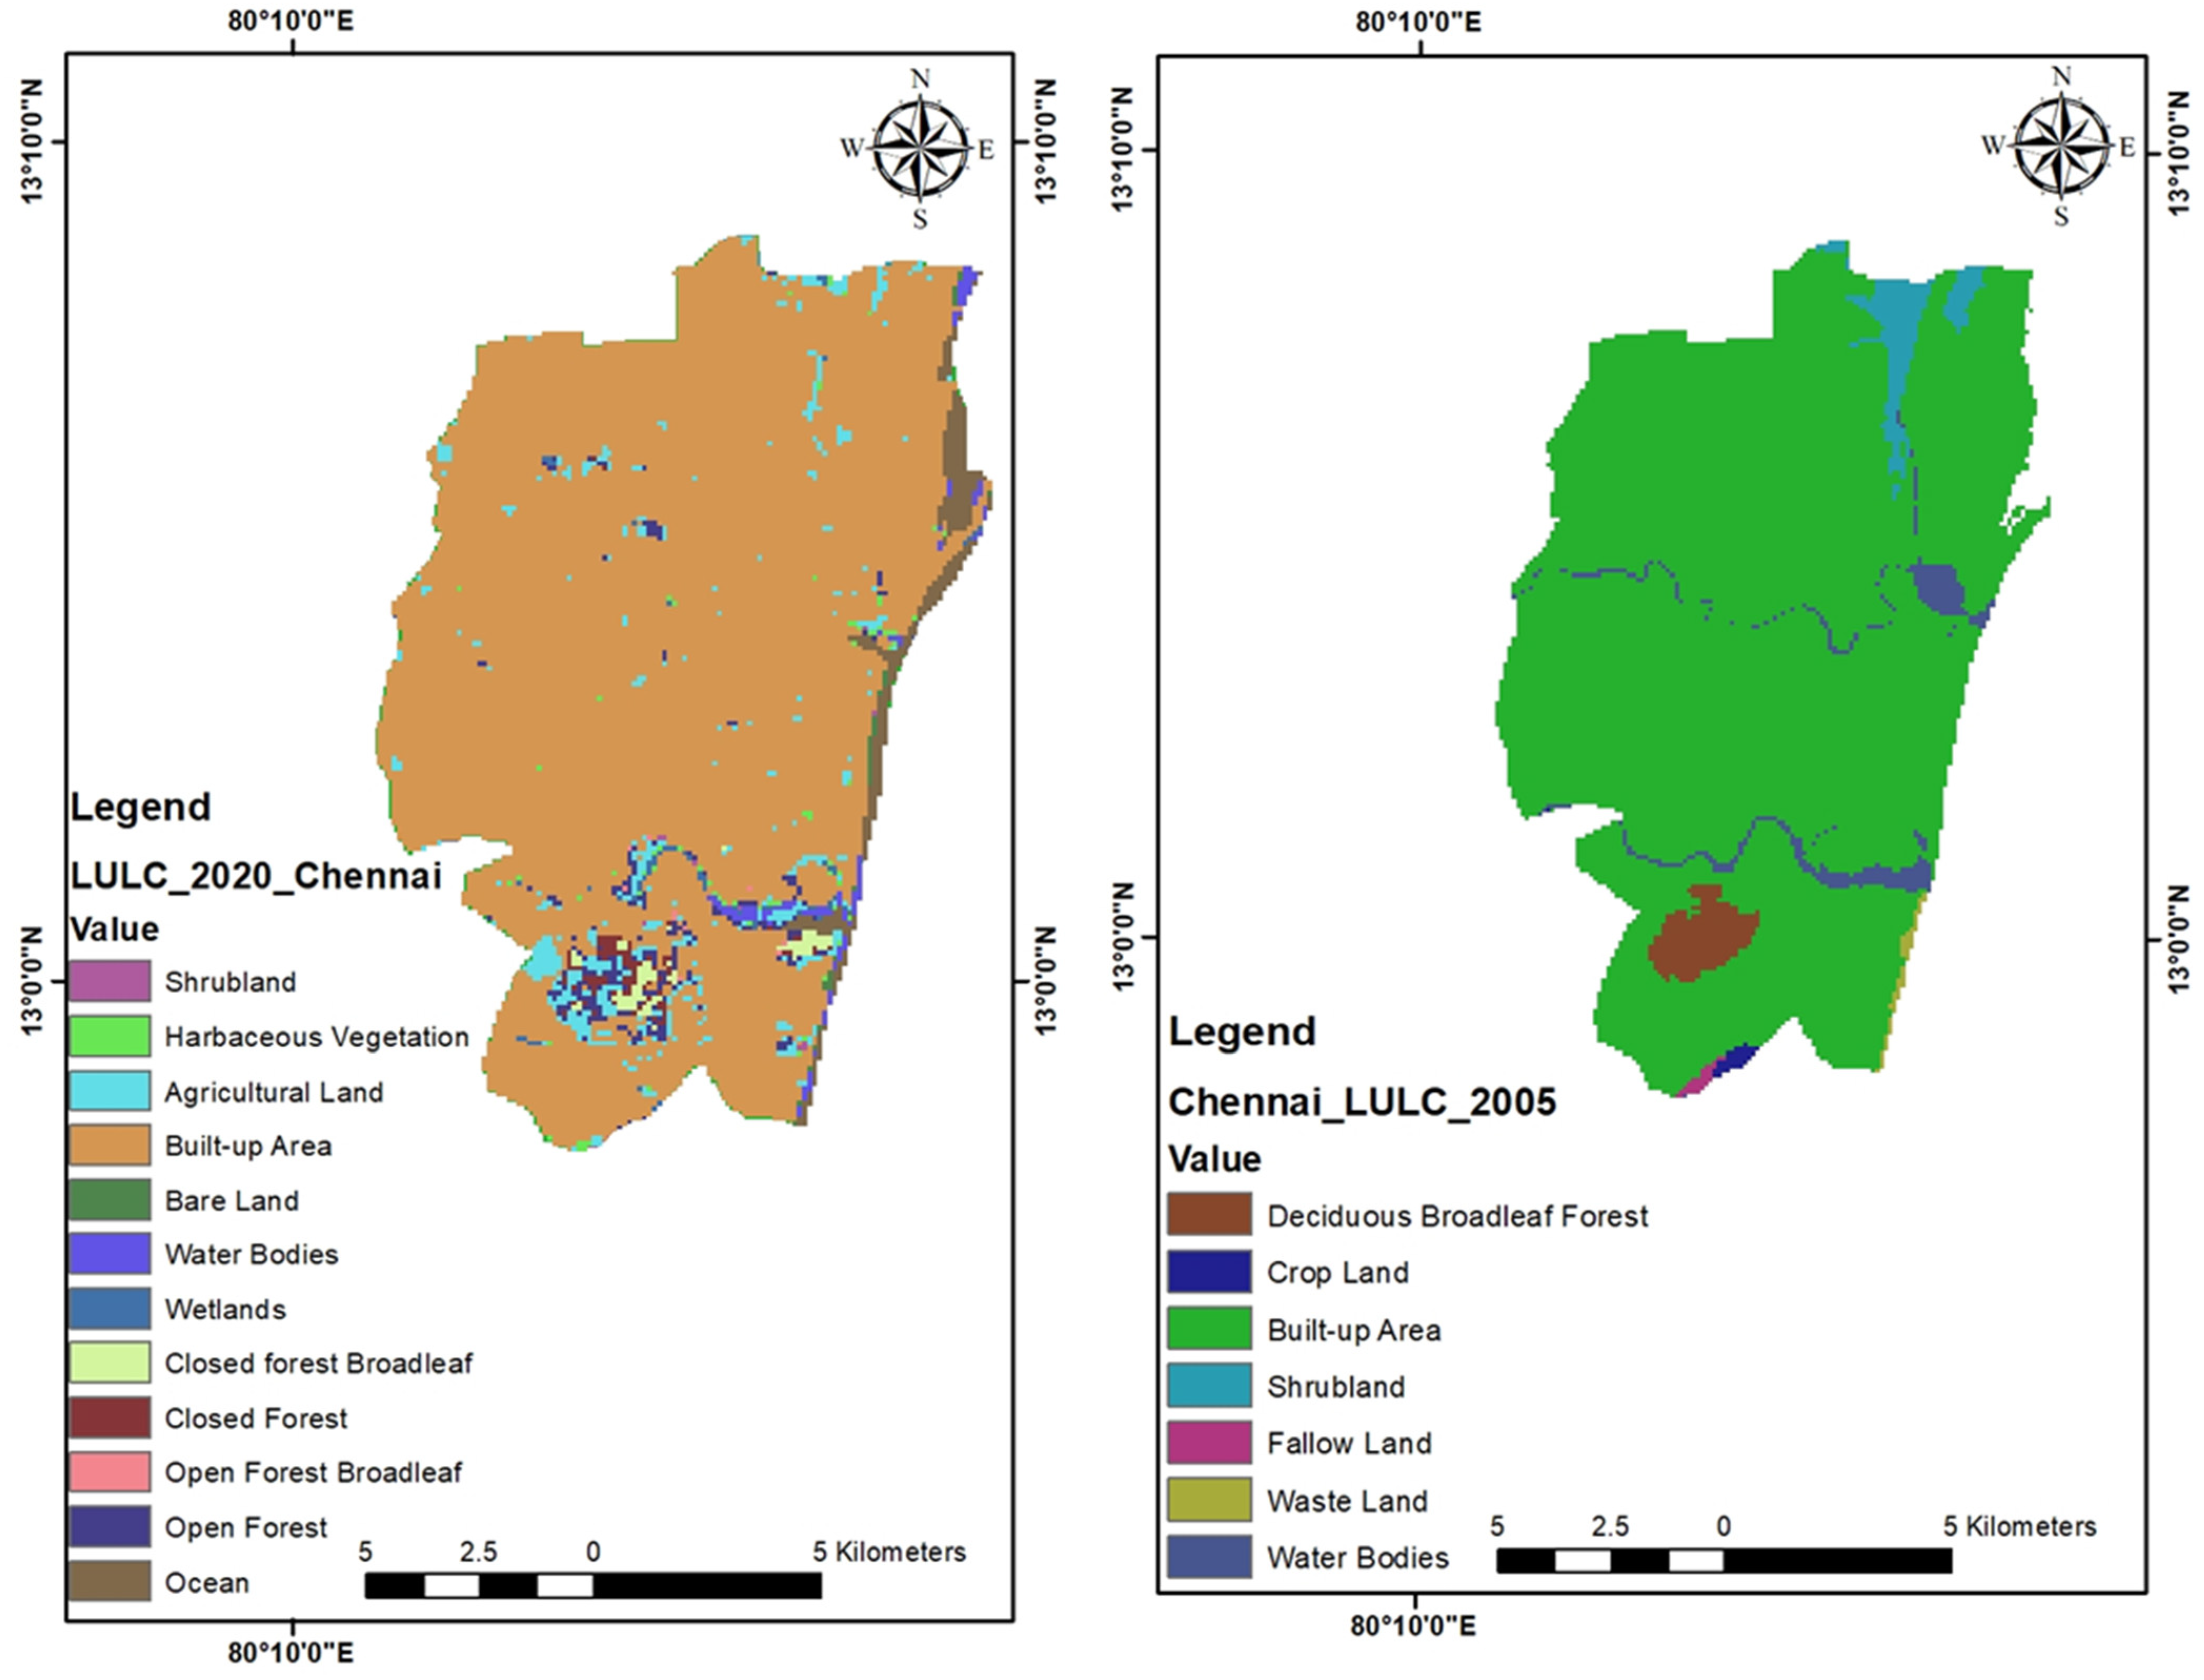
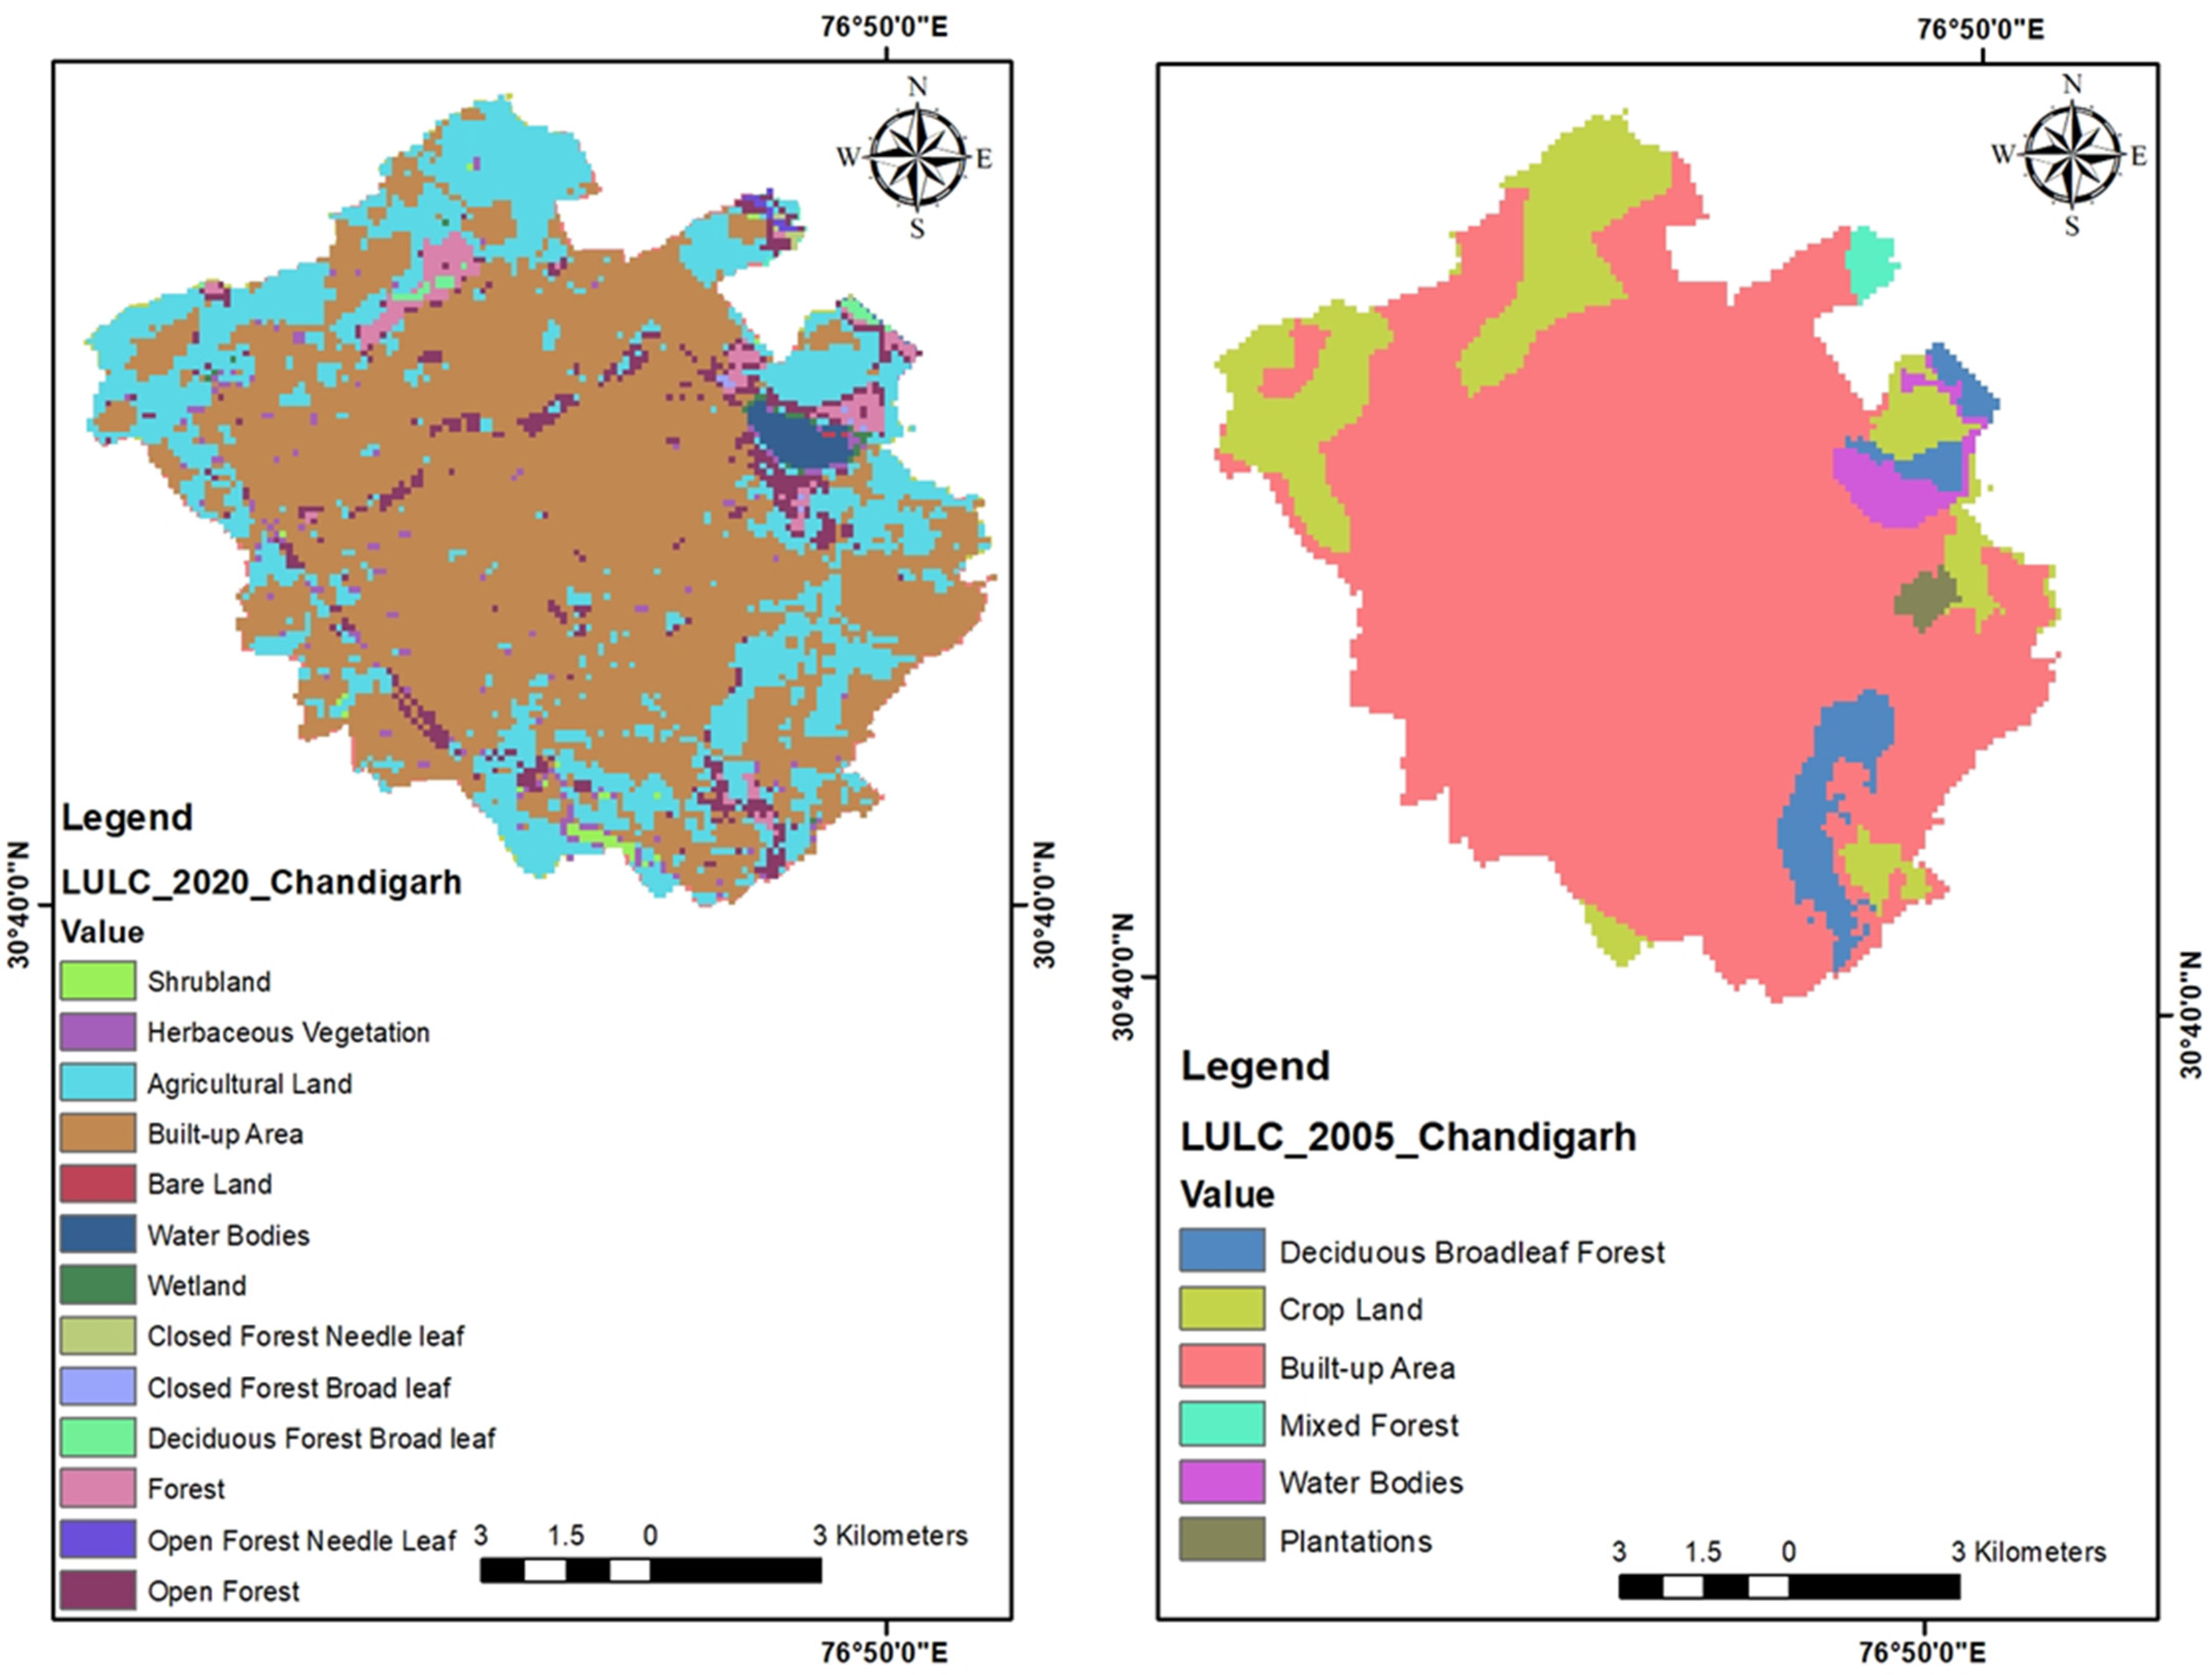
The permeable area was calculated by combining the areas of agricultural land and vegetation and removing the areas of road pavement and barren lands. Figure 8, Figure 9, Figure 10, Figure 11, Figure 12 and Figure 13 depict the research areas’ LULC maps.
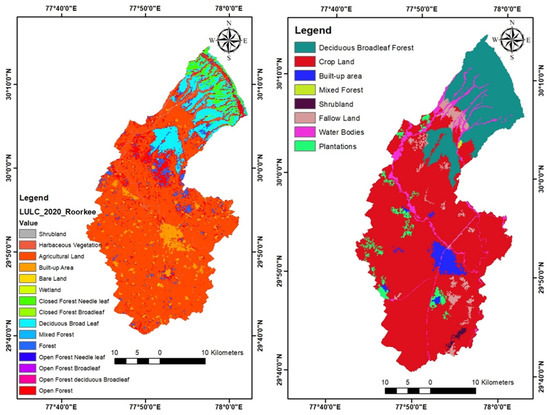
Figure 8.
LULC map of Roorkee.
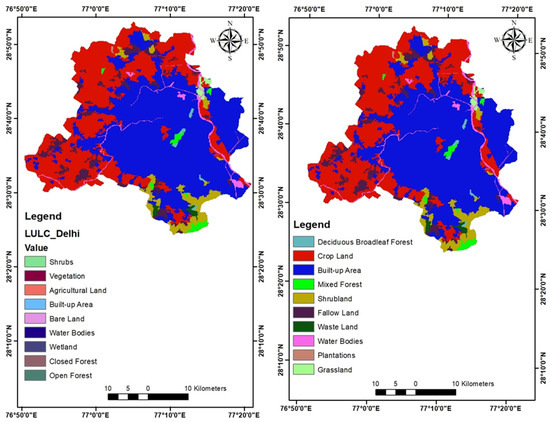
Figure 9.
LULC map of Delhi.

Figure 10.
LULC map of Mumbai.
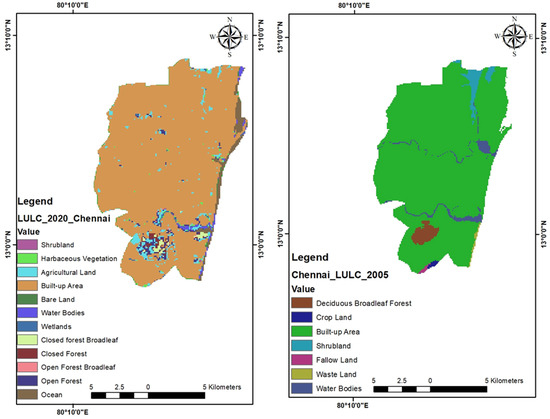
Figure 11.
LULC map of Chennai.
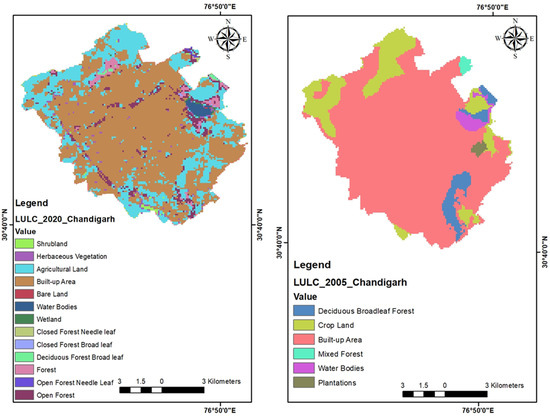
Figure 12.
LULC map of Chandigarh.
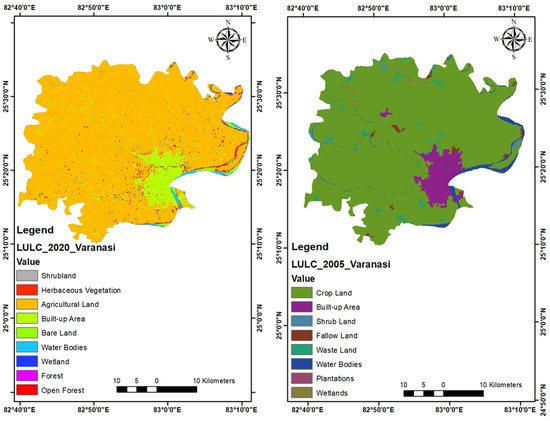
Figure 13.
LULC map of Varanasi.
2.5.4. Water Body Rejuvenation Index
The Water Body Rejuvenation Index is a metric used to assess the need for water body restoration. It was calculated by comparing the total area of water bodies at a historical datum date and the present date, identifying areas that have been encroached upon, and then determining the planned area for rejuvenation efforts.
2.5.5. Water Logging Index
Using rainfall data from the Indian Meteorological Department, the areas affected by waterlogging based on inundation for four hours or more with a water depth exceeding 6 inches were enumerated. Further, based on the earlier experiences in cities like Delhi, Mumbai, and Chennai, it was suggested in the report to reduce the duration threshold to one hour to enhance resilience. This adjustment was expected to facilitate taking proactive measures to address waterlogging promptly and build more disaster-resistant cities.
2.5.6. Area Vulnerability Index
The Area Vulnerability Index provided a comprehensive measure of the susceptibility of a city to flooding. The calculation process involved collecting elevation data, contour maps, and soil cover information for the study area. By utilizing these data sets, the depression storage for each area within the city was calculated using Equations (1) and (2). The volume of water in the depression storage (Vs) was estimated, with its magnitude commonly expressed as the average depth of water over the drainage basin in millimetres. The total flood-prone area was then obtained by summing the areas of all depressions within the city, representing the portion of the city susceptible to flooding. Finally, the Area Vulnerability Index was determined by dividing the total flood-prone area by the total city area on the datum date.
2.5.7. Water Body Vulnerability Index
A step-by-step approach was used to calculate the Water Body Vulnerability Index. Obtaining a map of the study area’s Land Use Land Cover (LULC) was the first step. This map allowed for the identification of the land cover class that corresponded to the water bodies. Using ArcGIS 10.1, the total area under the now encroached water bodies was determined by summing the areas of all pixels now classified as water bodies. Simultaneously, the total area under water bodies on the datum date was calculated by summing the areas of all pixels designated as water bodies on that specific day.
2.5.8. People Vulnerability Index
To calculate this index, sector-wise population data for specific cities were collected from several sources, including the Census of India. The process involved identifying and quantifying the number of individuals living in proximity to water bodies or streams that are susceptible to flooding during storm events. These data were then used to calculate the ratio of the number of people affected in these vulnerable areas (with or without proper drainage) to the total population residing in the areas, regardless of whether drainage infrastructure was in place or not.
2.5.9. Stormwater Discharge Quality Index
TSS and BOD data were obtained from recent research papers, while the prescribed limits were based on guidelines for surface water disposal of treated effluent (30 mg/L for TSS and 20 mg/L for BOD), in the absence of the guidelines for the urban surface runoff quality. The index provides an assessment of compliance with TSS/BOD standards, while considering that specific TSS limits may be quite stringent in view of the picking up of loose topsoil and scattered materials by the surface runoff. However, the index highlights areas that may require improved stormwater management and treatment processes in future.
2.5.10. Flood Moderation Index
To calculate this index, regions were first identified near water bodies that were highly susceptible to flooding due to the absence of moderation measures such as levees, reservoirs, or drainage systems. This assessment could be based on government reports specific to the city or region in question, which provided valuable insights into flood-prone areas. Thereafter, the areas were determined that were spared from flooding or experienced reduced flooding as a result of implemented moderation measures. By quantifying the ratio of the area not flooded, due to moderation efforts in the area, that would have been flooded without such measures, the Flood Moderation Index offers a clear picture of how effective flood prevention efforts have been.
2.5.11. Rainfall Intensity Index
To reinforce the connection between precipitation patterns employed in catchment hydrology analysis, Intensity–Duration–Frequency (IDF) curves were utilized. These curves were generated for various durations based on annual maximum rainfall data through frequency analysis. This study focused on constructing IDF curves for five return periods, i.e., 5, 10, 25, 50, and 100 years. To develop these curves, daily rainfall data from both past and future climate scenarios were collected. Hourly rainfall data were derived from the daily records using IMD’s empirical reduction formula [44,45,46,47,48].
The amount of rainfall that resulted in flooding in the stormwater drainage system was calculated using the continuity equation and the rational technique. Table 2a–f show the rainfall intensity (mm/h) for different storm return periods from the historical data for Roorkee, Delhi, Mumbai, Chennai, Chandigarh, and Varanasi, respectively.
Table 2.
(a) Rainfall intensity–duration–frequency analysis for Roorkee. (b) Rainfall intensity–duration–frequency analysis for Delhi. (c) Rainfall intensity–duration–frequency analysis for Mumbai. (d) Rainfall intensity–duration–frequency analysis for Chennai. (e) Rainfall intensity–duration–frequency analysis for Chandigarh. (f) Rainfall intensity–duration–frequency analysis for Varanasi.
2.6. Analytical Hierarchy Process (AHP): Concept and Role in the Study for Estimation of Weight Coefficients
The Analytic Hierarchy Process (AHP) has been proven as one of the most popular techniques for multi-criteria decision making throughout the globe. Numerous research studies have looked at the potential uses of this technique in pro-ecology engineering technology and sustainable environmental management. For instance, Kordana and Saty [49,50] helped investors choose the best stormwater management solution for their money. Giner-Santonja [51] looked at air pollution emissions, while Ghimire and Wang [52,53] discussed the usage of alternative energy sources. Studies on urban river systems [54], surface water quality assessment [55], and sewage treatment facilities [56] have all used the AHP approach. While the AHP method possesses certain limitations, primarily stemming from the utilization of a subjective rating scale and the requirement for numerous pairwise comparisons, it is distinguished by its notable flexibility and an intuitive approach to evaluating specific elements within the decision model [57].
The general evaluation matrix diagram and the matrix expressed with weight coefficients [58] are depicted in Equation (3).
After assembling the decision matrix, A, where aij represents the comparisons between elements i and j for all i, j ∈ {1, 2, …, n}, the subsequent step involves calculating the weights for each dimension, criterion, and index. Subsequently, it is necessary to verify the consistency of the obtained results.
The consistency index (CI), determined using Equation (5), may be used to compute the random index (RI), which is derived from the average of the consistency index (CI) that is produced and is dependent on the order of the matrix provided by Saaty [58].
The principal eigenvalue λmax represents the maximum eigenvalue, while n represents the number of rows or columns in the square judgment matrix. If the consistency ratio (CR) is less than or equal to 0.1, the matrix is regarded as adequately consistent. However, if the CR exceeds 0.1, it suggests that the assessments may necessitate revisions to minimize inconsistencies.
2.7. Process of Aggregation of Indices
To calculate the aggregate overall system sustainability index, a weighted linear sum of the eleven individual indices was used, which is expressed mathematically as follows [59]:
3. Results and Discussions
The results and discussion are presented in the two following sections, highlighting interpretation of enumerated indices in the standalone mode and in the aggregated mode, respectively.
3.1. Sustainability Indices in a Standalone Mode
Table 3 presents the results of all the individual stormwater drainage indices calculated in a standalone mode for Tier I (Delhi, Mumbai, Chennai) and Tier II (Chandigarh, Varanasi, Roorkee) cities. The enumerated values need to be verified against the indicated ranges of ideal condition and minimum desirable values for various indices. These provide valuable insights into the state of stormwater management and urban resilience in these cities. The differences in various index values reflect the varying attributes of urban growth and its impacts, hydrometeorological influences, and preparedness of the cities for stormwater management.
Table 3.
Calculated sustainability indices for study sites.
Among the Tier I cities, namely Delhi, Mumbai, and Chennai, the findings are quite concerning, as none of the values of the indices fall within the permissible range. These cities face significant challenges, primarily in terms of natural drainage, permeability, water logging, flood moderation, and rainfall intensity. The poor stormwater discharge quality further compounds the issue, highlighting the urgency of addressing pollution and stormwater treatment concerns. The ground level reports about the challenges faced on a regular basis by the population living in these cities corroborate these findings. Although this indicates a pressing need for substantial improvements in stormwater drainage systems and sustainable urban planning practices, a silver lining is that appropriate and timely preventive measures taken even on a smaller scale may quickly improve the status of NDSI, DCI, PI and WBVI indices, considering their smaller deviation from the minimum desirable condition.
On the other hand, the Tier II cities of Chandigarh, Varanasi, and Roorkee exhibit better results with respect to better compliance according to several indices. Chandigarh stands out as a city with notably better performance across most indices, except for stormwater discharge quality. Its commendable values in natural drainage, permeability, water logging, flood moderation, and rainfall intensity indicate a proactive approach to stormwater management. This is expected, as Chandigarh has historically been proclaimed as one of the most well-planned cities in India, and the efforts of the local government are well synchronised with its historical status. Varanasi, on the other hand, excels primarily in the Natural Drainage System Index, indicating the presence of effective natural drainage features, and is also quite close to attaining the minimum desirable values for the DCI, PI, and FMI. Roorkee also demonstrates strong performance in key indices like natural drainage, permeability, water logging, flood moderation, and rainfall intensity, showcasing a promising foundation for sustainable stormwater management. It is also quite close to attaining the minimum desirable values for the WBRI and WLI.
In all fairness, it can still be stated that except for Chandigarh, the main factor showcasing the difference in the enumerated indices between the Tier I and II cities is the pace of growth overriding and disturbing earlier developmental parameters, outstripping the apparent carrying capacity, and also occasionally pushing the system beyond sustainable management or restoration. Notably, however, one consistent observation across all cities is that the Drainage Coverage Index values are generally close to the minimum required limit, suggesting that the drainage coverage itself is still manageable. However, this positive aspect is overshadowed by various other indices, including poor stormwater discharge quality, which exceeds the desired limit in all cities. This truly highlights the critical need for initiating stormwater treatment and strengthening pollution control measures in urban areas, which are greatly lacking at present.
3.2. Aggregated Overall System Sustainability Index
The weightage values assigned to various stormwater drainage indices were determined based on specific the input parameters for different cities. These parameters included elevation, slope, precipitation, land use/land cover, stream and drainage density, NDVI, TSS, and BOD values, which were carefully selected for their relevance to stormwater management. Through pairwise comparisons and mathematical computations, the Analytic Hierarchy Process (AHP) method provided a structured approach to allocate weightages to the indices, which is discussed in Section 2.5. Table 4 presents the weightage values assigned to various stormwater drainage indices for all the cities. To assess the consistency of the results, the Consistency Ratio (CR) was evaluated. A CR value less than or equal to 0.1 indicates an adequately consistent matrix, while a CR exceeding 0.1 suggests a need for revision to minimize inconsistencies. It was ensured that the weightage values in each city matrix were only finalised after attainment of the desired CR (less than or equal to 0.1).
Table 4.
Priority ranking for technology selection based on criteria for Indian towns (Tier I and Tier II cities).
As observed in the above table, the weightage values varied between the cities, reflecting their unique characteristics and challenges. The obtained weightages also highlighted the relative importance of each index in the stormwater management context. Analysing the weightage values, it is evident that Chandigarh has a lower weightage value (5%) for the Water Logging Index, indicating that the city does not face significant issues related to water-logged areas. Consequently, more weightage is given to other indices for Chandigarh. On the other hand, Delhi, Mumbai, Chennai, Varanasi, and Roorkee have relatively higher weightage values for the Water Logging Index, implying that these cities experience significant and frequent challenges related to water logging and urban flooding and accordingly are accorded higher priority. This highlights the need for improvement in natural drainage rejuvenation, retrofitting of stormwater drainage systems, and the creation of more pervious surfaces to enhance stormwater management in these cities.
Similarly, for the Area Vulnerability Index, Chandigarh has a low weightage value (1%), suggesting that there are no significant vulnerable areas or high population densities near natural and stormwater drainage catchments in the city. However, Delhi, Mumbai, Chennai, and Varanasi have relatively higher weightage values, indicating the presence of vulnerable areas and a need for improvement in mitigating risks associated with urban development near such areas.
Table 5 displays the enumerated overall system sustainability index values for the cities studied. The index values, derived through arithmetic progression using sustainability indicators and AHP weights, ranged from 0 to 1, representing both extremes and the relative placement of various cities on the sustainability scale. It may be observed that among all the Tier I and II cities, Chandigarh displays the most sustainable drainage system (0.761), whereas all other cities in the Tier II category—Varanasi (0.491), Roorkee (0.483) in Tier I category and Mumbai (0.540), Delhi (0.534) and Chennai (0.516)—display quite low values, around the halfway mark in the sustainability index range. The results undoubtedly establish Chandigarh as the most accomplished city in this regard as per both the enumeration modes; it is clearly ahead of other cities in most respects. Regarding the other cities, it should, however, be noted that direct comparison between both the modes may not be practically attainable. This may be due to the fact that the weight coefficients estimated through the AHP process are unique for every city, giving due regard to its specific attributes (and not just based on a uniform format); the interplay with the city-specific data could influence the final outcome. Nevertheless, even amidst this numerical diversity, these findings clearly highlight an unsatisfactory condition for all of the cities except one with respect to sustainability, with their index values hovering around the middle of the range (0.5). This clearly shows a critical need in all these cities for improving or retrofitting the existing stormwater drainage system, rejuvenating the natural drainage systems, enhancing drainage coverage and permeable surfaces, revitalizing water bodies, rationally mitigating water-logging and urban flooding issues (as per the ground realities), reducing area and water body vulnerability, and ensuring better stormwater discharge quality. Even for Chandigarh, which displays an overall good condition, further improvement in its sustainability ranking is still strongly advisable, with sustained and even more determined efforts by the local government. Needless to say, a judicious approach for prioritisation of management actions needs to be adopted to achieve fruitful results in all cases.
Table 5.
Aggregated overall sustainability indicators.
4. Conclusions
In conclusion, our research focussed on a meticulous evaluation of urban stormwater management sustainability in a thoughtfully chosen group of Indian cities, falling in two categories, Tiers I and II. Tier I cities (Delhi, Mumbai, Chennai), and Tier II cities (Varanasi, Chandigarh, Roorkee) were selected based on their economic significance, climatic diversity, and different scales of development. Our approach involved a systematic enumeration of eleven out of twenty key sustainability indices aligning with the government of India’s sustainable habitat parameters. The enumeration was done in two modes, standalone (individual indices) and aggregated (composite or overall values). The enumeration for the standalone mode represented a span of a decade from 2010 as the baseline year to 2020 as the test year, and the calculated values for each city were compared with the prescribed ideal and minimum permissible values for each index. Further, the “overall sustainability index” reflected the aggregated values, incorporating the relative importance of each index in a unique manner for each city to reflect its diverse urban context, determined through the Analytical Hierarchy Process (AHP). The values thus calculated for all the cities were compared within the complete range of sustainability, between 0 (worst) and 1 (best).
Furthermore, the decade-long data span underscored the dynamic nature of urban development, duly reflecting the shifts and changes in stormwater management status and strategies. This highlighted the pressing need for a variety of adaptive solutions. This study was the first one, to the best of our knowledge that successfully attempted to apply the government-identified sustainability parameters on a field scale in a novel manner, yielding quite interesting and valuable results.
Looking ahead, the implications of our research are substantial. It promises to serve as a valuable resource for taking appropriate field-worthy actions, undertaking policy refinement, developing climate-adaptive strategies, and promoting knowledge sharing within India and beyond. As we address the imperative requirement for sustainable stormwater management in rapidly urbanizing regions, our study makes a significant contribution to the realization of more resilient, environmentally responsible, and liveable urban environments. We are optimistic that these research findings will not only inspire further investigation but also foster collaboration and innovative solutions in the field of urban sustainability and drainage systems.
Some of the main findings are further summarised in the following points:
- (a)
- The key indices proposed by the Government of India’s sub-committee for the development of “National sustainable habitat parameters on urban stormwater management” were observed to be quite valuable in the assessment of sustainability of the stormwater drainage systems.
- (b)
- For the indices enumerated in a standalone mode, among the Tier I cities, none of the values of the indices fell within the permissible range, although some values were close to the minimum admissible values. These cities apparently face significant challenges primarily in terms of natural drainage, permeability, water logging, flood moderation, and rainfall intensity. On the other hand, the Tier II cities exhibited marginally better results, displayed by better compliance in several indices. Chandigarh stood out as a city with notably better performance across most indices.
- (c)
- The enumeration results of an overall sustainability index showed that among all the Tier I and II cities, Chandigarh again displayed the most sustainable drainage system (0.761), whereas all other cities, namely Varanasi (0.491) and Roorkee (0.483) in the Tier I category and Mumbai (0.540), Delhi (0.534), and Chennai (0.516) in the Tier II category, displayed quite low values, around the halfway mark in the sustainability index range.
- (d)
- The results undoubtedly established Chandigarh as the most accomplished city in this regard as per both enumeration modes, superior to other cities in most respects. Regarding the other cities, it should be noted that direct comparison between the two modes may not be practically attainable. This may be due to the fact that the weight coefficients estimated through the AHP process are unique for every city, giving due regard to its specific attributes, whose interplay with the city-specific data could influence the final outcome.
- (e)
- Poor stormwater discharge quality exceeded the desired limit in all cities. This truly highlighted the critical need for initiating stormwater treatment (unlike sewage treatment, which is practiced already) and further strengthening pollution control measures for non-point sources in urban areas, which are greatly lacking at present.
- (f)
- The findings could be corroborated by the ground realities observed in these cities in general.
Author Contributions
Conceptualization, R.K.V. and H.J.; Methodology, R.K.V.; Software, R.K.V.; Validation, R.K.V.; Formal analysis, R.K.V.; Investigation, R.K.V.; Resources, R.K.V.; Data curation, R.K.V.; Writing—original draft, R.K.V.; Writing—review & editing, R.K.V., H.J. and A.G.; Supervision, H.J. and A.G.; Funding acquisition, A.G. All authors have read and agreed to the published version of the manuscript.
Funding
This research received no external funding.
Institutional Review Board Statement
Not applicable.
Informed Consent Statement
Not applicable.
Data Availability Statement
Data is contained within the article.
Conflicts of Interest
The authors declare no conflict of interest.
References
- Ress, L.D.; Ling, C.; Hung, J.; James, L. A Impacts of urban drainage systems on stormwater hydrology: Rocky Branch Watershed, Columbia, South Carolina. J. Flood Risk Manag. 2020, 13, e12643. [Google Scholar] [CrossRef]
- Teshome, M.; Devi, A.R. A Review of Recent Studies on Urban Stormwater Drainage System for Urban Flood Management. Preprints 2020, 2020100295. [Google Scholar] [CrossRef]
- Sharma, D. Sustainable Drainage System (SuDS) for Stormwater Management: A Technological and Policy Intervention to Combat Diffuse Pollution. In Proceedings of the 11th International Conference on Urban Drainage, Edinburgh, Scotland, UK, 31 August–5 September 2008. [Google Scholar]
- Benzerra, A.; Cherrared, M.; Bernard, C.; Frederic, C.; Zekiouk, T. Decision support for sustainable urban drainage system management: A case study of Jijel, Algeria. J. Environ. Manag. 2012, 101, 46–53. [Google Scholar] [CrossRef] [PubMed]
- Andimuthu, R.; Kandasamy, P.; Mudgal, B.V.; Jeganathan, A.; Balu, A.; Sankar, G. Performance of urban storm drainage network under changing climate scenarios: Flood mitigation in Indian coastal city. Sci. Rep. 2019, 9, 7783. [Google Scholar] [CrossRef]
- UNDESA. U.N. World Urbanization Prospects: The 2014 Revision-Highlights; United Nations: New York, NY, USA, 2014. [Google Scholar] [CrossRef]
- Emama, W.; Edae, H.; Abdisa, T.; Hirko, D. Performance Assessment of Storm Water Drainage System by Stormwater Management Model. Preprints 2022. [Google Scholar] [CrossRef]
- UNDESA. World Urbanization Prospects: The 2011 Revision; United Nations, Department of Economic and Social Affairs (DESA), Population Division, Population Estimates and Projections Section: New York, NY, USA, 2012. [Google Scholar] [CrossRef]
- Masaki, Y.; Hanasaki, N.; Takahashi, K.; Hijioka, Y. Global-scale analysis on future changes in flow regimes using Gini and Lorenz asymmetry coefficients. Water Resour. Res. 2014, 50, 4054–4078. [Google Scholar] [CrossRef]
- Kourtis, I.M.; Tsihrintzis, V.A. Adaptation of urban drainage networks to climate change: A review. Sci. Total Environ. 2021, 771, 145431. [Google Scholar] [CrossRef]
- Lashford, C. Sustainable Drainage Management Train: A Sustainable Flood Management Strategy; Coventry University: Coventry, UK, 2012. [Google Scholar]
- Gimenez-Maranges, M.; Breuste, J.; Hof, A. Sustainable Drainage Systems for transitioning to sustainable urban flood management in the European Union: A review. J. Clean. Prod. 2020, 255, 120191. [Google Scholar] [CrossRef]
- Zahmatkesh, Z.; Karamouz, M.; Goharian, E.; Burian, S.J. Analysis of the Effects of Climate Change on Urban Stormwater Runoff Using Statistically Downscaled Precipitation Data a Change Factor Approach. J. Hydrol. Eng. 2018, 20, 05014022. [Google Scholar] [CrossRef]
- Peterson, E.W.; Wicks, C.M. Assessing the importance of conduit geometry and physical parameters in karst systems using the stormwater management model (SWMM). J. Hydrol. 2006, 329, 294–305. [Google Scholar] [CrossRef]
- Cuppens, A.; Smets, I.; Wyseure, G. Identifying sustainable rehabilitation strategies for urban waste water system: A retrospective and interdisciplinary approach. Case study of Coronel Oviedo, Paraguay. J. Environ. Manag. 2013, 114, 423–432. [Google Scholar] [CrossRef] [PubMed]
- Murty, R.K.; Gupta, H.R.; Dikshit, S.K. An overview of sustainability assessment methodologies. Ecol. Indices 2012, 15, 281–299. [Google Scholar] [CrossRef]
- Phil Jones, P.; Macdonald, N. Making space for unruly water: Sustainable drainage systems and the disciplining of surface runoff. Geoforum 2007, 38, 534–544. [Google Scholar] [CrossRef]
- Swathi, V.; Srinivasa Raju, K.; Singh, A. Application of Stormwater Management Model to an Urban Catchment. Hydrol. Model. 2018, 81, 175–184. [Google Scholar]
- Sirishantha, U.; Rathnayake, U. Sustainable urban drainage systems (SUDS)—What it is and where do we stand today? Eng. Appl. Sci. Res. 2017, 44, 235–241. [Google Scholar]
- de Almeida, G.A.M.; Bates, P.; Ozdemir, H. Modelling urban floods at submetre resolution: Challenges or opportunities for flood risk management? J. Flood Risk Manag. 2018, 11, S855–S865. [Google Scholar] [CrossRef]
- Droogers, P.; Soet, M.; van Schaik, H.; Witmer, M. Integrating Climate Change Adaptation into Development Co-operation for the Water Sector Table of Contents. Future Water 2010, 1–31. [Google Scholar]
- Census of India. 2011. Available online: http://censusindia.gov.in/2011census/hlo/hlo_highlights.html?drpQuick=anddrpQuickSelect=andq=Census+Drainage+facilities+in+households (accessed on 13 July 2023).
- Roy, C.; Sati, V.P.; Biswas, A.; Kumar, S. Status of drinking water, sanitation facilities, and hygiene in West Bengal: Evidence from the National Family Health Survey of India (NFHS), 2019–2021. J. Water Sanit. Hyg. Dev. 2023, 13, 51. [Google Scholar] [CrossRef]
- Kyi, P.M.; Zin, W.W.; Kyi, C.C.T.; Maung, T. Study on Storm Water Drainage System of Kyeemyindaing Township; Department of Civil Engineering, Yangon Technological University: Yangon, Myanmar, 2017. [Google Scholar]
- Singh, O.; Kumar, M. Flood occurrences, damages, and management challenges in India: A geographical perspective. Arab. J. Geosci. 2017, 10, 102. [Google Scholar] [CrossRef]
- Sala, S.; Ciuffo, B.; Nijkamp, P. A systemic framework for sustainability assessment. Ecol. Econ. 2015, 119, 314–325. [Google Scholar] [CrossRef]
- CPHEEO. National Mission on Sustainable Habitat: Adaptation and Mitigation Measures In the Field of Water Supply & Sanitation. 2014. Available online: https://smartnet.niua.org/content/91c0bcdf-4ce8-41ac-9a11-34e72f6b74ae (accessed on 13 July 2023).
- Report of Sub-Committee for Development of ‘National Sustainable Habitat Parameters on Urban Stormwater Management’. 2010. Available online: https://www.mohua.gov.in/upload/uploadfiles/files/uswm.pdf (accessed on 13 July 2023).
- Das, R.K. Sustainable Urban Drainage Systems (SUDS)—Is It the Answer to the Problem of Urban Flash Floods in New Delhi, India. 2012. Available online: https://www.researchgate.net/publication/228327252_Sustainable_Urban_Drainage_Systems_-_A_possible_solution_to_the_problems_of_Flash_Floods_in_New_Delhi_India (accessed on 13 July 2023).
- Delhi Development Authority. Master Plan for Delhi, 2021; Development Authority, Government of National Capital Territory of Delhi, Government of India: New Delhi, India, 2005.
- Pareva, M. Urban flooding and its management. In Proceedings of the First Disaster Management Congress, New Delhi, India, 29–30 November 2006. [Google Scholar]
- Gupta, K. Urban flood resilience planning and management and lessons for the future: A case study of Mumbai, India. Urban Water J. 2007, 4, 183–194. [Google Scholar] [CrossRef]
- Sansare, D.A.; Mhaske, S.Y. Storm water Management of Mumbai city by using Pervious Concrete on GIS based platform. Int. J. Recent Technol. Eng. (IJRTE) 2019, 8, 4400–4406. [Google Scholar] [CrossRef]
- Singh, N.K.; Nathawat, M.S. Quantifying the characteristics and types of urban growth of Varanasi city using multi-temporal remotely sensed data and geospatial techniques. Transactions 2023, 45, 27–40. [Google Scholar]
- Prudhvi Raju, K.N.; Pandey, M.K.; Sarkar, S. A note on boundaries in atlas maps. J. Geol. Soc. India 2014, 83, 563–566. [Google Scholar] [CrossRef]
- Mishra, M.; Dugesar, V.; Prudhvi Raju, K.N. Flood Risk and Impact Analysis of Varanasi City Region, India. J. Sci. Res. 2022, 66, 22–32. [Google Scholar] [CrossRef]
- Yusoff, Y.M. Kinematic Wave Modeling of a Semi-Urban Watershed. Master’s Dissertation, Department of Hydrology, IIT Roorkee, Roorkee, India, 1991. [Google Scholar]
- Singhal, D.C.; Roy, T.N.; Joshi, H.; Seth, A.K. Imapact os sewage irrigation on groundwater quality of Roorkee town, Uttaranchal. Hydrol. J. 2001, 24, 1–15. [Google Scholar]
- Arya, D.S.; Joshi, H.; Abbasi, S.A. Developmental trends and their environmental impact in a typical central Indian town with special reference to Roorkee. Environ. Monit. Assess. 1994, 33, 135–150. [Google Scholar] [CrossRef] [PubMed]
- Jarvis, A.; Reuter, H.I.; Nelson, A.; Guevara, E. Hole-Filled Seamless SRTM Data V4. International Centre for Tropical Agriculture (CIAT). 2008. Available online: http://srtm.csi.cgiar.org (accessed on 13 July 2023).
- ASCE; WEF. Design and Construction of Urban Storm Water Management Systems, American Society of Civil Engineers Manuals and Reports of Engineering Practice no. 77 and Water Environment Federation Manual of Practice FD-20. 1992. Available online: https://www.google.com.hk/url?sa=t&rct=j&q=&esrc=s&source=web&cd=&cad=rja&uact=8&ved=2ahUKEwj1l6HgyfmBAxXehlYBHaEdDVEQFnoECAkQAQ&url=https%3A%2F%2Fascelibrary.org%2Fdoi%2Fpdf%2F10.1061%2F9780872628557.fm&usg=AOvVaw2n1pmC7noMkrUNcRadubSC&opi=89978449 (accessed on 13 July 2023).
- Linsley, R.K., Jr.; Kohler, M.A.; Paulhus, J.L.H. Hydrology for Engineers, 3rd ed.; Chapters 3 and 4; McGraw-Hill: New York, NY, USA, 1982. [Google Scholar]
- Pazwah, H. Urban Stormwater Management; Taylor and Francis Group: Abingdon, UK, 2011; ISBN 978-1-4398-1035-4. [Google Scholar]
- Ramachandran, A.; Palanivelu, K.; Mudgal, B.V.; Jeganathan, A.; Guganesh, S.; Abinaya, B.; Elangovan, A. Climate change impact on fluvial flooding in the Indian sub-basin: A case study on the Adyar sub-basin. PLoS ONE 2019, 14, e0216461. [Google Scholar] [CrossRef] [PubMed]
- Kellagher, R. Preliminary Rainfall Runoff Management for Developments. R&D Technical Report, 2012. W5-074/A/TR/1, Revision E. 2012. Available online: https://eprints.hrwallingford.com/549/ (accessed on 13 July 2023).
- Luo, P.; Apip, H.B.; Duan, W.; Takara, K.; Nover, D. Impact assessment of 21 rainfall scenarios and land use change on hydrologic response using synthetic Area IDF 22 curves. J. Flood Risk Manag. 2015, 11, S84–S97. [Google Scholar] [CrossRef]
- De Paola, F.; Giugni, M.; Topa, M.E.; Bucchignani, E. Intensity-Duration-Frequency (IDF) rainfall curves, for data series and climate projection in African cities. SpringerPlus 2014, 3, 133. [Google Scholar] [CrossRef]
- Josephine, V.; Mudgal, B.V.; Thampi, S. Applicability of Doppler weather radar based rainfall data for runoff estimation in Indian watersheds—A case study of Chennai basin. Sadhana 2014, 39, 989–997. [Google Scholar] [CrossRef]
- Kordana, S.; Slys, D. Decision Criteria for the Development of Stormwater Management Systems in Poland. Resources 2020, 9, 20. [Google Scholar] [CrossRef]
- Saaty, T. The Analytic Hierarchy Process, 1st ed.; McGraw-Hill: New York, NY, USA, 1980. [Google Scholar]
- Giner-Santonja, G.; Calvo, V.V.; Lepe, G.R. Application of AHP and corrective factors for the determination of best available techniques and emission limit values at installation level: A case study in four cement installations. Sci. Total Environ. 2019, 660, 834–840. [Google Scholar] [CrossRef] [PubMed]
- Ghimire, L.P.; Kim, Y. An analysis on barriers to renewable energy development in the context of Nepal using AHP. Renew. Energy 2018, 129, 446–456. [Google Scholar] [CrossRef]
- Wang, Y.; Xu, L.; Solangi, Y.A. Strategic renewable energy resources selection for Pakistan: Based on SWOT-Fuzzy AHP approach. Sustain. Cities Soc. 2020, 52, 101861. [Google Scholar] [CrossRef]
- Lu, Y.; Xu, H.; Wang, Y.; Yang, Y. Evaluation of water environmental carrying capacity of city in Huaihe River Basin based on the AHP method: A case in Huai’an City. Water Resour. Ind. 2017, 18, 71–77. [Google Scholar] [CrossRef]
- Liu, Y.; Wang, C.; Chun, Y.; Yang, L.; Chen, W.; Ding, J. A Novel Method in Surface Water Quality Assessment Based on Improved Variable Fuzzy Set Pair Analysis. Int. J. Environ. Res. Public Health 2019, 16, 4314. [Google Scholar] [CrossRef]
- Mannina, G.; Rebouças, T.F.; Cosenza, A.; Sànchez-Marrè, M.; Gibert, K. Decision support systems (DSS) for wastewater treatment plants—A review of the state of the art. Bioresour. Technol. 2019, 290, 121814. [Google Scholar] [CrossRef]
- Leal, J.E. AHP-express: A simplified version of the analytical hierarchy process method. MethodsX 2019, 7, 100748. [Google Scholar] [CrossRef]
- Saaty, T. Decision making—The Analytic Hierarchy and Network Processes (AHP/ANP). J. Syst. Sci. Syst. Eng. 2004, 13, 1–35. [Google Scholar] [CrossRef]
- Ott, W. Environmental Indices: Theory and Practice; Ann Arbor Science Publishers: Ann Arbor, MI, USA, 1978. [Google Scholar]


Disclaimer/Publisher’s Note: The statements, opinions and data contained in all publications are solely those of the individual author(s) and contributor(s) and not of MDPI and/or the editor(s). MDPI and/or the editor(s) disclaim responsibility for any injury to people or property resulting from any ideas, methods, instructions or products referred to in the content. |
© 2023 by the authors. Licensee MDPI, Basel, Switzerland. This article is an open access article distributed under the terms and conditions of the Creative Commons Attribution (CC BY) license (https://creativecommons.org/licenses/by/4.0/).