Article

Socio-Economic Factors Affecting ESG Reporting Call for Globally Agreed Standards

by
Maria Krambia-Kapardis
1,
Christos S. Savva
2,* and
Ioanna Stylianou
3
1
Department of Management, Entrepreneurship and Digital Business, Cyprus University of Technology, Limassol 3036, Cyprus
2
Department of Finance, Accounting and Management Science, Cyprus University of Technology, Limassol 3036, Cyprus
3
School of Business and Management, University of Central Lancashire, Larnaka 7080, Cyprus
*
Author to whom correspondence should be addressed.
Sustainability 2023, 15(20), 14927; https://doi.org/10.3390/su152014927
Submission received: 16 July 2023 / Revised: 25 September 2023 / Accepted: 25 September 2023 / Published: 16 October 2023
(This article belongs to the Section Economic and Business Aspects of Sustainability)

Abstract

:
The ESG ecosystem has evolved over the years, and macro decisions have had an impact on the implementation and reporting of the ESG Index. This paper aims to first investigate if all the components of the ESG index are equally reported and secondly to identify the impact of socio-economic and political variables on the composite ESG index. To achieve this aim, the authors have utilized macroeconomic variables over the period 1984–2020 for 139 countries from the Refinitiv database and have constructed composite indices based on principal component analysis for the ESG components using a panel fixed effects model with structural breaks. The findings have significant policy implications, emphasizing the importance of globally accepted standards. Finally, by addressing the ESG at a macro level, it provides the context within which to consider the adoption of the ESG ecosystem diachronically, thus providing the backdrop for considering the implementation of the ESG at the micro level.

1. Introduction

Conventional financial reporting has been criticized [1] as backward as it does not provide enough information for investors and other stakeholders to make informed decisions on a company. Ref. [2] have argued that another reason for looking at alternative or compensating reporting in recent years has been the increasing number of lawsuits against companies. Thus, “in recent decades, corporate social responsibility has gained increasing attention from companies”, while “companies with strong Environment, Social and Governance (ESG) performance indicators are more likely to attract ecologically and socially conscious investors, especially younger investors” [3]. Hence, due to the interest by investors, regulators, and policymakers, companies are now willing to integrate social responsibility practices into their business. Given entities implement such practices, it follows that they should be publicly reported, so they can gain from benefits derived from reporting non-financial information. Ref. [4] argue, when companies report on their assessment of the three components of ESG, it enables investors to understand how the board has considered the risks of environment, social, and governance factors and how these have been integrated into the business strategy and major action-plan.
Ref. [5] explain that the ESG ecosystem (i.e., ESG index (ESG index rating tracks the performance of companies for environmental, social, and governance practices), ESG performance (ESG performance is the evaluation of a company’s environmental, social, and governance performance), and ESG reporting (ESG disclosure is a form of reporting by an organization’s management team about the companies’ performance on ESG issues)) has evolved over the years. ESG reporting originated “with civil society demands for company disclosure” (p. 449). In fact, between the years 1997–2011, five nonprofit organizations (Global Reporting Initiative, Climate Disclosure Standards Board, Carbon Disclosure Project, International Integrated Reporting Council, and Sustainability Accounting Standards Board) took the initiative to act as private standard setters for ESG reporting. Several initiatives such as the Paris Agreement on Climate in 2015, the recommendation made by the World Economic Forum in 2017 to companies to report on ESG and the initiatives by governments or regulatory bodies encouraged non-financial reporting disclosure and/or sustainability reporting. Thus, these initiatives navigated the development of the ESG reporting ecosystem. However, the lack of a homogeneous agreement amongst the standard setters, the polycentric approach by the private sectors in encouraging the development of ESG indices to fit their reporting preferences, and the uncertainty of stakeholders to convince investors of the materiality of individual components within ESG means that the ESG reporting ecosystem is still under construction.
Whilst in the past, researchers referred to the triple bottom accounting reporting, which incorporated social, environmental, and economic information [6], ESG reporting has become in recent years widely accepted by both researchers [7,8] and capital markets [9]. This is evident by the fact that companies are allocating significant portions of their expense budgets to ESG. More than USD 20 billion was spent on ESG by Fortune Global firms in 2018 [10], and in 2020, more than 90% of the S&P500 largest companies prepared ESG reports [11].
There has been an increasing trend in the last twenty years in investigating the drivers of ESG, as researchers need to understand the factors affecting this type of disclosure [12,13]. Previous studies have emphasized the link between firm, industry, size, country, and timely evolution factors [14,15,16], while others [17] have explained the link between institutional [18], legitimacy theory [19], stakeholder, and agency theory [12] and ESG disclosure. Ref. [20] have observed that the theoretical basis of ESG research focuses on institutional and stakeholder theories, while [21] have further explained that ESG controversies and media reach threaten organizational legitimacy as it attracts stakeholder concerns [22] increases borrowing costs [23] and adversely impacts profitability [24].
The objective of this paper is first to investigate the behaviour of all the ESG components and secondly to identify the effect of socio-economic factors on ESG. Thus, the authors have used macroeconomic variables over the period 1984–2020 for 139 countries from the Refinitiv database and constructed composite indices based on the principal component analysis for the environment, social, and governance to investigate firstly whether all the components of ESG are equally reported and secondly the effect of socio-economic factors on ESG index using a panel fixed effects model with structural breaks. In particular, the authors have first explored the global trend for the environmental, social, governance, and the overall ESG indices over the years. Second, the authors uncover the impact of political and economic institutions, such as corruption, civil disorder and war, economic and financial risk, ethnic and religious tensions, foreign pressures, law and order, and military in politics, on the ESG index. In addition, the authors have considered how macroeconomic factors such as GDP per capita, inflation, and trade openness affect the ESG index. Finally, the authors have explored if the presence of political and economic shocks (structural breaks) have changed the impact of political and economic institutions and macroeconomic variables on the ESG index. The results reveal that there is an increasing trend for the social, governance, and aggregate ESG indices, but not for the environment index where the trend is decreasing. Moreover, political and economic institutions, as well as macroeconomic factors, have an effect on the ESG performance.
The rest of the paper is organized as follows: the next section provides a literature review; Section 3 refers to the methodology and data used; Section 4 presents and discusses the empirical findings; and the paper concludes with a summary of the findings, policy implications, and concluding remarks.

2. Literature Review

It can be asserted that because of the volatile economic environment and the increasing interest of investors, consumers [25] employees, and governments due to socio-economic and environment issues, as well as the increasing legal action taken against a corporate entity or its shareholders, managers wish to focus on reputation-building, their fiduciary responsibilities, and their moral responsibilities [2]. Some studies [26,27] have shown a favorable assessment when entities disclose their ESG index. Some of the favorable assessments are: (a) a better credit rating [28], (b) an improvement in the firm’s value as well as business performance and an impact on the cost of capital [29], (c) improved risk management [30,31,32], and (d) lower cost of capital [26]. On the other hand, other studies [33] have advocated that ESG reporting is a window dressing practice undertaken by some entities to legitimize questionable business and turn the investors’ attention away from illegal activities [34]. This was proven recently by [35], who found that there is a negative relationship with the ESG disclosure and in particular the social pillar of ESG, suggesting that when companies in the financial sector experience “unfavorable performance, they may disclose more information about their social behavior, values and activities to mask their low performance and deviate shareholders’ concerns”. The same authors have also found that banks with lower profitability, but larger size, tend to have higher ESG disclosure, which is another factor supporting the window dressing theory. This can explain why some investors penalize companies that report on ESG by not investing in them, an argument recently confirmed by [2] and discussed further below.
ESG reporting enables the investors to identify which entities are “good corporate citizens” [36] and to integrate non-financial ESG factors into their investment decisions [37,38,39]. It has been found that ESG disclosure lowers the cost of capital and has a positive association with market performance, firm value, and quality of reported earnings [40,41]. ESG disclosure “can improve the firm’s communication with all inside and outside stakeholders and shareholders” [36] because it improves transparency, which enables more effective management monitoring and navigates stakeholders to develop their own informed decisions.
Ref. [12] argue, the implementation of ESG depends where in the world one refers to. For instance, in the EU, there is mandatory ESG disclosure requirement [42] which will apply progressively from 2024–2028 to four categories of companies: (a) large EU public interest entities, (b) large EU undertakings and EU parent undertakings of large groups, (c) EU small and medium-sized undertakings (“SMEs”) that are listed on EU regulated markets (and which are not micro-undertakings), and (d) non-EU parent company with: (i) an EU-established large subsidiary or a listed SME subsidiary or (ii) a large EU branch. The European Parliament through the CSRD creates new and comprehensive reporting obligations. More specifically, the EU Directive CSRD 2022/2462 which came into force in January 2023 creates an obligation to disclose information on “sustainability matters” that affect the company as well as the impact of the company on sustainability matters (i.e., the double-materiality principle). Companies will also have to include principal actual or potential adverse impacts in the company’s value chain and own operations, as well as the actions taken to prevent, mitigate, or remediate these adverse impacts. In addition, companies should also report both forward-looking and retrospective information, and more importantly, the information must be verifiable.
It has been found that entities reporting their ESG performance have higher expected benefits derived from the additional reporting than their US counterparts [43]. EU companies have a higher level of ESG disclosure relative to US firms [36]. This may well be attributable to the fact that within the EU such disclosure has been provided under Directive 2014/95/EU [44], otherwise, they should explain non-compliance, unlike the US and China where disclosure is voluntary. Ref. [36] advocate that the quality of ESG disclosure can be improved because the “mandatory reporting requirement provides a mandate and an incentive for firms to respond to investors’ demand for better quality disclosure” [36]. The same authors argue that ESG disclosure creates a motive for firms to indicate their commitment towards ESG, and by doing so, they can mitigate information asymmetry and enable stakeholders to better monitor the firm’s ESG disclosure behavior [45]. Ref. [46] also believe that mandatory ESG disclosure changes the reporting entity’s global outsourcing practices, improves firm-level price discovery efficiency [47], and shows an increase in green innovation [48]. Ref. [49] have also found that when the mandatory requirements are implemented by the government, then the benefits on capital market are greater than when implemented by the Stock Exchange. It appears that the issue of mandatory versus voluntary disclosure has been researched to a great depth, thus the present authors have decided not to consider it in the current paper.
Ref. [50] have found that “good ESG performance by listed companies can encourage institutional investors to increase their shares, thereby sending positive signals to the market and reducing their financing constraints” (p. 10). They have also found that ESG investment is preferred by institutional investors who have been tolerant to poor operating performance. This is in contrast to findings by [51], who found a negative association with firm value and explained that this is due to low investor sophistication in China, because investors lack the experience, expertise, and professionalism to be able to interpret this information. Another reason of course may be that ESG disclosure is voluntary, and it may lack the transparency and the accountability required to gain legitimacy.
China is not the only country that appears to be resisting ESG disclosure. There are 18 US States that throughout 2021 and 2022, “have used their legislative powers to place limitations on ESG investing or to prohibit their state governments from doing business with financial institutions that adopt certain ESG policies, such as decreasing investment in carbon-intensive sectors” [52]. The fact that Black Rock is accused of putting climate change, by encouraging the implementation of ESG reporting, above client interest [53] does send a strong message against ESG reporting. In addition, there are a number of Governors in the USA (e.g., Texas, Florida) that “ban, or restrict, companies that invest in funds and companies that favor environmental, social or good government causes such as green energy, worker rights and social justice” [54], in other words, they encourage investing and doing business with sin companies. Ref. [55] have found that companies in hazardous sectors such as oil and gas have responded to the pressure from stakeholders for the negative environmental effects of their daily processes by applying more sustainability policies and regulations [56], but are they reporting on environmental issues? Given the above discussion, the authors are hypothesizing that the environmental component will not be widely reported in the ESG index unlike the social and governance component. This will be one of the research questions the authors will endeavor to investigate.
On another issue, ESG reporting has been viewed by some [57] “as an insurance premium that the firm pays to avoid, or reduce, any loss of market value as a result of such negative events”, as negative company activities may reduce stock prices. Others refer to it as a moral capital [58] or a buffer zone [59]. A study carried out in Japan [60] is consistent with [57], who further illustrate that during crisis, disclosing ESG is an additional insurance [61,62,63] for the firms. Ref. [64], in their study, have also found that when there are market downturns, such as during the COVID-19 pandemic, investors tend to obtain better risk adjusted returns for investing in green funds, which is in support of earlier findings [65,66].
Ref. [2] on the link between risk and ESG reporting have argued that “ESG assessment tends to increase firms’ risk exposure, denoting an uncertain condition among investors” (1104). They have also found that a “full ESG assessment increases firm’s systemic risk” (1104), an assertion that is supported by earlier studies [33,67]. Ref. [2] argue that the disclosure of ESG generates a non-negligible agency risk as investments made by the company towards sustainability are viewed as profit sacrificing rather than an added value (the buzzer zone or insurance-like protection mentioned earlier).
A study in China [68] has found that ESG disclosure decreases corporate financial irregularity risks as it helps to mitigate information asymmetry. It appears that the inhibiting effect of improved internal and external supervisory conditions created by ESG disclosure is significantly stronger compared to poor supervisory conditions; thus, there are fewer financial irregularities. Ref. [69] argue that irregularities are related to organizational structure and weak corporate governance, thus ESG disclosure will decrease information asymmetry and consequently lower the crash risk [70] or irregularities.
In further explaining the link between ESG reporting and financial risk, [71] utilize the signaling theory and argue that corporate social responsibility (CSR) could help improve corporate reputation, which in turn increases corporate value, and it then follows that the company is more likely to obtain loans at a low cost and thus have lower financial risk. Following this argument, [72] as well as [73] provide empirical evidence that the higher a firm’s corporate social performance, the lower its financial risk. More specifically, [72] found that “high quality internal controls indicate high working efficiency of the company” (p. 867), which implies effectively preventing the occurrence of major risks and thus there is a negative relationship between financial risk and ESG ratings. Similarly, [72] argue that companies with high ESG indices effectively have reduced energy consumption, save on resources, and are more efficient. At the same time, these companies attract more high-quality employees, they have higher productivity, and employees are more efficient. The same authors have found that when companies implement green policies, they have higher ESG scores and disclosures, thus have lower financial risk. Hence, there is an inverse relationship between financial risk and ESG scores. More practically, ESG methods are evolving towards physical risks and transformation. More specifically, companies that are obliged by law to modernize their assets must take more ecological actions. Many investment projects, especially long-term ones, are carefully assessed by banks when granting a loan. Low standards in the field of ESG, including environmental requirements, will mean more expensive loans for companies, and thus will affect their financial results.
Ref. [74] have found that companies in the energy and utilities industry that have disclosed their ESG index had higher access returns and lower volatility. On the same path is the finding from [55], who found that gas and oil companies have responded to the pressure from stakeholders to address the negative environmental effects of their daily processes by applying more sustainability policies and regulations [56], thus have lower firm risk. This finding is in line with that of [75], who argue that better ESG scores will reduce the impact of several types of risk such as loss of revenues, regulatory sanctions, or declining share prices. Similarly, [55] found there is a “negative and significant association between ESG profile and systematic risk, demonstrating that the higher the ESG rating, the lower the market risk” in the Oil and Gas industry (p. 10). It follows, from the discussion above, that the component risk is worth further investigation as far as its impact on the ESG index.
In addition to economic factors such as economic risk or financial risk, there are social factors that may be influencing the ESG performance and index. Ref. [76] found that the impact of news on the “volatility of ESG firms is larger for bad news, compared to good news” (p. 1). Ref. [76] discusses the impact of negative news and advocates that bad news is theoretically motivated by negativity bias theory, which is traced back to theoretical research in social psychology [77,78]. Ref. [79] argue that negative news tends to have a greater impact than positive news as they produce greater and more intense consequences than comparable positive events in most situations. This argument is also supported by [80], who have found that negative news is processed quicker than positive news, thus investors place a greater weight on bad news relative to good news. It appears from the discussion above that the impact of socio-political events does affect investment decisions. More specifically, as illustrated in the discussion below, the level of corruption and civil or other unrest does affect ESG disclosure.
If one is to accept the assertion made by Ioannou and [81] that companies operating in high corrupted countries are more inclined to be involved in unethical practices, then [82] findings that there is negative impact between corruption and ESG disclosure holds true. Hoang also found that firms are less likely to disclose ESG performance if local corruption is high. It is advocated that firms must compromise between the excess cost of ESG practices and stockholders’ benefit, and when there is more corruption, there will be more informal costs of business [83]. It is advocated by [82] that firms “with stronger ESG commitments and better sustainability performance tend to be more affected by political corruption via higher formal and informal costs they bear”. Ref. [35] are also in agreement with the above argument that “banks operating in high corrupted countries are less likely to improve their ESG, as they are inclined to engage in unethical practices. Such an opaque environment nurtures the ground for non-transparent behavior and voluntary unwillingness to disclosure.” Of course, the reverse also holds true that there is “greater disclosure of sensitive transactions” when there is less perceived corruption [84], which is an argument also supported by [85]. Thus, corruption is one of the variables to be included in the study to investigate its impact on ESG.
In addition to bad news having an impact on ESG, so does war or social unrest. For instance, due to the war in Ukraine, the Bank of America is expecting destabilization of ESG because of food shortages and increasing prices [86,87]. More specifically, Quinson argues that the war will raise ESG questions relating to the future of renewable energy dependency, human rights considerations, and governance issues for Russia and Belarus. The countries involved in the war contribute significantly to the global needs of gas, crude- oil, coal, wheat, and other resources. Thus, a war will create shortages, prices will increase, and this will have an impact on related industries around the world. The shortage created will inevitably strengthen the argument around renewable energy and interest around ESG [88]. On the other side of the coin, when there is ethnic tension, racial unrest, or civil unrest, as was the case in recent years in the USA due to the killing of George Floyd, there was an increasing interest by the corporate to develop and highlight social policies. By doing so, it creates a critical factor in how companies are perceived by investors [89]. The present authors believe, therefore, that it is worth researching the hypothesis that there is an inverse relationship with civil disorders/wars/ethnic or racial tension and ESG performance.
From the above literature discussion, a number of questions remain unanswered, and the authors of the current paper will endeavor to address them.
Thus, the research questions posed are:
  • What is the global trend for the environmental, social, governance, and the overall ESG indices over the years?
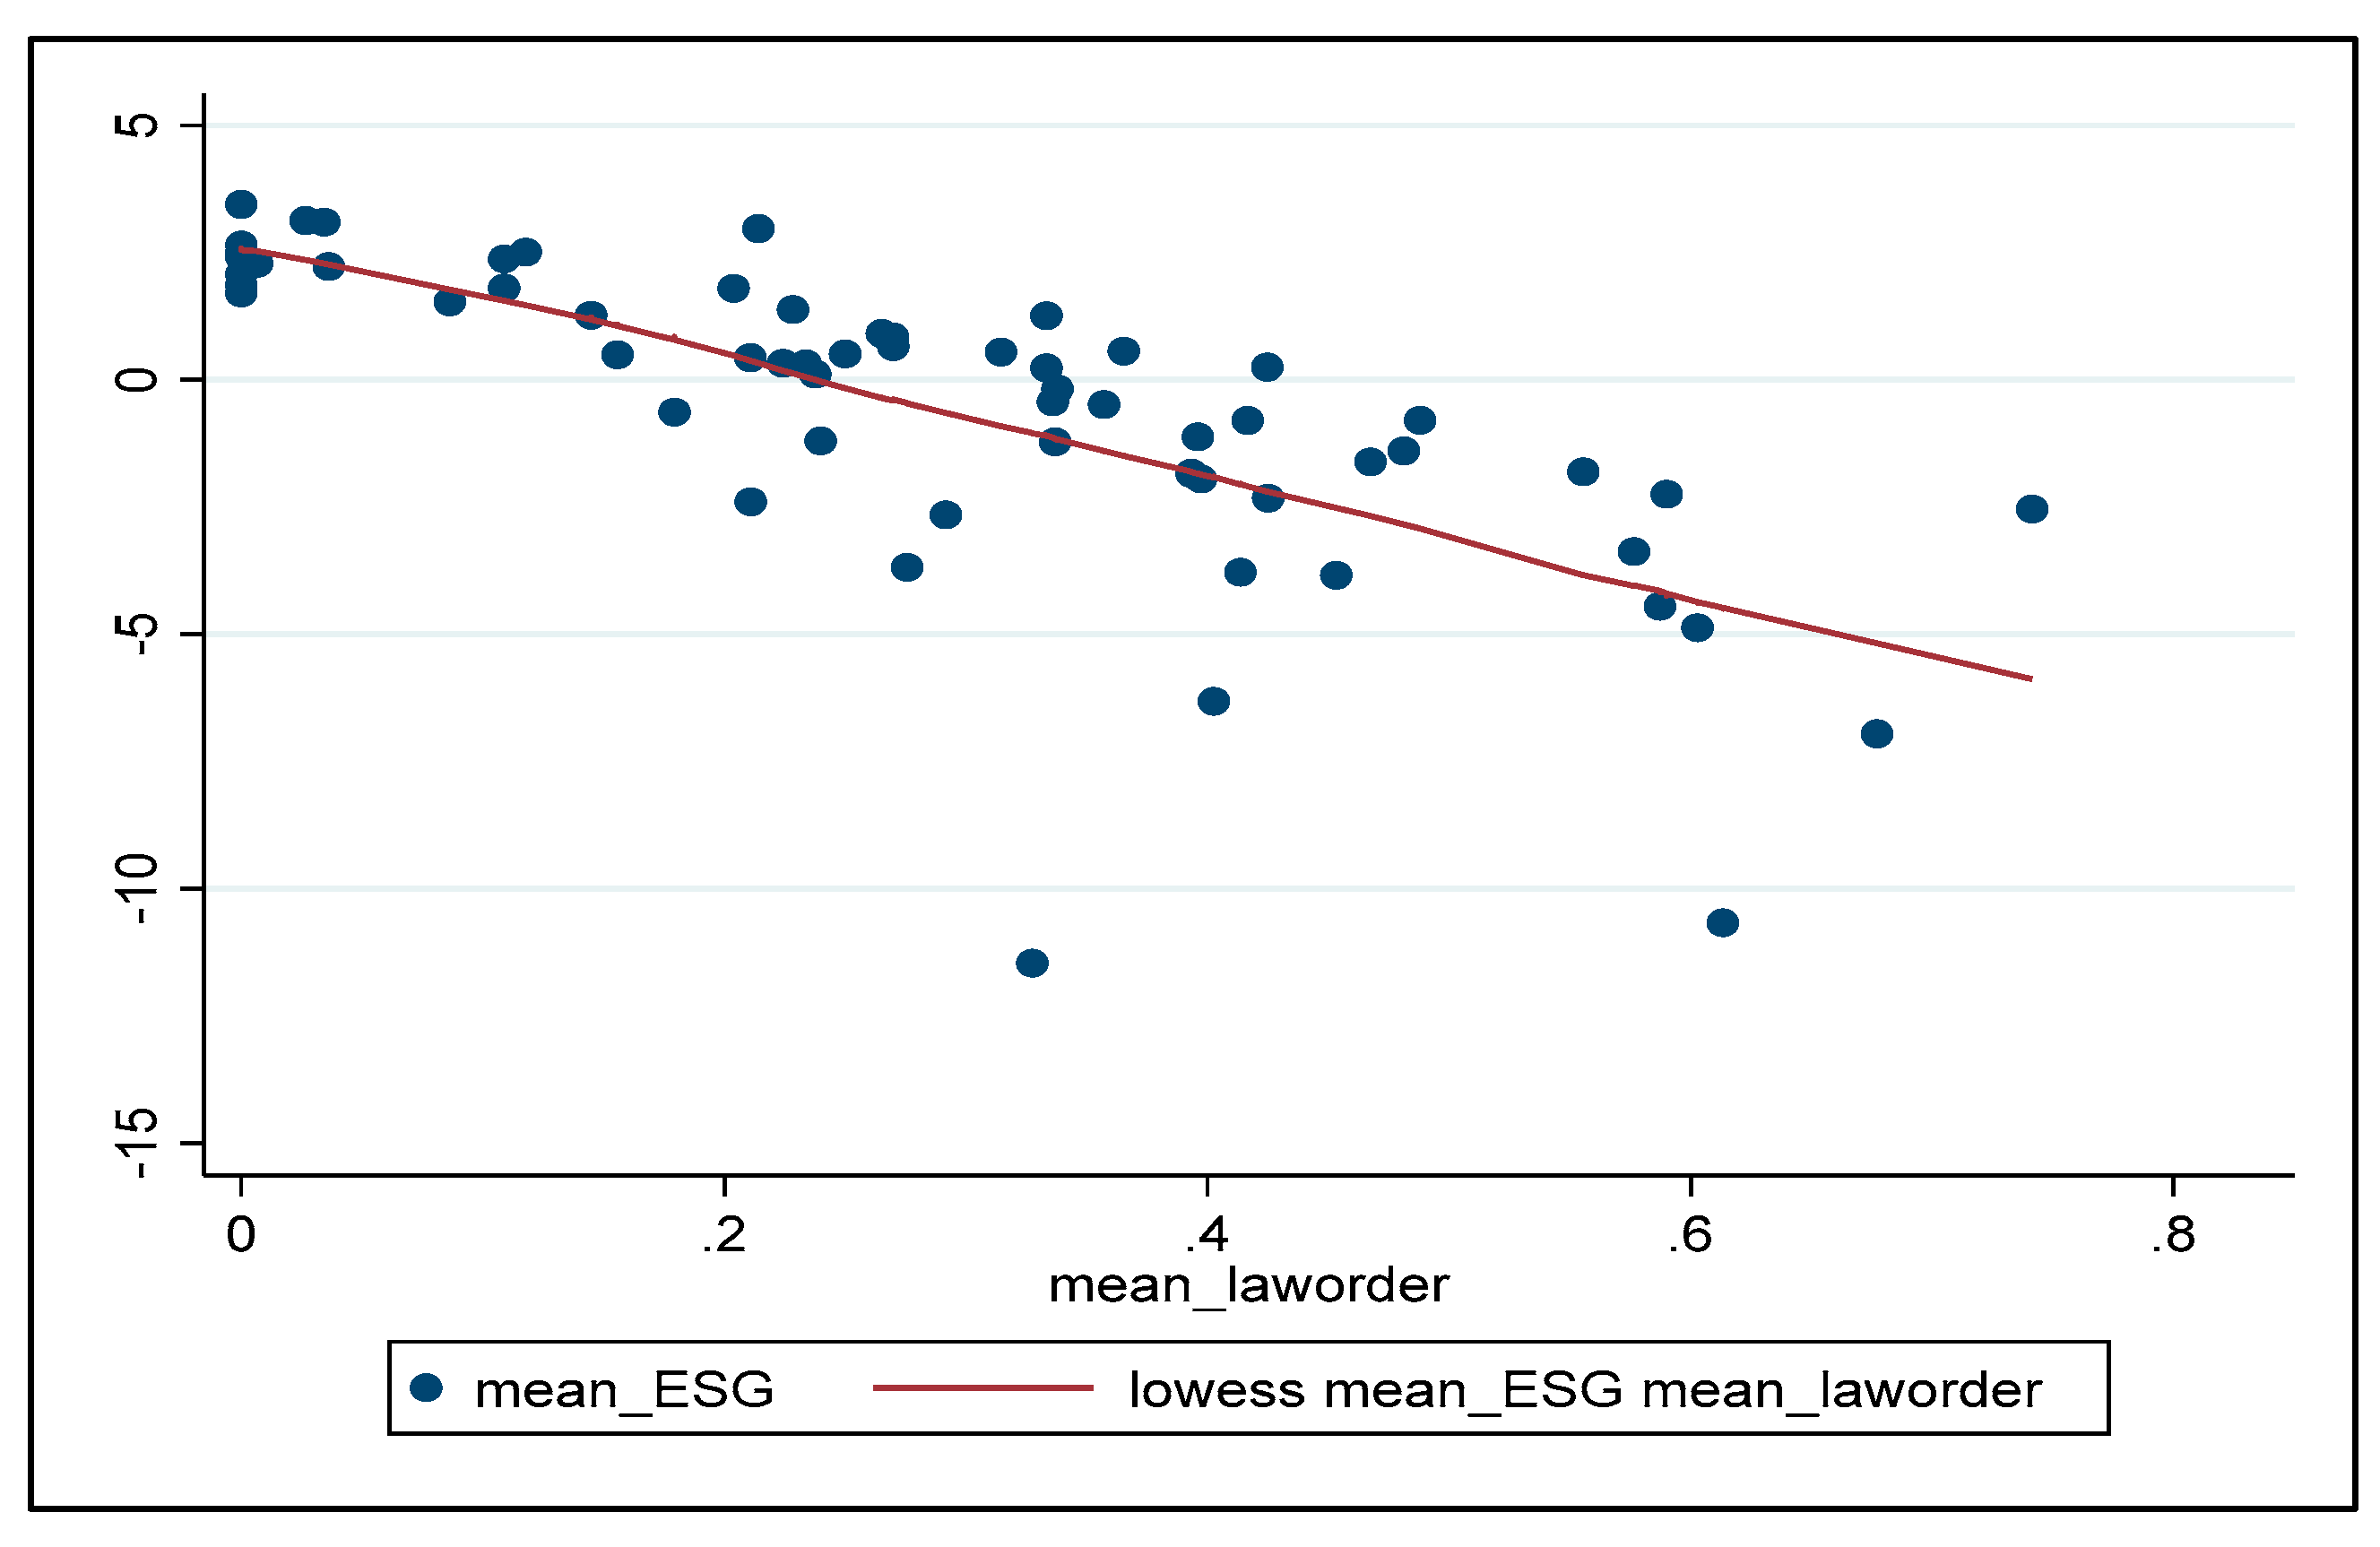
  • What is the impact of the political and economic institutions, such as corruption, civil disorder and war, economic and financial risk, ethnic and religious tensions, foreign pressures, law and order, and military in politics on the ESG index?
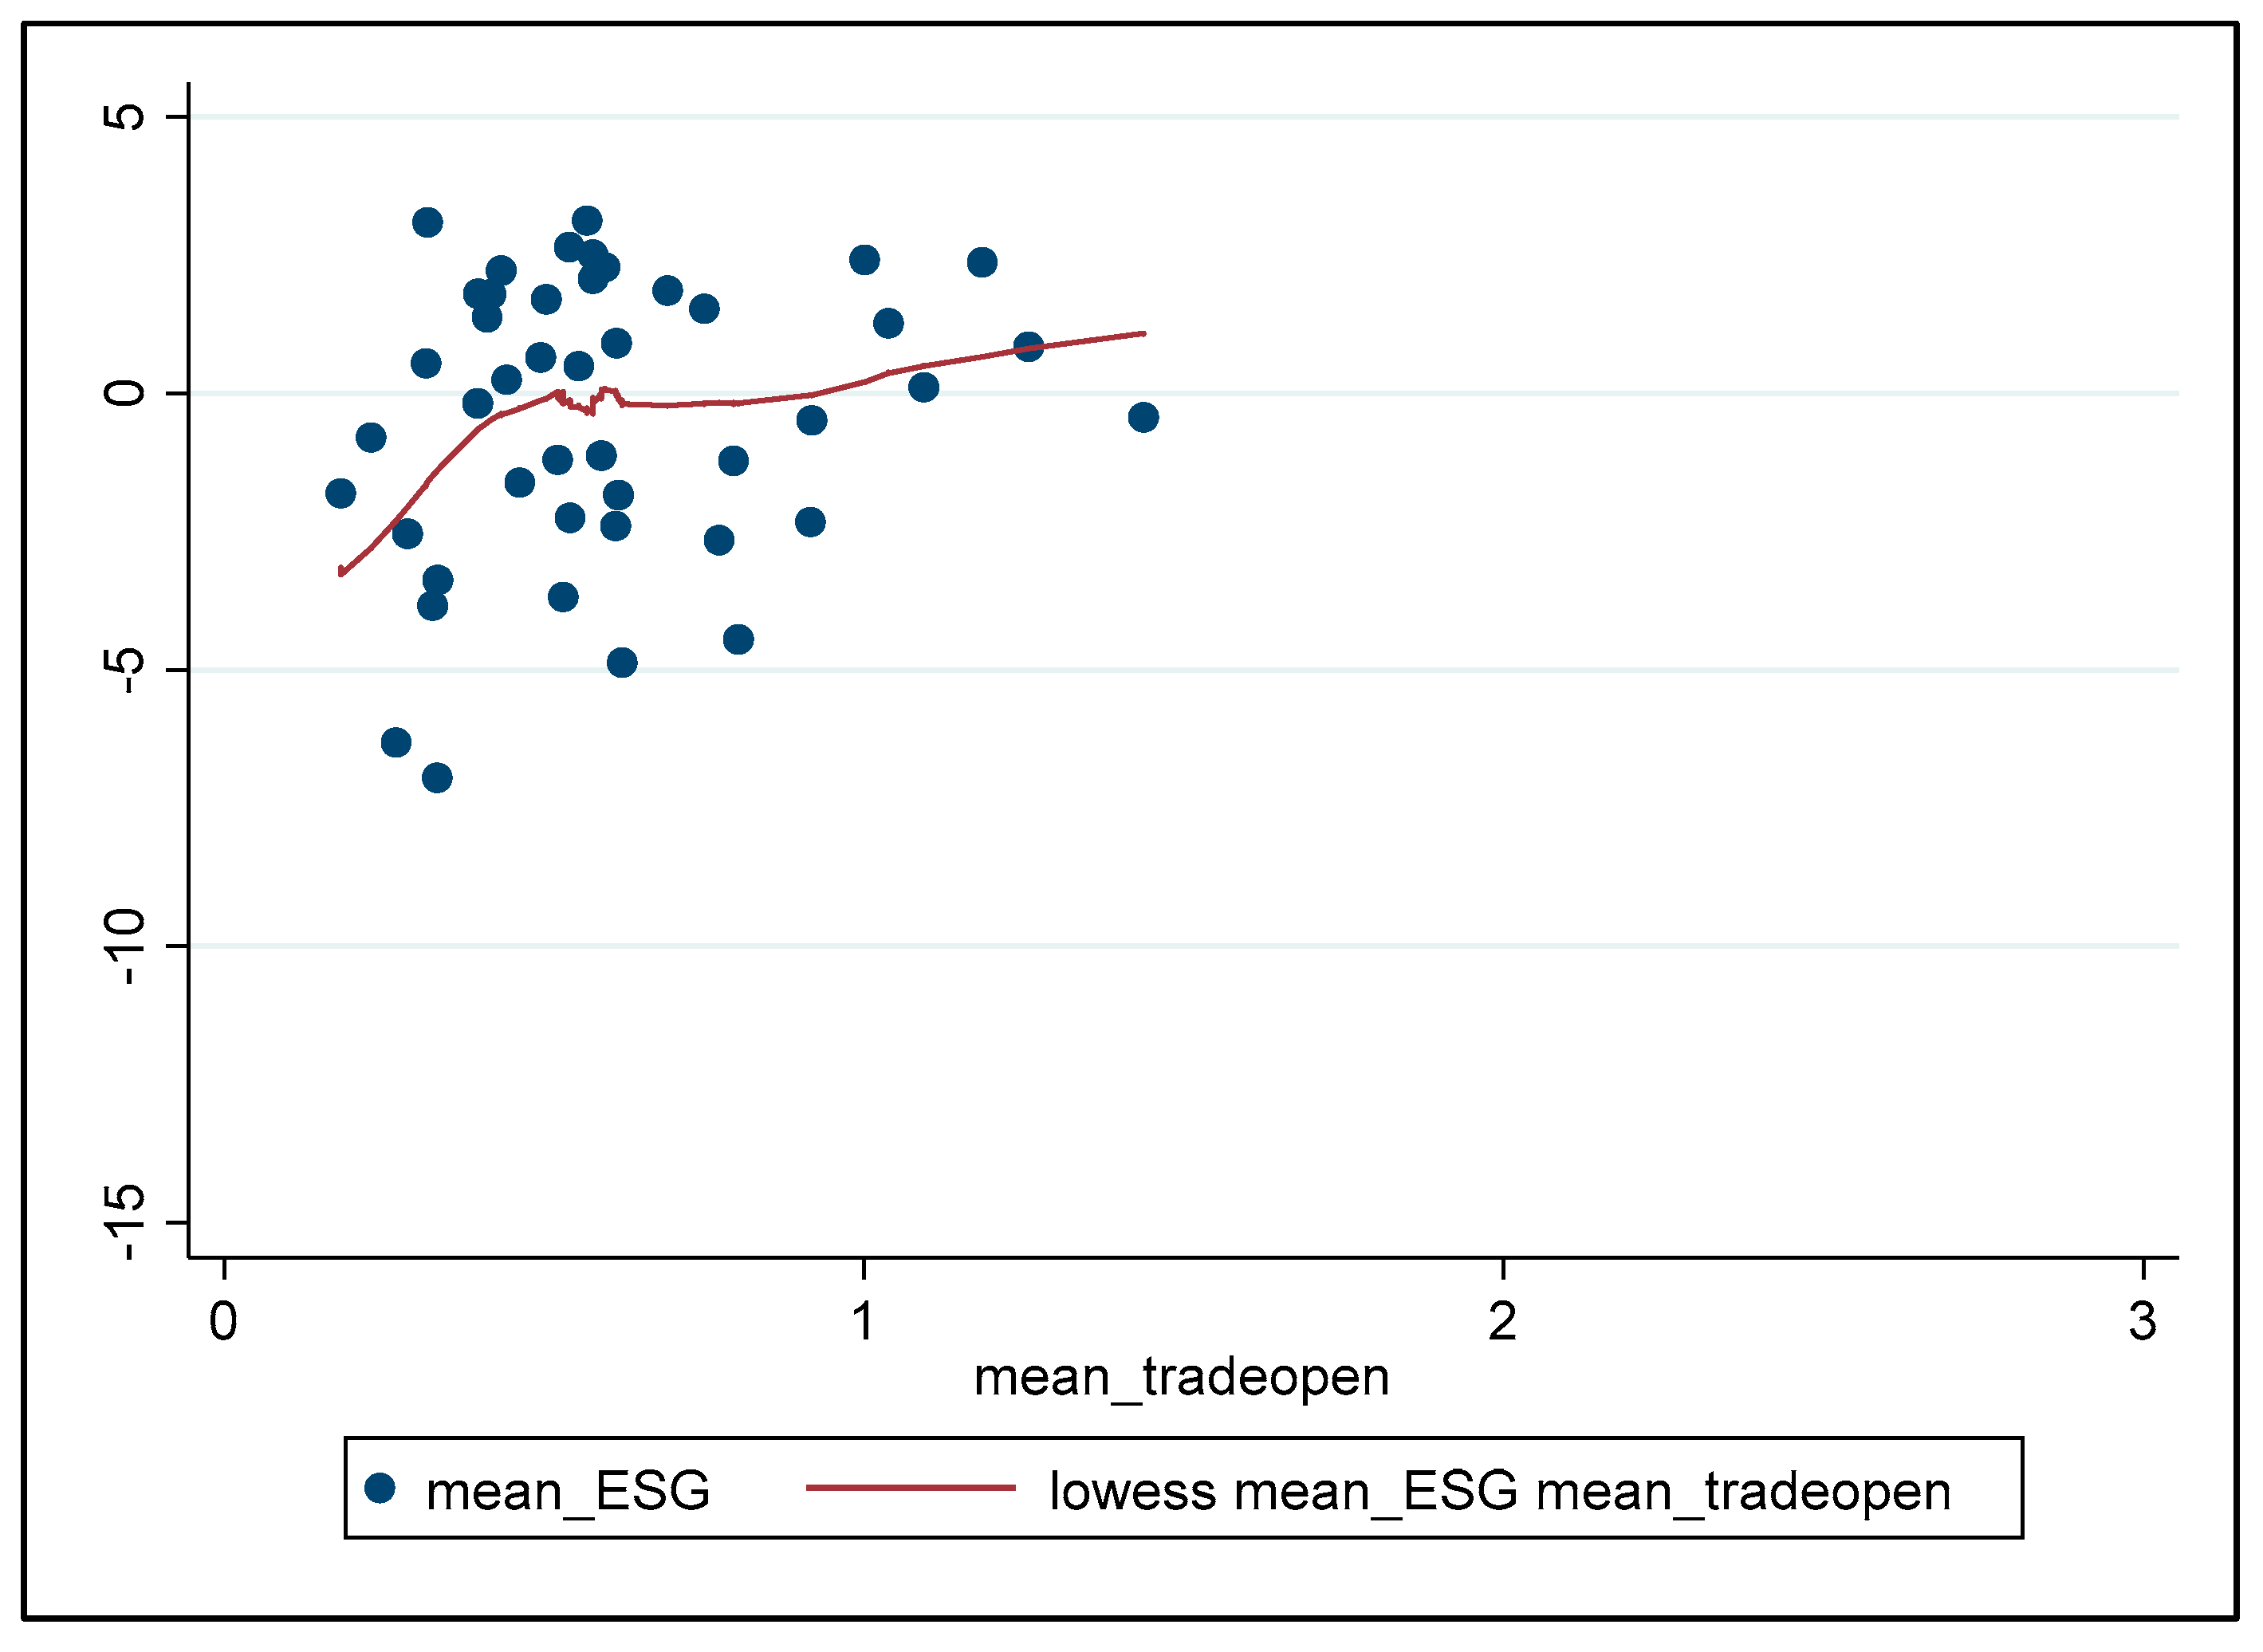
  • How macroeconomic factors such as GDP per capita, inflation, and trade openness affect the ESG index?
  • Has the presence of political and economic shocks (structural breaks) changed the impact of political and economic institutions and macroeconomic variables on the ESG index?

3. Methodology and Data Description

Following the literature, the authors investigate the effect of political and economic institutions and macroeconomic variables on ESG index, considering the presence of structural breaks using the following typical fixed effects panel for 139 countries from all over the world over the period 1984–2020:
y i t = μ i + β x i t + ε i t
where the dependent variable y i t is a scalar and measures the ESG dimensions (environment, social, governance), x i t is a k × 1 vector of ESG determinants, β is a k × 1   vector of unknown parameters, ε i t is an idiosyncratic error term for country i = 1, 2, …, N, and time t = 1, 2, …, T, allowed to be correlated across i.
By addressing the ESG index at a macro level, it provides the context within which to consider the implementation of the ESG ecosystem diachronically, thus providing the backdrop for considering the implementation of the ESG at the micro level.
The inclusion of only 139 countries from all over the world in the sample was based purely on country data availability criteria from Refinitiv. Further, in order to answer the research question regarding the global trend for the environmental, social, governance and the overall ESG indices over the years, the authors considered the longest time span available, covering the period 1984–2020.
A significant assumption is that the variables are stationary, otherwise leading to spurious regression [90], affecting the estimated R 2 , coefficients and standard errors. Consequently, to address any issues of non-stationarity, the authors follow [91] and implement a panel unit root test for the null hypothesis of a random walk with drift against the alternative of a stationary panel process with a structural break in the intercepts and linear trends at time b . Structural breaks are exogenous shocks (for example, a financial crisis or a pandemic such as COVID-19) which have a persistent effect changing the model parameters and adversely impact the behavior of the unit-root tests [92].
In the spirit of [93], the authors extend the linear model in (1) by allowing for the presence of structural breaks. In particular, the authors consider the following linear panel model with an unknown structural break at time b :
y i t = μ i + β x i t + γ m i t ( b ) + ε i t
for country i = 1, 2, …, N and time t = 1, 2, …, T. The r × 1 vector m i t is defined as:
m i t ( b ) = R x i t I t > b
where I ( . ) is the indicator function taking the value one when t > b and zero otherwise, R is a k × r matrix of zeros and ones with full column rank r that includes the elements of x i t whose coefficients are subject to structural change. If k > r   or k = r , then (3) is a partial structural or a pure structural change model, respectively. The model can be easily generalized to include multiple breaks. Further, to address any endogeneity concerns related to omitted variables and reverse causality/simultaneity bias [94], which would have led to incorrect inferences [95], the model in (2) is estimated using two-stage least squares (2SLS), where all variables are instrumented using their lag-values.
Estimation of the linear panel data model with an unknown structural break in (2) requires first to examine for the presence of structural breaks and in particular testing the following null hypothesis:
H 0 :   n o   b r e a k s   v e r s u s   H 1 : 1 s s m a x   b r e a k s
using the following double maximum statistic:
W D m a x F s m a x = m a x 1 s s m a x c a , 1 c a , s s u p F ( s )
where c a , s is the critical value of s u p F ( s ) at significance level a and s breaks. Uncovering the presence and number of structural breaks requires to identify the exact location. Following the literature [96,97], the estimation of the break points is based on minimizing the sum of squared residuals given by:
T ~ s = a r g   m i n T s     T s , ε   S S R ( T s )
where S S R ( T s ) is the sum of squared residuals based on s breaks. Regarding the variables used for the analysis, the authors utilize data from the Refinitiv database and particularly macroeconomic variables comprising the environment, social, and governance dimensions. The data covers up to 2020, which was the latest available period. For the environment component, the authors consider emissions and pollution (CO2, methane, and nitrous oxide emissions) and energy use (primary energy intensity, electricity production from coal sources, fossil fuel energy consumption, energy use per capita, renewable electricity output, renewable energy consumption). All environmental variables (apart from renewable electricity output and renewable energy consumption) have been rescaled with higher scores, indicating strong environmental performance. For the social dimension, the authors include access to services (access to clean fuels and technologies for cooking, access to electricity, people using safely managed sanitation services), demography (life expectancy, fertility rate), and education and skills (school enrolment—primary, government expenditure on education). Finally, for the governance component, the authors consider economic environment and innovation (individuals using the internet, scientific and technical journal articles, patent applications), and gender (school enrolment gender parity index, proportion of seats held by women in national parliaments, ratio of female to male labor force participation rate).
To construct the environment, social, governance, as well as the overall ESG quality indices, the authors follow [98,99] based on principal component analysis (PCA), which considers the first principal component to weight the index and the factor loadings of the consecutively extracted components. A significant advantage of this method is that a bigger proportion of the variance in the data set is explained [100].
For the set of the ESG determinants, the authors use data from the International Country Risk Guide (ICRG) and specifically measures of political institutions (corruption, law and order, civil disorder, civil war, ethnic tensions, foreign pressures, military in politics, and religious tensions), economic institutions (economic and financial risk rating), and macroeconomic variables (real per capita GDP, inflation, trade openness). For comparability and ease of interpretation [101] and following the literature [102,103,104,105], the authors have rescaled the political and economic institutions from ICRG between 0 and 1 (0 ≤ x ≤ 1), where the lowest point 0 indicates low values and the highest point 1, high values.
A detailed description of the variables and their source is provided in Table A1 in the Appendix, the country list is presented in Table A2, whereas Table A3 presents summary statistics for the pooled data.

4. Empirical Results

To tackle any issues of non-stationarity, which would lead to spurious regression [90] affecting the relevant R 2 , coefficients and standard errors, the first step of the empirical analysis involves implementing a panel unit root test for the null hypothesis of a random walk with drift against the alternative of a stationary panel process with unknown structural breaks in the intercepts and linear trends at time b , following [91]. Table A4 presents the univariate panel unit root results for the level and growth rate of all the variables comprising the environment-social-governance dimensions, as well as, for all the relevant ESG determinants, including economic and political institutions and macroeconomic variables. According to the results, when the growth rates are considered, the estimated statistics are far less than the corresponding critical values, and therefore, the null hypothesis of non-stationarity is rejected (thus, growth rates are considered for the multivariate analysis), as opposed to the levels, where the stationarity results are contradictory.
As previously discussed, to construct the environment, social, governance, as well as the aggregate ESG quality indices, the authors follow [98,99] based on principal component analysis (PCA), which considers the first principal component to weight the index and the factor loadings of the consecutively extracted components. In Figure 1, Figure 2, Figure 3 and Figure 4, the authors illustrate the country-average for the environment, social, governance, and the aggregate ESG indices by year. The figures reveal that there is an increasing trend for the social, governance, and aggregate ESG indices, but not for the environment index where the trend is decreasing. In addition, the figures indicate the presence of structural breaks, which will be further investigated in the context of multivariate analysis.
To investigate the effect of economic and political institutions and macroeconomic variables on ESG, the authors first estimate the relevant locally weighted scatterplot smoothing (LOWESS) presented in Figure 5, Figure 6, Figure 7, Figure 8, Figure 9, Figure 10, Figure 11, Figure 12, Figure 13, Figure 14, Figure 15, Figure 16 and Figure 17. According to the findings, higher levels of corruption, civil disorder, civil war, economic and financial risk, ethnic and religious tensions, foreign pressures, risk in law and order, military in politics, and inflation have a negative effect on ESG performance. In contrast, income per capita and trade openness have a positive impact on ESG performance. The results are also confirmed by the Pearson correlation matrix presented in Table A5.
For the estimation of the linear panel data model with unknown structural breaks in (2), which will shed light on the ESG determinants, it is required first to examine for the presence and number of structural breaks and second identify the exact location. Following the literature [96,97], the authors implement a sequential test for multiple breaks at unknown breakpoints in a multivariate setting, presented in Table A6. In particular, in Table A6 (first section), the number of breaks is determined using a sequential testing approach with a maximum number of breaks s m a x = 5 and reports the test value at each step in the sequence and the appropriate critical value from [96]. The number of breaks is increased by one every time the test rejects the null, starting at zero breaks. According to the results, there is one estimated break when the dependent variable is the aggregate ESG index and the environment and two estimated breaks for social and governance. Table A6 (second section) also includes the estimation of the breakpoint locations along with the relevant SSR and 95% confidence intervals. Notably, all variables have a common breakpoint in 2010. Whilst [106,107] suggest that the financial crisis had prompted and encouraged the companies to report on ESG as an additional investment [57,60], there is no other literature explaining why 2010 is a turning point for the ESG disclosure. The authors, whilst in agreement with the abovementioned authors and their explanation that the global financial crisis prompted companies to report on ESG, have also found that there were regulatory measures around the global on the implementation of governance and environment. Some of these were: (a) the World Bank issued its governance principles (http://info.worldbank.org/governance/wgi/pdf/wgidatatables.pdf; https://www.brookings.edu/opinions/governance-matters-2010-worldwide-governance-indicators-highlight-governance-successes-reversals-and-failures/ [accessed on 14 June 2023]), (b) the OECD published its governance principles (http://regulatoryreform.com/wp-content/uploads/2015/02/OECD-Risk-and-Regulatory-Policy-2010.pdf [accessed on 14 June 2023]), (c) the SEC introduced Guidance on Disclosure Related to Business or Legal Developments Regarding Climate Change [108]. Figure 18, Figure 19, Figure 20, Figure 21, Figure 22, Figure 23, Figure 24 and Figure 25 present the mean country ESG, environment, social, and governance before and after 2010. These findings are in line with [106], where she illustrates that Australia ASX 300 firms improved their ESG performance in the period 2002–2009 (also illustrated in Figure 18 and Figure 19 below). She also explains that the global financial crisis has shaken the world markets, causing widespread social consequences [107] with the need for companies to be a lot more transparent on ESG issues.
Finally, the social component has an additional breakpoint in 2004 and governance in 2015. A number of events leading up to 2004 which had an impact on social indicators include: (a) 9/11 attack in the USA in 2001 (https://www.history.com/topics/21st-century/9-11-attacks [accessed on 14 June 2023]); (b) the USA–Iraq war in 2003–2011 (https://www.britannica.com/event/Iraq-War [accessed on 14 June 2023]); and (c) the SARS epidemic (https://www.cdc.gov/sars/about/fs-sars.html [accessed on 14 June 2023]) in 2002–2004. As illustrated by [109], it was not until 1992 and in the wake of some well-known company collapses in the UK, that the first version of the UK Corporate Governance Code was produced by the Cadbury Committee. It is evident that over time, corporate scandals, collapses, and failures have brought about an erosion of public confidence in companies and raised the interest in governance. Hence, as there are more frauds and mismanagement, it is expected there will be an increasing interest in the G component of ESG. Events leading up to 2015 that are expected to have had an impact on the governance component were: (a) the collapse of Enron and WorldCom causing the “dark side of business” (https://www.bbc.coms/news/business-58026162 [accessed on 14 June 2023]) in the first decade of the new century, (b) the Bernie Maddoff fraud case (https://www.bbc.com/news/business-58026162 [accessed on 14 June 2023]), where the defendant was sentenced to 150-years incarceration for the largest Ponzi scheme in history, (c) the Barclay’s and Libor Scandal in 2012 in the UK, and (d) also in the UK in 2012, the court found guilty and sentenced to 10 years in prison former fugitive Asil Nadir for the theft of nearly GBP 29 million (USD 46 million) from his Polly Peck empire more than 20 years ago (https://www.bbc.com/news/uk-19352531 [accessed on 14 June 2023]).
In agreement with [93], Table A7, Table A8, Table A9 and Table A10 present the 2SLS results for the structural change model presented in (3.2), where k = r , and hence allowing for a pure structural change. Further, to alleviate any endogeneity concerns, all variables are instrumented using their 5-year lag-values (the results remain robust using 3-year lag-values and are available upon request). Table A7 displays the 2SLS results for the aggregate ESG. The first column includes the coefficients and corresponding robust standard errors for the full sample excluding the presence of structural breaks, whereas the second and third columns include the regime estimations (before and after 2010) for the pure structural change model. According to the results and following the theoretical predictions, higher levels of corruption, financial risk, foreign pressures, and inflation have a negative impact on the ESG performance. In contrast, higher levels of per capita GDP and trade openness have a positive effect on ESG. The results remain robust if the authors consider the first regime (before 2010) in the structural change model, but when the second regime is considered (after 2010), only financial risk (negatively) and per capita GDP (positively) are statistically significant. Similar results are presented in Table A8, where the authors explore the effect of political and economic institutions and macroeconomic variables on the environmental index. When the full sample model is considered, higher levels in corruption, civil disorder, financial risk, religious tensions, risk in law and order, and inflation have a detrimental effect on the environmental index, as opposed to the impact of per capita GDP, which is positive. Similar results are obtained when the first regime is considered (before 2010), but after 2010, there is an additional significant negative impact of economic risk and military in politics on the environment. In Table A9, the role of political and economic institutions is also important for the social index, where the authors consider the presence of two structural breaks in 2004 and in 2010. In the full sample, corruption, civil disorder, financial risk, ethical tensions, and foreign pressures affect the social index negatively, whereas affecting the real per capita GDP positively. Similar are the results before 2010 during the first and second regime ( t < 2004 and 2004 < t < 2010 ). After 2010, however, corruption is not statistically significant. Finally, in Table A10, where the authors consider the presence of two structural breaks in 2010 and in 2015 for governance, it is clear that the effect of political and economic institutions is strong in the full sample and in the first and second regime ( t < 2010 and 2010 < t < 2015 ) but vanishes after 2015.

5. Discussion

Thus, in responding to the research questions, it was found that the social and governance components have an increasing global trend, whilst the environment component, a decreasing trend over the years. The authors assert that while there is higher pressure due to the climate change movement nowadays to report on environmental issues, it is costly for companies to implement environmental protection legislations, thus they hide behind reporting social and governance issues. This is in support of arguments by [34,35] proposing that ESG is used as window dressing to cover up illegal, unethical, or simply opaque environments.
The effects of corruption, civil disorder, civil war, ethnic and religious tension, military, and law unrest, as shown in Table A7, on ESG index are negative. Whilst this is expected, companies can indeed report the consequences of such negative social events and identify mitigating factors. For instance, there may be civil unrest in a country but the company may be taking actions to mitigate or support the victims, thus turn the negative impact into a positive opportunity.
Further, considering the effect of the macroeconomic variables, inflation has a negative effect on the ESG performance. If one considers the current market situation with increasing prices due to the war in Ukraine and the aftermath of the COVID-19 pandemic, it is expected that reporting entities will face financial hardships and will not be undertaking costly practices unless they are forced to do so by law.
In addition, as it appears from earlier discussion and the tables and diagrams below, the social and governance index has increased after 2010 as opposed to the environment index. As environment protection legislations have come into effect around the globe, it appears that firms have taken advantage of adopting minimum disclosure requirements to “only superficially meet regulatory requirements” [49]. Ref. [8] has argued that the relevance of the three ESG dimensions depend on the industry sector of each company. Thus, the weight of each ESG pillar “should be related to the relevance within the company’s value-creation process…”, which could depend on industry-specific peculiarities [2].
Overall, addressing the key research questions of this paper, the results reveal that there is an increasing trend for the social, governance, and aggregate ESG indices, but not for the environment index where the trend is decreasing (Research Question I). Moreover, considering the role of economic and political institutions, higher levels of corruption, civil disorder, civil war, economic and financial risk, ethnic and religious tensions, foreign pressures, risk in law and order, and military in politics have a negative effect on ESG index (Research Question II). Regarding the effect of the macroeconomic variables, inflations has a negative effect whereas income per capita and trade openness have a positive impact on the ESG index with heterogeneous results before and after 2010 (Research Questions III and IV).
While it is acknowledged by the current authors that there are some researchers [51,110] who are still skeptical on the benefits of integrated reporting and in particular ESG reporting, it is asserted that because some countries have moved towards mandating this additional disclosure and because there are institutional investors like Black Rock that want to reward good corporate entities, it is only a matter of time before firms will move beyond using ESG as window dressing for their unethical or illegal actions. When disclosure requirements are put into effect by governments and are made compulsory as was the case with Corporate Governance Codes many decades earlier, then listed companies will have no option but to comply. Ref. [49] have found that when ESG disclosure is regulated by governments, then liquidity is improved three-times more rather than when mandated by the Stock Exchange.

6. Policy Implications and Conclusions

The current authors have found that (a) not all three components for the ESG index behave the same (i.e., in the aggregate ESG index, there is an increasing trend for the social and governance components but not for the environment component), (b) some economic and political variables have a negative effect on ESG index (such as corruption, civil disorder, civil war, economic and financial risk, ethnic and religious tensions, foreign pressures, risk in law and order, and military in politics), (c) some macroeconomic variables have a negative effect on ESG index (e.g., inflation) whereas others (e.g., income per capita and trade openness) have a positive effect, and (d) there are heterogeneous results before and after 2010. It is asserted therefore by the authors that if the regulators wish to encourage the implementation of the ESG ecosystem and in particular ESG reporting, there is a need for a global collaboration and for uniform agreement on the ESG ecosystem.
On the other side of the coin, the authors acknowledge that in reaching a uniform consent on the ESG ecosystem and in particular ESG reporting may prove a lot more difficult in practice. This is evident by the failure of the G20 to reach a consensus on the climate crisis [111].
Ref. [112] found that external stakeholders expected businesses to publish relevant information that is accurate and timely. Ref. [113] further argue that data need to be also relevant, credible, and comparable and that it demonstrates improved ESG performance. To this end, the authors advocate that ESG disclosure ought to be regulated by governmental decree rather than self-regulated by professional bodies or the Stock Exchange. The CSRD places collective responsibility [114] on the administrative, management, and supervisory bodies of a company to ensure that it reports in accordance with EU standards in the required digital format. All disclosures made will have to be externally accredited and certified by an independent auditor, a view that is also expressed by [115]. This provides additional assurance that the sustainability information provided by the disclosing companies complies with certification standards that have been adopted by the EU. Given the regulatory framework in Europe (comprising the European Banking Association, the European Financial Reporting Advisory Group, Entertainment Software Rating Board, and European Central Bank), it is expected there will be a navigation towards the implementation of hard laws that reporting entities will need to comply with. However, [12] are also of the view that there is a need for coordinated global participation from public, private, and civil society to ensure uniform implementation of ESG disclosure.
Whilst in many countries around the globe, there are environmental protection laws, there appears to be unwillingness to report on environmental issues by some companies. On the other hand, companies are more likely to be reporting on social and governance issues. It is recommended therefore that just like there are internationally approved accounting standards that companies need to comply with, there ought to be uniform agreed global ESG reporting standards. It is also suggested that these reports ought to be audited to ensure companies are accountable and the reports are transparent and reliable for the investors and the users. At the same time, governments that are opposing such reporting ought to be “encouraged” to accept and promote ESG reporting, otherwise companies will migrate to “ESG friendly jurisdictions”, a topic that can be addressed in future research.
It is acknowledged by the authors that the study is not free of limitations. For instance, the data is only up to 2020 due to data availability constraints, while another path of research may be to investigate another dimension by including sectoral/industrial data to examine similar effects.
The authors by addressing the ESG at a macro level provided the context within which to consider the adoption of the ESG ecosystem diachronically, thus providing the backdrop for considering the implementation of the ESG at the micro level. Triple bottom line reporting and more specifically ESG reporting has been around for decades, yet many companies are using it as a window dressing opportunity in an effort to hide the true picture of their reporting entity. The turn of the second decade of the millennium has brought to the surface social unrest, ethnic tensions, wars, and financial risks, all of which had an effect on the ESG ecosystem. Despite the fact that there are climate activists, demonstrations, and reports on climate warming, many companies choose to hide behind ESG reporting and fail to report on environmental issues.
The main findings of this study reveal that companies around the globe prefer to promote actions related to social and governance components, giving less attention to environmental components which are more costly to handle. Therefore, policy makers should promote policies that encourage the capital reallocation towards greener choices that will enhance the environmental component. This of course can be better achieved if globally agreed ESG reporting standards are adopted. In addition, and as expected, social negative events such as social unrest, wars, religious tension as well as financial risk and inflation have a negative effect on ESG reporting. Thus, the authors suggest that when there are such social or economic negative effects on ESG, rather than opting not to report on ESG, companies ought to find compensatory or mitigating factors; for instance, when there is a social unrest, find opportunities to minimize the repercussions of the social event on their company or if there is a financial risk, find ways to minimize the risk and report on that. It is believed that the new EU directive and the double materiality principle will create the path towards this direction as investors and stakeholders are looking for companies that prove to be resilient and sustainable.

Author Contributions

Conceptualization, M.K.-K. and C.S.S.; methodology, C.S.S. and I.S.; software, I.S.; validation, M.K.-K., C.S.S. and I.S.; formal analysis, M.K.-K., C.S.S. and I.S.; investigation, M.K.-K., C.S.S. and I.S.; resources, M.K.-K., C.S.S. and I.S.; data curation, I.S.; writing—original draft preparation, M.K.-K., C.S.S. and I.S.; writing—review and editing, M.K.-K., C.S.S. and I.S.; visualization, M.K.-K., C.S.S. and I.S.; supervision, M.K.-K., C.S.S. and I.S.; project administration, M.K.-K. and C.S.S.; funding acquisition, N/A. All authors have read and agreed to the published version of the manuscript.

Funding

This research received no external funding.

Data Availability Statement

Not applicable.

Conflicts of Interest

The authors declare no conflict of interest.

Appendix A

Table A1. Variable description and source.
VariableDescription
EnvironmentEmissions and pollution: CO2 emissions (metric tons per capita), methane emissions (metric tons of CO2 equivalent per capita), nitrous oxide emissions (metric tons of CO2 equivalent per capita).
Energy use: Energy intensity level of primary energy (MJ/$2011 PPP GDP), electricity production from coal sources (% of total), fossil fuel energy consumption (% of total), Eenergy use (kg of oil equivalent per capita),
renewable electricity output (% of total electricity output), renewable energy consumption (% of total final energy consumption). All variables apart from renewable electricity output and renewable energy consumption have been rescaled between 0 and 1, with high scores indicating strong environmental performance.
Source: www.refinitiv.com
Data access is restricted to subscribers
SocialAccess to services: Access to clean fuels and technologies for cooking (% of population), access to electricity (% of population), people using safely managed sanitation services (% of population).
Demography: Life expectancy at birth, total (years), fertility rate, total (births per woman).
Education and skills: School enrolment—primary (% gross), government expenditure on education—total (% of government expenditure).
Source: www.refinitiv.com
Data access is restricted to subscribers
GovernanceEconomic environment and innovation: Individuals using the internet (% of population), scientific and technical journal articles, patent applications—residents.
Gender: School enrolment—primary and secondary (gross)—gender parity index (GPI), proportion of seats held by women in national parliaments (%), ratio of female to male labor force participation rate (%) (modeled ILO estimate).
Source: www.refinitiv.com
Data access is restricted to subscribers
CorruptionA measure of corruption within the political system that is a threat to foreign investment by distorting the economic and financial environment, reducing the efficiency of government and business by enabling people to assume positions of power through patronage rather than ability, and introducing inherent instability into the political process. Between 0 (high corruption) and 6 (low corruption). Rescaled between 0 (very clean) and 1 (highly corrupt). Source: International Country Risk Guide (ICRG). https://epub.prsgroup.com/products/icrg-historical-data. Data access is restricted to subscribers.
Civil disorder“The potential risk to governance or investment from mass protest, such as anti-government demonstrations, strikes, etc. Between 0 (high risk) and 4 (low risk).” Rescaled between 0 (low risk) and 1 (high risk). Source: International Country Risk Guide (ICRG).
https://epub.prsgroup.com/products/icrg-historical-data. Data access is restricted to subscribers.
Civil warThe actual or potential risk of civil war (where a rebel force, which holds territory, is in armed conflict with the security forces of the government, and where both forces are citizens of the state in which the conflict occurs). Between 0 (high risk) and 4 (low risk). Rescaled between 0 (low risk) and 1 (high risk). Source: International Country Risk Guide (ICRG). https://epub.prsgroup.com/products/icrg-historical-data. Data access is restricted to subscribers.
Economic risk ratingA means of assessing a country’s current economic strengths and weaknesses. In general, where strengths outweigh weaknesses, a country will show low risk, and where weaknesses outweigh strengths, the economic risk will be high. To ensure comparability between countries, risk components are based on accepted ratios between the measured data within the national economic/financial structure, and then the ratios are compared, not the data. Risk points are assessed for each of the component factors of GDP per head of population, real annual GDP growth, annual inflation rate, budget balance as a percentage of GDP, and current account balance as a percentage of GDP. Risk ratings range from a high of 50 (least risk) to a low of 0 (highest risk), though lowest de facto ratings are generally near 15. Rescaled between 0 (low risk) and 1 (high risk). Source: International Country Risk Guide (ICRG). https://epub.prsgroup.com/products/icrg-historical-data. Data access is restricted to subscribers.
Financial risk ratingA means of assessing a country’s ability to pay its way by financing its official, commercial, and trade debt obligations. To ensure comparability between countries, risk components are based on accepted ratios between the measured data within the national economic/financial structure, and then the ratios are compared, not the data. Risk points are assessed for each of the component factors of foreign debt as a percentage of GDP, foreign debt service as a percentage of exports of goods and services (XGS), current account as a percentage of XGS, net liquidity as months of import cover, and exchange rate stability. Risk ratings range from a high of 50 (least risk) to a low of 0 (highest risk), though lowest de facto ratings are generally near 20. Rescaled between 0 (low risk) and 1 (high risk). Source: International Country Risk Guide (ICRG). https://epub.prsgroup.com/products/icrg-historical-data. Data access is restricted to subscribers.
Ethnic tensionsA measure of the degree of tension attributable to racial, national, or language divisions. Between 0 and 6. Lower ratings near 0 (higher risk) are given to countries where tensions are high because opposing groups are intolerant and unwilling to compromise. Higher ratings, near 6, are given to countries where tensions are minimal, even though such differences may still exist. Rescaled between 0 (low risk) and 1 (high risk). Source: International Country Risk Guide (ICRG). https://epub.prsgroup.com/products/icrg-historical-data. Data access is restricted to subscribers.
Religious tensionsA measure of religious tensions arising from the domination of society and/or governance by a single religious group—or a desire to dominate—in a way that replaces civil law by religious law, excludes other religions from the political/social processes, suppresses religious freedom or expressions of religious identity. The risks involved range from inexperienced people imposing inappropriate policies to civil dissent or civil war. Between 0 (high tensions) and 6 (low tensions). Rescaled between 0 (low tensions) and 1 (high tensions). Source: International Country Risk Guide (ICRG). https://epub.prsgroup.com/products/icrg-historical-data. Data access is restricted to subscribers.
Foreign pressuresActual or potential risk posed by pressures brought to bear on the government by one or more foreign states to force a change of policy. Such pressures can range from diplomatic pressures, through suspension of aid and/or credits, to outright sanctions. Between 0 (high risk) and 4 (low risk). Rescaled between 0 (low risk) and 1 (high risk). Source: International Country Risk Guide (ICRG). https://epub.prsgroup.com/products/icrg-historical-data. Data access is restricted to subscribers.
Law and orderTwo measures comprising one risk component. Each sub-component equals half of the total. The “law” sub-component assesses the strength and impartiality of the legal system, and the “order” sub-component assesses popular observance of the law. Between 0 (high risk) and 6 (low risk). Rescaled between 0 (low risk) and 1 (high risk). Source: International Country Risk Guide (ICRG). https://epub.prsgroup.com/products/icrg-historical-data. Data access is restricted to subscribers.
Military in politicsA measure of the military’s involvement in politics. Since the military is not elected, involvement, even at a peripheral level, diminishes democratic accountability. Military involvement might stem from an external or internal threat, be symptomatic of underlying difficulties, or be a full-scale military takeover. Over the long term, a system of military government will almost certainly diminish effective governmental functioning, become corrupt, and create an uneasy environment for foreign businesses. Between 0 and 6. Overall, lower risk ratings (0) indicate a greater degree of military participation in politics. Rescaled between 0 (low participation) and 1 (high participation). Source: International Country Risk Guide (ICRG). https://epub.prsgroup.com/products/icrg-historical-data. Data access is restricted to subscribers.
Real per capita GDPRatio of real GDP to population. Source: International Country Risk Guide (ICRG). https://epub.prsgroup.com/products/icrg-historical-data. Data access is restricted to subscribers.
InflationAnnual average percent change in the consumer price index. Source: International Country Risk Guide (ICRG). https://epub.prsgroup.com/products/icrg-historical-data. Data access is restricted to subscribers.
Trade opennessTrade is the sum of exports and imports of goods and services measured as a share of gross domestic product.
Source: International Country Risk Guide (ICRG). https://epub.prsgroup.com/products/icrg-historical-data. Data access is restricted to subscribers.
Table A2. List of countries (139, 1984–2020).
AlbaniaEgyptLebanonRussia
AlgeriaEl SalvadorLiberiaSaudi Arabia
AngolaEstoniaLibyaSenegal
ArgentinaEthiopiaLithuaniaSerbia
ArmeniaFinlandLuxembourgSierra Leone
AustraliaFranceMadagascarSingapore
AustriaGabonMalawiSlovakia
AzerbaijanGambiaMalaysiaSlovenia
BahamasGermanyMaliSomalia
BahrainGhanaMaltaSouth Africa
BangladeshGreeceMexicoSpain
BelarusGuatemalaMoldovaSri Lanka
BelgiumGuineaMongoliaSudan
BoliviaGuinea-BissauSerbia-MontenegroSuriname
BotswanaGuyanaMoroccoSweden
BrazilHaitiMozambiqueSwitzerland
BruneiHondurasMyanmarSyria
BulgariaHungaryNamibiaTanzania
Burkina FasoIcelandNetherlandsThailand
CameroonIndiaNew ZealandTogo
CanadaIndonesiaNicaraguaTrinidad and Tobago
ChileIranNigerTunisia
ChinaIraqNigeriaTurkey
ColombiaIrelandNorwayUganda
Congo, DRIsraelOmanUkraine
CongoItalyPakistanUAE
Costa Rica JamaicaPanamaUnited Kingdom
Côte d’IvoireJapanPapua New GuineaUnited States
CroatiaJordanParaguayUruguay
CubaKazakhstanPeruVenezuela
CyprusKenyaPhilippinesVietnam
Czech Republic Korea, DPRPolandYemen
DenmarkKorea South PortugalZambia
Dominican RepublicKuwaitQatarZimbabwe
EcuadorLatviaRomania
Table A3. Descriptive statistics.
VariableMeanStd. Dev.MinMax
Environment
CO2 emissions (metric tons per capita)0.89460.12640.00001.0000
Methane emissions (metric tons of CO2 equivalent per capita)0.95310.07680.00001.0000
Nitrous oxide emissions (metric tons of CO2 equivalent per capita)0.88200.12810.00001.0000
Energy intensity level of primary energy (MJ/$2011 PPP GDP)0.87470.10180.00001.0000
Electricity production from coal sources (% of total)0.83100.25980.00001.0000
Renewable electricity output (% of total electricity output)32.709033.24410.0000100.000
Renewable energy consumption (% of total final energy consumption)32.739230.96610.000098.3429
Fossil fuel energy consumption (% of total)0.32250.28510.00001.0000
Energy use (kg of oil equivalent per capita)0.88730.12860.00001.0000
Social
Access to clean fuels and technologies for cooking (% of population)66.092437.70770.1500100.0000
Access to electricity (% of population)80.632629.83640.5339100.0000
People using safely managed sanitation services (% of population)55.316929.66892.1169100.0000
Life expectancy at birth, total (years)68.46279.809037.083084.3563
Fertility rate, total (births per woman)3.19691.76150.91808.8640
School enrolment—primary (% gross)99.310016.975414.4150165.6450
Government expenditure on education—total (% of government expenditure)14.42064.86800.000047.2787
Governance
Individuals using the internet (% of population)24.463330.33310.0000100.0000
Scientific and technical journal articles12,780.3545,012.210.0000528,263.00
Patent applications—residents12,086.310068,421.95001.00001,400,000
School enrolment—primary and secondary (gross)—gender parity index (GPI)0.96220.10940.41211.2435
Proportion of seats held by women in national parliaments (%)18.182811.24520.000053.2231
Ratio of female to male labor force participation rate (%) (modeled ILO estimate)67.797620.69908.5504107.9940
Economic and political institutions
Corruption0.51570.22080.00001.0000
Civil disorder0.33170.14470.00000.8750
Civil war0.09650.15830.00001.0000
Economic risk rating0.32610.13810.00001.0000
Financial risk rating0.30210.16490.00000.9300
Ethnic tensions0.34430.23150.00001.0000
Religious tensions0.24240.22160.00001.0000
Foreign pressures0.28460.16880.00001.0000
Law and order0.39370.23920.00001.0000
Military in politics0.37990.29960.00001.0000
Macroeconomic variables
Real per capita GDP 11,898.300016,043.580063.0000100,631.0000
Inflation24.8030101.8954−0.7000900.0000
Trade openness0.62870.38560.04004.2391
Table A4. Univariate panel unit root with structural breaks.
VariableLevelGrowth Rate
StatisticEstimated BreaksStatistic Estimated Breaks
Environment
CO2 emissions (metric tons per capita)−9.96611991, 2006−69.66961987, 1990
Methane emissions (metric tons of CO2 equivalent per capita)−26.71121988, 1991−131.17191987, 1990
Nitrous oxide emissions (metric tons of CO2 equivalent per capita)−26.65111991, 1993−81.32951986, 2017
Energy intensity level of primary energy (MJ/$2011 PPP GDP)4.58981986, 1999−39.43481987, 1991
Electricity production from coal sources (% of total)0.14411991, 2000−55.55802014, 2016
Fossil fuel energy consumption (% of total)4.09531991, 2001−62.96632014, 2016
Energy use (kg of oil equivalent per capita)12.02922014, 2016−51.90822014, 2016
Renewable electricity output (% of total electricity output)−10.32012010, 2012−54.90862009, 2011
Renewable energy consumption (% of total final energy consumption)−1.06061994, 1998−55.54541986, 2011
Social
Access to clean fuels and technologies for cooking (% of population)−22.49731989, 1997−68.58771996, 1999
Access to electricity (% of population)13.17742010, 2012−68.69411986, 2011
People using safely managed sanitation services (% of population)11.86001986, 1990−4.71841991, 2000
Life expectancy at birth, total (years)7.14931992, 2002−29.90591993, 2006
Fertility rate, total (births per woman)−4.29571986, 1988−30.13731986, 2017
School enrolment—primary (% gross)1.66251986, 1991−51.40222015, 2017
Government expenditure on education—total (% of government expenditure)−0.13321988, 1992−38.72871986, 1988
Governance
Individuals using the internet (% of population)−6.34052011, 2016−37.24601986, 1988
Scientific and technical journal articles3.37401988, 2000−19.16041986, 2000
Patent applications—residents−23.84762003, 2009−65.95742010, 2014
School enrolment—primary and secondary (gross)—gender parity index (GPI)8.52081986, 1993−43.65421986, 2017
Proportion of seats held by women in national parliaments (%)−2.55751986, 1988−36.95451986, 1988
Ratio of female to male labor force participation rate (%) (modeled ILO estimate)0.07351997, 2008−50.96401986, 2011
Economic and political institutions
Corruption−11.82431986, 1991−51.41981986, 1988
Civil disorder−7.78021988, 1990−26.39811986, 1988
Civil war−3.17891989, 2001−22.00321998, 2000
Economic risk rating−10.02001988, 1986−61.83621986, 1988
Financial risk rating−6.30351986, 2018−61.37411986, 1988
Ethnic tensions−8.09021986, 1991−49.42341986, 1988
Religious tensions−3.96871986, 1988−47.16591986, 1988
Foreign pressures−2.15871999, 2001−22.60341998, 2000
Law and order−15.01051986, 1990−49.64401986, 1988
Military in politics−3.30381986, 1991−52.12511986, 1988
Macroeconomic variables
Real per capita GDP −10.38201999, 2005−47.93152008, 2011
Inflation−18.21391988, 1994−55.24541989, 1992
Trade openness−27.60531987, 1998−68.53631987, 1989
Table A5. Pearson correlation matrix of independent variables.
Variables(1)(2)(3)(4)(5)(6)(7)(8)(9)(10)(11)(12)(13)(14)
(1)ESG1
(2)Corruption−0.6484 *1
(3)Civil disorder−0.5520 *0.5133 *1
(4)Civil war−0.3565 *0.4118 *0.3469 *1
(5)Economic risk rating−0.3966 *0.3433 *0.4640 *0.3907 *1
(6)Financial risk rating−0.00790.2703 *0.1759 *0.1688 *0.6940 *1
(7)Ethnic tensions−0.14680.3357 *0.2675 *0.4241 *0.2849 *0.3542 *1
(8)Religious tensions−0.2861 *0.3343 *0.2637 *0.4559 *0.1372 *0.1777 *0.4081 *1
(9)Foreign pressures−0.12950.3541 *0.2863 *0.4418 *0.3085 *0.1394 *0.1863 *0.2196 *1
(10)Law and order−0.6395 *0.6322 *0.5801 *0.3753 *0.5059 *0.4859 *0.4893 *0.3269 *0.2565 *1
(11)Military in politics−0.6712 *0.5894 *0.4764 *0.6033 *0.4734 *0.4591 *0.4149 *0.4143 *0.4658 *0.6459 *1
(12)Real per capita GDP 0.7185 *−0.6037 *−0.5320 *−0.3295 *−0.5171 *−0.3091 *−0.2435 *−0.2345 *−0.2510 *−0.6145 *−0.5390 *1
(13)Inflation−0.3120 *0.0730 *0.0894 *0.1802 *0.3647 *0.2939 *0.0795 *0.01110.1836 *0.1720 *0.1560 *−0.1305 *1
(14)Trade openness0.1324−0.023−0.2247 *−0.1713 *−0.2336 *−0.1357 *−0.1078 *−0.0741 *−0.1607 *−0.1265 *−0.2130 *0.1219 *0.00141
Note: * significant at 1%.
Table A6. Sequential test for multiple breaks at unknown breakpoints.
Variable ESGEnvironment Social Governance Bai and Perron Critical Values
Test Statistic1%5%10%
F(1|0)32.4322.2535.3530.0412.298.587.04
F(2|1)6.886.5121.7225.6213.8910.138.51
F(3|2)2.756.326.977.4514.8011.149.41
F(4|3)1.703.142.866.8315.2811.8310.04
F(5|4)0.681.291.962.5615.7612.2510.58
Breakpoints estimation
Estimated BreakpointsESGEnvironmentSocialGovernance
201020102004,
2010
2010,
2015
SSR213.39198.84259.29299.75
[95% Conf. Interval][2008, 2012][2008, 2012][2003, 2005]
[2008, 2012]
[2008, 2012]
[2013, 2017]
Table A7. Two-stage least squares (2SLS) estimation for ESG.
VariableFull SampleBefore 2010After 2010
(1)(2)(3)
Economic and political institutions
Corruption−0.6943 **
(0.3312)
−1.0346 ***
(0.3122)
0.7974
(0.5003)
Civil disorder0.3769
(0.2370)
−0.2651
(0.2589)
−0.1527
(0.2948)
Civil war−0.4461
(0.4268)
−0.6528
(0.4725)
0.3576
(0.4010)
Economic risk rating0.5779
(0.4773)
0.4469
(0.4956)
−0.2894
(0.5360)
Financial risk rating−2.0347 ***
(0.4787)
−1.6884 ***
(0.5473)
−1.6525 ***
(0.5499)
Ethnic tensions−0.3245
(0.4971)
−0.8268 *
(0.4829)
−1.3680
(0.8744)
Religious tensions0.0476
(0.3649)
−0.0667
(0.3473)
0.8772
(0.8869)
Foreign pressures−0.9994 ***
(0.2789)
−1.0527 ***
(0.2773)
−0.2644
(0.6395)
Law and order−0.0950
(0.4075)
−0.8699 **
(0.4103)
−1.4464
(0.9298)
Military in politics−0.1393
(0.4965)
−1.5020 ***
(0.5177)
−0.1834
(0.8767)
Macroeconomic variables
Real per capita GDP 0.0192 ***
(0.0026)
0.0198 ***
(0.0034)
0.0221 ***
(0.0066)
Inflation−0.0272 ***
0.0065
−0.0085
(0.0063)
−0.0075
(0.0102)
Trade openness0.8941 ***
0.2502
0.8825 ***
(0.2880)
−0.3760
(0.3570)
Constant −0.7437 **
0.3682
−0.5346
(0.3677)
0.5386
(0.6246)
Adjusted R-squared0.47150.67570.5541
Observations830
Asterisks denote statistical significance at the 1% (***), 5% (**), and 10% (*) level.
Table A8. Two-stage least squares (2SLS) estimation for environment.
VariableFull SampleBefore 2010After 2010
(1)(2)(3)
Economic and political institutions
Corruption−0.3247 ***
(0.0926)
−0.2542 ***
(0.0894)
−0.1848
(0.2348)
Civil disorder−0.1888 ***
(0.0644)
0.0373
(0.0675)
−0.0569
(0.1348)
Civil war−0.0252
(0.0784)
−0.0225
(0.0792)
0.1729
(0.1756)
Economic risk rating0.0442
(0.1230)
0.2049
(0.1326)
−0.4284 **
(0.2051)
Financial risk rating−1.3072 ***
(0.1133)
−0.8483 ***
(0.1249)
−0.5224 **
(0.2568)
Ethnic tensions0.1344
(0.0924)
0.0950
(0.0847)
−1.1254 **
(0.5373
Religious tensions−0.1675 *
(0.0923)
−0.1875 **
(0.0871)
−0.4859
(0.3496)
Foreign pressures−0.0377
(0.0660)
−0.1144 *
(0.0669)
0.1670
(0.1811)
Law and order−0.4086 ***
(0.1193)
−0.2297 **
(0.1152)
−0.9751 ***
(0.3719)
Military in politics0.0828
(0.1106)
−0.1792
(0.1114)
−1.4320 ***
(0.3830)
Macroeconomic variables
Real per capita GDP 0.0104 ***
(0.0009)
0.0065 ***
(0.0013)
0.0026
(0.0035)
Inflation−0.0003 *
(0.0002)
−0.0005 ***
(0.0002)
−0.0018
(0.0037)
Trade openness0.1065 *
(0.0564)
−0.0919
(0.0622)
−0.0378
(0.1199)
Constant −0.7955
(0.1591)
−0.5454 ***
(0.1608)
−1.1613
(0.3147)
Adjusted R-squared0.46280.56310.5572
Observations1345
Asterisks denote statistical significance at the 1% (***), 5% (**), and 10% (*) level.
Table A9. Two-stage least squares (2SLS) estimation for social.
VariableFull SampleBefore 2004After 2004 and before 2010After 2010
(1)(2)(3)(4)
Economic and political institutions
Corruption−0.3912 ***
(0.1444)
−0.0364 ***
(0.0142)
−0.8467 ***
(0.2364)
−0.3554
(0.2741)
Civil disorder−0.4574 ***
(0.0976)
0.1638
(0.1197)
−0.4499 ***
(0.1382)
−0.5417 ***
(0.1830)
Civil war−0.1905
(0.1685)
−0.1104
(0.2394)
−0.2853
(0.2518)
−0.3159
(0.2492)
Economic risk rating0.0092
(0.1786)
−0.6260
(0.5065)
0.3164
(0.2054)
−0.0831
(0.2304)
Financial risk rating−0.6258 ***
(0.1873)
−0.2663
(0.4145)
−0.2671
(0.2618)
−0.5720 **
(0.2803)
Ethnic tensions−0.4633 **
(0.1962)
−0.1611
(0.2403)
−0.8631 **
(0.3832)
−2.5465 ***
(0.5750)
Religious tensions0.1434
(0.1462)
−0.4383 *
(0.2531)
−0.5250 **
(0.2475)
0.6201
(0.5267)
Foreign pressures−0.3038 ***
(0.1180)
0.1466
(0.1481)
−0.3770 **
(0.1623)
0.1374
(0.3895)
Law and order−0.0138
(0.1694)
0.0324
(0.1591)
−0.3992 *
(0.2409)
−2.1465 ***
(0.5337)
Military in politics0.0435
(0.2111)
−0.8656 **
(0.3629)
−1.1190 ***
(0.3168)
−0.9050 **
(0.3805)
Macroeconomic variables
Real per capita GDP 0.0070 ***
(0.0011)
0.0069 *
(0.0039)
0.0032 *
(0.0018)
0.0020
(0.0031)
Inflation−0.0004
(0.0007)
0.0015
(0.0036)
0.0026
(0.0028)
−0.0006
(0.0005)
Trade openness−0.0034
(0.0985)
0.1690
(0.2073)
0.2258 *
(0.1266)
0.7809 ***
(0.1784)
Constant 0.4010 **
(0.1927)
0.7206 **
(0.2819)
1.5804 ***
(0.2378)
2.5180 ***
(0.3358)
Adjusted R-squared0.59180.61830.65210.6725
Observations870
Asterisks denote statistical significance at the 1% (***), 5% (**), and 10% (*) level.
Table A10. Two-stage least squares (2SLS) estimation for governance.
VariableFull SampleBefore 2010After 2010 and before 2015After 2015
(1)(2)(3)(4)
Economic and political institutions
Corruption−0.8563 ***
(0.2624)
−0.6286 ***
(0.1814)
0.7251
(0.6315)
0.0525
(0.7534)
Civil disorder−0.7149 ***
(0.2078)
−0.2111
(0.1616)
0.0584
(0.3201)
−0.4811
(0.4503)
Civil war−1.1385 ***
(0.2776)
0.0959
(0.2052)
−0.9367 **
(0.4567)
−0.2761
(0.6522)
Economic risk rating0.3440
(0.3958)
−0.8047 **
(0.3507)
−1.2037 *
(0.6907)
−0.9712
(0.8724)
Financial risk rating−1.6486 ***
(0.4189)
−1.4828 ***
(0.3813)
−1.1777 *
(0.6317)
−1.2274
(0.8530)
Ethnic tensions0.4079
(0.3586)
−0.0030
(0.2683)
−1.2046
(0.7635)
−0.0913
(0.8695)
Religious tensions−0.3511
(0.3160)
−0.0878
(0.2202)
0.9342
(0.7714)
−1.6536 *
(0.8756)
Foreign pressures0.3668
(0.2283)
−0.6019 ***
(0.1633)
−0.4682
(0.4797)
0.4729
(0.6961)
Law and order−1.3463 ***
(0.3114)
−0.2856
(0.2487)
0.6477
(0.6883)
0.3547
(0.8953)
Military in politics−0.8036 **
(0.3167)
−0.4870 **
(0.2325)
−1.7164 **
(0.7716)
−0.1432
(0.9791)
Macroeconomic variables
Real per capita GDP 0.0415 ***
(0.0027)
0.0321 ***
(0.0028)
0.0373 ***
(0.0077)
0.0242 ***
(0.0076)
Inflation−0.0201 ***
(0.0046)
−0.0073 **
(0.0031)
−0.0038
(0.0066)
0.0127
(0.0108)
Trade openness0.3333 *
(0.1767)
0.6310 ***
(0.1812)
−1.1070
(0.3537)
−0.0799
(0.3724)
Constant −0.4030
(0.2676)
−0.6062 ***
(0.2228)
0.5158
(0.6144)
1.0750 *
(0.6192)
Adjusted R-squared0.43890.55360.57620.5492
Observations1112
Asterisks denote statistical significance at the 1% (***), 5% (**), and 10% (*) level.

References

  1. Steenkamp, J.B.E. The Role of National Culture in International Marketing Research. Int. Mark. Rev. 2001, 18, 30–44. [Google Scholar] [CrossRef]
  2. Landi, G.C.; Iandolo, F.; Renzi, A.; Rey, A. Embedding Sustainability in Risk Management: The Impact of Environmental, Social, and Governance Ratings on Corporate Financial Risk. Corp. Soc. Responsib. Environ. Manag. 2022, 29, 1096–1107. [Google Scholar] [CrossRef]
  3. Zhang, W.; He, X.; Hamori, S. Volatility Spillover and Investment Strategies among Sustainability-related Financial Indexes: Evidence from the DCC-GARCH-based Dynamic Connectedness and DCC-GARCH t-copula approach. Int. Rev. Financ. Anal. 2022, 83, 102223. [Google Scholar] [CrossRef]
  4. Pelos, M.E.; Schmergel, C.E. Board Oversight in ESG-Evolving Trends in the Era of Increasing Disclosure Requirements. Environ. Law Rev. 2022, 52, 10637–10640. [Google Scholar]
  5. Sulkowski, A.; Jebe, R. Evolving ESG Reporting Governance, Regime Theory, and Proactive Law: Predictions and Strategies. Am. Bus. Law J. 2022, 59, 449–503. [Google Scholar] [CrossRef]
  6. Elkington, J. Towards the Sustainable Corporation: Win-Win-Win Business Strategies for Sustainable Development. Calif. Manag. Rev. 1994, 36, 90–100. [Google Scholar] [CrossRef]
  7. Chang, K.; Kim, I.; Li, Y. The Heterogeneous Impact of Corporate Social Responsibility Activities that Target Different Stakeholders. J. Bus. Ethics 2014, 125, 211–234. [Google Scholar] [CrossRef]
  8. Eccles, R.G.; Ioannou, I.; Serafeim, G. The Impact of a Corporate Culture of Sustainability on Corporate Behavior and Performance; National Bureau of Economic Research: Cambridge, MA, USA, 2012; Volume 17950, pp. 113–127. [Google Scholar]
  9. Bassen, A.; Senkl, D. ESG-environmental, social, governance issues. Betriebswirtschaft 2011, 71, 506. [Google Scholar]
  10. Meier, S.; Cassar, L. Stop Talking about How CSR Helps Your Bottom Line. Harvard Business Review 31. 2018. Available online: https://hbr.org/2018/01/stop-talking-about-how-csr-helps-your-bottom-line (accessed on 25 April 2023).
  11. Boerner, H. Sustainability Reports Published in 2020, G&A Institute. 2021. Available online: https://www.ga-institute.com/2021-sustainability-reporting-in-focus.html (accessed on 25 April 2023).
  12. Daugaard, D.; Ding, A. Global Drivers for ESG Performance: The Body of Knowledge. Sustainability 2022, 14, 2322. [Google Scholar] [CrossRef]
  13. Hossain, M.; Reaz, M. The determinants and characteristics of voluntary disclosure by Indian banking companies. Corp. Soc. Responsib. Environ. Manag. 2007, 14, 274–288. [Google Scholar] [CrossRef]
  14. Baldini, M.; Dal Maso, L.; Liberatore, G.; Mazzi, F.; Terzani, S. Role of Country- and Firm-Level Determinants in Environmental, Social, and Governance Disclosure. J. Bus. Ethics 2018, 150, 79–98. [Google Scholar] [CrossRef]
  15. Moura-Leite, R.C.; Padgett, R.C.; Galan, J.I. Is Social Responsibility driven by industry or firm-specific factors? Manag. Decis. 2012, 50, 1200–1221. [Google Scholar] [CrossRef]
  16. Short, J.L.; Toffel, M.W.; Hugill, A.R. Monitoring Global Supply Chains. Strateg. Manag. J. 2016, 37, 1878–1897. [Google Scholar] [CrossRef]
  17. Eliwa, Y.; Aboud, A.; Saleh, A. ESG Practices and the Cost of Debt: Evidence from EU countries. Crit. Perspect. Account. 2019, 79, 102097. [Google Scholar] [CrossRef]
  18. Campbell, J.L. Why Would Corporations Behave in Socially Responsible Ways? An Institutional Theory of corporate social responsibility. Acad. Manag. Rev. 2007, 32, 946–967. [Google Scholar] [CrossRef]
  19. Abdul Rahman, R.; Alsayegh, M.F. Determinants of Corporate Environment, Social and Governance (ESG) Reporting among Asian Firms. J. Risk Financ. Manag. 2021, 14, 167. [Google Scholar] [CrossRef]
  20. Li, T.-T.; Wang, K.; Sueyoshi, T.; Wang, D.D. ESG: Research Progress and Future Prospects. Sustainability 2022, 13, 11663. [Google Scholar] [CrossRef]
  21. Anita, M.; Shveta, S.; Surendra, Y.S.; Arvind, M. When do ESG Controversies Reduce Firm Value in India? Glob. Financ. J. 2023, 55, 100809. [Google Scholar] [CrossRef]
  22. Coombs, W.T.; Holladay, S.J. Communication and Attributions in a Crisis: An experimental Study in Crisis Communication. J. Public Relat. Res. 1996, 8, 279–295. [Google Scholar] [CrossRef]
  23. Fatemi, A.; Fooladi, I.J.; Wheeler, D. The Relative Valuation of Socially Responsible Firms: An Exploratory Study. In Finance for a Better World: The Shift towards Sustainability; de Bettingnies, H.-C., L’epineux, F., Eds.; Palgrave Macmillan: London, UK, 2009; pp. 140–167. [Google Scholar]
  24. Barreto, I.; Baden-Fuller, C. To Conform or to Perform? Mimetic Behaviour, Legitimacy-Based Groups and Performance Consequences. J. Manag. 2006, 43, 1559–1581. [Google Scholar] [CrossRef]
  25. Boufounou, P.; Moustairas, I.; Toudas, K.; Malesios, C. ESGs and Customer Choice: Some Empirical Evidence. Circ. Econ. Sustain. 2023. [Google Scholar] [CrossRef] [PubMed]
  26. Cheng, B.; Ioannou, I.; Serafeim, G. Corporate Social Responsibility and Access to Finance. Strateg. Manag. J. 2014, 35, 1–23. [Google Scholar] [CrossRef]
  27. Dhaliwal, D.S.; Radhakrishnan, S.; Tsang, A.; Yang, Y.G. Nonfinancial Disclosure and Analyst Forecast Accuracy: International Evidence on Corporate Social Responsibility Disclosure. Account. Rev. 2012, 87, 723–759. [Google Scholar] [CrossRef]
  28. Attig, N.; El Ghoul, S.; Guedhami, O.; Suh, J. Corporate Social Responsibility and Credit Ratings. J. Bus. Ethics 2013, 117, 679–694. [Google Scholar] [CrossRef]
  29. El Ghoul, S.; Guedhami, O.; Kwok, C.C.; Mishra, D.R. Does Corporate Social Responsibility Affect the Cost of Capital? J. Bank. Financ. 2011, 35, 2388–2406. [Google Scholar] [CrossRef]
  30. Albinger, H.S.; Freeman, S.J. Corporate Social Performance and Attractiveness as an Employer to Different Job Seeking Populations. J. Bus. Ethics 2000, 28, 243–253. [Google Scholar] [CrossRef]
  31. Sciarelli, M.; Cosimato, S.; Landi, G.; Iandolo, F. Socially Responsible Investment Strategies for the Transition towards Sustainable Development: The Importance of Integrating and Communicating ESG. TQM J. 2021, 33, 39–56. [Google Scholar] [CrossRef]
  32. Sciarelli, M.; Tani, M.; Landi, G.; Turriziani, L. CSR Perception and Financial Performance: Evidences from Italian and UK Asset Management Companies. Corp. Soc. Responsib. Environ. Manag. 2020, 27, 841–851. [Google Scholar] [CrossRef]
  33. Palazzo, G.; Richter, U. CSR Business as Usual? The Case of the Tobacco Industry. J. Bus. Ethics 2005, 61, 387–401. [Google Scholar] [CrossRef]
  34. Jin, L.; Myers, S. R2 around the world: New theory and new tests. J. Financ. Econ. 2006, 79, 257–292. [Google Scholar] [CrossRef]
  35. El Khoury, R.; Nasrallah, N.; Alareeni, B. The Determinants of ESG in the Banking Sector of MENA region: A Trend or Necessity? Compet. Rev. Int. Bus. J. 2023, 33, 7–29. [Google Scholar] [CrossRef]
  36. Rezaee, Z.; Homayoun, S.; Poursoleyman, E.; Rezaee, N. Comparative Analysis of Environmental, Social, and Governance Disclosures. Glob. Financ. J. 2023, 55, 100804. [Google Scholar] [CrossRef]
  37. Grewal, J.; Hauptmann, C.; Serafeim, G. Material sustainability information and stock price informativeness. J. Bus. Ethics 2020, 171, 513–544. [Google Scholar] [CrossRef]
  38. Grewal, J.; Riedl, E.J.; Serafeim, G. Market reaction to mandatory nonfinancial disclosure. Manag. Sci. 2019, 65, 2947–3448. [Google Scholar] [CrossRef]
  39. Ioannou, I.; Serafeim, G. The consequences of mandatory corporate sustainability reporting. In The Oxford Handbook of Corporate Social Responsibility: Psychological and Organizational Perspectives; Oxford University Press: Oxford, UK, 2019; pp. 452–489. [Google Scholar]
  40. Alareeni, B.A.; Hamdan, A. ESG Impact on Performance of US S&P 500-listed firms. Corp. Gov. 2020, 20, 1409–1428. [Google Scholar]
  41. Santamaria, R.; Paolone, F.; Cucari, N.; Dezi, L. Non-financial Strategy Disclosure and Environmental, Social and Governance Score: Insight from a Configurational Approach. Bus. Strategy Environ. 2021, 30, 1993–2007. [Google Scholar] [CrossRef]
  42. European Parliament and the Council of the European Union. Directive (EU) 2022/2464 of the European Parliament and of the Council amending Regulation (EU) No 537/2014, Directive 2004/109/EC, Directive 2006/43/EC and Directive 2013/34/EU, as Regards Corporate Sustainability Reporting. Off. J. Eur. Union 2022, 322, 15–80. Available online: https://eur-lex.europa.eu/legal-content/EN/TXT/?uri=CELEX%3A32022L2464 (accessed on 28 August 2023).
  43. Fiechter, P.; Hitz, J.M.; Lehmann, N. Real Effects of a Widespread ESG Reporting Mandate: Evidence from the European Union’s ESG directive. J. Account. Res. 2022, 60, 1499–1549. [Google Scholar] [CrossRef]
  44. European Union (EU). Directive 2014/95/EU. Directive 2014/95/EU of the European Parliament and of the Council Amending Directive 2013/34/EU as Regards Disclosure of Non-Financial and Diversity Information by Certain Large Undertakings and Groups. 2022. Available online: https://eur-lex.europa.eu/legal-content/ (accessed on 25 April 2023).
  45. Christensen, D.M.; Serafeim, G.; Sikochi, A. Why is Corporate Virtue in the Eye of the Beholder? The Case of ESG ratings. Account. Rev. 2022, 97, 147–175. [Google Scholar] [CrossRef]
  46. Lu, H.; Peng, Q.; Shin, J.E.; Yu, L. Migration of Global Supply Chains: A Real Effect of Mandatory ESG Disclosure; Working paper; University of Toronto: Toronto, ON, USA, 2022. [Google Scholar]
  47. Zhang, Q.; Ding, R.; Chen, D.; Zhang, X. The Effects of Mandatory ESG Disclosure on Price Discovery Efficiency around the World; Working paper; University of Sussex Business School: Brighton, UK, 2022; Available online: https://papers.ssrn.com/sol3/papers.cfm?abstract_id=4308420 (accessed on 25 April 2023).
  48. Mbanyele, B.; Huang, H.; Li, Y.; Muchenje, H.; Wang, F. Corporate Social Responsibility and Green Innovation: Evidence from Mandatory CSR disclosure laws. Econ. Lett. 2022, 21, 110322. [Google Scholar] [CrossRef]
  49. Krueger, P.; Sauter, Z.; Yongjun Tang, D.; Zhong, R. The Effects of Mandatory ESG Disclosure around the World; Research Paper Series N 21-44; Swiss Finance Institute: Zürich, Switzerland, 2023. [Google Scholar]
  50. Bai, X.; Han, J.; Ma, Y.; Zhang, W. ESG Performance, Institutional Investors’ Preference and Financing Constraints: Empirical Evidence from China. Borsa Istanbul Review. 2022. Available online: https://www.elsevier.com/journals/borsa-istanbul-review/2214-8450 (accessed on 25 April 2023).
  51. Sun, Y.; Xu, C.; Ding, R.; Cao, Y. Does Innovation in Environmental, Social, and Governance Disclosures Pay off in China? An Integrated Reporting Perspective, Borsa Istanbul Review. 2023. Available online: https://www.elsevier.com/journals/borsa-istanbul-review/2214-8450g (accessed on 26 January 2023).
  52. Bischoff, B. Anti-ESG Legislation in the USA: Emerging Risk for Financial Institutions? 2022. Available online: https://www.ecofact.com/blog/anti-esg-legislation-in-the-usa-emerging-risk-for-financial-institutions/ (accessed on 26 January 2023).
  53. Sorkin, A.R.; Giang, V.; Gandel, S.; Warner, B.; de la Merced, M.J.; Hirsch, L.; Livni, E. BlackRock Seeks to Defend Its Reputation Over E.S.G. Fight The World’s Largest Money Manager Fired off a Letter to Attorneys General in 19 States Rebutting Claims about Its Position on Climate-Minded Investing. The New York Times. 2022/09/08. Available online: https://www.nytimes.com/2022/09/08/business/dealbook/blackrock-texas-defend-reputation-esg-fight.html (accessed on 26 January 2023).
  54. Smart, T. The New Front of the Culture Wars for GOP Governors: ESG Investing, Florida’s Ron DeSantis is the Latest GOP Governor to Take on ‘Woke’ Wall Street. 13 September 2022. Available online: https://www.usnews.com/news/politics/articles/2022-09-13/the-new-front-of-the-culture-wars-for-gop-governors-esg-investing (accessed on 29 January 2023).
  55. Ramírez-Orellana, A.; Martínez-Victoria, M.C.; García-Amate, A.; Rojo-Ramírez, A.A. Is the Corporate Financial Strategy in the Oil and Gas Sector Affected by ESG Dimensions? Resour. Policy 2023, 81, 103303. [Google Scholar] [CrossRef]
  56. International Energy Agency. World Energy Outlook 2021. 2021. Available online: https://www.eia.gov/pressroom/presentations/AEO2021_Release_Presentation.pdf (accessed on 25 April 2023).
  57. Shiu, Y.M.; Yang, S.L. Does Engagement in Corporate Social Responsibility Provide Strategic Insurance-like Effects? Strateg. Manag. J. 2017, 38, 455–470. [Google Scholar] [CrossRef]
  58. Godfrey, P.C. The Relationship Between Corporate Philanthropy and Shareholder Wealth: A Risk Management Perspective. Acad. Manag. Rev. 2005, 30, 777–798. [Google Scholar] [CrossRef]
  59. Minor, D.; Morgan, J. CSR as Reputation Insurance: Primum non-nocere. Calif. Manag. Rev. 2011, 53, 40–59. [Google Scholar] [CrossRef]
  60. Aono, K.; Okimoto, T. When Does the Japan Empowering Women Index Outperform its Parent and the ESG Select Leaders Indexes? Int. Rev. Financ. Anal. 2023, 85, 102428. [Google Scholar] [CrossRef]
  61. Ellouze, D. The Role of Customers and Employees in the Buffer Effect of Corporate Social Responsibility in Times of Crisis. Manag. Financ. 2020, 46, 955–975. [Google Scholar] [CrossRef]
  62. Lins, K.V.; Servaes, H.; Tamayo, A. Social Capital, Trust, and Firm Performance: The Value of Corporate Social Responsibility During the Financial Crisis. J. Financ. 2017, 72, 1785–1824. [Google Scholar] [CrossRef]
  63. Zhang, L.; Shan, Y.G.; Chang, M. Can CSR Disclosure Protect Firm Reputation During Financial Restatements? J. Bus. Ethics 2021, 173, 157–184. [Google Scholar] [CrossRef]
  64. Guimarães, T.M.; Malaquias, R.D. Performance of Equity Mutual Funds considering ESG investments, Financial Constraints, and the COVID-19 Pandemic. Braz. Bus. Rev. 2023, 20, 18–37. [Google Scholar] [CrossRef]
  65. Becchetti, L.; Ciciretti, R.; Dalò, A.; Herzel, S. Socially Responsible and Conventional Investment Funds: Performance Comparison and the Global Financial Crisis. J. Appl. Econ. 2015, 47, 2541–2562. [Google Scholar] [CrossRef]
  66. Nofsinger, J.; Varma, A. Socially Responsible Funds and Market Crises. J. Bank. Financ. 2014, 48, 180–193. [Google Scholar] [CrossRef]
  67. Cai, Y.; Jo, H.; Pan, C. Doing Well While Doing Bad? CSR in Controversial Industry Sectors. J. Bus. Ethics 2012, 108, 467–480. [Google Scholar] [CrossRef]
  68. Yuan, X.; Li, Z.; Xu, J.; Li, S. ESG Disclosure and Corporate Financial Irregularities—Evidence from Chinese listed firms. J. Clean. Prod. 2022, 332, 129992. [Google Scholar] [CrossRef]
  69. Liu, L.; Xu, Y.; Rao, P.; Chen, Y. The Contagion Effects of Irregularities Within Business Groups. J. Financ. Res. 2019, 468, 113–131. [Google Scholar]
  70. Ye, K.; Cao, F.; Wang, H. Can Internal Control Information Disclosure Reduce Stock Price Crash Risk? J. Financ. Res. 2015, 416, 192–206. [Google Scholar]
  71. Fombrun, C.; Shanley, M. What’s in a Name? Reputation Building and Corporate Strategy. Acad. Manag. J. 1990, 33, 233–258. [Google Scholar] [CrossRef]
  72. Wang, Y.; Chen, L.; Jin, S. Environmental Performance, Social Responsibility and Corporate Governance (ESG) Ratings and Financial Risk. Environ. Eng. Manag. J. 2022, 21, 857–868. Available online: http://www.eemj.eu (accessed on 25 April 2023).
  73. Orlitzky, M.; Benjamin, J.D. Corporate Social Performance and Firm Risk: A Meta-Analytic Review. Bus. Soc. 2001, 40, 369–396. [Google Scholar] [CrossRef]
  74. La Torre, M.; Mango, F.; Cafaro, A.; Leo, S. Does the ESG Index Affect Stock Return? Evidence, from the Eurostoxx50. Sustainability 2020, 12, 6387. [Google Scholar] [CrossRef]
  75. Champagne, C.; Coggins, F.; Sodjahin, A. Can extra-financial ratings serve as an indicator of ESG risk? Glob. Financ. J. 2022, 54, 100638. [Google Scholar] [CrossRef]
  76. Sabbaghi, O. The Impact of News on the Volatility of ESG firms. Glob. Financ. J. 2022, 51, 100570. [Google Scholar] [CrossRef]
  77. Kanouse, D.E.; Hansen, L.R., Jr. Negativity in evaluations. In Attribution: Perceiving the Causes of Behavior; Jones, E.E., Kanouse, D.E., Kelley, H.H., Nisbett, R.E., Valin, S., Weiner, B., Eds.; General Learning Press: Morristown, NJ, USA, 1971; pp. 47–62. [Google Scholar]
  78. Peeters, G. The Positive-Negative Asymmetry: On Cognitive Consistency and Positivity Bias. Eur. J. Soc. Psychol. 1971, 1, 455–474. [Google Scholar] [CrossRef]
  79. Peeters, G.; Czapinski, J. Positive-negative Asymmetry in Evaluations: The Distinction between Affective and Informational Negativity Effects. Eur. Rev. Soc. Psychol. 1990, 1, 33–60. [Google Scholar] [CrossRef]
  80. Akhtar, S.; Faff, R.; Oliver, B.; Subrahmanyam, A. The Power of Bad: The Negativity Bias in Australian Consumer Sentiment Announcements on Stock Returns. J. Bank. Financ. 2011, 35, 1239–1249. [Google Scholar] [CrossRef]
  81. Ioannou, I.; Serafeim, G. What drives corporate social performance? The role of nation-level institutions. J. Int. Bus. Stud. 2012, 43, 834–864. [Google Scholar] [CrossRef]
  82. Hoang, K. Silent but deadly: Political corruption and voluntary ESG disclosure in the United States. Manag. Decis. Econ. 2022, 43, 2775–2793. [Google Scholar] [CrossRef]
  83. Malesky, E.J.; Nguyen, T.V.; Bach, T.N.; Ho, B.D. The Effect of Market Competition on Bribery in Emerging Economies: An Empirical Analysis of Vietnamese Firms. World Dev. 2020, 131, 104957. [Google Scholar] [CrossRef]
  84. Houqe, M.; Monem, R. IFRS Adoption, Extent of Disclosure, and Perceived Corruption: A cross–country study. Int. J. Account. 2016, 51, 363–378. [Google Scholar] [CrossRef]
  85. Agyei-Mensah, B.K.; Buertey, S. The Effect of Corruption And Culture On Corporate Social Performance: An Empirical Study. Soc. Responsib. J. 2019, 15, 1071–1086. [Google Scholar] [CrossRef]
  86. Quinson, T. Bank of America: Food Shocks Will Destabilise ESG. 21 May 2022. Available online: https://quota.media/food-shocks-will-also-destabilise-esg/ (accessed on 30 January 2023).
  87. Quinson, T. Food Shocks Will Also Destabilize the ESG World. 18 May 2022. Available online: https://www.bloomberg.com/news/articles/2022-05-18/food-shocks-will-also-destabilize-the-esg-world-green-insight?leadSource=uverify%20wall (accessed on 30 January 2023).
  88. Investment Officer. Goldman Sachs: ESG Implications of Russia-Ukraine Conflict. 2022. Available online: https://www.investmentofficer.nl/partners/goldman-sachs-asset-management/goldman-sachs-esg-implications-russia-ukraine-conflict-0 (accessed on 30 January 2023).
  89. Engler, H.U.S. Social Unrest Presents Opportunities for Firms to Enhance ESG Credentials, Bolster Ties with other Stakeholders Financial Regulatory Forum. 9 June 2020. Available online: https://jp.reuters.com/article/bc-finreg-social-unrest-esg-enhance-cred-idUSKBN23C2T8 (accessed on 30 January 2023).
  90. Granger, C.W.J.; Newbold, P. Spurious regressions in econometrics. J. Econom. 1974, 2, 111–120. [Google Scholar] [CrossRef]
  91. Karavias, Y.; Tzavalis, E. Testing for unit roots in short panels allowing for a structural break. Comput. Stat. Data Anal. 2014, 76, 391–407. [Google Scholar] [CrossRef]
  92. Perron, P. The Great Crash, the Oil Price Shock, and the Unit Root Hypothesis. Econometrica 1989, 57, 1361–1401. [Google Scholar] [CrossRef]
  93. Karavias, Y.; Narayan, P.K.; Westerlund, J. Structural Breaks in Interactive Effects Panels and the Stock Market Reaction to COVID-19. J. Bus. Econ. Stat. 2022, 41, 653–666. [Google Scholar] [CrossRef]
  94. Wooldridge, J. Multiplicative Panel Data Models without the Strict Exogeneity Assumption. Econom. Theory 1997, 13, 667–678. [Google Scholar] [CrossRef]
  95. Abdallah, W.; Goergen, M.; O’Sullivan, S.N. Endogeneity: How Failure to Correct for it can Cause Wrong Inferences and Some Remedies. Br. J. Manag. 2015, 26, 791–804. [Google Scholar] [CrossRef]
  96. Bai, B.; Perron, P. Estimating and Testing Linear Models with Multiple Structural Changes. Econometrica 1998, 66, 47–78. [Google Scholar] [CrossRef]
  97. Ditzen, J.; Karavias, Y.; Westerlund, J. Testing for Multiple Structural Breaks in Panel Data. arXiv 2021. Available online: https://arxiv.org/pdf/2110.14550.pdf (accessed on 25 April 2023).
  98. Capelle-Blancard, G.; Crifo, P.; Oueghlissi, R.; Scholtens, B. Environmental, Social and Governance (ESG) Performance and Sovereign Bond Spreads: An Empirical Analysis of OECD Countries; Working Paper; Université de Paris Ouest Nanterre La Défense: Nanterre, France, 2017; Volume 2017, pp. 1–56. [Google Scholar]
  99. Nicoletti, G.; Scarpetta, S.; Boylaud, O. Summary Indicators of Product and Market Regulation with an Extension to Employment Protection Legislation. 2000. Available online: www.oecd.org/eco/eco (accessed on 25 April 2023).
  100. Tabachnick, B.G.; Fidell, L.S. Using Multivariate Statistics, 5th ed.; Pearson Education: Boston, MA, USA, 2007. [Google Scholar]
  101. Chan, F.H.; Frey, B.; Skali, A.; Torgler, B. Political Entrenchment and GDP Misreporting; CREMA Working Paper Series 2019–02; Center for Research in Economics, Management and the Arts (CREMA): Zurich, Switzerland, 2019. [Google Scholar]
  102. Abed, G.; Gupta, S. Governance, Corruption, and Economic Performance; International Monetary Fund: Washington, DC, USA, 2003. [Google Scholar]
  103. Durlauf, S.; Kourtellos, A.; Tan, C.M. Are any growth theories robust. Econ. J. 2008, 118, 329–346. [Google Scholar] [CrossRef]
  104. Krambia-Kapardis, M.; Stylianou, I.; Dimitriou, S. Nonlinear nexus between corruption and tourism arrivals: A global analysis. Empir. Econ. J. 2022, 63, 1997–2024. [Google Scholar] [CrossRef]
  105. Yadav, V.; Mukherjee, B. The Politics of Corruption in Dictatorships; Cambridge University Press: New York, NY, USA, 2016. [Google Scholar]
  106. Galbreath, J. ESG in Focus: The Australian Evidence. J. Bus. Ethics 2013, 118, 529–541. [Google Scholar] [CrossRef]
  107. Nicholson, G.; Kiel, G.; Kiel-Chisholm, S. The Contribution of Social Norms to the Global Financial Crisis: A Systemic Actor Focused Model and Proposal for Regulatory Change. Corp. Gov. Int. Rev. 2011, 19, 471–488. [Google Scholar] [CrossRef]
  108. Schapiro, M. SEC Issues Interpretive Guidance on Disclosure Related to Business or Legal Developments Regarding Climate Change. 2010. Available online: https://www.sec.gov/news/speech/2010/spch012710mls-climate.htm (accessed on 25 April 2023).
  109. Krambia-Kapardis, M. Corporate Fraud and Corruption: A Holistic Approach to Preventing Financial Crisis; Palgrave Macmillan: New York, NY, USA, 2016. [Google Scholar]
  110. Adams, S.; Simnett, R. Integrated Reporting: An opportunity for Australia’s Not for Profit Sector. Aust. Account. Rev. 2011, 21, 292–301. [Google Scholar] [CrossRef]
  111. Aljazeera. G20 Environment Meeting Ends without Agreement on Climate Crisis. 2023. Available online: https://www.aljazeera.com/news/2023/7/28/g20-environment-meeting-ends-without-agreement-on-climate-crisis (accessed on 11 September 2023).
  112. Camilleri, M.A. Walking the talk about corporate social responsibility communication: An elaboration likelihood model perspective. Bus. Ethics Environ. Responsib. 2022, 31, 649–661. [Google Scholar] [CrossRef]
  113. Arvidsson, S.; Dumay, J. Corporate ESG reporting quantity, quality and performance: Where to now for environmental policy and practice? Bus. Strategy Environ. 2022, 31, 1091–1110. [Google Scholar] [CrossRef]
  114. McGarry, C.; Connellan, C.; MacLennan, J.; Pullins, T.; Gez, M.; Hublet, A.; De Catelle, W. The Global ESG Regulatory Framework Toughens up. 2022. Available online: https://www.whitecase.com/insight-alert/global-esg-regulatory-framework-toughens (accessed on 28 August 2023).
  115. Camilleri, M.A. Theoretical insights on integrated reporting: The inclusion of non-financial capitals in corporate disclosures. Corp. Commun. Int. J. 2018, 23, 567–581. [Google Scholar] [CrossRef]
Figure 1. Average ESG index by year for all countries.
Sustainability 15 14927 g001
Figure 2. Average environment index by year for all countries.
Sustainability 15 14927 g002
Figure 3. Average social index by year for all countries.
Sustainability 15 14927 g003
Figure 4. Average governance index by year for all countries.
Sustainability 15 14927 g004
Figure 5. LOWESS for ESG and corruption.
Sustainability 15 14927 g005
Figure 6. LOWESS for ESG and civil disorder.
Sustainability 15 14927 g006
Figure 7. LOWESS for ESG and civil war.
Sustainability 15 14927 g007
Figure 8. LOWESS for ESG and economic risk.
Sustainability 15 14927 g008
Figure 9. LOWESS for ESG and financial risk.
Sustainability 15 14927 g009
Figure 10. LOWESS for ESG and ethnic tensions.
Sustainability 15 14927 g010
Figure 11. LOWESS for ESG and religious tensions.
Sustainability 15 14927 g011
Figure 12. LOWESS for ESG and foreign pressures.
Sustainability 15 14927 g012
Figure 13. LOWESS for ESG and law and order.
Sustainability 15 14927 g013
Figure 14. LOWESS for ESG and military in politics.
Sustainability 15 14927 g014
Figure 15. LOWESS for ESG and GDP per capita.
Sustainability 15 14927 g015
Figure 16. LOWESS for ESG and inflation.
Sustainability 15 14927 g016
Figure 17. LOWESS for ESG and trade openness.
Sustainability 15 14927 g017
Figure 18. Average ESG index before 2010.
Sustainability 15 14927 g018
Figure 19. Average ESG index after 2010.
Sustainability 15 14927 g019
Figure 20. Average environment index before 2010.
Sustainability 15 14927 g020
Figure 21. Average environment index after 2010.
Sustainability 15 14927 g021
Figure 22. Average social index before 2010.
Sustainability 15 14927 g022
Figure 23. Average social index after 2010.
Sustainability 15 14927 g023
Figure 24. Average governance index before 2010.
Sustainability 15 14927 g024
Figure 25. Average governance index after 2010.
Sustainability 15 14927 g025
Disclaimer/Publisher’s Note: The statements, opinions and data contained in all publications are solely those of the individual author(s) and contributor(s) and not of MDPI and/or the editor(s). MDPI and/or the editor(s) disclaim responsibility for any injury to people or property resulting from any ideas, methods, instructions or products referred to in the content.

