
A Market-Based Payment Study for Forest Water Purification Service in Loess Plateau of Yellow River Basin, China

Abstract
:1. Introduction
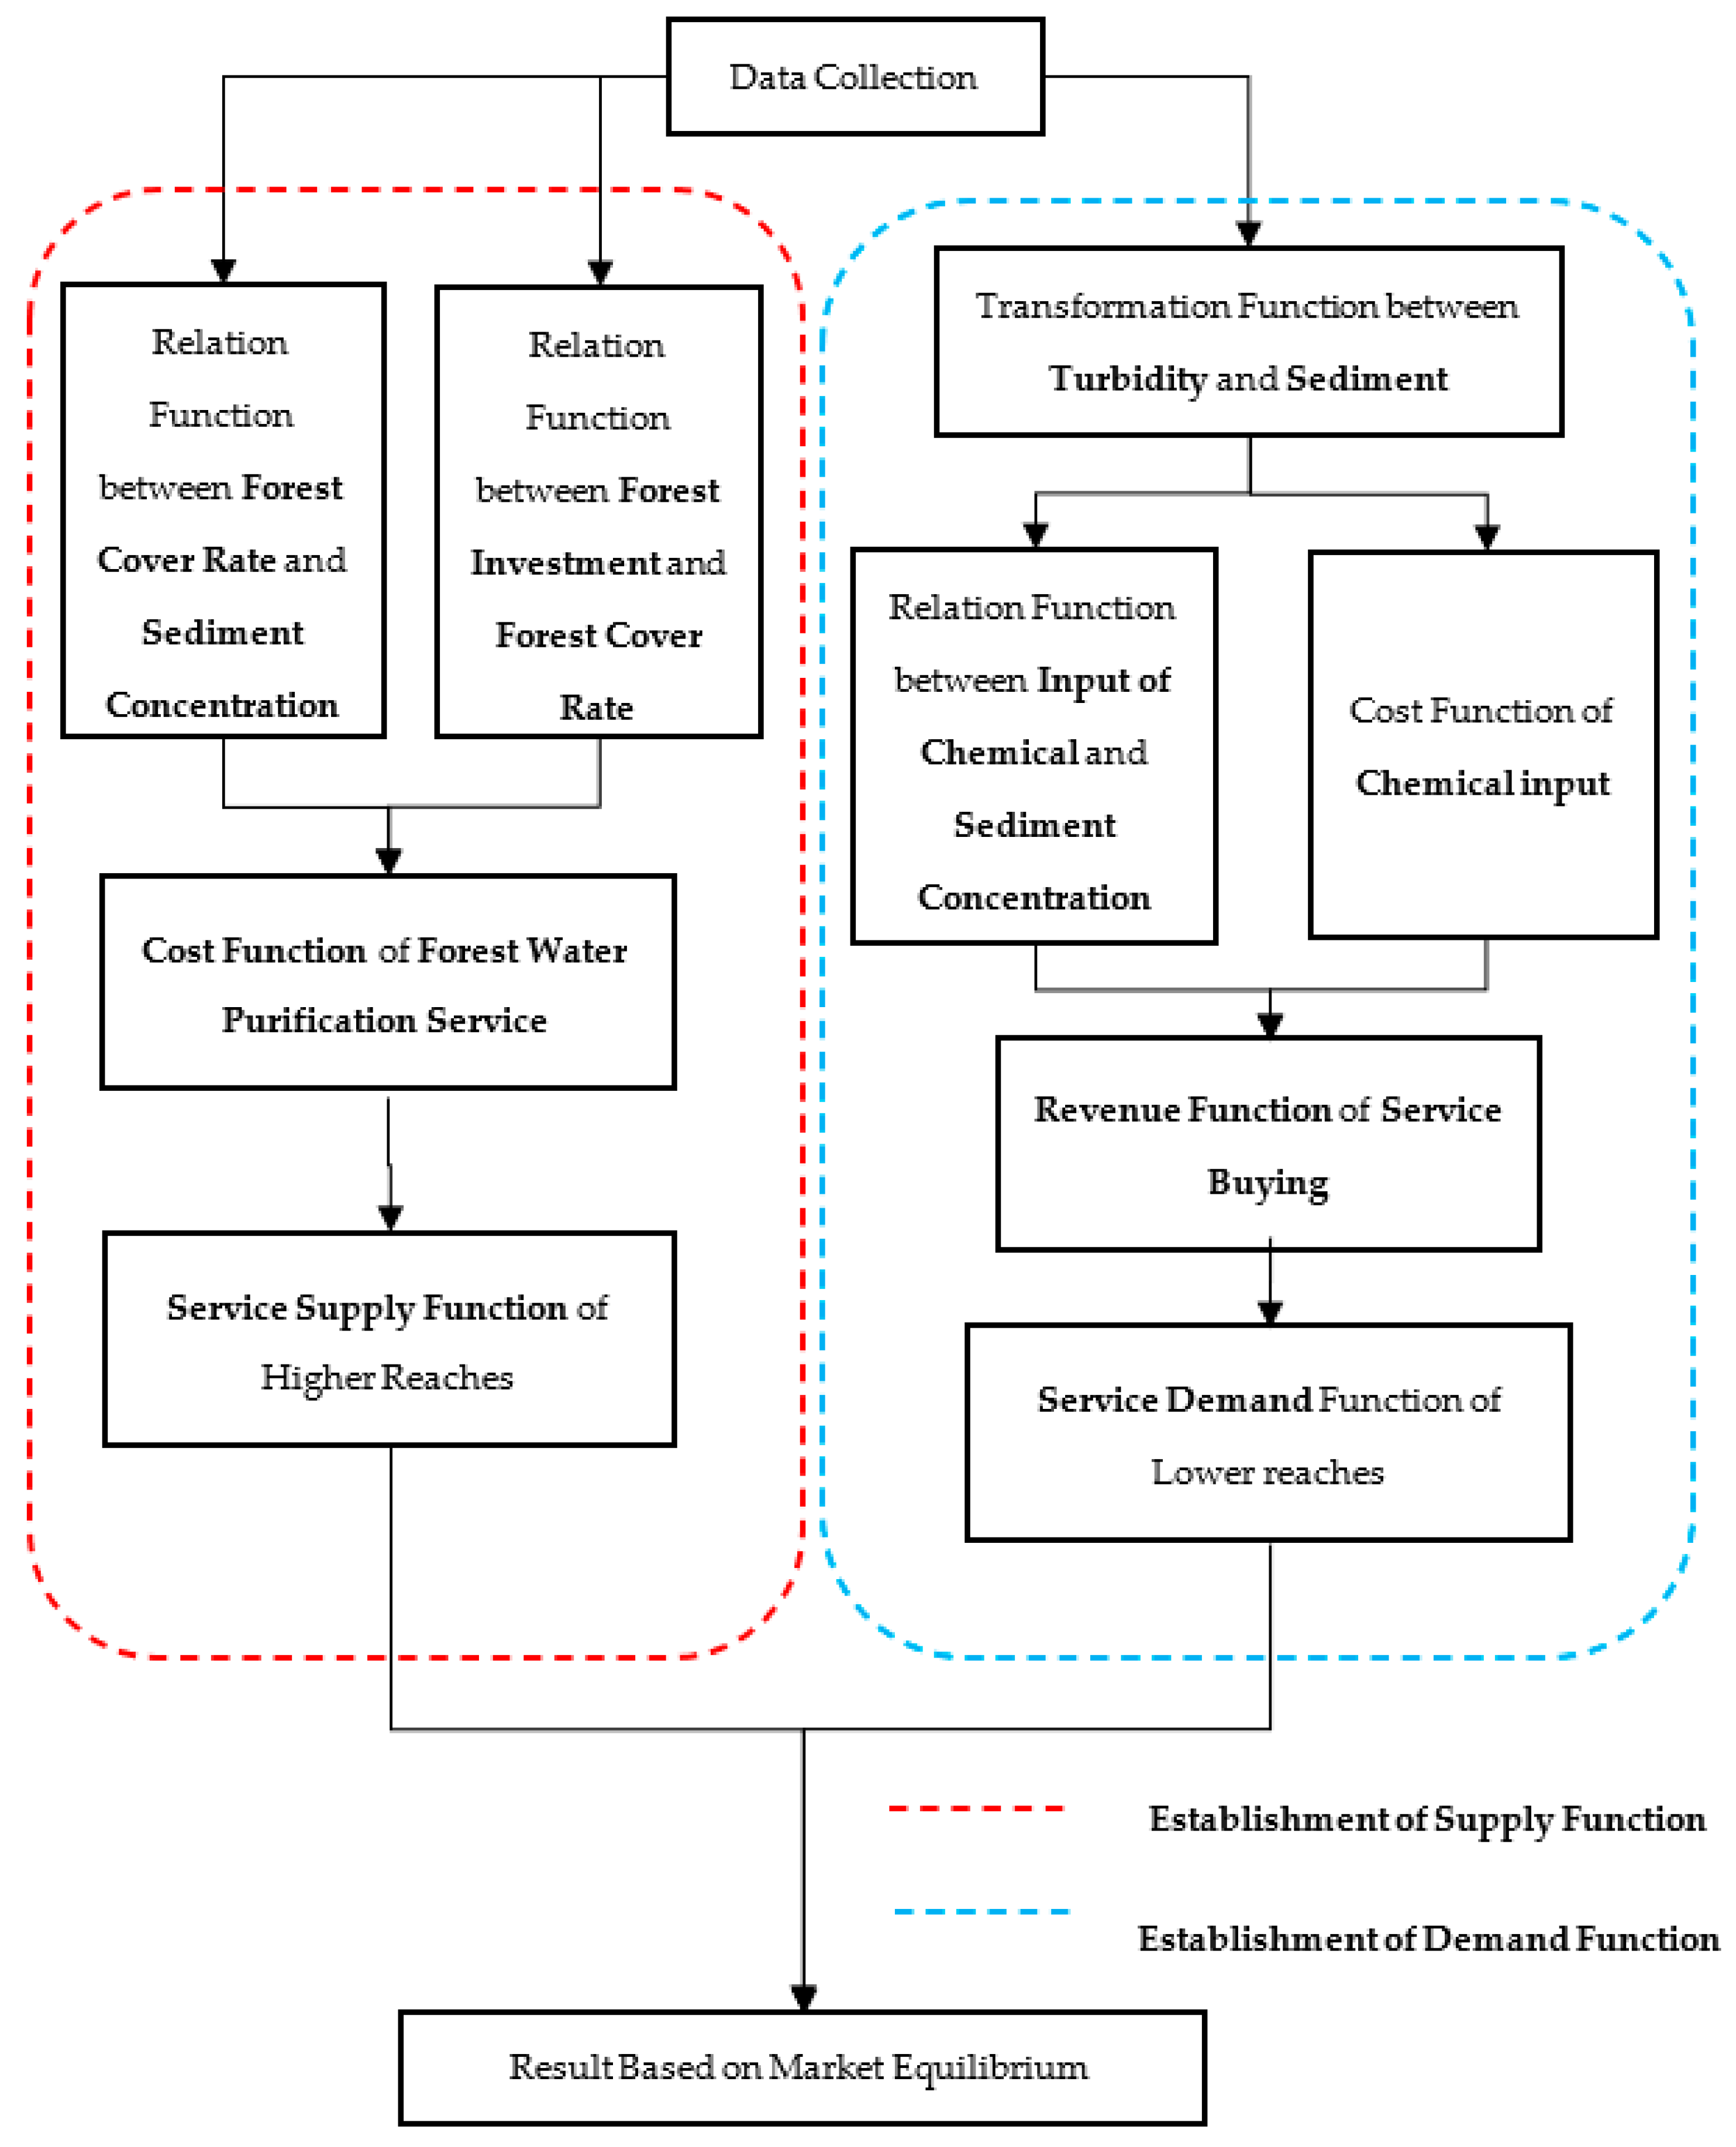
2. Modeling
2.1. Basic Elements
2.2. Model Hypothesis
2.3. Model Equilibrium
3. Empirical Study
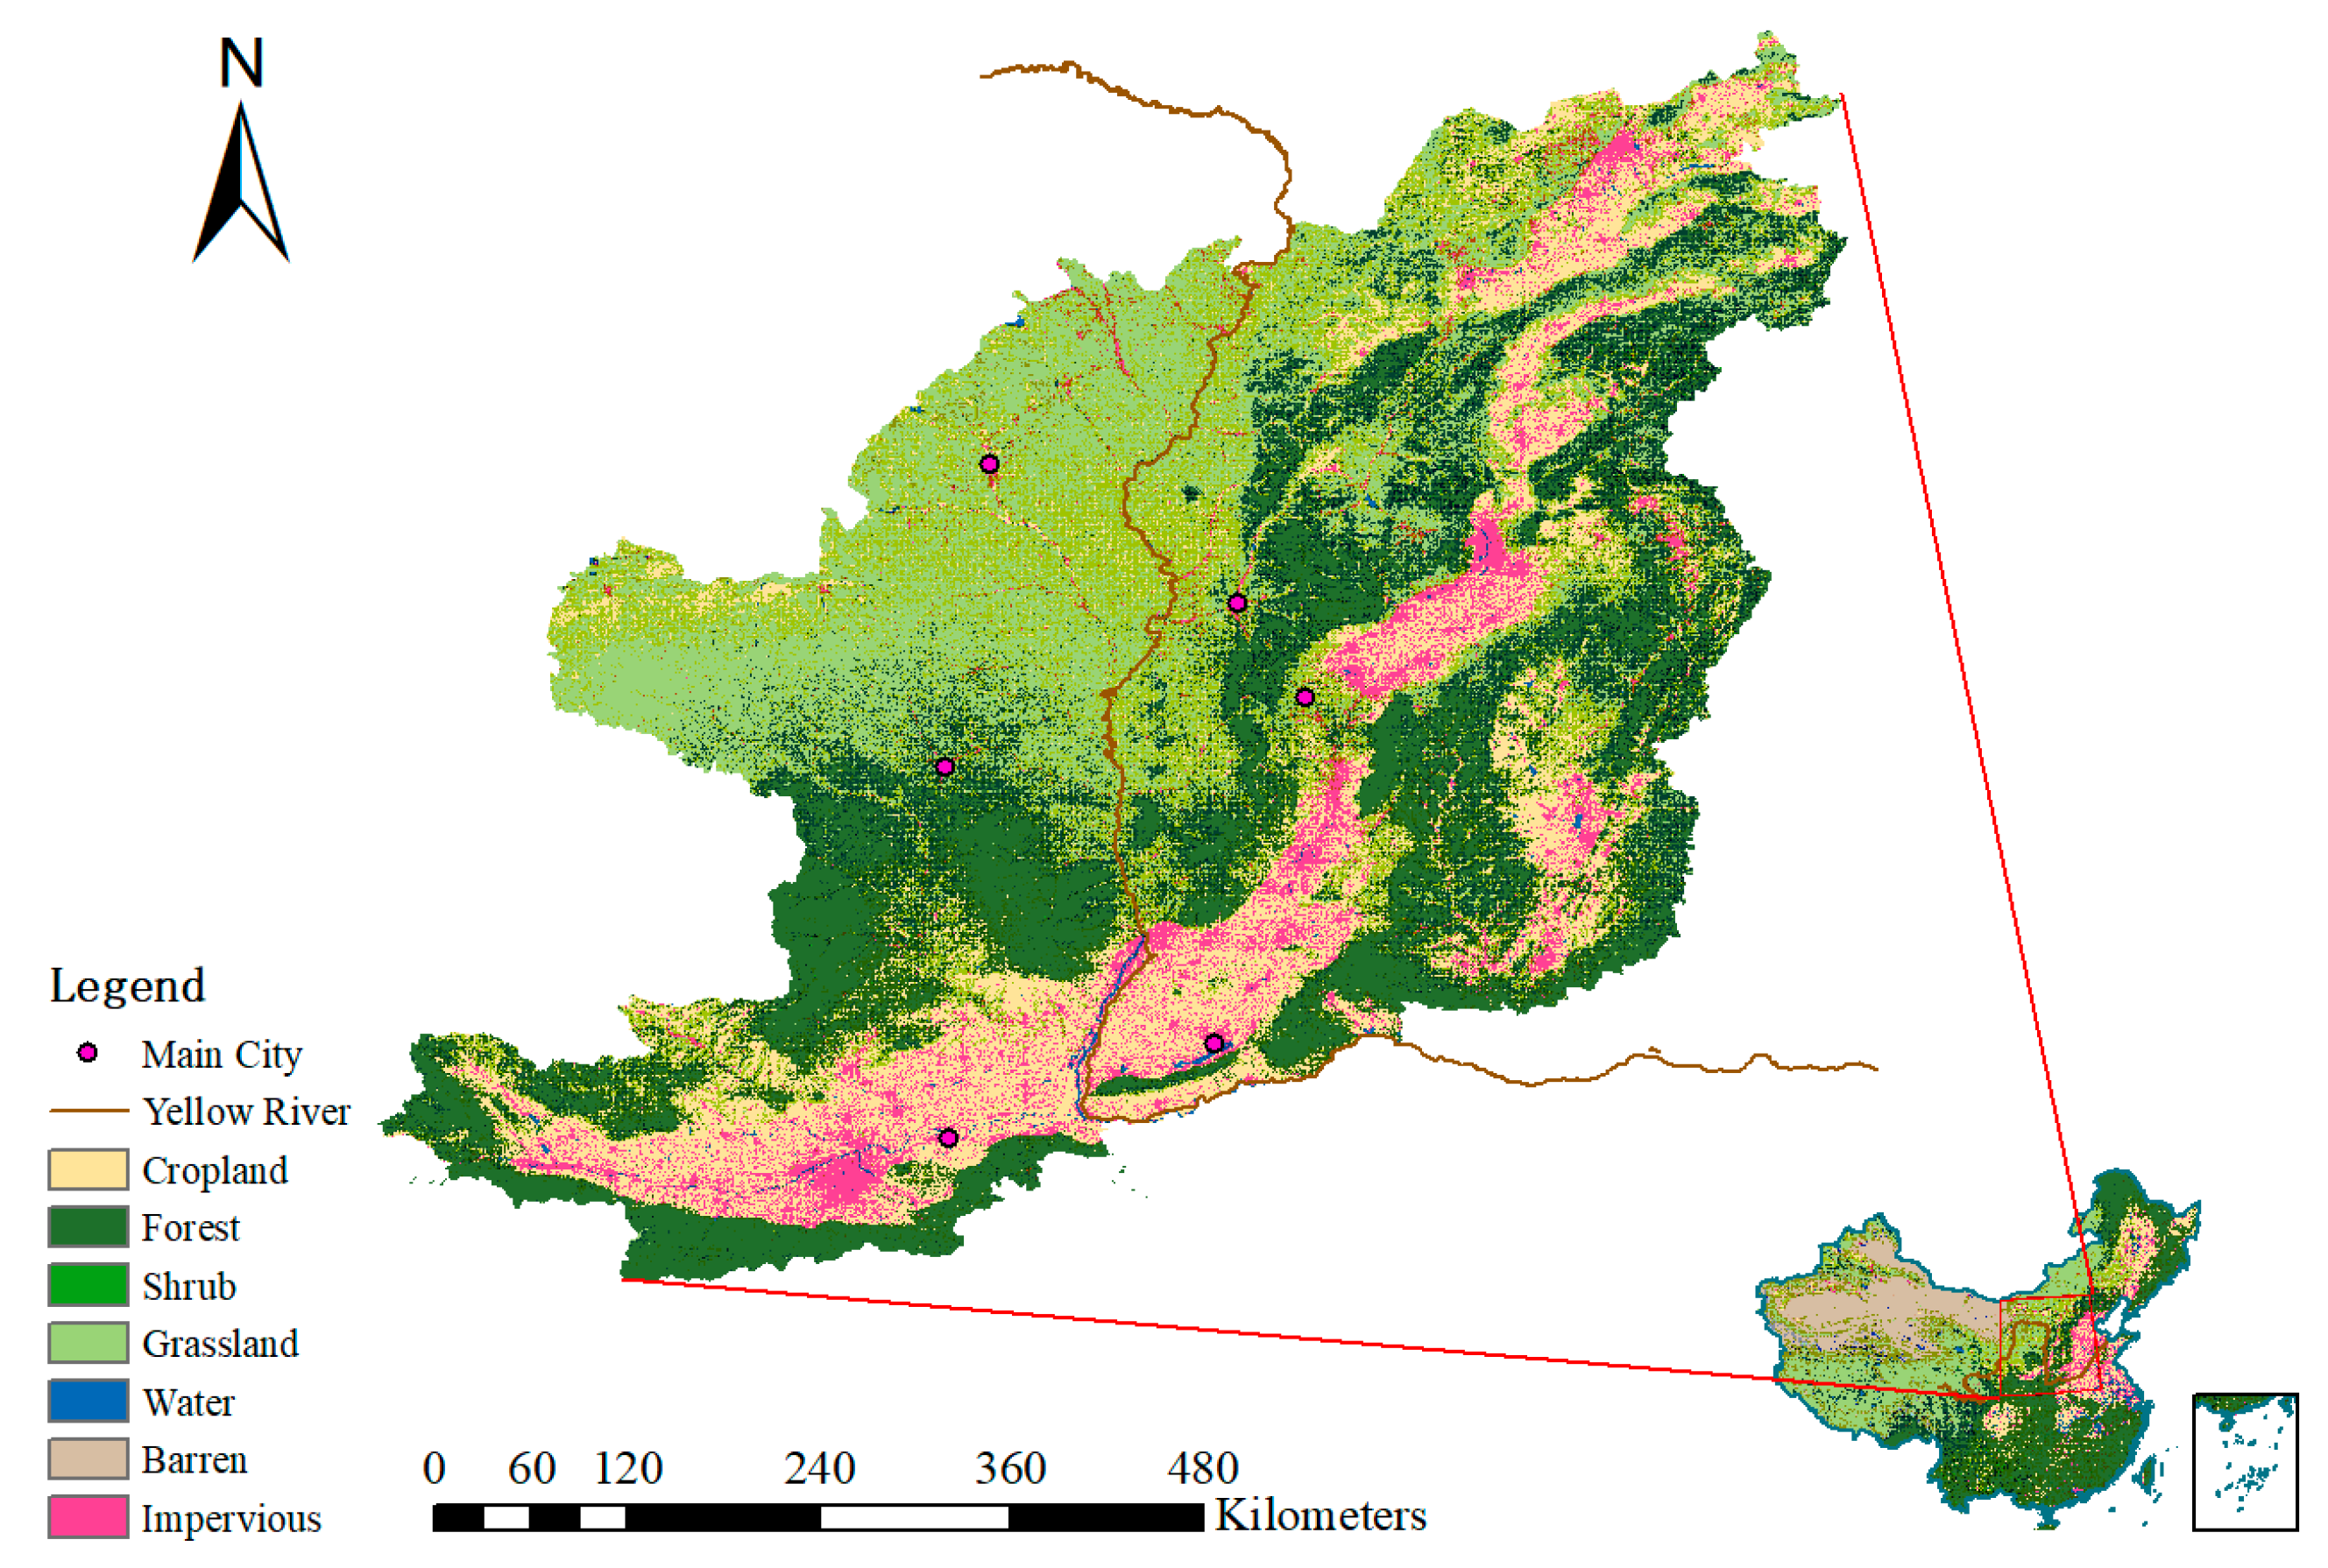
3.1. Study Area and Database
3.1.1. Study Area
3.1.2. Database
3.2. Supply Model of Forestry Water Purification Service
3.2.1. Relation Function between Forest Cover Rate and Sediment Concentration
3.2.2. Relation Function between Forest Cover Rate and Forestry Investment
3.2.3. Supply of Forest Water Purification Service
3.3. Demand of Forest Water Purification Service
3.4. Result
4. Discussion and Conclusions
4.1. Discussion
- (1)
- Benefits
- (2)
- Transaction Costs
- (3)
- Potential applications
4.2. Conclusions
Author Contributions
Funding
Institutional Review Board Statement
Informed Consent Statement
Data Availability Statement
Acknowledgments
Conflicts of Interest
References
- Distefano, T.; Kelly, S. Are we in deep water? Water scarcity and its limits to economic growth. Ecol. Econ. 2017, 142, 130–147. [Google Scholar] [CrossRef]
- Mekonnen, M.M.; Hoekstra, A.Y. Four billion people facing severe water scarcity. Sci. Adv. 2016, 2, e1500323. [Google Scholar] [CrossRef]
- Rachels, A.A.; Bladon, K.D.; Bywater-Reyes, S.; Hatten, J.A. Quantifying effects of forest harvesting on sources of suspended sediment to an Oregon Coast Range headwater stream. For. Ecol. Manag. 2020, 466, 118123. [Google Scholar] [CrossRef]
- Liu, N.; Caldwell, P.V.; Dobbs, G.R.; Miniat, C.F.; Bolstad, P.V.; Nelson, S.A.C.; Sun, G. Forested lands dominate drinking water supply in the conterminous United States. Environ. Res. Lett. 2021, 16, 084008. [Google Scholar] [CrossRef]
- Wunder, S. Payments for Environmental Services: Some Nuts and Bolts; CIFOR Occasional Paper No. 42; CIFOR: Bogor, Indonesia, 2005. [Google Scholar]
- Wunder, S. Revisiting the concept of payments for environmental services. Ecol. Econ. 2015, 117, 234–243. [Google Scholar] [CrossRef]
- Marketplace, E. Charting new waters: State of watershed payments 2012. In Ecosystem Marketplace; Forest Trends: Washington, DC, USA, 2013. [Google Scholar]
- Yu, H.; Xie, W.; Yang, L.; Du, A.; Almeida, C.M.; Wang, Y. From payments for ecosystem services to eco-compensation: Conceptual change or paradigm shift? Sci. Total Environ. 2020, 700, 134627. [Google Scholar] [CrossRef] [PubMed]
- Sheng, J.; Qiu, W.; Han, X. China’s PES-like horizontal eco-compensation program: Combining market-oriented mechanisms and government interventions. Ecosyst. Serv. 2020, 45, 101164. [Google Scholar] [CrossRef]
- Zhang, Q. Synergistic Governance Dilemma and Practical Approach of Horizontal Ecological Compensation in the Yellow River Basin. Yellow River 2023, 45, 54–58+67. [Google Scholar]
- Jujnovsky, J.; González-Martínez, T.M.; Cantoral-Uriza, E.A.; Almeida-Leñero, L. Assessment of water supply as an ecosystem service in a rural-urban watershed in southwestern Mexico City. Environ. Manag. 2012, 49, 690–702. [Google Scholar] [CrossRef]
- Logsdon, R.A.; Chaubey, I. A quantitative approach to evaluating ecosystem services. Ecol. Model. 2013, 257, 57–65. [Google Scholar] [CrossRef]
- Bagstad, K.J.; Johnson, G.W.; Voigt, B.; Villa, F. Spatial dynamics of ecosystem service flows: A comprehensive approach to quantifying actual services. Ecosyst. Serv. 2013, 4, 117–125. [Google Scholar] [CrossRef]
- Piaggio, M.; Siikamaki, J. The value of forest water purification ecosystem services in Costa Rica. Sci. Total Environ. 2021, 789, 147952. [Google Scholar] [CrossRef] [PubMed]
- Singh, S.; Mishra, A. Deforestation-induced costs on the drinking water supplies of the Mumbai metropolitan, India. Glob. Environ. Chang. 2014, 27, 73–83. [Google Scholar] [CrossRef]
- Vincent, J.R.; Ahmad, I.; Adnan, N.; Burwell, W.B.; Pattanayak, S.K.; Tan-Soo, J.-S.; Thomas, K. Valuing Water Purification by Forests: An Analysis of Malaysian Panel Data. Environ. Resour. Econ. 2015, 64, 59–80. [Google Scholar] [CrossRef]
- Fiquepron, J.; Garcia, S.; Stenger, A. Land use impact on water quality: Valuing forest services in terms of the water supply sector. J. Environ. Manag. 2013, 126, 113–121. [Google Scholar] [CrossRef] [PubMed]
- Shi, C.; Zhou, Y.; Fan, X.; Shao, W. A study on the annual runoff change and its relationship with water and soil conservation practices and climate change in the middle Yellow River basin. Catena 2013, 100, 31–41. [Google Scholar] [CrossRef]
- Bartkowski, B.; Hansjürgens, B.; Möckel, S.; Bartke, S. Institutional Economics of Agricultural Soil Ecosystem Services. Sustainability 2018, 10, 2447. [Google Scholar] [CrossRef]
- Radke, L.C.; Prosser, I.P.; Robb, M.; Brooke, B.; Fredericks, D.; Douglas, G.B.; Skemstad, J. The relationship between sediment and water quality, and riverine sediment loads in the wave-dominated estuaries of south-west Western Australia. Mar. Freshw. Res. 2004, 55, 581–596. [Google Scholar] [CrossRef]
- Li, C.; Shi, Y.; Ni, Q.; Zhao, M. Effects of social interactions and information bias on the willingness to pay for transboundary basin ecosystem services. J. Environ. Manag. 2021, 296, 113233. [Google Scholar] [CrossRef]
- Coase, R.H. The problem of social cost. J. Law Econ. 1960, 3, 1–44. [Google Scholar] [CrossRef]
- Jiao, J.; Zhang, Z.; Bai, W.; Jia, Y.; Wang, N. Assessing the Ecological Success of Restoration by Afforestation on the Chinese Loess Plateau. Restor. Ecol. 2012, 20, 240–249. [Google Scholar] [CrossRef]
- Lambini, C.K.; Nguyen, T.T.; Abildtrup, J.; Pham, V.D.; Tenhunen, J.; Garcia, S. Are Ecosystem Services Complementary or Competitive? An Econometric Analysis of Cost Functions of Private Forests in Vietnam. Ecol. Econ. 2018, 147, 343–352. [Google Scholar] [CrossRef]
- Wang, Y. A simulation of water markets with transaction costs. Agric. Water Manag. 2012, 103, 54–61. [Google Scholar] [CrossRef]
- Ronald, C. The nature of the firm. Economica 1937, 4, 386–405. [Google Scholar]
- Womble, P.; Hanemann, W.M. Water Markets, Water Courts, and Transaction Costs in Colorado. Water Resour. Res. 2020, 56, e2019WR025507. [Google Scholar] [CrossRef]
- Fu, B.; Wang, S.; Liu, Y.; Liu, J.; Liang, W.; Miao, C. Hydrogeomorphic Ecosystem Responses to Natural and Anthropogenic Changes in the Loess Plateau of China. Annu. Rev. Earth. Planet. Sci. 2017, 45, 223–243. [Google Scholar] [CrossRef]
- Wang, S.; Fu, B.J.; Piao, S.L.; Lü, Y.H.; Ciais, P.; Feng, X.M.; Wang, Y.F. Reduced sediment transport in the Yellow River due to anthropogenic changes. Nat. Geosci. 2015, 9, 38–41. [Google Scholar] [CrossRef]
- Yang, J.; Huang, X. The 30 m annual land cover dataset and its dynamics in China from 1990 to 2019. Earth Syst. Sci. Dada 2021, 13, 3907–3925. [Google Scholar] [CrossRef]
- Zhao, R.; Zhang, J.-F.; Wang, F. Selection of Dosing Condition for Treatment of High Turbidity Raw Water. Water Sci. Eng. Technol. 2011, 5, 29–32. [Google Scholar]
- Zuo, D.; Xu, Z.; Yao, W.; Jin, S.; Xiao, P.; Ran, D. Assessing the effects of changes in land use and climate on runoff and sediment yields from a watershed in the Loess Plateau of China. Sci. Total Environ. 2016, 544, 238–250. [Google Scholar] [CrossRef]
- Neary, D.G.; Ice, G.G.; Jackson, C.R. Linkages between forest soils and water quality and quantity. For. Ecol. Manag. 2009, 258, 2269–2281. [Google Scholar] [CrossRef]
- Abildtrup, J.; Garcia, S.; Stenger, A. The effect of forest land use on the cost of drinking water supply: A spatial econometric analysis. Ecol. Econ. 2013, 92, 126–136. [Google Scholar] [CrossRef]
- Price, J.I.; Heberling, M.T. The Effects of Source Water Quality on Drinking Water Treatment Costs: A Review and Synthesis of Empirical Literature. Ecol. Econ. 2018, 151, 195–209. [Google Scholar] [CrossRef]
- Xiao, X.; Li, J.; Yang, X.; Zhang, Z.; Xue, B. Evaluation of forest-grassland ecosystem services value in the upper and middle reaches of the Yellow River Basin, China. Acta Ecol. Sin. 2022, 42, 7830–7844. [Google Scholar]
- Qiao, S.; Zhang, C.; Cuesta, L.; Alvarado, R.; Pinzón, S.; Bravo-Benavides, D. Impact of Government Stability and Investment Profile on Forest Area: The Role of Natural Protected Areas. Sustainability 2022, 14, 4395. [Google Scholar] [CrossRef]
- Tang, M.; Ni, L.; Zhang, W.; Fu, J.; Dai, J. Application of Turbidity Meter in Sediment Concentration Monitoring of Yingxiuwan Hydropower Station. Water Power 2017, 43, 71–75. [Google Scholar]
- People’s Republic of China. National Standard Drinking Water Hygiene Standard. J. China Urban Water Assoc. 2007, 4, 27–31.
- Zhang, Y.; Zhao, X.; Zuo, L.; Zhang, Z.; Wang, X. Dynamic Evaluation and Analysis on Ecosystem Service Value in the Loess Plateau. Res. Soil Water Conserv. 2018, 25, 170–176. [Google Scholar]
- Liu, G.; Zhu, Y.; Wen, Y.; Xie, J.; Ma, Y. Practices and suggestions on promoting market-oriented diversified eco-compensation. Environ. Sustain. Dev. 2019, 44, 30–34. [Google Scholar]
- Naeem, S.; Ingram, J.C.; Varga, A.; Agardy, T.; Barten, P.; Bennett, G.; Bloomgarden, E.; Bremer, L.L.; Burkill, P.; Cattau, M.; et al. Get the science right when paying for nature’s services. Science 2015, 347, 1206–1207. [Google Scholar] [CrossRef]
- Xie, G.; Cao, S.; Lu, C.; Zhang, C.; Xiao, Y. Current status and future trends for eco-compensation in China. J. Resour. Ecol. 2015, 6, 355–362. [Google Scholar]


| The Form of the Regression Equation |
|---|
| (1) | (2) | (3) | (4) | (5) | (6) | (7) | |
|---|---|---|---|---|---|---|---|
| Sc1 | Sc2 | Sc3 | Sc4 | Sc5 | Sc6 | Sc7 | |
| Con | |||||||
| _cons | 79.661 *** | 13.307 *** | 13.119 *** | 14.982 *** | 36.123 ** | 35.577 ** | 34.984 ** |
| (19.211) | (2.307) | (2.435) | (2.783) | (14.645) | (12.816) | (13.245) | |
| Fc | |||||||
| _cons | −278.033 *** | −47.203 *** | −49.913 *** | −54.981 *** | −161.375 ** | −158.586 ** | −155.675 ** |
| (86.713) | (11.340) | (12.194) | (13.713) | (70.391) | (61.559) | (63.682) | |
| Pa | |||||||
| _cons | −0.002 | −0.000 | −0.000 | 0.001 *** | −0.000 | ||
| (0.002) | (0.000) | (0.000) | (0.000) | (0.001) | |||
| Ps | |||||||
| _cons | 0.002 | −0.000 | 0.001 | 0.003 *** | 0.004 | ||
| (0.004) | (0.000) | (0.001) | (0.001) | (0.003) | |||
| N | 20 | 20 | 20 | 20 | 20 | 20 | 20 |
| adj. R2 | 0.366 | 0.864 | 0.857 | 0.868 | 0.895 | 0.906 | 0.901 |
| (1) | (2) | (3) | (4) | (5) | (6) | (7) | (8) | (9) | (10) | |
|---|---|---|---|---|---|---|---|---|---|---|
| Fc0 | Fc1 | Fc2 | Fc3 | Fc4 | Fc5 | Fc6 | Fc7 | Fc8 | Fc9 | |
| Invest | 0.00296 *** | 0.00086 | 0.00091 | 0.00093 ** | 0.00106 *** | 0.00005 *** | 0.001 *** | 0.00111 *** | 0.00129 *** | 0.00101 *** |
| (0.0003) | (0.00104) | (0.00066) | (0.00042) | (0.0002) | (0.00001) | (0.0003) | (0.0003) | (0.0003) | (0.0003) | |
| L1.Invest | 0.00206 * | |||||||||
| (0.00099) | ||||||||||
| L2.Invest | 0.00198 *** | |||||||||
| (0.00058) | ||||||||||
| L3.Invest | 0.00191 *** | |||||||||
| (0.0004) | ||||||||||
| L4.Invest | 0.00177 *** | |||||||||
| (0.0002) | ||||||||||
| L5.Invest | 0.00170 *** | |||||||||
| (0.0002) | ||||||||||
| L6.Invest | 0.00185 *** | |||||||||
| (0.0002) | ||||||||||
| L7.Invest | 0.00194 *** | |||||||||
| (0.0002) | ||||||||||
| L8.Invest | 0.00216 *** | |||||||||
| (0.0002) | ||||||||||
| L9.Invest | 0.00262 *** | |||||||||
| (0.0002) | ||||||||||
| _cons | 0.20396 *** | 0.20513 *** | 0.20630 *** | 0.20781 *** | 0.20891 *** | 0.21059 *** | 0.21200 *** | 0.21195 *** | 0.21048 *** | 0.21298 *** |
| (0.00239) | (0.00251) | (0.00248) | (0.00205) | (0.00146) | (0.00153) | (0.00195) | (0.0023) | (0.00263) | (0.00269) | |
| N | 20 | 19 | 18 | 17 | 16 | 15 | 14 | 13 | 12 | 11 |
| adj. R2 | 0.833 | 0.842 | 0.868 | 0.913 | 0.956 | 0.955 | 0.938 | 0.933 | 0.944 | 0.952 |
| Y | |
|---|---|
| Pac | 0.023 *** |
| (0.003) | |
| Pam | 7.080 *** |
| (1.067) | |
| N | 23 |
| adj. R2 | 0.943 |
Disclaimer/Publisher’s Note: The statements, opinions and data contained in all publications are solely those of the individual author(s) and contributor(s) and not of MDPI and/or the editor(s). MDPI and/or the editor(s) disclaim responsibility for any injury to people or property resulting from any ideas, methods, instructions or products referred to in the content. |
© 2023 by the authors. Licensee MDPI, Basel, Switzerland. This article is an open access article distributed under the terms and conditions of the Creative Commons Attribution (CC BY) license (https://creativecommons.org/licenses/by/4.0/).
Share and Cite
Li, H.; Wen, Z. A Market-Based Payment Study for Forest Water Purification Service in Loess Plateau of Yellow River Basin, China. Sustainability 2023, 15, 15015. https://doi.org/10.3390/su152015015
Li H, Wen Z. A Market-Based Payment Study for Forest Water Purification Service in Loess Plateau of Yellow River Basin, China. Sustainability. 2023; 15(20):15015. https://doi.org/10.3390/su152015015
Chicago/Turabian StyleLi, Huilin, and Zuomin Wen. 2023. "A Market-Based Payment Study for Forest Water Purification Service in Loess Plateau of Yellow River Basin, China" Sustainability 15, no. 20: 15015. https://doi.org/10.3390/su152015015
APA StyleLi, H., & Wen, Z. (2023). A Market-Based Payment Study for Forest Water Purification Service in Loess Plateau of Yellow River Basin, China. Sustainability, 15(20), 15015. https://doi.org/10.3390/su152015015