Review

A Review of Internet of Things-Based Visualisation Platforms for Tracking Household Carbon Footprints

by
Lanre Olatomiwa
1,2,*,
James Garba Ambafi
1,
Umar Suleiman Dauda
1,
Omowunmi Mary Longe
2,
Kufre Esenowo Jack
3,
Idowu Adetona Ayoade
4,
Isah Ndakara Abubakar
1 and
Alabi Kamilu Sanusi
5
1
Department of Electrical & Electronics Engineering, Federal University of Technology, Minna PMB 65, Niger State, Nigeria
2
Department of Electrical & Electronic Engineering Science, University of Johannesburg, Johannesburg 2006, South Africa
3
Department of Mechatronics Engineering, Federal University of Technology, Minna PMB 65, Niger State, Nigeria
4
Department of Mechatronics Engineering, First Technical University, Ibadan 200261, Oyo, Nigeria
5
Department of Electrical & Electronics Engineering, Waziri Umaru Federal Polytechnic, Birnin Kebbi 860101, Kebbi, Nigeria
*
Author to whom correspondence should be addressed.
Sustainability 2023, 15(20), 15016; https://doi.org/10.3390/su152015016
Submission received: 28 July 2023 / Revised: 7 September 2023 / Accepted: 11 September 2023 / Published: 18 October 2023

Abstract

:
Carbon dioxide (CO2) and other greenhouse gases are the main causes of global climate change. This phenomenon impacts natural and human systems around the world through the rising global average surface temperature, extreme weather, changes in precipitation patterns, rising sea levels, and ocean acidification. However, this concept is alien to most people in developing countries. They are also unaware of the connection between energy efficiency and climate change. This dearth of knowledge makes them opt for highly inefficient appliances. Internet of Things (IoT)-based visualisation platforms for tracking household carbon footprints (CFs) have been seen as a good concept for combating this global phenomenon; however, there are potential challenges and ethical restrictions that must be addressed when implementing platforms for tracking household CFs. It is also vital to consider the user’s viewpoint and current technological state to ensure successful implementation and adoption. As the literature in this area is rapidly developing, it is crucial to revisit it occasionally. This paper presents a systematic review of IoT-based visualisation platforms for household CFs, including their definitions, characteristics, decision-making processes, policy development, related services, benefits, challenges, and barriers to implementation. Finally, it offers suggestions for future research.

1. Introduction

The Internet of Things (IoT) refers to a network comprising numerous physical devices, buildings, vehicles, and other objects. These objects are equipped with electronics, software, and sensors, allowing them to collect and share data [1]. There is significant interest in using IoT technology to detect and reduce household carbon footprints (CFs) due to the need to minimise greenhouse gas (GHG) emissions and the growing concerns about climate alteration. A household CF is the amount of GHG emissions produced by the activities of a household, including energy use, transportation, and waste generation [2,3,4]. By tracking household CFs, individuals can identify areas where they can reduce their emissions and change their daily behaviours to mitigate their environmental impacts [3].
A visualisation platform based on IoT technology can provide real-time feedback on household energy use and CFs [5]. The platform can generate visualisations showing how household activities affect carbon emissions by using sensors for data collection on energy consumption and additional environmental features, such as temperature and humidity [5,6]. This information can help individuals identify areas where CFs need to be reduced, such as by reducing energy consumption or changing their transportation habits [7].
The motivations for developing an IoT-based visualisation platform for tracking household CFs include increasing awareness. By providing real-time feedback on household CFs, individuals can become more aware of their environmental impacts and make informed decisions about their daily activities. Another motivation is encouraging behaviour change: the visualisation platform can motivate individuals to change their behaviour and reduce their CFs by highlighting areas where they can make changes. Improving energy efficiency is another objective: by tracking energy consumption, the platform can identify areas where energy efficiency can be improved, such as by replacing old appliances with more efficient models or upgrading insulation in the home [7,8]. Overall, an IoT-based visualisation platform for tracking household CFs has the potential to be an effective tool for promoting environmental awareness and behaviour change while also contributing to the global effort to reduce GHG emissions [7].
The various research objectives for IoT-based visualisation platforms for tracking household CFs include the design and development of an IoT-based system that can track and monitor household CF data in real time [9,10]; the identification and analysis of factors that contribute to the household CF, such as energy consumption, transportation, and waste management; the development of a user-friendly interface for visualising and analysing household CF data [8], including historical trends and comparisons with similar households; the investigation of the effectiveness of different visualisation techniques in communicating household CF data to users, such as charts, graphs, and maps [9]; the conduction of user testing to assess the usability and efficiency of the IoT-based visualisation platform in promoting behaviour change and reducing household CFs; and the valuation of the potential environmental and economic gains from reducing household CFs [4], including reduced GHG emissions and energy costs [8]. Prominent among the main objectives is to pinpoint the obstacles and difficulties in implementing IoT-based monitoring systems for household CFs. The aim is to create effective strategies to overcome these barriers. Additionally, we will evaluate the scalability and replicability of the IoT-based visualisation platform in various contexts, including urban and rural households [9]. This research also seeks to identify opportunities for further development and research of IoT-based systems to track and reduce household CFs.
Questions from previous studies on IoT-based visualisation platforms for tracking household CFs are as follows: What are the key features that an IoT-based visualisation platform should have for tracking household CFs? How can IoT sensors be integrated into households to collect data on energy consumption and carbon emissions? Are there different visualisation techniques that can be used to present household CF data in an easily understandable way? How can machine-learning algorithms be used to analyse and predict future trends in household CF data [4]? What are the potential challenges and ethical considerations that need to be addressed when implementing an IoT-based visualisation platform for tracking household CFs? How can the data collected through an IoT-based visualisation platform be used to promote sustainable behaviour and reduce household CFs [11]? What are some potential applications of an IoT-based visualisation platform for tracking household CFs beyond individual households, such as for community-wide carbon reduction initiatives? How can the IoT-based visualisation platform be designed to be user-friendly and accessible to people with different levels of technical knowledge and abilities? What are the costs associated with implementing an IoT-based visualisation platform for tracking household CFs, and how can they be minimised? How can the effectiveness of an IoT-based visualisation platform for reducing household CFs be measured and evaluated over time?
This review summarily groups the numerous questions raised into two major headings. They are:
i.
What are the key features and challenges of implementing an IoT-based visualisation platform to track and reduce household CFs?
ii.
How can IoT sensor integration, data visualisation techniques, machine-learning analysis, user-friendliness, cost minimisation, and effectiveness evaluation be optimised in an IoT-based visualisation platform for household CF tracking?
The following methodology has previously been used to create an IoT-based visualisation platform for tracking household CFs. Identify the Relevant Metrics [2]: In the first stage, recognise the related metrics that will be used to measure a household’s CF. This could include electricity, water, transportation, waste generation, and food consumption. Determination of Data Sources: Next, determine the data sources for each identified metric. This could include smart meters, IoT sensors, and other data-generating devices [9]. Development of Data Collection Methods: Develop methods for collecting data from the identified sources. This could include APIs, data integration, and manual data entry. Storage of Data: Store the collected data in a database that the visualisation platform can access. The database should be secure and able to handle large volumes of data. Choose the Visualisation Platform: Choose a visualisation platform that can handle and display the collected data meaningfully. This could include dashboards, charts, and graphs. Creation of the User Interface: Develop a user interface that is easy to use and understand. This could include a web-based interface or a mobile app. Add Features: Add features such as alerts, notifications, and recommendations to help users reduce their CFs [12]. Test and Refine: Test the platform with real users and refine it based on feedback. Launch: Launch the platform and market it to households interested in reducing their CFs. Maintain and Update: Maintain and update the platform to ensure it continues to meet users’ needs and stays up to date with the latest data sources and technologies [12].
This paper, therefore, presents a systematic review of IoT-based visualisation platforms for household CFs, including their definitions, characteristics, decision-making processes, policy development, related services, benefits, drawbacks, challenges, and barriers to implementation. Finally, it offers suggestions for future research.

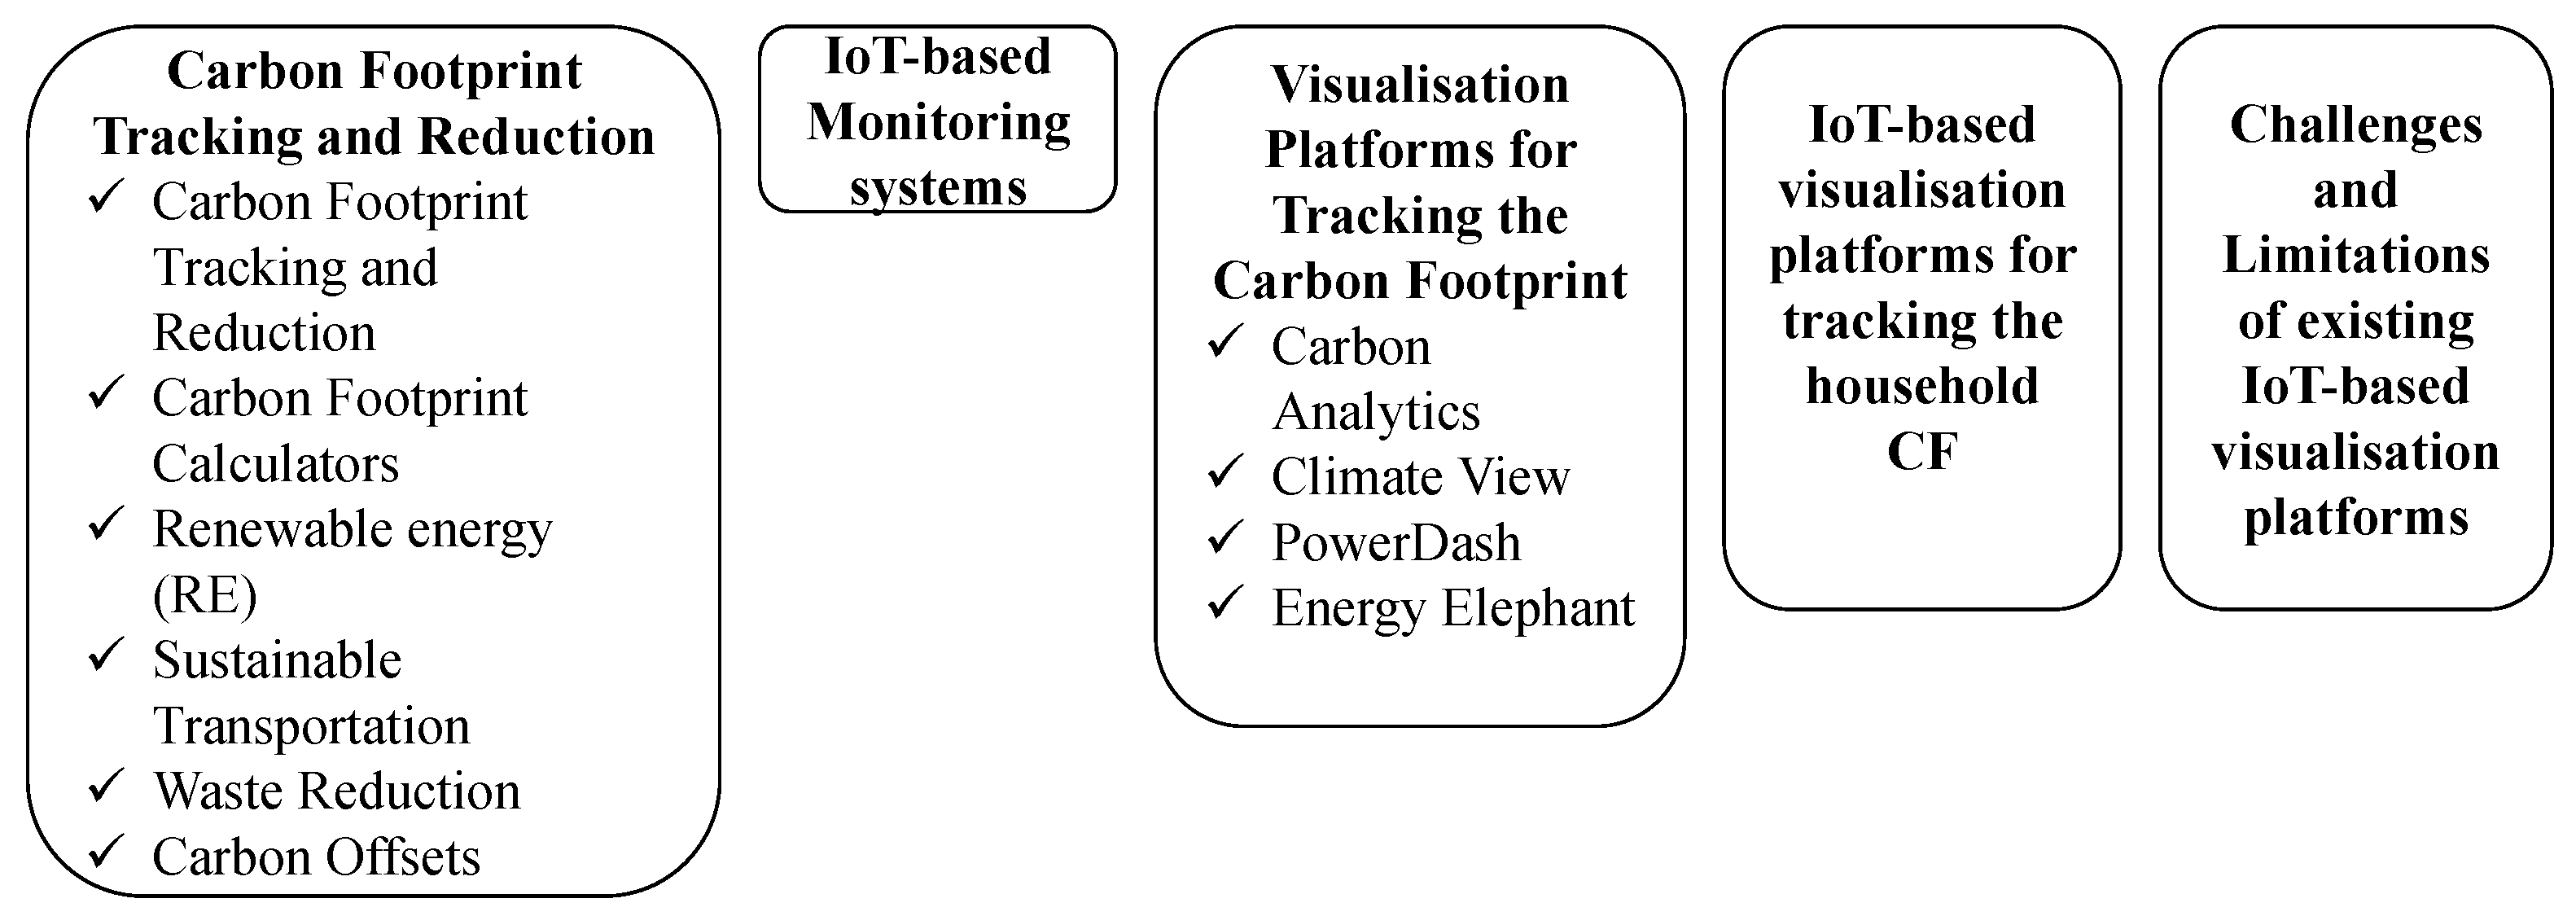
2. Literature Review

Figure 1 shows the block outline of the review considered in this section to address the two (2) major questions raised in the introduction.

2.1. Carbon Footprint Tracking and Reduction

CF tracking and reduction are important for sustainability and climate change mitigation. Many tools and strategies are available to help individuals, organisations, and governments track and reduce their CFs. This extensive review will explore the most effective CF-tracking and reduction methods.

2.1.1. Carbon Footprint Calculators

Online CF calculators are useful tools that assist individuals and organisations in estimating their carbon emissions. These calculators consider various activities, including transportation, energy consumption, and waste production. In addition, these calculators are useful for identifying areas where emissions can be reduced and tracking progress over time. Some popular CF calculators include CF, Carbon Trust, and EPA’s CF Calculator. A research team studied household CFs in Iskandar, Malaysia, and their implications for sustainable development [13]. The study highlights the impact of urbanisation on CFs and suggests the need for policies promoting low-carbon actions and energy-saving goods/services, particularly in urban areas, to support sustainable development in Malaysia [13].

2.1.2. Energy Efficiency

Reducing carbon emissions can be achieved effectively by enhancing energy efficiency. This can be achieved by upgrading energy-efficient appliances, using LED lighting, and improving building insulation. In addition, many governments and utilities offer energy efficiency incentives and programmes to benefit individuals and businesses and lessen their energy intake [14].
In a 2020 study conducted in Nice and Bordeaux in France [15], researchers investigated the factors influencing smart energy-tracking application usage. The study focused on app adoption and frequent use, considering determinants such as privacy concerns and environmental awareness [15]. Smart city characteristics and individual factors impact energy-tracking app adoption and usage. The specific details and results are shown in Table 1. Privacy is important when using energy-tracking apps. Measures should be put in place to protect personal information. The study highlights the need for more research on energy challenges and the implications of using such apps. This can help policymakers and researchers promote sustainable energy practices [15].

2.1.3. Renewable Energy (RE)

By switching to renewable energy sources, for instance, biomass, solar, and wind, people can lessen their CO2 emissions. Additionally, governments and utilities may offer incentives for installing renewable energy systems, and some businesses are beginning to adopt renewable energy as part of their sustainability efforts. Zheng et al. [17] explored how China’s renewable energy development can help cut carbon emissions. China, the top emitter of CO2 worldwide, is under intense pressure to reduce emissions. Therefore, the study targeted the assessment of how renewable energy (RE) growth contributes to emission reductions. The authors used inter-provincial panel data from 2008 to 2017 to analyse this association using a quantile regression model and path analysis. The results highlight three key points related to renewable energy and carbon emissions: inhibitory, varying, and indirect effects. The development of RE has had a positive outcome in reducing CO2 releases. Studies show that for each 1% rise in RE, there is a corresponding reduction in carbon intensity of 0.028% to 0.043%. The impact varies with the carbon intensity level, but indirect effects are prominent. Energy intensity and per capita gross domestic product (GDP) show the link between RE development and emission reductions. These findings have implications for policymakers in China. They emphasise the importance of considering different carbon emission levels, which can be used to design effective strategies for promoting renewable energy and achieving emission reduction targets [17].
Akram et al. [18] investigated the impact of energy efficiency (EE), RE, and additional factors on CF release from 1990 to 2014 in 66 developing countries. Also, this research explicitly explored these effects within the framework of the “Environmental Kuznets Curve (EKC)” hypothesis. Using panel least squares and panel quantile fixed-effects regression approaches, the researchers established that the influence of these variables on carbon emissions varied across different quantiles of the dataset. The researchers found that these variables’ effects on carbon emissions change across different quantiles of the dataset using panel ordinary least squares and fixed-effects panel quantile regression approaches. The study identified several key factors contributing to reducing carbon emissions, including EE, RE, Nuclear Energy Consumption, GDP, and Squared GDP. EE and RE significantly impact carbon reduction, particularly at higher and lower quantiles. While nuclear energy also helps to reduce emissions, its impact is comparatively less. The study also found that economic growth positively correlates with carbon emissions, with a more pronounced effect at higher quantiles. However, the squared term can help mitigate emissions, especially at upper quantiles. For developing countries, the study areas of interest are the critical roles of EE and RE in reducing carbon emissions. They also emphasize the need to consider EE within the framework of the EKC hypothesis, as presented in Figure 2. These findings provide insights into practical strategies and policies for promoting sustainable development and achieving emission reduction targets [18].

2.1.4. Sustainable Transportation

A significant source of carbon emissions is the transportation sector. Thus, encouraging sustainable transportation (ST), such as walking, biking, public transit, and electric vehicles, can significantly reduce carbon emissions. Governments and businesses can promote ST through infrastructure investments, incentives, and education campaigns.
Lopez and Crozet [19] focused on the issue of transport’s contribution to CO2 releases and environmental effects. This paper evaluated possible solutions to meaningfully lessen CO2 discharges in the French transport sector. This approach involves creating scenarios by backcasting using long-term transportation problem models. In this study, the author considered three scenarios and analysed the impact of technological advances and various public policies on CO2 emission reduction. The document also provides valuable information on infrastructure investment needs and potential changes in transport budgets (financial and temporary) in each scenario. The three scenarios presented are as follows:
i.
Pegasus scenario: This scenario promotes adopting strict technology standards to reduce emissions.
ii.
Chronos scenario: This scenario focuses on promoting green multimodalities, which involve integrating different modes of transport in an environmentally friendly manner.
iii.
Hestia scenario: This scenario emphasises decoupling transport growth from the overall gross domestic product (GDP) growth.
The paper showed different results from policy mixes, proposing a 50% reduction in emissions. The remaining 25% can be achieved through various policy interventions to reach the French target of 75%. The study suggests a feasible reduction in CO2 releases from the transport sector. Combining technology and policies can make achieving the 75% target possible [19].
Long et al. [20] assessed the CF of Japanese household consumption during the initial phases of the “COVID-19” pandemic. According to the study, the changes in lifestyle during the pandemic did not significantly impact household CFs compared to the previous years. However, there were some noticeable changes in the consumption categories. For instance, there was an increase in home-cooked meals, while dining out, transportation, clothing, and entertainment expenses decreased. Additionally, the study found that elderly groups have higher per capita CFs, particularly in energy-related categories, which is an essential factor to consider when analysing the environmental impact of household consumption patterns during the pandemic [20].

2.1.5. Waste Reduction

Reducing waste helps reduce the CFs linked to the production, transportation, and disposal of goods. Strategies for waste reduction include recycling, composting, and reducing the use of single-use products. Many municipalities offer recycling and composting programmes, and businesses can implement waste reduction strategies through sustainable supply chain management.
Elgaaied-Gambier et al. [21] focused on reducing the impact of the Internet on the environment. According to the study, individuals in society are not wholly mindful of the effect of their online environmental events and tend to hold companies and authorities responsible instead of themselves. Though they wish to protect the environment, they hesitate to change their habits. The research shows that people are more likely to take responsibility for reducing their digital footprints when they understand the severity of the environmental consequences. The perceived difficulty of making behavioural changes has a smaller impact on their sense of responsibility. The study found no significant interaction between perceived severity and perceived sacrifice. In conclusion, the research highlights the importance of increasing consumer awareness and addressing their perceptions of responsibility to promote eco-friendly online behaviour [21].
In their study titled “Unequal household CFs in the peak-and-decline pattern of U.S. GHG emissions,” Song et al. [22] examined household consumption’s impact on GHG emissions in the United States. Through a combination of surveys and an input–output framework, the researchers discovered that changes in household consumption played a significant role in the national decline in emissions. The decrease in emissions was attributed to the reduced consumption of carbon-intensive products, with different income groups playing different roles. Higher-income households initially drove emission increases, while lower- and middle-income groups contributed to reductions. Although carbon inequality initially increased, it later stabilised. It was also found that higher-income households had significantly higher emissions from leisure-related services and goods, highlighting the need for emission reduction policies in specific consumption areas. These findings underscore the importance of addressing carbon inequality and targeting specific consumption areas to reduce emissions effectively [22].

2.1.6. Carbon Offsets

For example, investing in reforestation and renewable energy programmes can aid in reducing carbon emissions. Individuals and organisations can purchase carbon offsets to offset their CFs. It is crucial to verify the transparency and legitimacy of carbon offset projects to ensure that they effectively reduce emissions.
Hernandez and Vita [23] conducted a study to analyse household consumption’s CF in the Guadalajara Metropolitan Area (MAG) and identify socio-spatial inequalities in emissions. It is worth noting that a recent study found that domestic conspicuous consumption accounts for over 65% of worldwide GHG emissions. The study recognised a gap in emission reduction strategies implemented by governments under the Paris Agreement, as they primarily focus on production-based accounting, which overlooks the emissions associated with trade, consumption, and social inequalities. The researchers employed accounting analysis in suburban areas to address this gap, leveraging the 2018 Mexican Consumer Expenditure Survey and Environmentally Extended Multiregional Input–Output data. Furthermore, this analysis identified areas with high emissions (emission hotspots), estimated households’ CO2-equivalent (CO2 eq) footprint in the Guadalajara Metropolitan Area, and examined socio-spatial inequalities related to emissions. Finally, by understanding the CF of household consumption and identifying areas of inequality, the study sought to provide insights for stakeholders and policymakers to develop targeted tactics for CF reduction and address socio-spatial disparities in the region [23].
Hoffmann et al. [24] developed CF-tracking apps to reduce emissions and promote sustainability practices. The study found that ease of use and privacy concerns are important factors in consumers’ willingness to adopt such apps. The article emphasises the need to consider hedonic, social, and utilitarian benefits in promoting adoption. The study used an app prototype to assess adoption intention and found that perceived enjoyment and social benefits positively influence adoption. The article concludes with recommendations for policymakers, app designers, and marketers to encourage adoption. This article sheds light on the potential of CF-tracking apps to promote sustainable consumption and address climate change. It underscores the importance of effectively understanding consumer motivations and concerns in designing and promoting such apps. Further research in this area could explore additional factors influencing adoption intention and investigate the actual impact of these apps on consumers’ CF reduction.
In [25], a study focused on quantifying the CF abatement potential influenced by local governments and identifying effective policies for reducing emissions. The findings reveal that 35% of the abatement potential in California lies within local government control. The study highlights the importance of local policies, regulations, and initiatives in achieving GHG reduction goals. The research offers valuable resources for cities to understand where their efforts can be most effective, empowering them to allocate resources strategically. The insights and tools developed have the potential for broader application beyond California. While the study discussed provides valuable insights into the local government’s ability to reduce CFs, it is essential to acknowledge specific challenges and limitations associated with the research, which are Data Availability and Accuracy, Simplified Assumptions, Policy Implementation Challenges, Generalisability, and Uncertainty in Future Projections. The accuracy of findings relies on available and accurate data. Incomplete or outdated information can cause biases. The study used simplifications that may overlook nuances. Achieving GHG reduction targets requires strong political will and stakeholder engagement. The study’s findings apply specifically to California and may not apply to other regions. Future emission projections involve uncertainties due to technological changes, the economy, and policies.
A new tool called a carbon tracker has been developed to track and forecast the energy and CF associated with deep-learning model training [26]. The tool aims to raise awareness among practitioners about the environmental impact of training deep-learning models and promote responsible computing in machine learning. The authors provide a comprehensive overview of related investigations in this area and propose the carbon tracker as a medium for tracking and predicting energy and CFs during the training of DL models. The tool’s design principles and multithreaded implementation make it easy to integrate into existing workflows. However, further research is needed to evaluate the tool’s performance across a broader range of deep-learning architectures and applications.
Nevertheless, introducing a carbon tracker represents a valuable contribution to the field, addressing the need for increased awareness and action towards reducing the environmental impact of deep-learning (DL) model training. The introduction of carbon trackers is promising, but some challenges and limitations must be considered: the complexity of energy measurement, generalisability, hardware dependency, the lack of standardisation, limited scope, scalability and integration, privacy and data security, data availability and accuracy, Scope 3 emissions, baseline selection, the scope of the analysis, and implementation challenges. The statement acknowledges the potential of carbon trackers but highlights several critical challenges and limitations that must be addressed. These include issues related to the accurate measurement of energy usage, the applicability of tracking methods across various contexts, reliance on specific hardware, the absence of standardised approaches, a restricted focus in terms of the tracking scope, difficulties in scaling up and integration, concerns about privacy and data security, the availability and reliability of data, the ability to account for indirect emissions (Scope 3), the establishment of appropriate baselines for comparison, the definition of the extent of the analysis, and finally, the practical hurdles in implementing these trackers effectively. In essence, while carbon trackers hold promise for CF reduction, the mentioned challenges need careful consideration for their successful implementation and meaningful impacts. Measuring energy consumption during DL model training is complex due to various factors, such as hardware, software, and algorithms. The carbon tracker’s accuracy varies across models and datasets and may not account for energy efficiency differences among hardware platforms. DL has no widely accepted standard for energy and CF measurements. Moreover, the carbon tracker only tracks energy and CF during DL model training, not during other stages of the ML lifecycle. Implementing carbon trackers in real-world production environments is challenging due to compatibility, scalability, and integration issues. Sensitive information sharing raises privacy concerns, and improvements are needed for accuracy, scalability, and environmental impact.
A study on the CF of the American University of Sharjah (AUS) [27] highlights electricity consumption and university commute as key contributors to CO2 emissions. The research offers recommendations for reducing emissions that could serve as a baseline for other regional universities. Collecting accurate data on energy consumption, water usage, and transportation can be challenging, and assigning responsibilities for indirect emissions from commuting, procurement, and waste management is complex. Choosing an appropriate baseline timeframe and implementing emission reduction strategies can be difficult due to financial constraints, institutional resistance, and a lack of stakeholder engagement. A comprehensive sustainability assessment should consider multiple dimensions beyond carbon emissions.

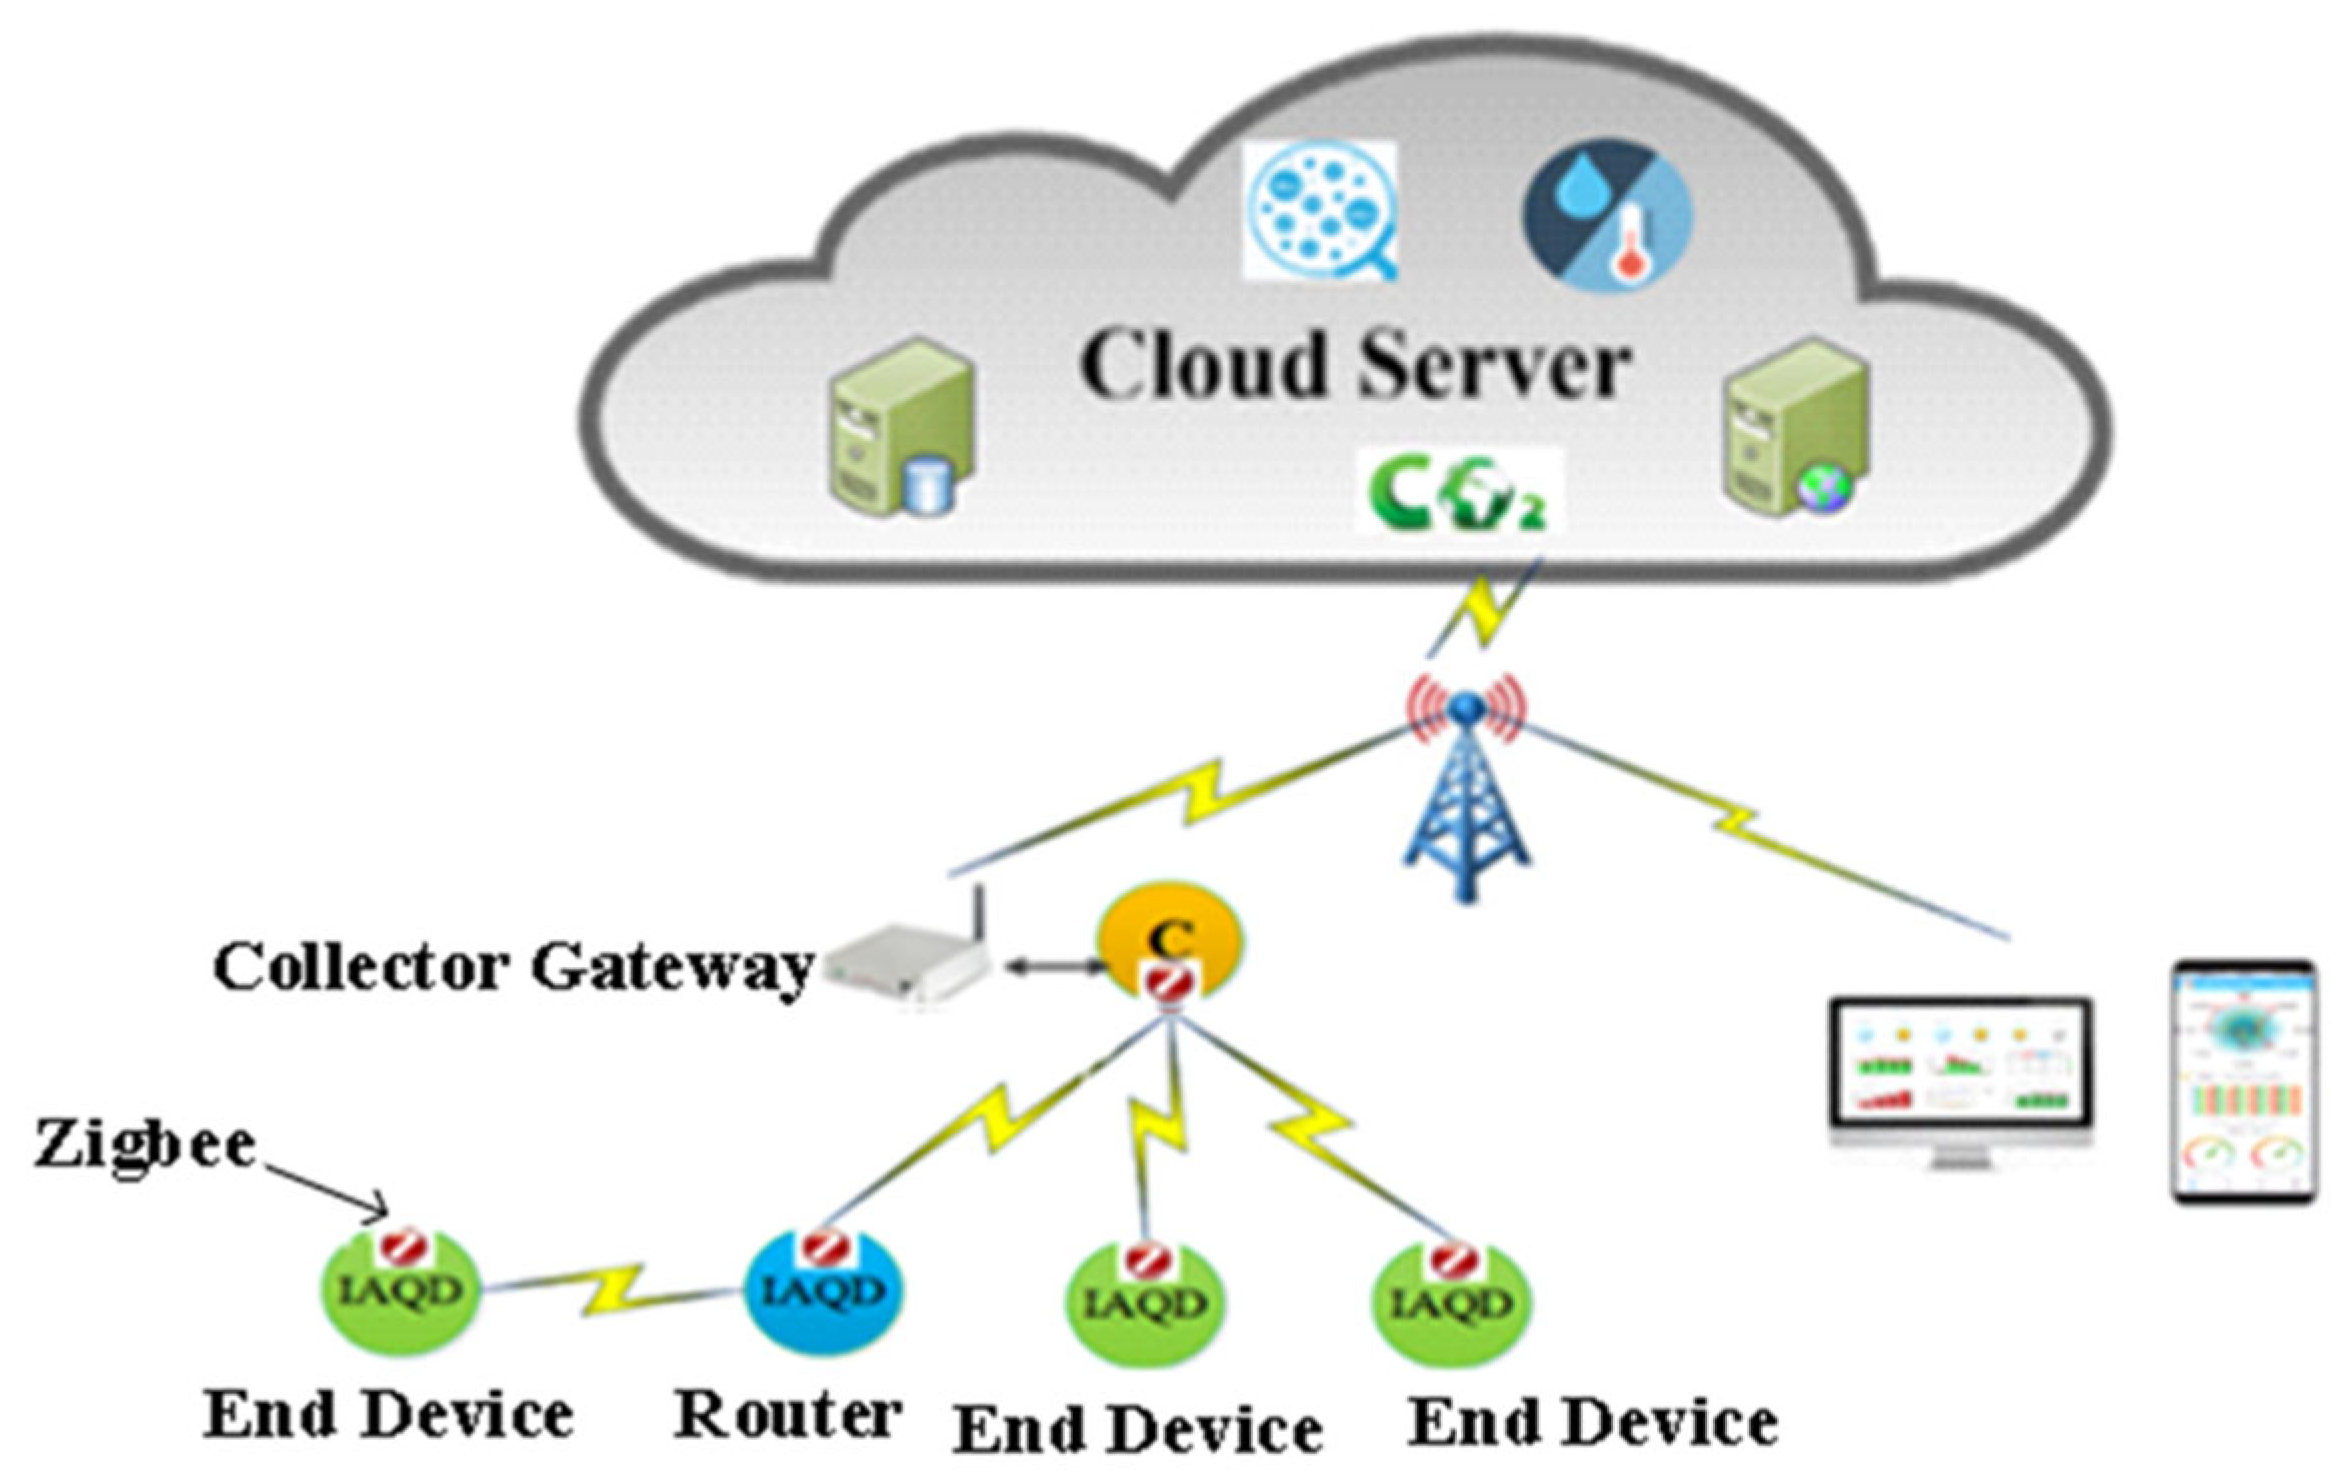
2.2. IoT-Based Monitoring Systems

IoT-based monitoring systems have significant potential to control carbon emissions. These systems enable organisations and individuals to track their CF (as shown in Figure 3), identify emission reduction opportunities, and make informed decisions about energy usage [28,29].
Benammar et al. [30] created an IoT platform that monitors real-time indoor air quality. This includes standards for various sensor technologies, wireless sensor networks (WSNs), and smart mobile devices. A nearby gateway handles and distributes data through a web server to users. The system uses Emoncms to store indoor air quality monitoring (IAQM) data for immediate and long-term monitoring. The study enables the measurement of various air quality parameters, including relative humidity, ambient temperature, CO, CO2, NO2, O3, SO2, and Cl2. The research highlights the potential of IoT-based monitoring systems in carbon emission control, particularly in indoor environments [30].
Key advantages of IoT-based monitoring schemes are their ability to collect and analyse statistics in real time. This allows organisations to respond quickly to changes in energy use and make adjustments as needed. For instance, a smart building system can monitor energy use and automatically adjust lighting and heating based on occupancy and ambient light levels.
Nayak [31] developed an IoT-based solution to continuously detect vehicle emissions and provide alerts in smart cities. Data from the prototype were stored in the cloud, correlated with vehicle emissions, and then processed with a warning system. Sensors, photon particle boards, and IFTTT (If This, Then That) were used to build the system. The tool has been tested on various vehicles, and the results have been compared to those obtained with currently available emission test methods. The results obtained showed that the prototype could track emissions from vehicles and warn vehicle users to perform proper regular maintenance of their vehicles.
Bagus et al. [29] focused on implementing an IoT-based scheme to monitor energy usage. The scholars conducted a review to investigate the use of IoT in energy management systems. Their study showed that IoT solutions for energy management include microcontrollers, sensor modules, communication protocols, and cloud-based systems. Their research findings revealed three categories. First, 73% of the studies focused on simulations or device trials related to energy management using IoT. Second, a smaller portion of the research (17%) involved the development of prototypes. Third, a limited number of studies (10%) focused on actual implementation. The commonly deployed microcontrollers for constructing IoT systems were Arduino and NodeMCU. The choice of sensors varied depending on specific measurement requirements, with current and voltage sensors commonly used [29].
A smart CO2-monitoring platform based on IoT-cloud planning for small cities in beyond the fifth generation (B5G) was presented by Zhang et al. [12]. The model proposed by the authors enables the real-time estimation of CFs at the block and street levels. They also developed a smart carbon-monitoring platform incorporating IoT technology and traditional carbon control methods. This platform facilitates the monitoring and managing of low-carbon development in towns. The authors recommend exploring future research directions to enhance the technical system’s meticulous monitoring and fiscal cost. The authors provide a practical solution for implementing smart carbon-efficient town monitoring.
Ma and Wang [32] created a model using deep neural networks to balance minimising carbon emissions and maximising energy and the resource economy. To achieve this, the authors developed carbon emission prediction models and incorporated game theory to optimise the resource economy. The simulation outcome indicated that the successful model enhanced the maximisation of energy resources and reduced the CF economically. The authors recommend that future research conduct numerous empirical studies to uncover the underlying factors impacting carbon emission prediction. The authors demonstrated their model’s efficacy in reducing carbon emissions while maximising the resource economy.
Employing a Raspberry Pi, Sruthi et al. [33] implemented an IoT-based system that monitors and controls CO2 emissions from municipal transport, industries, and forest fires. The system senses CO2 levels in a city and finds the most polluted areas. In addition, a smart system will be put in place for the early detection of forest fires. The authors suggest extending their system to detect other harmful gases. They conclude that their system can help reduce global warming by monitoring and controlling CO2 emissions in real time.
An outstanding benefit of IoT-based monitoring systems is their ability to provide detailed insights into energy use patterns [34]. By analysing data from sensors and other sources, organisations can identify areas where they can make changes to reduce their CFs. For instance, they may identify specific equipment or processes that consume more energy than necessary or times of the day when energy use is exceptionally high.
There are also several challenges in implementing IoT-based monitoring systems for carbon emission control. These systems require significant hardware, software, and personnel investments to install and maintain. Additionally, privacy concerns are related to collecting and analysing data from individuals and organisations. This underscores the obstacles tied to adopting IoT-based monitoring systems for controlling carbon emissions. These hurdles encompass substantial hardware, software, and human resource requirements for the setup and upkeep. Furthermore, a noteworthy privacy issue is linked to data collection and scrutiny from individuals and entities. While IoT monitoring holds potential for carbon emission management, the demanding resource needs and privacy considerations pose significant challenges to its successful implementation.
Overall, IoT-based monitoring systems have the potential to be powerful tools for carbon emission control. As technology improves and costs decrease, we expect to see more widespread adoption of these systems in the coming years. However, it is essential to consider these systems’ potential benefits and challenges before investing in them.

2.3. Visualisation Platforms for Tracking the Carbon Footprint

Several visualisation platforms can help track and visualise CF data. Some of the popular options are described below.

2.3.1. Carbon Analytics

Carbon Analytics is a cloud-based platform that provides tools for tracking and analysing carbon emissions. It allows for collecting and managing energy consumption, transportation, waste, and more data. In addition, the platform offers interactive dashboards and reports that allow an organisation to easily understand its CF.

2.3.2. Climate View

Climate View is a data visualisation platform representing an organisation’s CF. It allows emission tracking across different sectors and visualises the impact of various mitigation strategies. Ytreberg et al. [35] researched digital climate nudges. Nordic online food retailers used to encourage climate-friendly food choices. In this study, we categorised nudges into three categories: decision-making information, structure, and support. These nudges aim to make decision making easier for customers and decrease the amount of mental effort required. Examples of decision structure nudges include prominently displaying low-emission products and recipes. CF apps and climate labels are commonly used as decision information nudges. However, the study reveals that non-salient nudges have a limited impact, and there are difficulties in calculating product footprints. Additionally, the absence of industry norms for emission data and labelling makes it difficult for clients to compare emissions from different stores [35].
Heydarian and Golparvar-Fard [36] studied a framework for monitoring construction operations that was proposed to control productivity and the CF. An automated visual sensing technique was used to track construction equipment, increasing productivity and reducing the CF. To improve productivity and cut CF emissions, project managers were able to monitor their activities in real time using the framework and make adjustments to the construction plan and operation methods. The authors suggested that this approach could significantly impact the current construction practice and its adherence to Environmental Protection Agency (EPA) regulations on construction GHG emissions.
Similarly, Zaman and Jhanjhi [37] created a novel platform utilising a range of sensors to offer intelligent contracts to minimise carbon emissions. This is achieved through data visualisation, industrial control, and activity mapping. The developers used a qualitative approach, including document analysis, to assess the feasibility of using blockchain technology in carbon trading. According to the authors, blockchain technology can effectively address existing issues within carbon trading systems and provide a just and effective solution. Carmeli et al. [38] suggest a platform that effectively combines expertise, marketplaces, and motivations to encourage and pay individuals to reduce their CFs. Individual carbon tracking, healthiness and fitness, social media, and financial motivations are all interconnected in this five-part platform. By integrating a target-and-prize feedback loop with Big Data, CarbonKit can become vital to people’s daily lives. The article also discusses the technology platform and the concerns surrounding privacy and security, incentives, stakeholders, and potential submissions for CarbonKit in British Columbia. Ultimately, the authors concluded that combining technology, markets, and incentives can motivate and empower individuals to take action and reduce GHG emissions.
An indoor air quality monitoring and control system (IAQMC) was developed by Zhao et al. [39]. This groundbreaking system uses IoT technology and fuzzy inference. It includes a new Fuzzy Air Quality Index (FAQI) model for assessing IAQ and a Simple Adaptive Control Mechanism (SACM) that automatically adjusts the IAQMCS based on the real-time FACI value. The results demonstrated that the method accurately measures multiple air parameters and performs excellently in assessment precision, the average FAQI score, and overall IAQ.
A comparison of global household CF characteristics and driving factors was performed using a dynamic input–output model by Han et al. [40]. The consequences are that food consumption contributes the maximum share of CO2 emissions in developing countries, and residential real estate consumption makes up the peak share in developed countries. The authors suggested that their findings could support countries in adapting their emission reduction strategies to local circumstances. The article concludes that reducing relevant segments’ CF intensity and consumption formation was a better starting point to lessen emissions.
Liao et al. [41] and Lin et al. [42] researched AI’s environmental impacts. They developed a platform for carbon-neutral management and services by analysing documents from the International Telecommunication Union (ITU) and the China Internet Society (ISC), respectively. According to these papers, AI-enabled smart services can optimise processes and reduce emissions. The authors advise more research to justify, validate, and confirm their design results. Their technology strategy is straightforward, practical, and flexible.
A Carbon, Health, and Savings System (CHSS) was proposed in [43]. The authors interviewed experts in various fields to gather information and opinions on designing and implementing a personal carbon-trading system. The CHSS would integrate technical know-how, markets, and encouragement to reward individuals for dropping GHG emissions. The authors propose a minimum viable product approach to implementing the CHSS in stages. The article concludes that personal carbon trading could complement existing carbon pricing policies by providing psychological framing and feedback for individual consumers.
Analytical methods for assessing and visualising building carbon emissions are presented in [44]. The authors present a collection of indicators that break down the embodied emission outcomes and an accumulation of the building’s record data. Upcoming emission reductions brought on by high-tech advancements were also modelled using the technique. The approach was verified with a case study identifying the leading causes of embedded emissions and practical mitigation measures. This approach integrates case-specific and statistical data to create the basis for further application during the project phases.
Hoffmann et al. [24], in their study in 2022, looked at what drives people to use CF-tracking apps. These apps help individuals monitor and control their carbon emissions. The study found that people are more likely to use these apps if they believe technology can help solve the problem. However, the ease of use and privacy concerns affect this relationship. Policymakers, app designers, and marketers can use this research to promote app development and address these concerns to encourage adoption and reduce carbon emissions [24].
Magtibay et al. [45] developed an energy-monitoring system called “Green Switch” in their IoT-based research. This system was installed in Mabiniville, De La Salle Lipa. There are almost 100 rooms in the building, of which students use about 70 for lectures and laboratories. Rooms are available from 7:30 to 21.00 h every day. Researchers used IoT technology to create a system that monitors and controls outlets and lighting in each room.
The system can calculate the total kilowatt hours (kWh) used up. It uses a NodeMCU, current and voltage sensors, a Raspberry Pi3, and the school’s network infrastructure to transmit data to and from a server to accomplish this task. Consequently, using this data, building managers can analyse consumption patterns and take action to reduce the building’s CF. The hardware placement leverages the building’s existing wiring connections, making it easy to set up and use. In addition, an easy-to-use web application was created that allows users to access system functions and data from their desktops or mobile devices to create new responses [45].

2.3.3. PowerDash

PowerDash is an energy management platform that tracks and visualises energy consumption and carbon emissions. It provides real-time data on energy use and allows goals to be set and progress to be tracked toward reducing CFs. Magtibay et al. [45] developed “Green Switch,” an IoT-based energy-monitoring system for the Mabini Building at De La Salle Lipa. The system controls room lights and power outlets, calculating the total kWh consumed. It uses NodeMCU, sensors, a Raspberry Pi 3, and the school’s network. The building administrator can evaluate consumption stats and reduce the CF. A user-friendly web app was also developed for easy access [45].

2.3.4. Energy Elephant

Energy Elephant is an energy management platform that helps organisations track and reduce carbon emissions. It provides various tools for monitoring energy use and carbon emissions and offers customisable reports and dashboards to help visualise and understand the CF.
Ramelan et al. [9] built a low-cost IoT system employing LoRa and MQTT to monitor and control building energy. The system includes energy sensors, a microcontroller, a LoRa-WiFi module, and a gateway. Nodes equipped with Arduino Uno and sensors communicate with an IoT cloud server via Dragino LoRa Gateway LG01-N. The system optimises energy consumption and uses the open-source Thingspeak platform for data visualisation and device control; the study showcases a cost-effective approach to building energy management using IoT technology. The accuracy errors for voltage, current, and power sensors were 1.24%, 2.60%, and 3.13%, respectively [9].
These are just a few visualisation platforms for tracking and visualising CF data. Choosing a platform that meets the desired needs and provides the level of detail and insight required to manage an organisation’s CF effectively is important.

2.4. IoT-Based Visualisation Platforms for Tracking the Household CF

IoT-based visualisation platforms for tracking household CFs are becoming increasingly popular as people become more aware of the effects of their daily activities on the environment. Energy and water usage and other environmental aspects can be tracked through these platforms thanks to the IoT devices that monitor them.
One instance of an IoT-based visualisation platform is the Carbon Track system. This system uses IoT sensors to monitor the energy usage of various appliances in the household, as well as the amount of water consumed and the temperature and humidity levels inside the home. The data collected by the sensors are transmitted to a cloud-based platform, processed and analysed, and then presented to the user in a simple and intuitive dashboard.
Ming et al. [46] worked on IoT-based and cloud-based technologies for real-time CO2 monitoring. The approach in this paper is considered a highly effective solution for monitoring environmental CO2 levels. It is seamlessly integrated with IoT and cloud computing technologies. The techniques mentioned earlier can provide readily available and up-to-date data visualisation, which can greatly enhance the efficiency of analysis and the deployment of counter-measures for smart homes. A monitoring system was created to collect, store, and display CO2 concentration data using a CO2 sensor labelled MQ135, a Wi-Fi module labelled ESP8266, the Firebase Cloud Storage Service, and Carbon in a mobile application (app) for visual representation. This system successfully collected, stored, and visualised 2880 data points within a 10-day timeframe with a 30 s interval [46].
Sruthi et al. [33] recently worked on a project that involved creating a smart IoT system to monitor CO2 levels and detect forest fires. Sensors and a Raspberry Pi were utilised to detect emissions and alert authorities promptly and accurately. The statistics are secured in a cloud server for analysis. The system provides actionable information to help reduce risks from climate change. The authors suggest that future research could focus on the real-time monitoring of CO2 concentrations and the provision of the current atmospheric status to users through a web portal or mobile application. In conclusion, the system provides an effective way to monitor and control pollution caused by CO2 emissions.
Zhang et al. [47] published a study on smart CO2 emissions measurement and monitoring in smart logistics. They used a technique called carbon emission factors to analyse the CFs of smart logistics processes. They developed a carbon emission and energy consumption evaluation system built on distributed 5G intelligent logistics. The authors developed an intelligent logistics supply chain that considers CO2 emissions. This research provides a basis for improving the environment, reducing carbon emissions, and increasing energy efficiency in shared smart logistics through reduced building energy consumption.
Similarly, Mao et al. [48] proposed an IoT-based system background for real-time carbon discharge monitoring in prefabricated construction. To determine GHG emissions, they traced their origins back to specific processes. The system collects and displays real-time emission data by integrating a distributed sensor network with a virtual model generated through building information modelling (BIM). It was used in a component manufacturing setting to ensure the system’s viability and practicality. The authors believe this method has the potential to streamline emission monitoring in real time, enhance decision making, and cut operational expenses. The authors believe that further studies can improve the precision of carbon emission data.
Bilotta and Nesi [49] utilised data from sensors and reconstruction to estimate the CO2 emissions produced by IoT traffic flow. They created a model that considers congested and uncongested conditions in assessing CO2 emissions based on traffic flow data. The model was tested in the urban environment of Florence and successfully computed the city’s CO2 distribution. The authors presented an approach that characterises certain city traffic flow based on emission factors to estimate CO2 emissions from traffic flow data.
Furthermore, Malmodin and Lundén [50] and Steen-Olsen et al. [51] conducted a comprehensive study to estimate the energy and CFs of the global information and communication technology (ICT) and entertainment and media (E & M) sectors between 2010 and 2015. The study also included a forecast for 2020 and utilised an extensive dataset comprising both primary and secondary data. Surprisingly, despite increased subscriptions and data traffic, the ICT and E & M sectors reduced their CFs. The authors recommend conducting further research to stay updated on their progress.
A Vehicle Pollution Monitoring System using IoT was developed by Khatun et al. [52]. To monitor the vehicle’s emissions in real time, they installed a gas sensor at the exhaust, among other sensors. The data are then forwarded to the vehicle’s operator through GSM and the cloud, where they are checked against industry norms. The system’s performance has been validated and can significantly reduce and regulate emissions. In future research, the model can be used to monitor other harmful gases and be applied in various industries to reduce air pollution.
The authors of [53] proposed creating a web-based dashboard to track the green highway rating assessment and CF. This dashboard uses data from the Malaysian Green Highway Index (MyGHI) and the CF Calculator (CFC) and was constructed using qualitative and quantitative research techniques. The proposal serves as a working example for academics by digitally integrating MyGHI-CFC and displaying the results, giving them access to efficient tools and standards that can aid in creating green roads and other future sustainability endeavours. According to the authors, this novel approach to digitising green technology would enable stakeholders to proceed with projects more quickly and efficiently.
Tsokov and Petrova-Antonova [54] proposed an IoT platform called EcoLogic for the real-time monitoring and control of vehicle carbon releases. The platform comprises hardware modules installed on vehicles and cloud-based applications for data processing, analysis, and visualisation. The authors conducted a case study to validate the feasibility of the proposed solution. They identified future research directions, such as optimising the solution to split data into subsets, implementing an analytics functionality for the prediction of possible failures in vehicles, and integrating EcoLogic with third-party systems and services. The authors concluded that EcoLogic is a complete solution for monitoring and controlling vehicles’ carbon emissions.
Darniss et al. [55] suggested that a blockchain and IoT system can monitor and trade carbon credits to decrease CO2 releases and their environmental effects. The generation of electricity is a possible use for this system. Each entity can be awarded carbon credits based on usage by tracking and documenting emissions in a secure blockchain ledger. Then, one may use a blockchain-based exchange to buy and sell these credits. The research also features a proof-of-concept Ethereum implementation and performance analysis. Using blockchain and the IoT, this system provides an all-encompassing method for lowering carbon emissions and softening their effects.
In addition, Steen-Olsen et al. [51] conducted a study on the CF of Norwegian household consumption between 1999 and 2012. The study used a global multiregional input–output database, a Norwegian consumer spending survey, and an environmental input–output analysis. Transportation, housing, and nutrition have contributed to a 26% increase in CF since 1999. The authors argue that policymakers can use the methodology to analyse national footprint patterns and identify research priorities to reduce consumer effects on the environment.
Moreover, Xu et al. [34] and Lu et al. [56] proposed ECAMS, an IoT-based method for monitoring and assessing a building’s embedded carbon. Data gathering, data transfer, and data analysis form the backbone of this system. Sensor-based data collection and communication have been demonstrated through laboratory studies. The suggested system has the potential to significantly improve the accuracy and efficiency with which embodied carbon estimates for prefabricated buildings are calculated. Work must still be conducted before the system can be implemented, such as creating application programming interfaces and a database. In addition, it is recommended to undertake a field test to verify the system’s viability in actual building settings.
Liu et al. [28] focused on IoT multi-point indoor air quality monitoring. They developed an Indoor Air Quality Detector (IAQD) system that measured residential buildings’ CO2, PM2.5, temperature, and humidity. The system utilised Zigbee wireless technology to monitor and transmit data to a cloud server. The study showed that concrete walls affected the Zigbee network’s signal quality, leading to packet loss. In addition, cooking periods resulted in significantly higher PM2.5 concentrations, and closed doors at night led to increased CO2 concentrations, posing potential health risks. The research underscores the importance of monitoring PM2.5 levels, ensuring suitable ventilation, and addressing elevated CO2 concentrations, particularly during winter when ventilation may be limited. The custom energy-monitoring system utilises sensors to gather electrical power data. These sensors are connected to nodes that have a power supply and are linked to a microcontroller with a LoRa communication interface. Inside each node is an Arduino Uno, a Dragino LoRa Shield, an ACS712 current sensor, a ZMPT101B voltage sensor, and a relay. Dragino LoRa Gateway LG01-N uses the MQTT protocol as a broker to connect sensor readings to an IoT cloud server. Data Thingspeak was used in experiments to see data and manage devices remotely, resulting in significant energy savings. Sensors at the terminals were found to have 1.24%, 2.60%, and 3.13% precision errors for voltage, current, and power, respectively [28].
Jo et al. [57] developed a smart air device and web server that uses IoT and cloud-based computing to monitor the indoor air quality. The device measures aerosol concentration, VOCs, CO, CO2, and temperature–humidity levels and transmits data via LTE. The web server analyses data and displays air quality according to standards. The platform was successfully tested at Hanyang University [57]. Also, Ecoisme uses sensors to monitor the energy usage of appliances and devices. It generates personalised recommendations from an overview of their CFs by monitoring and tracking various energy-consuming devices, appliances, and systems in real time. This is achieved by the real-time monitoring and tracking of different energy-consuming devices, appliances, and systems; Ecoisme offers tailored energy efficiency advice derived from detailed energy usage data. However, these platforms can also present several challenges in reducing energy usage and lowering CFs. IoT-based platforms provide real-time feedback, identify areas for optimisation, and motivate sustainable practices.

2.5. Benefits of IoT-Based Visualisation Platforms

IoT has emerged as a promising technology for tracking and monitoring household carbon emissions. The IoT-based visualisation platform can track household CFs and recommend reducing carbon emissions. The following are its benefits:
(a)
Real-time monitoring: IoT-based visualisation platforms can monitor household carbon emissions. This can help individuals track their CFs and identify opportunities for reducing emissions.
(b)
Energy efficiency: IoT can be used to monitor household energy consumption, which can help identify areas where energy efficiency improvements can be made. This can include using energy-efficient appliances, lighting, and HVAC systems.
(c)
Behaviour change: IoT-based visualisation platforms can help encourage behaviour change by providing individuals with feedback on their carbon emissions. For example, if an individual uses more electricity than usual, the platform can alert them and provide recommendations for reducing energy consumption.
(d)
Data collection: IoT-based visualisation platforms can collect data on household carbon releases. These data can be used to identify trends and patterns in carbon emissions, which can help inform policy decisions.

2.6. Challenges and Limitations of Existing IoT-Based Visualisation Platforms

IoT-based visualisation platforms for households can have comprehensive challenges and limitations, including data accuracy and reliability, high costs, limited device compatibility, privacy and security concerns, user adoption, maintenance, and support. Using IoT devices and sensors to monitor household energy consumption can produce unreliable data, leading to inaccurate CF estimates and affecting the effectiveness of visualisation platforms. These platforms can also be expensive due to the high cost of IoT equipment and may not be compatible with all household appliances and systems. Privacy and security concerns must also be addressed, and regular maintenance is required for smooth functioning. Adoption may be limited due to a lack of awareness or technical expertise.
Overall, while IoT-based visualisation platforms have the potential to help households reduce their CFs, it is crucial to address these challenges and limitations to confirm their effectiveness and adoption.

3. Summary of Various Concepts Employed for Tracking Household Carbon Footprints

Tracking household CFs involves measuring and analysing various factors contributing to carbon emissions. The various concepts available to track household CFs, as discussed, include energy consumption data analysis [58,59,60,61,62,63,64,65], the use of surveys and questionnaires [66,67,68,69,70,71], life-cycle assessment (LCA) [66,72,73,74,75,76,77,78], IoT-based monitoring systems [10,12,59,71,79,80,81,82], carbon calculators and online tools [24,62,66,78,83,84,85,86,87,88,89,90,91,92], behavioural monitoring and feedback [64,87,93,94,95], and data integration and modelling [12,88,96,97,98,99]. The benefits, drawbacks and inferences for each concept are also highlighted.

3.1. Energy Consumption Data Analysis

The most frequently used method to monitor household CFs is energy consumption data analysis (ECDA). Data on energy usage must be gathered and analysed to quantify the carbon emissions linked to different household energy sources. Utility bills, smart meters, and energy-monitoring equipment are just a few places where energy consumption data can be found [72]. Utility bills offer historical information on fuel oil, natural gas, and electricity usage, often expressed in kWh or gallons [59]. Smart meters and energy-monitoring devices provide real-time or interval-based data on energy usage [81], enabling more detailed analysis.
Since different energy sources contribute to household carbon emissions, including electricity, natural gas, and fuel oil, each energy source has a specific carbon intensity or emission influence, representing the volume of CO2 discharged per unit of energy consumed [62]. Emission factors are typically measured in pounds or kilograms of CO2 per unit of energy (for example, CO2 kg/kWh) [62]. Conversion factors are applied to the energy consumption data to estimate carbon emissions. These issues are detailed for each energy source and are based on the average carbon concentration of the energy generation mix. For example, the conversion factor for electricity can be based on the carbon emissions per kWh generated by the local power grid. Carbon emissions associated with energy consumption are calculated by multiplying the energy consumption data by the appropriate conversion factors. For example, to estimate carbon emissions from electricity usage, the total kWh consumed is multiplied by the conversion factor for electricity. The exact process is applied to other energy sources, such as natural gas and fuel oil. An example of that of electricity consumption is shown in Equation (1).
E = T E C × E F
where E is the emissions in CO2 eq. The CO2 eq notation represents other gases besides CO2. These gases include methane, nitrous oxide, hydrofluorocarbons, perfluorocarbons, nitrogen trifluoride, and sulphur hexafluoride. Moreover, T E C and EF are the total energy consumption and emission factor, respectively [100].
Energy consumption patterns can vary throughout the year and within different periods. Considering these seasonal and temporal variations when estimating carbon emissions is important. For example, heating and cooling demands may differ significantly between summer and winter, impacting energy usage and associated emissions. ECDA provides a relatively accurate estimation of the household CF, directly relating energy consumption to carbon emissions. However, certain limitations should be considered. These include potential errors in data collection, variations in conversion factors based on regional energy sources, and the exclusion of indirect emissions (for example, embodied carbon in products). Also, ECDA can provide insights into household energy usage patterns and identify areas for energy efficiency improvements. Analysing trends and variations in energy consumption over time can help detect opportunities for reducing carbon emissions through behavioural changes, appliance upgrades, or insulation improvements. In addition, ECDA is valuable for policymakers, researchers, and energy providers for understanding household energy usage trends and formulating energy efficiency policies. The data can inform the development of targeted programmes, incentives, and regulations to decrease the CF at the household level. Energy consumption data can be integrated with other household data, such as transportation habits or waste generation, to comprehensively analyse the CF. This integration allows for a holistic understanding of the factors contributing to carbon emissions, enabling targeted interventions and behaviour change strategies.
Furthermore, presenting energy consumption data and carbon emissions estimates to households can raise awareness and engage individuals in reducing their CFs [62]. In addition, feedback mechanisms, such as energy dashboards or personalised reports, allow households to monitor their progress and compare their energy consumption with benchmarks or similar households, fostering a sense of competition and motivation for CF reduction. An effective tool that offers quantified insights into household CFs is ECDA, which provides a basis for comprehending how much energy is used.

3.1.1. Benefits of Energy Consumption Data Analysis

i.
Cost Savings: The utility bills and overall operation costs can be lowered due to the discovered energy-saving options.
ii.
Environmental Impacts: It can pinpoint areas for efficiency improvements, lowering carbon emissions and supporting sustainability goals.
iii.
Behavioural Insights: It helps understand usage patterns and habits, enabling informed decisions for energy conservation.
iv.
Data-Driven Decisions: It allows informed choices to be made based on accurate energy usage data, enhancing overall energy management strategies.

3.1.2. Drawbacks of Energy Consumption Data Analysis

i.
Data Quality Issues: Inaccurate or incomplete data can lead to misleading analysis and ineffective decision making.
ii.
Complexity: Data analysis requires expertise, and complex models may be challenging to interpret correctly.
iii.
Initial Investment: Implementing data collection systems and analysis tools can involve significant upfront costs.
iv.
Behavioural Resistance: People might resist making behavioural changes suggested by data analysis due to habits, convenience, or perceived inconvenience.
Through insights derived from a thorough analysis of consumption patterns and behaviours, ECDA encourages well-informed decision making, increases energy efficiency, and lowers CFs.

3.2. Surveys and Questionnaires

Surveys and questionnaires (SaQs) are widely used for gathering data and insights on various aspects of human behaviour, including tracking household CFs. They provide a structured approach to collecting information, allowing researchers to assess individual behaviours, attitudes, and practices contributing to carbon emissions. The design of the survey or questionnaire is crucial for obtaining accurate and meaningful data. Researchers should clearly define the research objectives and identify the information needed to track household CFs. The questionnaire should be designed to collect data on relevant factors such as transportation, energy consumption, waste management, and other practices influencing carbon emissions [24,66,69,71,84,87].
Determining the appropriate sample size and sampling method is essential for ensuring the representativeness of the target population [66,69]. Various sampling techniques, including random, convenience, or stratified, can be employed based on the research goals and available resources [101]. A diverse sample that reflects the target population’s demographic and geographic characteristics helps ensure the findings’ generalisability. SaQs can be administered through different methods, including face-to-face interviews, telephone surveys, mailed questionnaires, or online surveys [101]. Different data collection methods have advantages and limitations. SaQs use self-reported data to gather valuable insights on household behaviours related to carbon emissions. However, self-reporting can be biased, so researchers need to minimise bias by providing clear instructions and ensuring anonymity. SaQs also collect demographic data to explore associations between demographics and CF. It assesses individuals’ attitudes, knowledge, and awareness regarding climate change, carbon emissions, and environmental issues. This helps identify factors influencing individuals’ willingness to reduce their CFs.
Data from SaQs can be analysed using various statistical techniques [101]. The descriptive analysis provides an overview of the sample characteristics, behaviour patterns, and attitudes. Inferential analysis, such as regression or correlation analysis, can examine relationships between variables and identify significant predictors of carbon emissions. Simultaneously, the qualitative responses can be analysed using thematic or content analysis to uncover themes and patterns. In addition, SaQs can be conducted at multiple time points, allowing for longitudinal data collection. Longitudinal studies provide insights into changes in behaviours, attitudes, and awareness over time, helping researchers track the effectiveness of interventions and identify trends in CF reduction. This longitudinal approach enhances the understanding of behavioural dynamics and enables the evaluation of long-term impacts. Similar to ECDA, SaQ data can be combined with other data sources. Researchers may fully comprehend household CFs and find connections between self-reported behaviour and that from an experimental study by merging several datasets.

3.2.1. Benefits of Surveys and Questionnaires

i.
Data Collection Flexibility: SaQs can be customised to gather a wide range of information, providing flexibility in capturing diverse perspectives and insights.
ii.
Scalability: These methods can be distributed to many participants, allowing for efficient data collection from a broad audience.
iii.
In-depth Exploration: SaQs’ open-ended questions encourage participants to give thoughtful comments, providing a rich context for the data.

3.2.2. Drawbacks of Surveys and Questionnaires

i.
Response Bias: Participants may not provide accurate or honest answers, leading to biased or unreliable data.
ii.
Limited Depth: Closed-ended questions may not capture complex opinions or experiences, limiting the depth of insights.
iii.
Question Interpretation: Participants may interpret questions differently, leading to misunderstandings and inconsistent responses.
iv.
Time and Effort: Designing, distributing, and analysing surveys can be time-consuming and resource-intensive for researchers.
In conclusion, SaQs are valuable instruments for gathering information and viewpoints, but their success depends on careful planning, truthful responses, and considering potential biases.

3.3. Life-Cycle Assessment

The ecological footprint of a product, service, or process is assessed across its full life cycle using a method called life-cycle assessment (LCA) [73]. It considers all stages, from raw material mining to manufacturing, use, and disposal. A household’s CF can be estimated more accurately by applying LCA to household activities, such as energy consumption, transportation, and waste generation.
Defining the purpose and parameters of the evaluation is the first stage in conducting an LCA [77]. Objectives, limits, functional units, and life-cycle phases must be defined to assess a product’s or process’s environmental impact. Data on inputs and outputs are collected from various sources and organised using life-cycle inventory databases. Impact assessment techniques are applied to the inventory data to put numbers on the environmental effects [10]. Climate change, resource depletion, acidification, eutrophication, and human toxicity are only some of the impacts that Eco-indicator 99 [72] appraises. The environmental effects of a product or process can be better understood using these techniques. The impact assessment results are analysed and interpreted at the interpretation stage. To ease comparison and decision making, the findings are frequently presented as environmental indicators, like CF. A sensitivity analysis can be performed to determine the findings’ reliability and zero in on the parameters or steps responsible for the most severe environmental impacts. The interpretation stage aids in comprehending the findings’ importance and locating areas for development.
LCA has certain limitations and challenges that should be considered [73]. Results from CAs can be trusted if they are based on high-quality data, reasonable assumptions, and well-delineated system boundaries. LCA can be data-intensive and time-consuming, requiring data collection, modelling, and interpretation expertise. LCA does not comprehensively capture all environmental and social aspects, such as social impacts or ecosystem services. Therefore, it should be used with other assessment tools to gain additional insights.

3.3.1. Benefits of Life-Cycle Assessment

i.
Holistic View: LCA considers the entire life cycle of a product or process, providing a comprehensive understanding of environmental impacts, from resource extraction to disposal.
ii.
Comparative Analysis: LCA allows for comparisons amongst products, processes, or scenarios, helping identify more sustainable alternatives.
iii.
Identifying Hotspots: LCA highlights key stages with the most significant environmental impacts, allowing targeted interventions for emission reduction.

3.3.2. Drawbacks of Life-Cycle Assessment

i.
Data Availability: LCA requires extensive data, and obtaining accurate, reliable, and comprehensive data for all life-cycle stages can be challenging.
ii.
Complexity: LCA involves complex methodologies and requires expertise in various disciplines, making it resource-intensive and potentially prone to errors.
iii.
Interdisciplinary Challenges: Conducting LCA requires collaboration between experts from different fields, leading to communication and coordination challenges.
Finally, LCA provides a thorough framework to assess how products and activities affect the environment, assisting in sustainable decision making by considering all phases of their life cycles.

3.4. IoT-Based Monitoring Systems

IoT-based monitoring systems track energy use and other environmental variables in real time using sensors and networked devices [12,80,81,82]. For example, smart meters, smart thermostats, and other IoT devices can provide detailed information on electricity usage, heating and cooling patterns, and indoor air quality. This methodology enables households to track their CFs continuously and make real-time adjustments to reduce emissions.
IoT monitoring systems for tracking household CFs have gained significant attention recently. These systems leverage IoT technologies to monitor and analyse various aspects of household energy consumption, enabling a more detailed and real-time assessment of carbon emissions. Research has explored the potential of IoT monitoring systems in tracking household CFs and identifying opportunities for energy efficiency improvements [12,80,81,82].
One key advantage of IoT monitoring systems is that they can provide granular and real-time data on energy consumption. These systems employ a combination of sensors, smart meters, and connected devices to monitor electricity usage, heating and cooling patterns, water consumption, and other relevant parameters. For instance, smart meters can measure energy consumption at different intervals, providing detailed insights into usage patterns throughout the day [80]. IoT monitoring systems offer real-time data collection, identifying peak energy usage and providing personalised feedback and recommendations for energy conservation. Homeowners can optimise their energy usage and reduce carbon emissions through the remote control of energy-consuming devices and integration with renewable energy sources.
There are some difficulties with IoT monitoring devices for tracking household CFs. Data privacy and security concerns should first be addressed to secure the confidentiality and integrity of the data gathered. Implementing effective data encryption, access controls, and data anonymisation mechanisms is essential to preserve user privacy and stop unauthorised access to sensitive information [102]. Secondly, the scalability and interoperability of IoT monitoring systems should be considered. As connected devices increase, ensuring seamless integration, compatibility, and standardised communication protocols becomes essential. This allows for easy deployment, integration with existing infrastructure, and data exchange between different systems and platforms.

3.4.1. Benefits of IoT-Based Monitoring Systems

i.
Real-Time Data: IoT systems provide real-time data collection and analysis, enabling prompt decision-making and change responses.
ii.
Remote Monitoring: IoT allows devices and processes to be monitored and controlled remotely, enhancing convenience and efficiency.
iii.
Predictive Maintenance: IoT systems can predict maintenance needs based on data patterns, reducing downtime and extending the equipment lifespan.
iv.
Sustainability: IoT-based systems enable resource-efficient operations, reducing waste, energy consumption, and environmental impacts.

3.4.2. Drawbacks of IoT-Based Monitoring Systems

i.
Security Risks: IoT devices are vulnerable to hacking and data breaches, potentially compromising sensitive information.
ii.
Complex Implementation: Setting up IoT systems can be complex and require technical expertise, making deployment challenging.
iii.
Data Privacy Concerns: Collecting personal or sensitive data through IoT devices can raise privacy concerns, requiring careful management.
iv.
Reliability Issues: IoT systems rely on connectivity and can experience downtime or malfunctions if the network is unstable.
IoT-based monitoring systems offer real-time visibility and control over numerous processes, enabling increased productivity, sustainability, and informed decision making in various applications.

3.5. Carbon Calculators and Online Tools

Carbon calculators and online tools provide a user-friendly interface for households to input their consumption data and receive estimates of their CFs [89,103,104]. Carbon calculators and online tools are efficient and straightforward, providing individuals and organisations with the means to measure their GHG emissions. These tools use algorithms and databases to calculate emissions based on user inputs and predefined factors, helping users understand their environmental impacts and identify areas for improvement. One of the key benefits of carbon calculators and online tools is their accessibility and ease of use [89]. Carbon calculators and online tools are widely available and user-friendly. They cover various emission sources and activities, including energy consumption, transportation, waste management, and travel. Users input data related to their habits and indirect emissions, ensuring accuracy with comprehensive databases and emission factors. These databases contain information on emission factors for various activities, such as energy consumption, transportation modes, and waste management practices [24]. Emission factors represent the average emissions associated with a specific activity per consumption unit or distance travelled. These factors are based on scientific research, industry data, and national emission inventories, ensuring a consistent and standardised approach to CF calculations [105]. In addition to calculating CFs, many online tools provide features for goal setting, tracking progress, and suggesting mitigation measures. Users can set targets to reduce emissions and track their progress over time. These tools often offer recommendations and strategies for emission reductions, such as energy efficiency measures, renewable energy adoption, waste reduction, and sustainable transportation options. Some tools may even provide personalised feedback and tips based on user inputs and specific emission hotspots [103].
It is important to note that carbon calculators and online tools have limitations [88]. Data inputs, which may be prone to estimation or user bias, affect the accuracy of calculations. Moreover, these tools often rely on default emission factors and assumptions, which may not capture unique circumstances or regional variations. Considering these limitations and using the results as a starting point for further analysis and improvement is important.
In conclusion, carbon calculators and online tools are valuable resources for tracking and managing CFs. They provide accessibility, ease of use, comprehensive coverage of emission sources, and a range of features for goal-setting and mitigation strategies. By empowering individuals and organisations to assess their CFs and make informed decisions, these tools contribute to the broader efforts of mitigating climate change and promoting sustainability.

3.5.1. Benefits of Carbon Calculators and Online Tools

i.
Awareness and Education: Carbon calculators raise awareness about personal CFs, educating users about the environmental impacts of their choices.
ii.
Behaviour Change: Calculators motivate individuals to adopt more sustainable behaviours by quantifying their emissions and suggesting reduction strategies.
iii.
Easy Assessment: Online tools provide a user-friendly platform for assessing CFs, making the process accessible and understandable.
iv.
Goal Setting: Carbon calculators allow users to set reduction goals and track progress, fostering a sense of achievement and continuous improvement.
v.
Comparative Analysis: These tools enable users to compare their footprints with benchmarks, helping contextualise their efforts and stimulate sustainability competition.

3.5.2. Drawbacks of Carbon Calculators and Online Tools

i.
Data Accuracy: Accuracy depends on user inputs, which can be estimated or inaccurate, leading to unreliable CF calculations.
ii.
Scope Limitations: Carbon calculators might focus on certain emission sources, omitting less obvious but still significant contributors to CFs.
iii.
Behaviour Change: While calculators promote behaviour change, they might not account for potential rebound effects or unintended consequences of changes.
iv.
Assumption Variation: Different calculators may use varying assumptions and methodologies, leading to inconsistent results and confusing users.
To sum up, carbon calculators and online tools provide simple ways to measure and increase awareness of personal CFs, promoting wise decision making and encouraging actions that support environmental sustainability.

3.6. Behavioural Monitoring and Feedback

This involves tracking and monitoring individual behaviour and providing personalised feedback on carbon emissions [24]. It can be implemented through smartphone applications, wearable devices, or online platforms. By tracking behaviours such as energy usage, transportation choices, and waste management, individuals can receive real-time feedback and suggestions for reducing their CFs [106]. Behavioural monitoring involves collecting and analysing data on individuals’ actions, habits, and choices related to energy consumption, transportation, waste management, and other environmentally relevant activities [64,87]. Energy usage, travel, recycling, and water consumption data can be collected through smart meters, sensors, apps, or self-reporting. These data are used to provide feedback to individuals on their environmental impacts through channels such as mobile apps, web portals, email, or in-person interactions [93]. Feedback comes in different forms, like personalised reports, alerts, or peer group comparisons; timely and relevant feedback is crucial, and real-time feedback is always more effective. For example, energy consumption data on a smart thermostat show the immediate consequences of adjusting settings or turning off appliances [94]. In addition, these systems can reduce CFs and foster a more sustainable society by integrating real-time monitoring, tailored feedback, persuasive techniques, and social influences [24].

3.6.1. Benefits of Behavioural Monitoring and Feedback

i.
Awareness: Monitoring provides individuals with insights into their behaviours, making them more conscious of their actions’ environmental impacts.
ii.
Behaviour Change: Feedback prompts users to modify behaviours, encouraging the adoption of sustainable practices and reducing CFs.
iii.
Customisation: Systems can offer personalised recommendations based on individual behaviours, enhancing the effectiveness of behaviour change strategies.
iv.
Long-Term Sustainability: Behavioural changes prompted by monitoring and feedback can lead to lasting habits and a sustained reduction in carbon emissions.

3.6.2. Drawbacks of Behavioural Monitoring and Feedback

i.
Resistance and Inertia: Individuals may resist behaviour changes suggested by feedback due to habits, inconvenience, or psychological barriers.
ii.
Data Privacy Concerns: Monitoring behavioural data can raise privacy concerns, especially if personal information is collected and stored.
iii.
Behavioural Complexity: Not all behaviours are easily trackable or amenable to change through feedback systems, limiting their effectiveness in some cases.
iv.
Overreliance on Technology: Relying solely on technology for behaviour change may neglect broader systemic, cultural, or psychological factors influencing actions.
Behavioural monitoring and feedback systems are crucial in promoting sustainable behaviours and fostering positive environmental change by raising awareness, enabling informed decision making, and promoting eco-friendly activities.

3.7. Data Integration and Modelling

For a more complete understanding of the household CF, it is helpful to combine data from other areas, such as energy use, transportation, and waste data [107]. In addition, data modelling techniques, such as regression analysis or machine-learning algorithms, can be applied to identify significant variables and their impacts on carbon emissions. Combining multiple methodologies can provide a more accurate and holistic understanding of household CFs [71]. Researchers often use a combination of data sources and analytical techniques to understand the complexities of household emissions and enable targeted action to reduce CFs. One approach to data integration is using application programming interfaces (APIs) or data connectors [26]. These enable seamless data exchange between different systems and facilitate the retrieval and aggregation of data from various sources. For example, utility companies can provide APIs that allow users to access their energy consumption data directly, enabling integration with CF-tracking platforms.
Data modelling creates mathematical or statistical models that show how different variables affect carbon emissions. These models give insights into decision making and policy development. LCA is a commonly used modelling technique in CF analysis [75]. Another modelling technique is regression analysis, which examines the relationships between dependent variables (such as carbon emissions) and independent variables (such as energy consumption, transportation habits, and household characteristics) [108,109,110]. Regression models can identify significant factors and quantify their impact on CFs, providing valuable insights for behaviour change interventions and policy recommendations [108].

3.7.1. Benefits of Data Integration and Modelling

i.
Comprehensive Insights: Integration and modelling allow for a holistic view, revealing complex relationships and interactions within data.
ii.
Informed Decision Making: Integrated data and models provide evidence-based insights, aiding effective decision making and strategy formulation.
iii.
Prediction and Planning: Models can forecast trends and outcomes, supporting proactive planning and resource allocation.
iv.
Communication and Visualisation: Integrated data and visual models simplify complex information, aiding communication and understanding among stakeholders.

3.7.2. Drawbacks of Data Integration and Modelling

i.
Complexity: Integrating diverse data sources and building models can be complex, requiring expertise and resources.
ii.
Data Quality: Poor-quality or inconsistent data can compromise the accuracy and reliability of integrated results and models.
iii.
Assumption Dependency: Models often rely on assumptions, which, if incorrect, can lead to inaccurate predictions and decisions.
Although obstacles like data quality and complexity must be carefully considered for accurate and useful results, data integration and modelling offer vital insights for well-informed decision making and resource optimisation.
A summary of the diverse concepts available to track the household CF considered in the literature is shown in Table 2.

4. Implications for Research and Practice

The implications for research and practice stemming from the review of IoT-based visualisation platforms for tracking household CFs are as follows:
(a)
Advanced Analytics: Further research can explore advanced analytic techniques, as outlined in [136], such as ML algorithms, to advance the accuracy and reliability of CF calculations [136], enhancing the platform’s ability to provide actionable insights to users.
(b)
Integration with Smart Home Technologies: Investigating the integration of IoT-based visualisation platforms with smart home technologies enables seamless data collection and enhances user convenience, as highlighted in [137]. Such integration further optimises energy usage and reduces carbon emissions.
(c)
Longitudinal Studies: The authors of [138] conducted longitudinal studies to support the long-term effectiveness of IoT-based visualisation platforms in promoting sustainable behaviour. Monitoring user behaviour over an extended period provides insights into behavioural change patterns and factors influencing sustained environmental actions.
(d)
Awareness and Education: The findings from [139] emphasise raising awareness and educating individuals about their household CFs. Practitioners can use the insights from the research in [140] to develop educational materials and campaigns highlighting daily activities’ environmental impacts and promoting sustainable choices.
(e)
Personalised Feedback: IoT-based visualisation platforms, as shown by [141], provide personalised feedback to users regarding their carbon emissions. Practitioners can leverage this feature to deliver tailored recommendations and suggestions for reducing CFs, empowering individuals to make informed decisions and take meaningful actions.
(f)
Behavioural Nudges: The authors of [142] highlighted the potential of incorporating behavioural nudges, such as goal-setting and social sharing features, into IoT-based visualisation platforms with recommendations for practitioners to utilise the technique as sustainable behaviour, fostering a sense of competition, cooperation, and accomplishment among users.
(g)
Policy Support: The insights gained from this research can inform policymakers about the effectiveness of IoT-based visualisation platforms in tracking and reducing household CFs. It can encourage the development of supportive policies and incentives to promote the adoption of such platforms at a broader scale.
IoT-based visualisation platforms can be enhanced for better results. Practitioners, policymakers, and stakeholders can use these platforms to promote sustainable behaviour and reduce CFs.

5. Limitations of the Review

The review of IoT-based visualisation platforms for tracking household CFs has certain limitations, as identified below:
(a)
Limited Scope: The field of IoT-based visualisation platforms for tracking household CFs is an emerging field. Limited research in terms of scope and platforms is covered, as identified by [88]. Additional relevant studies and platforms were recommended for a plethora of research resource outputs in terms of technologies in the niche.
(b)
Heterogeneity of Existing Solutions: The authors of [143] identified that the diversity of existing IoT-based visualisation platforms for tracking household CFs varies significantly in design, functionality, and data sources; thus, heterogeneity makes it challenging to draw direct comparisons and generalise findings across all platforms.
(c)
Data Accuracy and Reliability: Data accuracy and reliability are critical in IoT-based visualisation platforms. However, due to the lack of proliferation of information in the visualisation of CF techniques, assessing accurate data in these platforms becomes challenging. In [144], the authors recommended future research in addressing the curation of accurate and reliable data.
(d)
User Engagement and Behaviour Change: In [145], the authors discuss user interaction and engagement features; they may not delve deeply into the effectiveness of these features in driving sustainable behaviour change. Understanding the long-term impacts of these platforms on user behaviour and assessing the factors influencing behaviour change require further investigation.
(e)
Lack of Longitudinal Studies: Many previous studies have focused on short-term evaluations of IoT-based visualisation platforms. Longitudinal studies assessing the long-term effects of these platforms on user behaviour and the environmental impacts are needed to provide more robust evidence.
IoT-based visualisation platforms can revolutionise how we monitor our household’s CF. However, privacy, user experience, and integration must be addressed to realise their full potential. Future research can refine and improve these platforms.

6. Suggestions for Future Research

Based on the review of IoT-based visualisation platforms for tracking household CFs, several suggestions for future research are outlined:
(a)
Privacy and Security: As IoT devices collect and transmit sensitive data, privacy and security concerns become increasingly important. Investigating privacy-preserving data collection and sharing mechanisms and robust data encryption techniques can enhance user trust and promote platform adoption. Balancing data granularity for accurate CF calculations and the protection of user privacy is also important. Therefore, future research should focus on developing secure and privacy-preserving IoT-based visualisation platforms.
(b)
User Experience and Design: The user experience of IoT-based visualisation platforms should be optimised to encourage behaviour change. This may include developing personalised recommendations and making the platform easy to use. Exploring different visualisation techniques, user interfaces, and interactive features can help identify the most effective approaches to presenting CF data and motivating sustainable actions. User-centred design methodologies can be employed to ensure that the platforms are intuitive, user-friendly, and appealing to a wide range of users.
(c)
Integration with Other Systems: Exploring seamless data integration from smart appliances, energy management systems, and other IoT devices can enhance the completeness and accuracy of CF calculations. IoT-based visualisation platforms should be integrated with other systems, like smart grids, to provide a more comprehensive view of carbon emissions. Research should focus on developing these integrations.
(d)
Standardisation: There is currently no standardisation for IoT-based visualisation platforms for tracking household CFs. Research should focus on developing standards to ensure interoperability and compatibility across different platforms. Additionally, investigating the interoperability and compatibility of different smart home technologies can facilitate broader adoption and scalability.
(e)
Longitudinal Studies: Conducting longitudinal studies to assess the lasting effects of IoT-based visualisation platforms on user behaviour and environmental impacts is crucial. Monitoring user behaviour over an extended period can provide insights into behaviour change patterns, the sustainability of adopted practices, and potential rebound effects. Long-term studies can also shed light on the durability of behaviour change and identify strategies to maintain sustainable habits in the long run.
By addressing these suggestions for future research, the development and implementation of IoT-based visualisation platforms for tracking household CFs can be enhanced, leading to improved accuracy, user engagement, and overall effectiveness in promoting sustainable behaviour.

7. Conclusions

This paper reviews new ways to explore and advance smart carbon control in general households, whose carbon emissions have been reported to account for three-quarters of global greenhouse emissions, using IoT technology. The deployment of IoT machinery in smart households brings about an improved, valued way of life, allowing for novel and superlative technological solutions. Revolutionary changes in communication systems, mainly inspired by the IoT, present much better control and monitoring possibilities in households. Energy efficiency models included in the smart house help in reducing energy consumption, and this ensures that the implemented smart house technology does not contribute to greenhouse gas emissions and does not result in a system that is vulnerable to climate-change-related problems. The diverse methodologies used to create an IoT-based visualisation platform for tracking household CFs have been discussed. IoT technologies deployed with high-level sensing devices, such as radio frequency identification, function sensors, and global positioning systems, have been highlighted for intelligent identification, monitoring, and control. In this paper, IoT-based visualisation platforms for tracking household CFs have also been extensively discussed. A diverse range of household data collection sensors and devices, including energy consumption monitors, water usage trackers, waste management systems, and transportation sensors, have been comprehensively discussed. Different energy management platforms, such as PowerDash, Energy Elephant, Carbon Analytics, and Carbon View, have also been discussed for tracing and visualising energy consumption and carbon emissions. The comprehensive challenges and limitations of IoT-based visualisation platforms, including data accuracy and reliability, high costs, limited device compatibility, privacy and security concerns, user adoption, maintenance, and support, have been discussed.
Based on this review and suggestions for future research, developing and implementing IoT-based visualisation platforms for tracking household CFs can be enhanced, leading to improved accuracy, user engagement, and overall effectiveness in promoting sustainable behaviour.

Funding

This research was funded by the Tertiary Education Trust Fund (TETFund), Nigeria, under the National Research Fund (NRF) Intervention with project ID TETF/ES/DR&D/CE/NRF2021/CC/CAE/00114.

Acknowledgments

This research was funded by the Tertiary Education Trust Fund (TETFund), Nigeria, under the National Research Fund (NRF) Intervention with project ID TETF/ES/DR&D/CE/NRF2021/CC/CAE/00114.

Conflicts of Interest

The authors declare no conflict of interest.

References

  1. Microsoft. What Is IoT (Internet of Things)?|Microsoft Azure. Available online: https://azure.microsoft.com (accessed on 5 July 2023).
  2. WRAP. Introducing the Carbon Waste and Resources Metric (Carbon WARM); WRAP: Banbury, UK, 2021. [Google Scholar]
  3. Agency Environmental Protection. Carbon Footprint Calculators. Available online: www.epa.ie (accessed on 5 July 2023).
  4. Khoa, T.A.; Phuc, C.H.; Lam, P.D.; Nhu, L.M.B.; Trong, N.M.; Phuong, N.T.H.; Van Dung, N.; Tan-Y, N.; Nguyen, H.N.; Duc, D.N.M. Waste Management System Using IoT-Based Machine Learning in University. Wirel. Commun. Mob. Comput. 2020, 2020, 6138637. [Google Scholar] [CrossRef]
  5. United Nations. United Nations Framework Convention on Climate Change; United Nations: New York, NY, USA, 1992. [Google Scholar]
  6. Sarrab, M.; Pulparambil, S.; Awadalla, M. Development of an IoT based real-time traffic monitoring system for city governance. Glob. Transit. 2020, 2, 230–245. [Google Scholar] [CrossRef]
  7. The Carbon Trust. Footprinting and Reporting; The Carbon Trust: London, UK, 2020. [Google Scholar]
  8. IEA. Appliances & Equipment—Fuels & Technologies; IEA: Paris, France, 2023. [Google Scholar]
  9. Ramelan, A.; Adriyanto, F.; Hermanu, B.; Ibrahim, M.H.; Saputro, J.S.; Setiawan, O. IoT Based Building Energy Monitoring and Controlling System Using LoRa Modulation and MQTT Protocol. IOP Conf. Ser. Mater. Sci. Eng. 2021, 1096, 012069. [Google Scholar] [CrossRef]
  10. Tu, M.; Chung, W.-H.; Chiu, C.-K.; Chung, W.; Tzeng, Y. A Novel IoT-Based Dynamic Carbon Footprint Approach to Reducing Uncertainties. In Proceedings of the 2017 4th International Conference on Industrial Engineering and Applications, Nagoya, Japan, 21–23 April 2017; pp. 249–256. [Google Scholar]
  11. Vargas-Solar, G.; Khalil, M.; Espinosa-Oviedo, J.A.; Zechinelli-Martini, J.-L. GREENHOME: A Household Energy Consumption and CO2 Footprint Metering Environment. ACM Trans. Internet Technol. 2022, 22, 1–31. [Google Scholar] [CrossRef]
  12. Zhang, H.; Zhang, J.; Wang, R.; Huang, Y.; Zhang, M.; Shang, X.; Gao, C. Smart carbon monitoring platform under IoT-Cloud architecture for small cities in B5G. Wirel. Netw. 2021, 2, 1–17. [Google Scholar] [CrossRef]
  13. Zen, I.S.; Al-Amin, A.Q.; Alam, M.; Doberstein, B. Magnitudes of households’ carbon footprint in Iskandar Malaysia: Policy implications for sustainable development. J. Clean. Prod. 2021, 315, 128042. [Google Scholar] [CrossRef]
  14. Chagnon-Lessard, N.; Gosselin, L.; Barnabe, S.; Bello-Ochende, T.; Fendt, S.; Goers, S.; Da Silva, L.C.P.; Schweiger, B.; Simmons, R.; Vandersickel, A.; et al. Smart Campuses: Extensive Review of the Last Decade of Research and Current Challenges. IEEE Access 2021, 9, 124200–124234. [Google Scholar] [CrossRef]
  15. Attour, A.; Baudino, M.; Krafft, J.; Lazaric, N. Determinants of energy tracking application use at the city level: Evidence from France. Energy Policy 2020, 147, 111866. [Google Scholar] [CrossRef]
  16. Marikyan, D.; Papagiannidis, S.; Alamanos, E. A systematic review of the smart home literature: A user perspective. Technol. Forecast. Soc. Change 2018, 138, 139–154. [Google Scholar] [CrossRef]
  17. Zheng, H.; Song, M.; Shen, Z. The evolution of renewable energy and its impact on carbon reduction in China. Energy 2021, 237, 121639. [Google Scholar] [CrossRef]
  18. Akram, R.; Chen, F.; Khalid, F.; Ye, Z.; Majeed, M.T. Heterogeneous effects of energy efficiency and renewable energy on carbon emissions: Evidence from developing countries. J. Clean. Prod. 2019, 247, 119122. [Google Scholar] [CrossRef]
  19. Lopez-Ruiz, H.G.; Crozet, Y. Sustainable Transport in France. Transp. Res. Rec. J. Transp. Res. Board 2010, 2163, 124–132. [Google Scholar] [CrossRef]
  20. Long, Y.; Guan, D.; Kanemoto, K.; Gasparatos, A. Negligible impacts of early COVID-19 confinement on household carbon footprints in Japan. One Earth 2021, 4, 553–564. [Google Scholar] [CrossRef] [PubMed]
  21. Elgaaied-Gambier, L.; Bertrandias, L.; Bernard, Y. Cutting the Internet’s Environmental Footprint: An Analysis of Consumers’ Self-Attribution of Responsibility. J. Interact. Mark. 2020, 50, 120–135. [Google Scholar] [CrossRef]
  22. Song, K.; Baiocchi, G.; Feng, K.; Hubacek, K.; Sun, L. Unequal household carbon footprints in the peak-and-decline pattern of U.S. greenhouse gas emissions. J. Clean. Prod. 2022, 368, 132650. [Google Scholar] [CrossRef]
  23. Hernández, C.; Vita, G. Carbon footprint analysis of household consumption in greater Guadalajara reveal stark socio-spatial inequalities. Ecol. Econ. 2022, 199, 107495. [Google Scholar] [CrossRef]
  24. Hoffmann, S.; Lasarov, W.; Reimers, H. Carbon footprint tracking apps. What drives consumers’ adoption intention? Technol. Soc. 2022, 69, 101956. [Google Scholar] [CrossRef]
  25. Jones, C.M.; Wheeler, S.M.; Kammen, D.M. Carbon Footprint Planning: Quantifying Local and State Mitigation Opportunities for 700 California Cities. Urban Plan. 2018, 3, 35–51. [Google Scholar] [CrossRef]
  26. Anthony, L.F.W.; Kanding, B.; Selvan, R. Carbontracker: Tracking and Predicting the Carbon Footprint of Training Deep Learning Models. arXiv 2020, arXiv:2007.03051. [Google Scholar]
  27. Samara, F.; Ibrahim, S.; Yousuf, M.E.; Armour, R. Carbon Footprint at a United Arab Emirates University: GHG Protocol. Sustainability 2022, 14, 2522. [Google Scholar] [CrossRef]
  28. Liu, Z.; Wang, G.; Zhao, L.; Yang, G. Multi-Points Indoor Air Quality Monitoring Based on Internet of Things. IEEE Access 2021, 9, 70479–70492. [Google Scholar] [CrossRef]
  29. Bagus, I.; Purwania, G.; Kumara, I.N.S.; Sudarma, M. Application of IoT-Based System for Monitoring Energy Consumption. Int. J. Eng. Emerg. Technol. 2020, 5, 81–93. [Google Scholar]
  30. Benammar, M.; Abdaoui, A.; Ahmad, S.H.; Touati, F.; Kadri, A. A Modular IoT Platform for Real-Time Indoor Air Quality Monitoring. Sensors 2018, 18, 581. [Google Scholar] [CrossRef] [PubMed]
  31. Nayak, J. Round the Clock Vehicle Emission Monitoring using IoT for Smart Cities. Int. J. Adv. Comput. Sci. Appl. 2018, 9, 616–619. [Google Scholar] [CrossRef]
  32. Ma, L.; Wang, D. Construction of Game Model between Carbon Emission Minimization and Energy and Resource Economy Maximization Based on Deep Neural Network. Comput. Intell. Neurosci. 2022, 2022, 4578536. [Google Scholar] [CrossRef]
  33. Sruthi, M.S.; Rajkumar, M.N.; Kumar, V.V. Smart IoT Based System for CO2 Monitoring and Forest Fire Detection with Effective Alert Mechanism. Researchgate.Net, Volume 3, June 2019, pp. 256–258. 2017. Available online: https://www.researchgate.net/profile/Sruthi_Ms/publication/333650806_Smart_IoT_Based_System_For_CO_2_Monitoring_and_Forest_Fire_Detection_with_Effective_Alert_Mechanism/links/5cf9fa4e4585157d1598c4e7/Smart-IoT-Based-System-For-CO-2-Monitoring-and-Forest-F (accessed on 5 July 2023).
  34. Xu, J.; Pan, W.; Teng, Y.; Zhang, Y.; Zhang, Q. Internet of Things (IoT)-Integrated Embodied Carbon Assessment and Monitoring of Prefabricated Buildings. IOP Conf. Ser. Earth Environ. Sci. 2022, 1101, 02203. [Google Scholar] [CrossRef]
  35. Ytreberg, N.S.; Alfnes, F.; van Oort, B. Mapping of the digital climate nudges in Nordic online grocery stores. Sustain. Prod. Consum. 2023, 37, 202–212. [Google Scholar] [CrossRef]
  36. Heydarian, A.; Golparvar-Fard, M. A Visual Monitoring Framework for Integrated Productivity and Carbon Footprint Control of Construction Operations. In Proceedings of the Congress on Computing in Civil Engineering, Miami, FL, USA, 19–22 June 2011. [Google Scholar] [CrossRef]
  37. Zaman, N.; Jhanjhi, J. A New Platform Based on Various Sensors Offers Smart Contracts to Reduce Carbon Emissions Data Visualization, Industrial Control, and Activity. 2022. Available online: https://www.researchsquare.com/article/rs-2164843/v1.pdf (accessed on 5 July 2023).
  38. Carmeli, C.; Knyazeva, M.G.; Innocenti, G.M.; De Feo, O. Assessment of EEG synchronization based on state-space analysis. NeuroImage 2005, 25, 339–354. [Google Scholar] [CrossRef]
  39. Zhao, L.; Zhou, H.; Chen, R.; Shen, Z. Efficient Monitoring and Adaptive Control of Indoor Air Quality Based on IoT Technology and Fuzzy Inference. Wirel. Commun. Mob. Comput. 2022, 2022, 4127079. [Google Scholar] [CrossRef]
  40. Han, J.; Tan, Z.; Chen, M.; Zhao, L.; Yang, L.; Chen, S. Carbon Footprint Research Based on Input–Output Model—A Global Scientometric Visualization Analysis. Int. J. Environ. Res. Public Health 2022, 19, 11343. [Google Scholar] [CrossRef]
  41. Liao, H.-T.; Pan, C.-L.; Zhang, Y. Smart digital platforms for carbon neutral management and services: Business models based on ITU standards for green digital transformation. Front. Ecol. Evol. 2023, 11, 1134381. [Google Scholar] [CrossRef]
  42. Lin, X.; Luo, J.; Liao, M.; Su, Y.; Lv, M.; Li, Q.; Xiao, S.; Xiang, J. Wearable Sensor-Based Monitoring of Environmental Exposures and the Associated Health Effects: A Review. Biosensors 2022, 12, 1131. [Google Scholar] [CrossRef] [PubMed]
  43. Guzman, L.; Makonin, S.; Clapp, R.A. CarbonKit: A Technological Platform for Personal Carbon Tracking. 2016. Available online: https://www.researchgate.net/publication/306187365_CarbonKit_a_technological_platform_for_personal_carbon_tracking (accessed on 5 July 2023).
  44. Resch, E.; Lausselet, C.; Brattebø, H.; Andresen, I. An analytical method for evaluating and visualizing embodied carbon emissions of buildings. Build. Environ. 2020, 168, 106476. [Google Scholar] [CrossRef]
  45. Magtibay, O.B.M.; Cabrera, R.H.; Roxas, J.P.; De Vera, M.A. Green switch: An IoT based energy monitoring system for mabini building in De La Salle Lipa. Indones. J. Electr. Eng. Comput. Sci. 2021, 24, 754–761. [Google Scholar] [CrossRef]
  46. Ming, F.X.; Habeeb, R.A.A.; Nasaruddin, F.H.B.M.; Bin Gani, A. Real-Time Carbon Dioxide Monitoring Based on IoT & Cloud Technologies. In Proceedings of the 2019 8th International Conference on Software and Computer Applications, Cairo, Egypt, 9–12 April 2019; pp. 517–521. [Google Scholar] [CrossRef]
  47. Zhang, A.; Li, S.; Tan, L.; Sun, Y.; Yao, F. Intelligent Measurement and Monitoring of Carbon Emissions for 5G Shared Smart Logistics. J. Sens. 2022, 2022, 8223590. [Google Scholar] [CrossRef]
  48. Mao, C.; Tao, X.; Yang, H.; Chen, R.; Liu, G. Real-Time Carbon Emissions Monitoring Tool for Prefabricated Construction: An IoT-Based System Framework. In Proceedings of the ICCREM 2018: Sustainable Construction and Prefabrication—International Conference on Construction and Real Estate Management 2018, Charleston, SC, USA, 9–10 August 2018; pp. 121–127. [Google Scholar] [CrossRef]
  49. Bilotta, S.; Nesi, P. Estimating CO2 Emissions from IoT Traffic Flow Sensors and Reconstruction. Sensors 2022, 22, 3382. [Google Scholar] [CrossRef] [PubMed]
  50. Malmodin, J.; Lundén, D. The Energy and Carbon Footprint of the Global ICT and E&M Sectors 2010–2015. Sustainability 2018, 10, 3027. [Google Scholar] [CrossRef]
  51. Steen-Olsen, K.; Wood, R.; Hertwich, E.G. The Carbon Footprint of Norwegian Household Consumption 1999–2012. J. Ind. Ecol. 2016, 20, 582–592. [Google Scholar] [CrossRef]
  52. Khatun, R.; Antor, S.A.; Ullah, A.; Hossain, A. Vehicle Fuel Activities Monitoring System Using IoT. Adv. Internet Things 2019, 9, 63–71. [Google Scholar] [CrossRef]
  53. Yousif, O.S.; Zakaria, R.; Aminudin, E.; Shamsuddin, S.M.; Rahman, M.F.A.; Gara, J.; Ahmad, N.F. Integration Method for Web based Visualization Framework of Green Highway Index and Carbon Footprint Calculator. IOP Conf. Ser. Earth Environ. Sci. 2022, 1067, 012016. [Google Scholar] [CrossRef]
  54. Tsokov, T.; Petrova-Antonova, D. EcoLogic: IoT Platform for Control of Carbon Emissions. In Proceedings of the 12th International Conference on Software Technologies, Madrid, Spain, 24–26 July 2017; pp. 178–185. [Google Scholar] [CrossRef]
  55. Darniss, R.; Jivthesh, M.; Gaushik, M.; Shibu, N.S.; Sethuraman, N.R. Blockchain and IoT-Powered Carbon Credit Exchange for Achieving Pollution Reduction Goals. Reasearch Sq. 2020, 1, 1–16. [Google Scholar]
  56. Lu, L.; He, B.; Man, C.; Wang, S. Passive synchronization for Markov jump genetic oscillator networks with time-varying delays. Math. Biosci. 2015, 262, 80–87. [Google Scholar] [CrossRef]
  57. Jo, J.; Jo, B.; Kim, J.; Kim, S.; Han, W. Development of an IoT-Based indoor air quality monitoring platform. J. Sens. 2020, 2020, 8749764. [Google Scholar] [CrossRef]
  58. Akpan, G.E.; Akpan, U.F. Electricity consumption, carbon emissions and economic growth in Nigeria. Int. J. Energy Econ. Policy 2012, 2, 292–306. [Google Scholar]
  59. Gordic, D.; Nikolic, J.; Vukasinovic, V.; Josijevic, M.; Aleksic, A.D. Offsetting carbon emissions from household electricity consumption in Europe. Renew. Sustain. Energy Rev. 2023, 175, 113154. [Google Scholar] [CrossRef]
  60. Lee, J.; Taherzadeh, O.; Kanemoto, K. The scale and drivers of carbon footprints in households, cities and regions across India. Glob. Environ. Change 2021, 66, 102205. [Google Scholar] [CrossRef]
  61. Lin, J.; Hu, Y.; Cui, S.; Kang, J.; Ramaswami, A. Tracking urban carbon footprints from production and consumption perspectives. Environ. Res. Lett. 2015, 10, 054001. [Google Scholar] [CrossRef]
  62. Mneimneh, F.; Ghazzawi, H.; Ramakrishna, S. Review Study of Energy Efficiency Measures in Favor of Reducing Carbon Footprint of Electricity and Power, Buildings, and Transportation. Circ. Econ. Sustain. 2022, 3, 447–474. [Google Scholar] [CrossRef]
  63. Peng, Y.; Yang, L.E.; Scheffran, J.; Yan, J.; Li, M.; Jiang, P.; Wang, Y.; Cremades, R. Livelihood transitions transformed households’ carbon footprint in the Three Gorges Reservoir area of China. J. Clean. Prod. 2021, 328, 129607. [Google Scholar] [CrossRef]
  64. Verma, P.; Kumari, T.; Raghubanshi, A.S. Energy emissions, consumption and impact of urban households: A review. Renew. Sustain. Energy Rev. 2021, 147, 111210. [Google Scholar] [CrossRef]
  65. Yin, X.; Hao, Y.; Yang, Z.; Zhang, L.; Su, M.; Cheng, Y.; Zhang, P.; Yang, J.; Liang, S. Changing carbon footprint of urban household consumption in Beijing: Insight from a nested input-output analysis. J. Clean. Prod. 2020, 258, 120698. [Google Scholar] [CrossRef]
  66. Adeyeye, D.; Olusola, A.; Orimoloye, I.R.; Singh, S.K.; Adelabu, S. Carbon footprint assessment and mitigation scenarios: A benchmark model for GHG indicator in a Nigerian University. Environ. Dev. Sustain. 2023, 25, 1361–1382. [Google Scholar] [CrossRef]
  67. Li, J.; Zhang, J.; Zhang, D.; Ji, Q. Does gender inequality affect household green consumption behaviour in China? Energy Policy 2019, 135, 111071. [Google Scholar] [CrossRef]
  68. Niamir, L.; Ivanova, O.; Filatova, T.; Voinov, A.; Bressers, H. Demand-side solutions for climate mitigation: Bottom-up drivers of household energy behavior change in the Netherlands and Spain. Energy Res. Soc. Sci. 2020, 62, 101356. [Google Scholar] [CrossRef]
  69. Parker, J.A.; Schild, J.; Erhard, L.; Johnson, D. Household Spending Responses to the Economic Impact Payments of 2020. National Bureau of Economic Research. 2022. Available online: https://www.nber.org/papers/w29648%0Ahttps://www.nber.org/system/files/working_papers/w29648/w29648.pdf (accessed on 8 July 2023).
  70. Stelmach, G.; Zanocco, C.; Flora, J.; Rajagopal, R.; Boudet, H.S. Exploring household energy rules and activities during peak demand to better determine potential responsiveness to time-of-use pricing. Energy Policy 2020, 144, 111608. [Google Scholar] [CrossRef]
  71. Wang, X.; Chen, S. Urban-rural carbon footprint disparity across China from essential household expenditure: Survey-based analysis, 2010–2014. J. Environ. Manag. 2020, 267, 110570. [Google Scholar] [CrossRef]
  72. Chau, C.; Leung, T.; Ng, W. Corrigendum to “A review on Life Cycle Assessment, Life Cycle Energy Assessment and Life Cycle Carbon Emissions Assessment on buildings” [Appl. Energy 143 (2015) 395–413]. Appl. Energy 2015, 158, 395–413. [Google Scholar] [CrossRef]
  73. Ghaemi, Z.; Smith, A.D. A review on the quantification of life cycle greenhouse gas emissions at urban scale. J. Clean. Prod. 2020, 252, 119634. [Google Scholar] [CrossRef]
  74. Joensuu, T.; Leino, R.; Heinonen, J.; Saari, A. Developing Buildings’ Life Cycle Assessment in Circular Economy-Comparing methods for assessing carbon footprint of reusable components. Sustain. Cities Soc. 2022, 77, 103499. [Google Scholar] [CrossRef]
  75. Leonzio, G.; Bogle, I.D.L.; Foscolo, P.U. Life cycle assessment of a carbon capture utilization and storage supply chain in Italy and Germany: Comparison between carbon dioxide storage and utilization systems. Sustain. Energy Technol. Assess. 2023, 55, 102743. [Google Scholar] [CrossRef]
  76. Rowley, H.V.; Lundie, S.; Peters, G.M. A hybrid life cycle assessment model for comparison with conventional methodologies in Australia. Int. J. Life Cycle Assess. 2009, 14, 508–516. [Google Scholar] [CrossRef]
  77. Sangwan, K.S.; Bhakar, V.; Arora, V.; Solanki, P. Measuring Carbon Footprint of an Indian University Using Life Cycle Assessment. Procedia CIRP 2018, 69, 475–480. [Google Scholar] [CrossRef]
  78. Weidema, B.P.; Thrane, M.; Christensen, P.; Schmidt, J.; Løkke, S. Carbon Footprint: A catalyst for life cycle assessment? J. Ind. Ecol. 2008, 12, 3–6. [Google Scholar] [CrossRef]
  79. Asopa, P.; Purohit, P.; Nadikattu, R.R.; Whig, P. Reducing Carbon Footprint for Sustainable development of Smart Cities using IoT. In Proceedings of the 2021 Third International Conference on Intelligent Communication Technologies and Virtual Mobile Networks (ICICV), Tirunelveli, India, 4–6 February 2021; pp. 361–367. [Google Scholar] [CrossRef]
  80. Lukyanov, A.; Donskoy, D.; Vernezi, M.; Karev, D. Estimation of the carbon footprint of IoT devices based on ESP8266 microcontrollers. E3S Web Conf. 2021, 279, 1002. [Google Scholar] [CrossRef]
  81. Mudaliar, M.D.; Sivakumar, N. IoT based real time energy monitoring system using Raspberry Pi. Internet Things 2020, 12, 100292. [Google Scholar] [CrossRef]
  82. Ullo, S.L.; Sinha, G.R. Advances in Smart Environment Monitoring Systems Using IoT and Sensors. Sensors 2020, 20, 3113. [Google Scholar] [CrossRef]
  83. Matuštík, J.; Kočí, V. What is a footprint? A conceptual analysis of environmental footprint indicators. J. Clean. Prod. 2021, 285, 124833. [Google Scholar] [CrossRef]
  84. Prasad, M.K.; Reddy, D.R.; Jyothi, K. A Critical Review on Carbon Footprint of Universities. Spec. Ugdym. 2022, 1, 3892–3919. Available online: https://www.scopus.com/inward/record.uri?eid=2-s2.0-85135831843&partnerID=40&md5=a872cfd8f89b666b76d3498d3481ecdc (accessed on 5 July 2023).
  85. Tsay, Y.-S.; Yeh, Y.-C.; Jheng, H.-Y. Study of the tools used for early-stage carbon footprint in building design. E-Prime-Adv. Electr. Eng. Electron. Energy 2023, 4, 100128. [Google Scholar] [CrossRef]
  86. Zeng, J.; Qu, J.; Ma, H.; Gou, X. Characteristics and Trends of household carbon emissions research from 1993 to 2019: A bibliometric analysis and its implications. J. Clean. Prod. 2021, 295, 126468. [Google Scholar] [CrossRef]
  87. Brewer, R.S. Literature Review on Carbon Footprint Collection and Analysis. Methodology. 2009. Available online: https://www.researchgate.net/profile/Robert-Brewer-5/publication/238622341_Literature_Review_on_Carbon_Footprint_Collection_and_Analysis/links/00463537a6f85e5cdc000000/Literature-Review-on-Carbon-Footprint-Collection-and-Analysis.pdf (accessed on 5 July 2023).
  88. Chen, K.; Yang, M.; Zhou, X.; Liu, Z.; Li, P.; Tang, J.; Peng, C. Recent advances in carbon footprint studies of urban ecosystems: Overview, application, and future challenges. Environ. Rev. 2022, 30, 342–356. [Google Scholar] [CrossRef]
  89. Greenly. Start Your Climate Journey Measuring Your GHG Emissions. Carbon Management Platform. 2023. Available online: https://greenly.earth/en-gb/carbon-footprint (accessed on 5 July 2023).
  90. BART. Carbon Calculator. 2016. Available online: http://www.bart.gov/guide/carbon (accessed on 5 July 2023).
  91. Jradi, S.; Chameeva, T.B.; Delhomme, B.; Jaegler, A. Tracking carbon footprint in French vineyards: A DEA performance assessment. J. Clean. Prod. 2018, 192, 43–54. [Google Scholar] [CrossRef]
  92. Lombardi, M.; Laiola, E.; Tricase, C.; Rana, R. Assessing the urban carbon footprint: An overview. Environ. Impact Assess. Rev. 2017, 66, 43–52. [Google Scholar] [CrossRef]
  93. Bekaroo, G.; Roopowa, D.; Bokhoree, C. Mobile-Based Carbon Footprint Calculation: Insights from a Usability Study. In Proceedings of the 2nd International Conference on Next Generation Computing Applications 2019, NextComp 2019, Balaclava, Mauritius, 19–21 September 2019; pp. 1–6. [Google Scholar] [CrossRef]
  94. Dubois, G.; Sovacool, B.; Aall, C.; Nilsson, M.; Barbier, C.; Herrmann, A.; Bruyère, S.; Andersson, C.; Skold, B.; Nadaud, F.; et al. It starts at home? Climate policies targeting household consumption and behavioral decisions are key to low-carbon futures. Energy Res. Soc. Sci. 2019, 52, 144–158. [Google Scholar] [CrossRef]
  95. Joshi, A.; Gupta, A.; Verma, S.; Paul, A.R.; Jain, A.; Haque, N. Life Cycle Based Greenhouse Gas Footprint Assessment of a Smartphone. IOP Conf. Ser. Earth Environ. Sci. 2021, 795, 12028. [Google Scholar] [CrossRef]
  96. Bai, C.; Feng, C.; Yan, H.; Yi, X.; Chen, Z.; Wei, W. Will income inequality influence the abatement effect of renewable energy technological innovation on carbon dioxide emissions? J. Environ. Manag. 2020, 264, 110482. [Google Scholar] [CrossRef]
  97. Ehigiamusoe, K.U.; Lean, H.H.; Smyth, R. The moderating role of energy consumption in the carbon emissions-income nexus in middle-income countries. Appl. Energy 2020, 261, 114215. [Google Scholar] [CrossRef]
  98. Sovacool, B.K.; Lipson, M.M.; Chard, R. Temporality, vulnerability, and energy justice in household low carbon innovations. Energy Policy 2019, 128, 495–504. [Google Scholar] [CrossRef]
  99. Vita, G.; Ivanova, D.; Dumitru, A.; García-Mira, R.; Carrus, G.; Stadler, K.; Krause, K.; Wood, R.; Hertwich, E.G. Happier with less? Members of European environmental grassroots initiatives reconcile lower carbon footprints with higher life satisfaction and income increases. Energy Res. Soc. Sci. 2020, 60, 101329. [Google Scholar] [CrossRef]
  100. UK Government GHG. UK Government GHG Conversion Factors for Company Reporting. Greenhouse-Gas-Reporting-Conversion-Factors. 2022. Available online: https://www.gov.uk/government/publications/greenhouse-gas-reporting-conversion-factors-2022 (accessed on 13 May 2023).
  101. Rahman, M.; Tabash, M.I.; Salamzadeh, A.; Abduli, S.; Rahaman, S. Sampling Techniques (Probability) for Quantitative Social Science Researchers: A Conceptual Guidelines with Examples. SEEU Rev. 2022, 17, 42–51. [Google Scholar] [CrossRef]
  102. Semtech. A Technical Overview of loRa and LoRaWAN; Semtech: Camarillo, CA, USA, 2020. [Google Scholar]
  103. CoolClimate.berkeley.edu. CoolClimate Network. UC Berkeley. 2023. Available online: https://coolclimate.berkeley.edu/calculator (accessed on 18 July 2023).
  104. Footprint. Carbon Foot Print Calculator. Carbon Calculator. 2023. Available online: https://urn.fi/URN:NBN:fi:amk-2023051510911 (accessed on 18 July 2023).
  105. CarbonBrief. Home—Carbon Brief. Clear on Climate. 2023. Available online: https://www.carbonbrief.org/ (accessed on 18 July 2023).
  106. Li, J.; Zhang, D.; Su, B. The Impact of Social Awareness and Lifestyles on Household Carbon Emissions in China. Ecol. Econ. 2019, 160, 145–155. [Google Scholar] [CrossRef]
  107. Cao, Q.; Kang, W.; Xu, S.; Sajid, M.; Cao, M. Estimation and decomposition analysis of carbon emissions from the entire production cycle for Chinese household consumption. J. Environ. Manag. 2019, 247, 525–537. [Google Scholar] [CrossRef] [PubMed]
  108. Dou, Y.; Zhao, J.; Dong, X.; Dong, K. Quantifying the impacts of energy inequality on carbon emissions in China: A household-level analysis. Energy Econ. 2021, 102, 105502. [Google Scholar] [CrossRef]
  109. Uddin, M.; Mishra, V.; Smyth, R. Income inequality and CO2 emissions in the G7, 1870–2014: Evidence from non-parametric modelling. Energy Econ. 2020, 88, 104780. [Google Scholar] [CrossRef]
  110. Wu, W.; Kanamori, Y.; Zhang, R.; Zhou, Q.; Takahashi, K.; Masui, T. Implications of declining household economies of scale on electricity consumption and sustainability in China. Ecol. Econ. 2021, 184, 106981. [Google Scholar] [CrossRef]
  111. Bueno, G.; de Blas, M.; Pérez-Iribarren, E.; Zuazo, I.; Torre-Pascual, E.; Erauskin, A.; Etxano, I.; Tamayo, U.; García, M.; Akizu-Gardoki, O.; et al. Dataset on the environmental and social footprint of the University of the Basque Country UPV/EHU. Data Brief 2022, 41, 128019. [Google Scholar] [CrossRef]
  112. Valls-Val, K.; Bovea, M.D. Carbon footprint assessment tool for universities: CO2UNV. Sustain. Prod. Consum. 2022, 29, 791–804. [Google Scholar] [CrossRef]
  113. Liu, X.; Wang, X.; Song, J.; Wang, H.; Wang, S. Indirect carbon emissions of urban households in China: Patterns, determinants and inequality. J. Clean. Prod. 2019, 241, 118335. [Google Scholar] [CrossRef]
  114. Mi, Z.; Zheng, J.; Meng, J.; Ou, J.; Hubacek, K.; Liu, Z.; Coffman, D.; Stern, N.; Liang, S.; Wei, Y.-M. Economic development and converging household carbon footprints in China. Nat. Sustain. 2020, 3, 529–537. [Google Scholar] [CrossRef]
  115. Christis, M.; Breemersch, K.; Vercalsteren, A.; Dils, E. A detailed household carbon footprint analysis using expenditure accounts—Case of Flanders (Belgium). J. Clean. Prod. 2019, 228, 1167–1175. [Google Scholar] [CrossRef]
  116. Wei, L.; Li, C.; Wang, J.; Wang, X.; Wang, Z.; Cui, C.; Peng, S.; Liu, Y.; Yu, S.; Wang, L.; et al. Rising middle and rich classes drove China’s carbon emissions. Resour. Conserv. Recycl. 2020, 159, 104839. [Google Scholar] [CrossRef]
  117. Chen, C.; Liu, G.; Meng, F.; Hao, Y.; Zhang, Y.; Casazza, M. Energy consumption and carbon footprint accounting of urban and rural residents in Beijing through Consumer Lifestyle Approach. Ecol. Indic. 2019, 98, 575–586. [Google Scholar] [CrossRef]
  118. Zhang, H.; Shi, X.; Wang, K.; Xue, J.; Song, L.; Sun, Y. Intertemporal lifestyle changes and carbon emissions: Evidence from a China household survey. Energy Econ. 2020, 86, 104655. [Google Scholar] [CrossRef]
  119. Lévay, P.Z.; Vanhille, J.; Goedemé, T.; Verbist, G. The association between the carbon footprint and the socio-economic characteristics of Belgian households. Ecol. Econ. 2021, 186, 107065. [Google Scholar] [CrossRef]
  120. Jiang, Y.; Long, Y.; Liu, Q.; Dowaki, K.; Ihara, T. Carbon emission quantification and decarbonization policy exploration for the household sector—Evidence from 51 Japanese cities. Energy Policy 2020, 140, 111438. [Google Scholar] [CrossRef]
  121. Enzler, H.B.; Diekmann, A. All talk and no action? An analysis of environmental concern, income and greenhouse gas emissions in Switzerland. Energy Res. Soc. Sci. 2019, 51, 12–19. [Google Scholar] [CrossRef]
  122. Tomás, M.; López, L.A.; Monsalve, F. Carbon footprint, municipality size and rurality in Spain: Inequality and carbon taxation. J. Clean. Prod. 2020, 266, 121798. [Google Scholar] [CrossRef]
  123. Yuan, R.; Rodrigues, J.F.; Behrens, P. Driving forces of household carbon emissions in China: A spatial decomposition analysis. J. Clean. Prod. 2019, 233, 932–945. [Google Scholar] [CrossRef]
  124. Wang, M.; Feng, C. The inequality of China’s regional residential CO2 emissions. Sustain. Prod. Consum. 2021, 27, 2047–2057. [Google Scholar] [CrossRef]
  125. Yan, J.; Yang, J. Carbon pricing and income inequality:A case study of Guangdong Province, China. J. Clean. Prod. 2021, 296, 126491. [Google Scholar] [CrossRef]
  126. Zhen, W.; Zhong, Z.; Wang, Y.; Miao, L.; Qin, Q.; Wei, Y.-M. Evolution of urban household indirect carbon emission responsibility from an inter-sectoral perspective: A case study of Guangdong, China. Energy Econ. 2019, 83, 197–207. [Google Scholar] [CrossRef]
  127. Rojas-Vallejos, J.; Lastuka, A. The income inequality and carbon emissions trade-off revisited. Energy Policy 2020, 139, 111302. [Google Scholar] [CrossRef]
  128. Huang, R.; Tian, L. CO2 emissions inequality through the lens of developing countries. Appl. Energy 2021, 281, 116043. [Google Scholar] [CrossRef]
  129. Xu, B.; Lin, B. Can expanding natural gas consumption reduce China’s CO2 emissions? Energy Econ. 2019, 81, 393–407. [Google Scholar] [CrossRef]
  130. Li, H.; Qiu, P.; Wu, T. The regional disparity of per-capita CO2 emissions in China’s building sector: An analysis of macroeconomic drivers and policy implications. Energy Build. 2021, 244, 111011. [Google Scholar] [CrossRef]
  131. Wu, R.; Xie, Z. Identifying the impacts of income inequality on CO2 emissions: Empirical evidences from OECD countries and non-OECD countries. J. Clean. Prod. 2020, 277, 123858. [Google Scholar] [CrossRef]
  132. McGee, J.A.; Greiner, P.T. Renewable energy injustice: The socio-environmental implications of renewable energy consumption. Energy Res. Soc. Sci. 2019, 56, 101214. [Google Scholar] [CrossRef]
  133. Vieira, A.C.P.; da Silva, E.M.F.; Odakura, V.V.V.A. Development of a Web Application for Individual Carbon Footprint Calculation. In Proceedings of the 2021 47th Latin American Computing Conference, CLEI, Cartago, Costa Rica, 25–29 October 2021; pp. 1–8. [Google Scholar] [CrossRef]
  134. Palconit, M.G.B.; Nunez, W.A. Co2 emission monitoring and evaluation of public utility vehicles based on road grade and driving patterns: An Internet of Things application. In Proceedings of the HNICEM 2017—9th International Conference on Humanoid Nanotechnology, Information Technology, Communication and Control, Environment and Management 2017, Manila, Philippines, 1–3 December 2017; pp. 1–6. [Google Scholar] [CrossRef]
  135. Liu, Q.; Wang, S.; Zhang, W.; Li, J.; Kong, Y. Examining the effects of income inequality on CO2 emissions: Evidence from non-spatial and spatial perspectives. Appl. Energy 2019, 236, 163–171. [Google Scholar] [CrossRef]
  136. Abbott, J.; Gao, G.; Shih, P. Creen: A Carbon Footprint Calculator Designed for Calculation in Context. In Information in Contemporary Society: 14th International Conference, iConference 2019, Washington, DC, USA, 31 March–3 April 2019; Proceedings 14; Springer: Berlin/Heidelberg, Germany, 2019; pp. 769–776. [Google Scholar]
  137. Del Rio, D.D.F.; Sovacool, B.K.; Bergman, N.; Makuch, K.E. Critically reviewing smart home technology applications and business models in Europe. Energy Policy 2020, 144, 111631. [Google Scholar] [CrossRef]
  138. Cadarso, M.-Á.; Gómez, N.; López, L.-A.; Tobarra, M.-Á.; Zafrilla, J.-E. Quantifying Spanish tourism’s Carbon Footprint: The contributions of residents and visitors: A longitudinal study. J. Sustain. Tour. 2015, 23, 922–946. [Google Scholar] [CrossRef]
  139. Petersen, S.A.; Petersen, I.; Ahcin, P. Smiling Earth—Raising Awareness among Citizens for Behaviour Change to Reduce Carbon Footprint. Energies 2020, 13, 5932. [Google Scholar] [CrossRef]
  140. Albreem, M.A.; Sheikh, A.M.; Alsharif, M.H.; Jusoh, M.; Yasin, M.N.M. Green Internet of Things (GIoT): Applications, practices, awareness, and challenges. IEEE Access 2021, 9, 38833–38858. [Google Scholar] [CrossRef]
  141. Vallée, T.; Sedki, K.; Despres, S.; Jaulant, M.-C.; Tabia, K.; Ugon, A. On personalization in IoT. In Proceedings of the 2016 International Conference on Computational Science and Computational Intelligence (CSCI), Las Vegas, NV, USA, 15–17 December 2016; pp. 186–191. [Google Scholar]
  142. Beermann, V.; Rieder, A.; Ebbers, M.; Bicker, K.; Poerschke, V.B.; Uebernickel, F. Loss Aversion Nudges to Improve Heating Behavior and Reduce Carbon Emissions. In Academy of Management Proceedings; Academy of Management: Briarcliff Manor, NY, USA, 2022; p. 14851. [Google Scholar]
  143. Peng, H.; Lu, Y.; Gupta, S.; Wang, Q. Dynamic and heterogeneity assessment of carbon efficiency in the manufacturing industry in China: Implications for formulating carbon policies. Environ. Impact Assess. Rev. 2022, 97, 106885. [Google Scholar] [CrossRef]
  144. Usman, M.; Hammar, N. Dynamic relationship between technological innovations, financial development, renewable energy, and ecological footprint: Fresh insights based on the STIRPAT modezl for Asia Pacific Economic Cooperation countries. Environ. Sci. Pollut. Res. 2020, 28, 15519–15536. [Google Scholar] [CrossRef] [PubMed]
  145. Levasseur, A.; Mercier-Blais, S.; Prairie, Y.; Tremblay, A.; Turpin, C. Improving the accuracy of electricity carbon footprint: Estimation of hydroelectric reservoir greenhouse gas emissions. Renew. Sustain. Energy Rev. 2020, 136, 110433. [Google Scholar] [CrossRef]
Figure 1. Literature review outline.
Sustainability 15 15016 g001
Figure 2. EKC hypothesis.
Sustainability 15 15016 g002
Figure 3. IoT-based monitoring system architecture.
Sustainability 15 15016 g003
Table 1. A smart home’s potential and perceived user benefits [16].
BenefitServiceImmediate AdvantageLong-Term Impact
EnvironmentalComfort, consultancy, monitoringEnergy efficiency that has favourable environmental externalitiesEnvironmental sustainability, reduction in carbon emissions
SocialSupportSocial acceptanceOvercome the feeling of isolation
Economic/FinancialConsultancy, monitoringReduction in energy billsEconomic gains and money saving
HealthComfort, consultancy, monitoring, support, delivery, therapyMedical prescription interaction and feedbackPromote the health of the elderly and vulnerable
Table 2. Diverse concepts for tracking the household CF.
Energy Consumption and Data AnalysisSurveys and QuestionnairesLife-Cycle AssessmentIoT-Based Monitoring SystemCarbon Calculators and Online ToolsBehavioural Monitoring and FeedbackIntegration and Modelling
[60,63,65,66,71,79,107,108,109,110,111,112,113,114,115,116,117,118,119,120,121,122,123,124,125,126,127,128,129,130,131,132][63,66,68,70,106,111,118,119,121][63,71,95,111,121][12,46,79,80,95,133,134][89,93,103,104,105,111,112,113,133][67,68,70,93,94,95,110,118][65,67,70,70,71,96,97,98,99,107,108,109,110,111,113,121,124,129,131,132,135]
Disclaimer/Publisher’s Note: The statements, opinions and data contained in all publications are solely those of the individual author(s) and contributor(s) and not of MDPI and/or the editor(s). MDPI and/or the editor(s) disclaim responsibility for any injury to people or property resulting from any ideas, methods, instructions or products referred to in the content.

