Article

Recovery Strategies for Urban Rail Transit Network Based on Comprehensive Resilience

1
School of Traffic and Transportation Engineering, Dalian Jiaotong University, Dalian 116028, China
2
School of Environment and Chemical Engineering, Dalian Jiaotong University, Dalian 116028, China
3
Zhejiang Haining Rail Transit Operation Management Co., Jiaxing 314411, China
*
Author to whom correspondence should be addressed.
Sustainability 2023, 15(20), 15018; https://doi.org/10.3390/su152015018
Submission received: 12 September 2023 / Revised: 11 October 2023 / Accepted: 17 October 2023 / Published: 18 October 2023
(This article belongs to the Special Issue Towards Green and Smart Cities: Urban Transport and Land Use)

Abstract

:
To enhance the resilience of urban rail transit networks in dealing with interference events and facilitating rapid network recovery, this paper focuses on studying damaged urban rail transit networks and proposes comprehensive resilience evaluation indexes for urban rail transit networks that take into account two dimensions: network topology and passenger travel path selection. A bi-level programming model is constructed to maximize the comprehensive toughness, where the upper-level model is an integer planning model for determining the optimal recovery sequence of the affected stations under interference events that result in station closure or inoperability. The lower-level model is a passenger flow allocation model aiming to minimize travelers’ impedance. A genetic algorithm and Dijkstra’s labeling algorithm are used to solve the upper model as well as the shortest path of the lower model, respectively. Using a real-world urban rail transit network as an example, this research applies different recovery strategies, random recovery, node importance-based recovery, and comprehensive toughness-based recovery, across five common interference scenarios to analyze the recovery sequence of stations in each scenario. The modeling results show that the comprehensive toughness-based restoration strategy yields the most favorable results for the rail transportation network, followed by the node importance-based restoration strategy. In addition, the network’s toughness varies more significantly when employing different restoration strategies during target interference, as compared to the random and range interference scenarios.

1. Introduction

With the development of society and the continuous improvement of people’s living standards, the travel demand of residents is increasing, and many cities are facing problems, such as traffic congestion and frequent haze. Managers have come up with a series of efficient and green solutions, aiming at the comprehensive use of big data, cloud computing, artificial intelligence, and other technological means, such as the establishment of intelligent urban traffic management systems, intelligent public transportation systems, shared travel modes, intelligent parking systems, intelligent travel service systems, and other measures, to improve the efficiency and management of traffic operation and to reduce the occurrences of traffic congestion and haze. However, in densely populated areas with a high traffic demand and ground traffic congestion, urban rail transit systems are still favored by travelers because of their fast, punctual, and safe characteristics. Along with the expanding scale of urban rail transit networks, there is an increasing expectation for these systems to have robust emergency response capabilities in unexpected situations. When urban rail transit networks face disturbance events, such as equipment failure, natural disasters, or deliberate attacks, the need to devise an efficient recovery plan becomes critical. Balancing the constraints of limited time and resources to minimize the spread of the incident and quickly restore the system’s performance to the original service level is a pressing issue.
To better study the properties related to disturbed urban rail transit networks, it is necessary to apply appropriate methods to abstract the network into a topology for further analysis. To conquer the variety of external disturbance events, it has been a common practice to analogize realistic interference events to the failure of certain nodes or connecting edges in a network. For example, in the study of random interferences such as natural disasters, a random function was used to realize the disturbance destruction of random nodes and connected edges in the network and the loss of basic functions [1,2]. When studying deliberate human behavioral interferences such as violence, some researcher recommended using statistical methods to identify and subsequently eliminate key nodes or edges. Wang et al. [3] analyzed the vulnerability of the network in different scenarios in terms of both structural and functional perspectives. They accomplished this by combining the entropy weight method with the preference method, taking into account the traffic flow, and introducing a comprehensive node importance index. Hong et al. [4] employed the graph theory to analyze the integrated public transportation network, comparing its characteristics to those of a single-peak network. They also proposed an improvement plan and demonstrated that the integrated network constructed by using Seoul as an example can improve the connectivity and accessibility of the transportation network.
Identifying key nodes in the public transportation network and specifying the targets for attacks are crucial for analyzing the recovery strategies in the case of extreme interference. In a related study, Gao et al. [5] identified the key nodes in public transportation networks based on the node degree and simulated attacks considering the probability of intentional attacks and comparatively analyzed the structural vulnerability of the network under random and intentional attacks. Yin et al. [6] proposed an enhanced method for assessing the importance of urban rail stations in topological networks by identifying key stations that affect the network’s performance using a complex network theory. To expedite the recover the damaged urban rail transit networks, scholars seek to improve the resilience of the urban rail transit network by determining the optimal restoration decision for network nodes and connecting the edges to improve its disaster accommodation capacity and recovery ability. Yoon et al. [7] used the average network efficiency as a toughness indicator and employed the exhaustive method to analyze the rehabilitation strategies and sequences for interchange stations and ordinary stations. In another research effort [8], the authors developed a failure recovery model for urban rail transit based on the interval restoration to minimize network toughness loss and the total recovery time. They explored the impacts of train crossing adjustments on network recovery decisions and performance in different failure scenarios. Zhang et al. [9] designed an optimization model to prioritize the restoration of critical sections with financial and time constraints, along with their restoration timings. Subsequently, in another study [10], they used the average network efficiency as a resilience index to assess the recovery performance of rail transportation networks under stochastic and preferred recovery strategies considering different combinations of restoration resources. Empirical recovery strategies, such as random recovery and preference recovery, are not always optimal when multiple stations fail due to an interference event. Zhang et al. [11] considered the impacts of the surrounding land use and explored the relationship between the attractiveness of the surrounding land use types and the vulnerability of urban public transportation networks based on an improved accessibility model. Huang et al. [12] used average network efficiency as a toughness indicator to create a rail transit network recovery model focusing on maximizing the network toughness. However, these studies primarily selected toughness assessment indices based on static topology, ignoring the interaction between the network topology and passenger flow. Yaser et al. [13] addressed the gap between seismic simulations of network blockages caused by roadside collapsed buildings, resource allocation scheduling, and Bruno’s proposed resilience index to assess the required resources and the optimal recovery plan. Sarhadi et al. [14] constructed a three-layer defense-attack-defense game-theoretic model to minimize the disruption cost of a railroad intermodal network under deliberate attack to determine the set of nodes requiring protection prior to a disaster. Starita et al. [15,16] delved into the optimization problem of metro network protection decisions considering dynamic protection resources and dynamic travel demands.
Zhao et al. [17] proposed a bi-objective two-tier optimization framework using the unmet demand and total travel time as transportation resilience metrics to determine the optimal allocation of recovery resources for enhancing system resilience. Lu et al. [18] developed a bi-level programming model for metro network protection decisions, which considers cumulative performance loss based on the toughness curve during network performance degradation and recovery, with network toughness as the primary objective. The upper-level model selects the sites to be protected during uncertain operational events. The lower-level model calculates the optimal decision for minimizing the expected value of network toughness with a user-equilibrium flow distribution model. Although this model integrates rail transit accessibility and passengers’ travel choice behavior, it focuses on expected value optimization. In practice, the optimal restoration strategy needs to be determined under known deterministic interference scenarios with a shorter restoration time for nodes or connecting edges. Therefore, applying the all-or-nothing passenger assignment method to describe the impact of network topology changes on passenger assignment is more relevant and offers a simpler and more practical algorithm.
In previous studies of urban rail transit complex networks, the researchers primarily considered a single indicator data such as the average efficiency of the network, and a few considerations were devoted to factors such as passenger service quality. In terms of urban rail transit station failure recovery, it was found that the previous research efforts mostly focused on pre-failure protection rather than post-failure recovery. In addition, most of the bi-level programming models have not accounted for passenger flow changes over time and network accessibility when determining the optimal restoration strategy from a resilience perspective.
In response to these limitations, this paper proposes a two-dimensional model to measure the resilience of urban rail transit networks considering both topology and passengers’ travel choices. We propose an integrated resilience index for urban rail transit networks and develop a bi-level programming model with the objective of maximizing the cumulative integrated resilience during the degradation and recovery of the rail network performance. The upper-level model is an integer planning model that determines the optimal recovery sequence for a failed sites during an interference event. The lower-level model is an all-or-nothing passenger assignment model, which aims to minimize travelers’ impedance. In addition, corresponding solution algorithms are presented to guide the optimal restoration decisions for subway stations in various interference scenarios.

2. Network Construction and Integrated Resilience

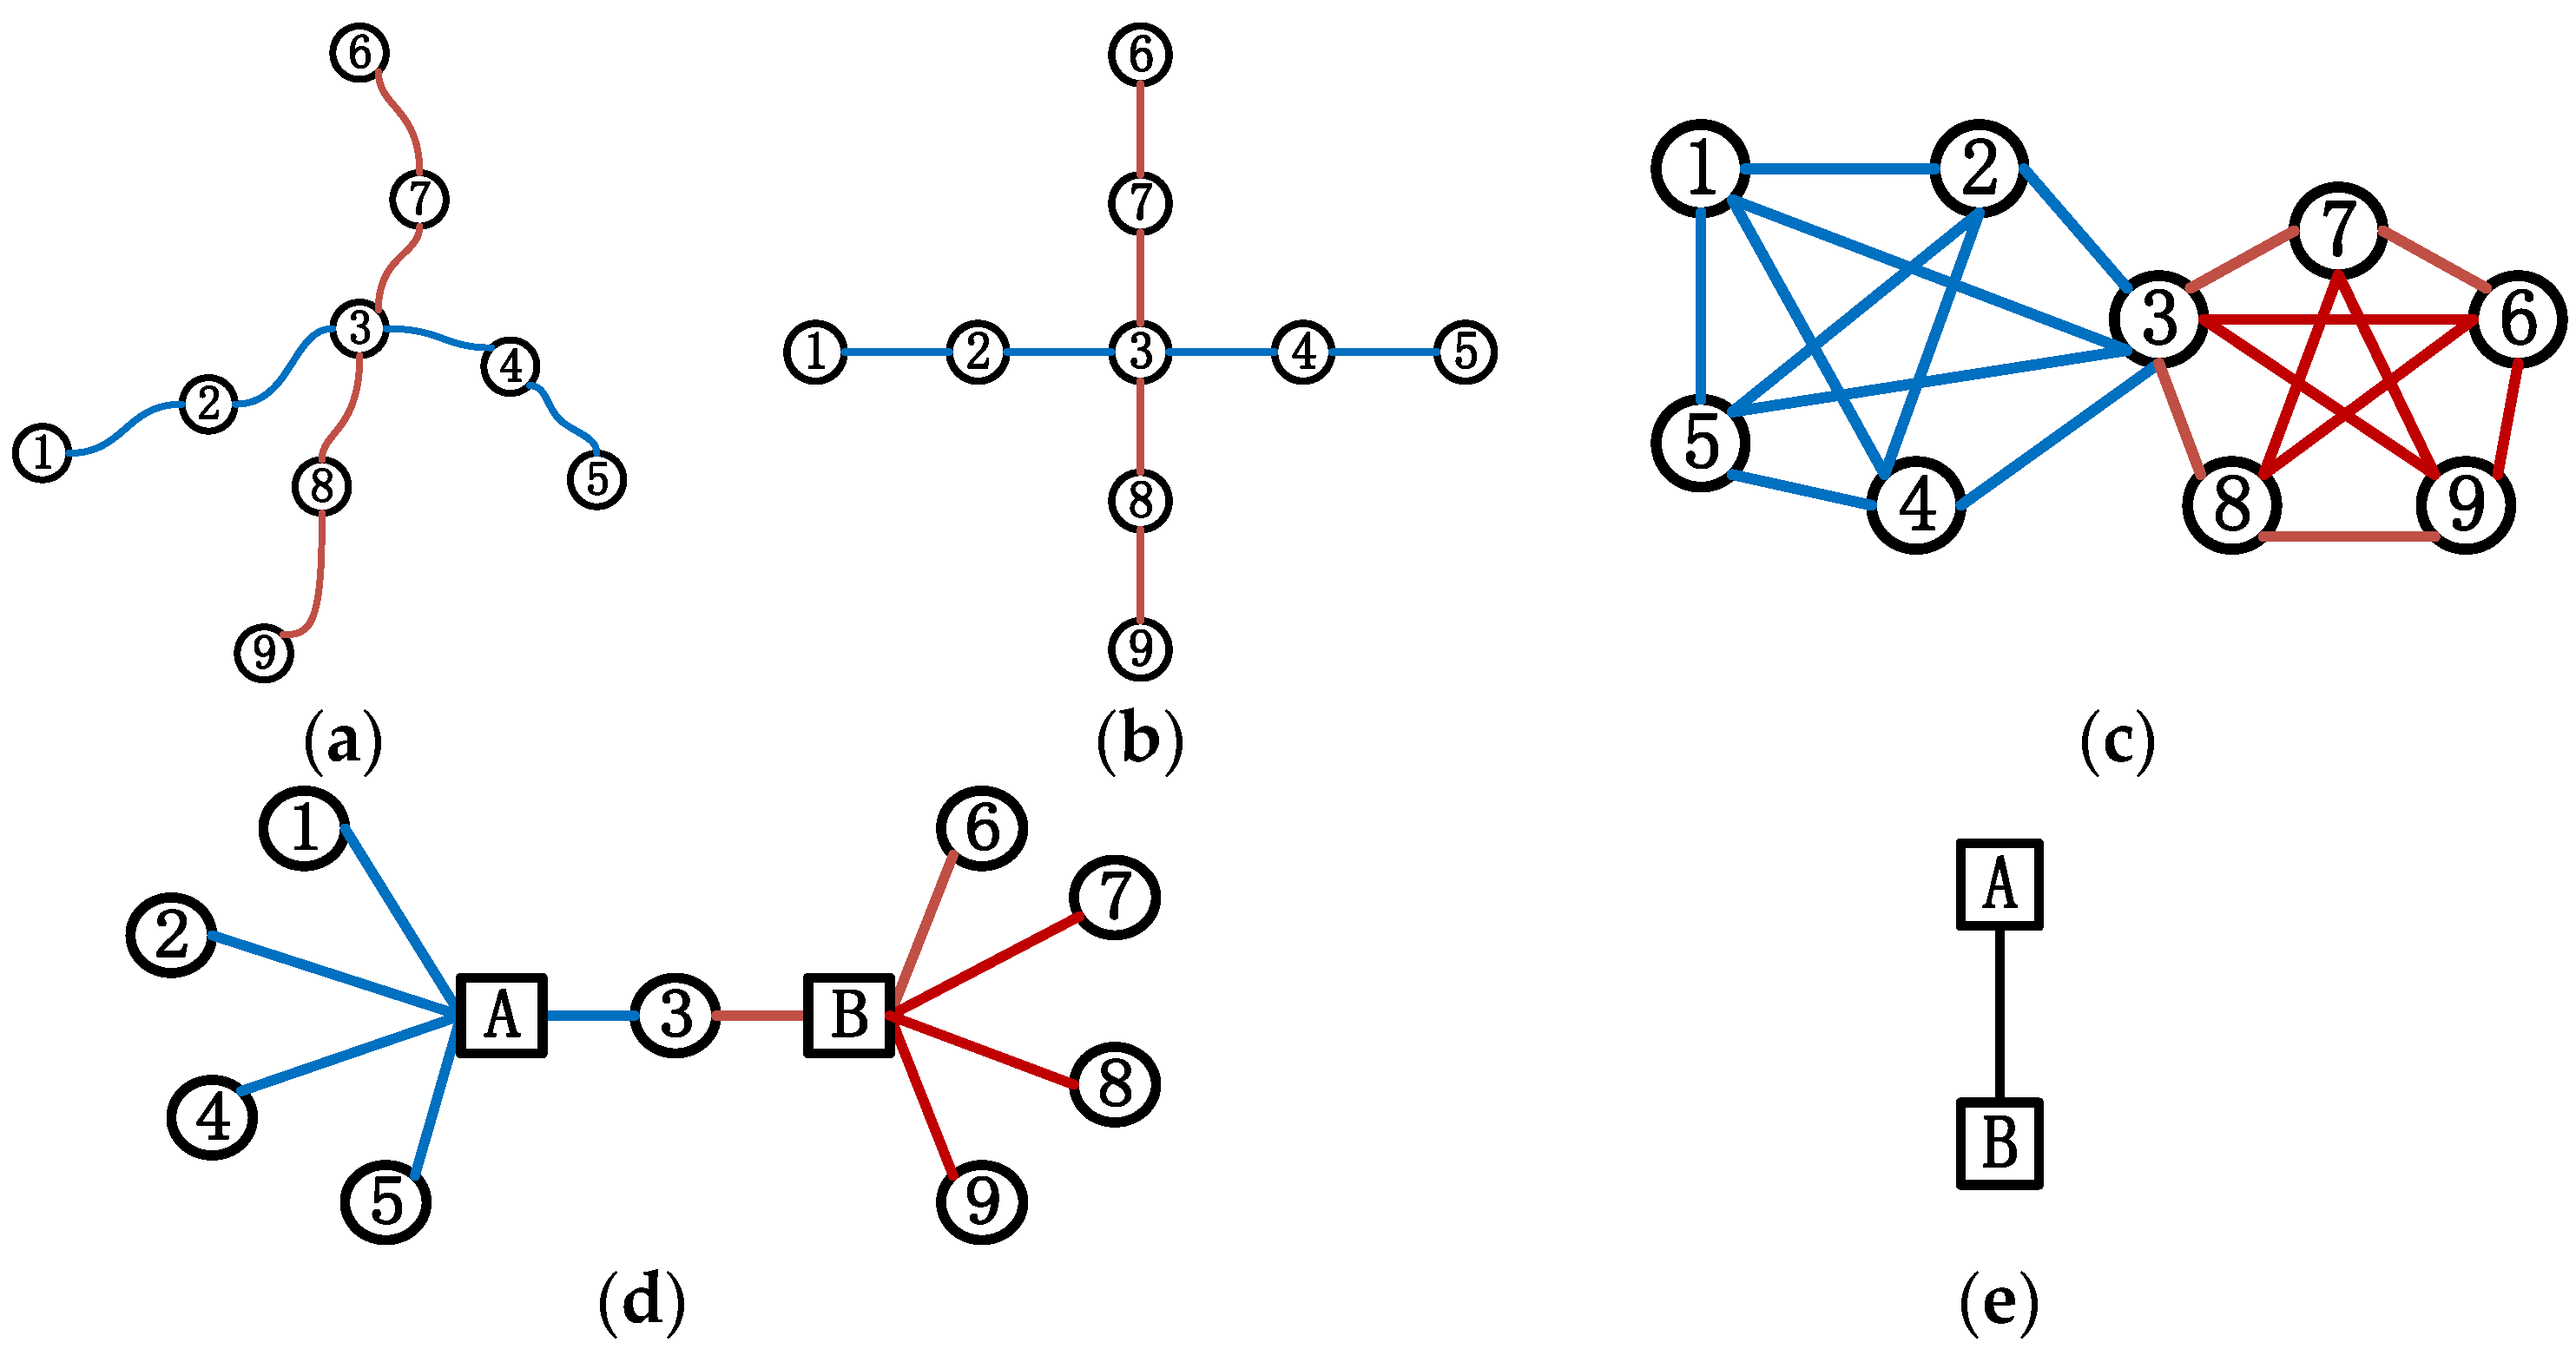
2.1. Network Construction and Problem Statement

The network topology is the basis for resilience evaluation. For a known rail transit line network, as shown in Figure 1a, the commonly used public transportation networked modeling methods are classified into four methods, namely Space-L, Space-P, Space-B, and Space-C. The network topology constructed using the Space-L model (Figure 1b) is the real, natural structural state of the urban rail transit line network, i.e., the Space-L modeling method can directly reflect the structural characteristics of the physical system. The network topology constructed using the Space-P model (Figure 1c) can reflect the interchange relationship of the network and the directness between the nodes, as the connectivity of the rail transit line network is better, and the network structure constructed with the Space-P model is relatively complex. The network topology constructed using the Space-B, model (Figure 1d) can represent the subordinate relationship between the stations and the lines, highlighting the important role of the interchange stations. The network topology constructed using the Space-C model (Figure 1e) can accurately reflect the connectivity between different operating lines in the network structure. Considering the characteristics and applicable scenarios of the four different networked modeling methods, the Space-L modeling method can most intuitively and clearly show the natural structural state of urban rail transit, so this method is adopted in this paper for the construction of urban rail transit network structure. The Space-L modeling approach represents each station of an urban rail transit network as a node, and the existence of a direct operating line between two adjacent station intervals results in the existence of directly connected edges between the corresponding two nodes. There exists, at most, one directly connected edge between any node i and node j. When constructing a weighted network using the Space-L model, the weights of the connected edges can be defined as the actual geographic distances or traffic flows between two neighboring stations [19,20,21,22,23].
When the urban rail transit network is exposed to external interferences, its capability of absorbing the interferences and subsequently recovering to the initial level of operation or reaching a new equilibrium is affected. The change curve that illustrates the of urban rail transit network performance is shown in Figure 2, which provides an intuitive expression of the network’s absorption and recovery abilities to external interferences.
The performance of the rail transit network remains at the initial value at the moment  t 0  before the occurrence of an interference event e. The disruptive event occurs at  t e  when specific subway stations in the network are damaged, causing these stations to cease operations. Consequently, the affected passengers are not able to enter or exit the subway network through these stations, resulting in a decrease in network connectivity. At the same time, there are two travel choices for the affected passengers. In one scenario, the passengers will choose other rail transit paths with an acceptable travel time and number of transfers; since the passengers still stay during urban rail transit, there is no loss of rail transit passenger flow. The other scenario is that the passengers abandon urban rail travel and switch to alternative travel modes, causing a loss in rail traffic, as shown in Figure 3. During this period, the service performance of the network continues to deteriorate until it reaches the lowest point at the moment  t s . Subsequently, the operating company dispatches workers and equipment to repair these stations in turn, and the network connectivity and service performance gradually improve until all the sites are fully restored at a later moment  t r , and ultimately restoring the overall performance of the network system to its initial level [24,25,26].

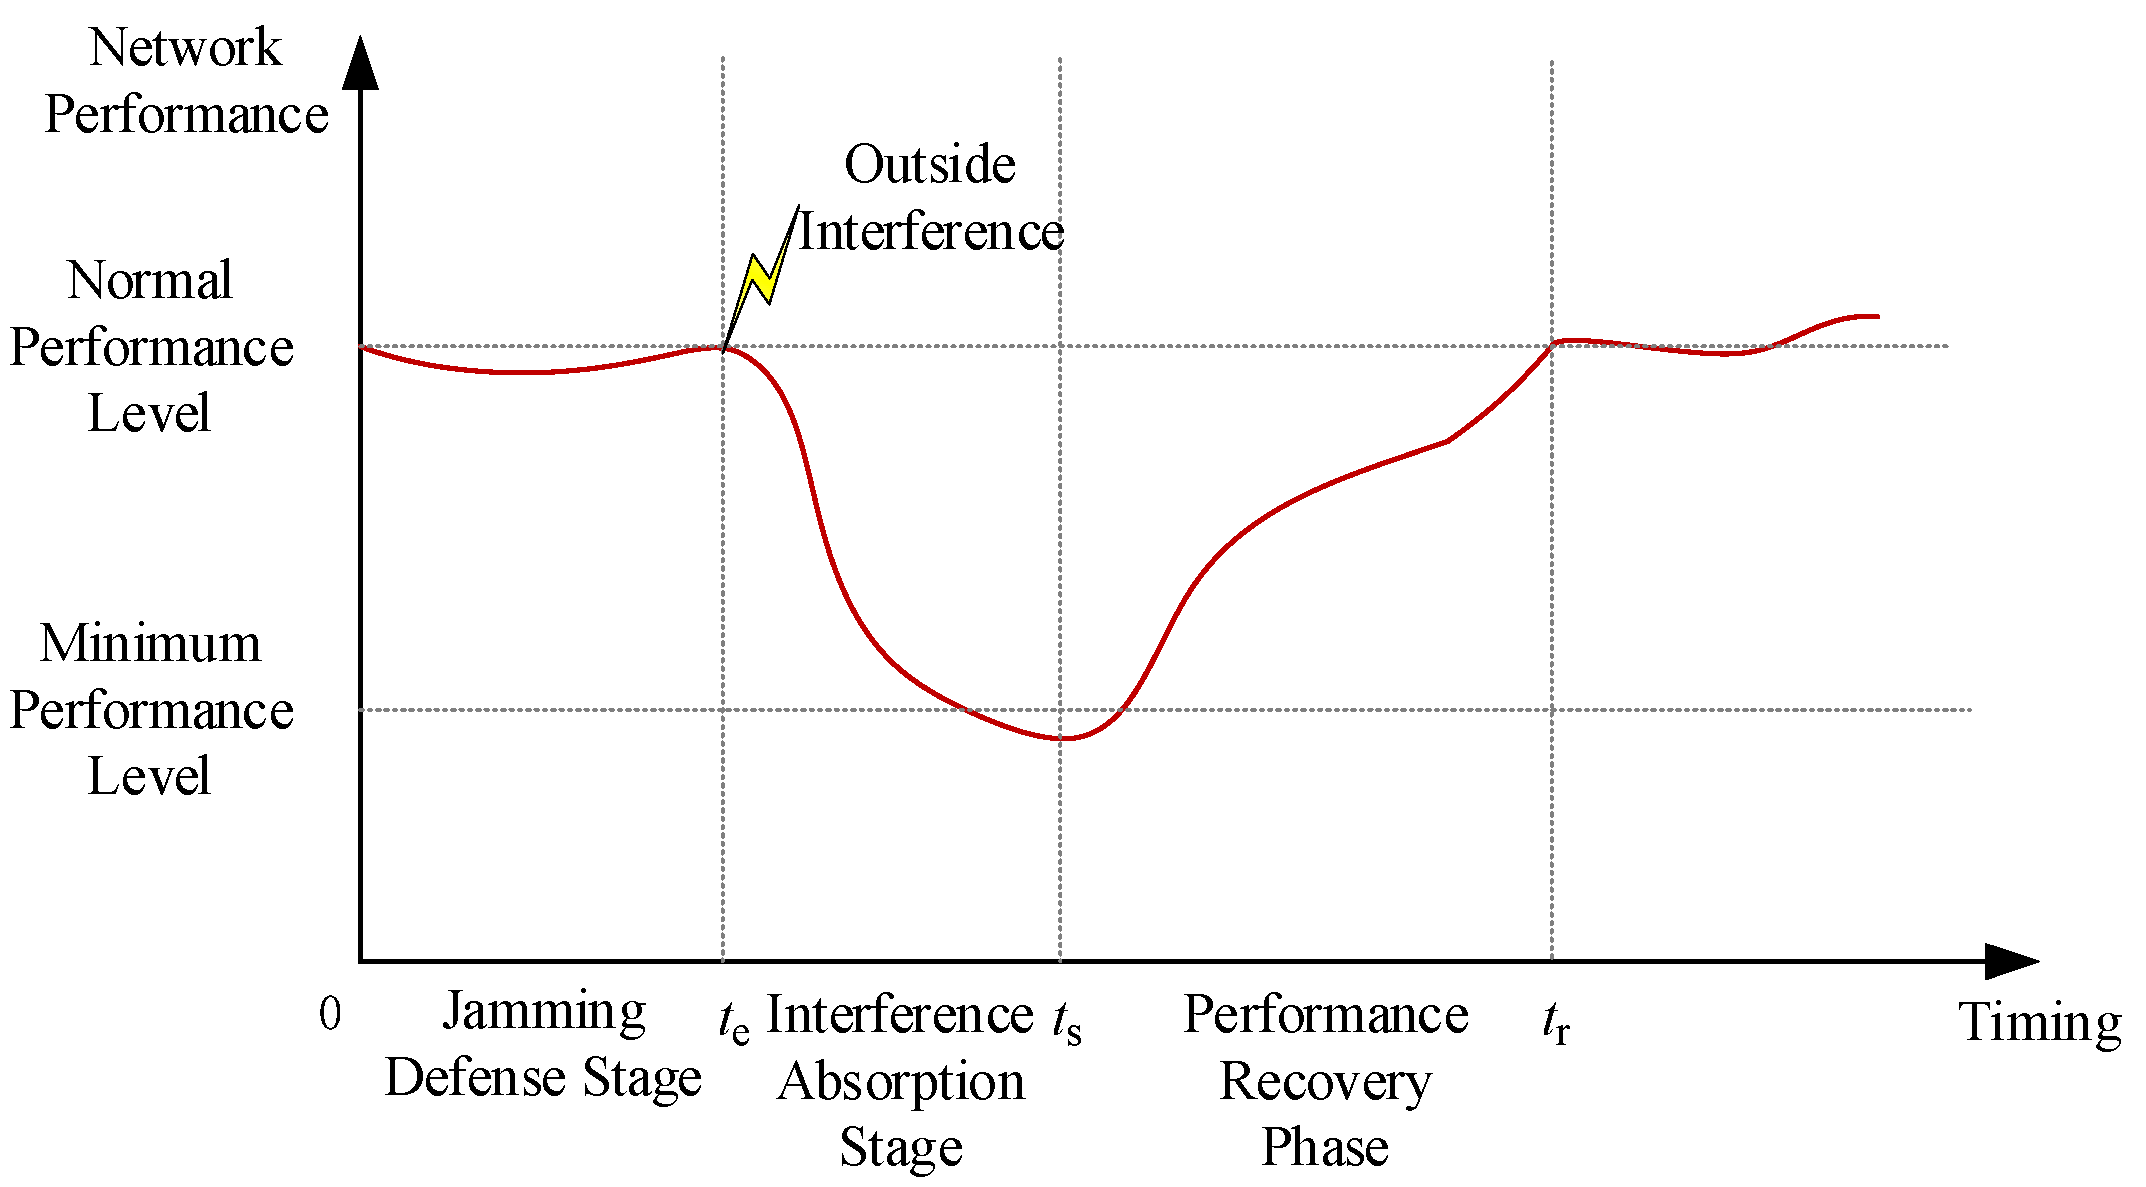
2.2. Integrated Resilience of Rail Transit Networks

When specific nodes in the urban rail transit fail due to damage, the shortest paths between network nodes are altered, and the connectivity performance of the network decreases. The strength of network connectivity can be measured based on the average efficiency of the network. In this paper, the average efficiency of the network is chosen to measure the connectivity of the urban rail transit network at moment t. The calculation formula is shown as follows.
E t = 1 N t N t 1 i j 1 d i j t
where  E t  represents the average efficiency of the network at time t;  N t  represents the number of effective nodes in the network at time t;  d i j t  represents the shortest path length from Node i to Node j at time t.
After some subway stations in the network are damaged and cease station operations, the passengers may need to re-evaluate their travel paths or travel modes. Therefore, this paper introduces the passenger flow retention rate of the urban rail transit network  φ ( t )  to characterize the changes in the service performance of the network following a network node failure. This rate is defined as the ratio of the disturbed network flow to the original flow, and the calculation formula is described as follows:
φ t = w W Q w t w W Q w t 0 = w W u U w t f u , w , r t w W u U w t 0 f u , w , r t 0
where  φ ( t )  represents the passenger retention rate of the urban rail transit network at time t; w represents the Origin–Destination (OD) passengers’ demand for the pair  W W  stands for the OD passengers’ demand for Point-to-Point Aggregation;  Q w t 0    represents the passenger retention left at point OD for w assumed by the rail network at the moment  t 0    before the perturbation event occurs;  Q w t    represents the passenger flow retention left at the OD point w assumed by the rail network at moment t after the perturbation event occurs;  f u , w , r t 0  represents the passenger flow retention on the rail transit path u at point OD for w at time  t 0    before the perturbation event occurs;  f u , w , r t    represents the passenger flow retention left at point OD for w on the rail path u at moment t after the perturbation event occurs;  U w t 0  represents the set of effective paths of the OD point pair w on the rail transit line network  G = N , A  at the moment  t 0  before the perturbation event occurs;  U w t    represents set of valid paths for the OD point pair w on the rail transit line network  G t = N t , A t  at time t after the perturbation event.
According to the changes in urban rail transit network performance, urban rail transit network resilience emphasizes the overall performance of the network throughout the period from damage until recovery to the normal state following an interference event. Therefore, network toughness can be quantified as the cumulative residual degree of network performance after an interference. Meanwhile, considering the impact of a rail transit station failure on network connectivity and service performance, we propose a comprehensive network resilience index  R X e , which takes into account the network topology and service quality, as shown in Equation (3).
R X e = t e t r E t d t t r t e E t 0 + 1 t e t r φ ( t ) d t t r t e φ ( t 0 )
where  R X e  represents the comprehensive network resilience of the network throughout the entire process from damage to restoration to a normal state using policy X after an interference event occurs;   represents the weight,  0 1 t r  represents the moment when the network is fully restored;  t e  represents the moment of occurrence of an interference event e t 0  represents the initial moment when the network is free from interference;  E t 0  represents the average efficiency of the network when the network is free from interference;  φ ( t 0 )  represents the retention of traffic when the network is not disturbed.

3. Rail Transit Network Recovery Model

3.1. Basic Assumptions

(1) It is assumed that the performance of the urban rail transit network is maintained at its initial level before the external interference. Once the external interference occurs, it rapidly decreases to the lowest level and gradually improves after the implementation of certain recovery measures.
(2) It is assumed that site recovery cannot occur simultaneously, and each site must be fully recovered before recovery actions can be performed at the next site.
(3) There is no change in the performance of the urban rail transit network during the recovery of a particular station or zone.
(4) The transfer time consumption and capacity differences when recovering different sites are negligible.
(5) Upon completion of all the phases of restoration work, the performance of the urban rail transit network is restored to its initial level.
(6) Each disturbed station requires the same amount of time for recovery.

3.2. Upper-Level Model

In this paper, the upper-layer model is the optimization model of the subway network recovery decision. The objective function aims to maximize the comprehensive toughness index, which represents network cumulative performance degradation and recovery throughout the entire process of the largest residual. The decision variable in this model is the subway station restoration strategy X.
max R X e = t e t r E t d t t r t e E t 0 + 1 t e t r φ ( t ) d t t r t e φ ( t 0 )
s . t . t i > t e , i = 1 , 2 , , s
t r = t e + s × T
E t = 1 N t N t 1 i j 1 d i j t
φ t = w W u U w t f u , w , r t w W u U w t 0 f u , w , r t 0
E t = E t i , t i t < t i + T
φ ( t ) = φ ( t i ) , t i t < t i + T
X Z
where  t i  represents the moment when the restoration of the i-th station is completed;  s  represents the number of failed stations after the occurrence of an interference event e T  represents the time required to repair each station;  Z  represents the set of all alternative strategies after the occurrence of the perturbation event e.
Equation (4) represents the maximum value of the comprehensive toughness index; Equations (5) and (6) denote the time constraints for completing the restoration of the i-th station as well as the overall network restoration, respectively. Equations (7) and (8) define the average efficiency of the urban rail transit network and passenger retention, respectively; Equations (9) and (10) define the constraints for the phase invariance of network connectivity performance and service performance throughout the restoration process, respectively.

3.3. Lower-Level Model

An SP questionnaire survey of subway riders was conducted for this project. The findings show that when some of the Metro’s nodes fail, the riders will essentially choose the shortest path to travel. If the rail transit path with the lowest impedance exceeds a passenger’s affordability, the passenger will choose an alternative traffic mode for his/her travel. In this paper, the study of passenger travel path impedance mainly focuses on the travel time to establish the path road resistance function, which includes road section impedance and node impedance. Based on a field study, it is known that the impedance of the edges in the rail network graph is unaffected by the passenger flow during the short repair process of the failed rail stations (the repair time of each station is T), and the values of the nodes impedance are affected by the passenger flow, but the impact is relatively small and basically tends to be stable. Therefore, in this paper, the node impedance values are assumed to be unchanged in the process of passenger flow allocation at T time. The all-or-nothing passenger flow allocation methodology is largely applicable to this study.
We employed the all-or-nothing allocation method to establish the lower-level model [27].
min Z t = a A t f a t Z a t + n N t f n t Z n t
s . t . f u , w t = q w ρ u , w t
ρ u , w t = 1 ,   I n t e r w   p a s s e n g e r   f l o w s   a r e   a s s i g n e d   t o   p a t h   u   a t   m o m e n t   t   ; 0 ,   O t h e r w i s e .
u U w t ρ u , w t = 1
f a t = w W u U w t f u , w t δ a , u , w t
δ a , u , w t = 1 ,     A t   m o m e n t   t   t h e   a r c   a   i s   o n   t h e   u t h   p a t h   o f   t h e   O D   p o i n t   t o   w ; 0 ,   O t h e r w i s e .
f n t = w W u U w t f u , w t δ n , u , w t
δ n , u , w t = 1 ,     A t   m o m e n t   t   p o i n t   n   i s   o n   t h e   u t h   p a t h   o f   t h e   O D   p o i n t   p a i r   w ; 0 ,   O t h e r w i s e .
Z a t = s a v
Z n t = α y s , n t ,   R e s u m p t i o n   o f   a   t r i p ;   β y h , n t ,   C h a n g e   t r a i n .
Z u , w t = a A u t Z a t + n N u t Z n t , w h e n ρ u , w t = 1 ;   , w h e n ρ u , w t = 0 .  
γ u , w t = 1 ,   Z u , w t τ Z w t 0 ; 0 ,   Z u , w t > τ Z w t 0 .
f u , w , r t = f u , w t γ u , w t
where
Z t  represents the objective value of the all-or-nothing flow distribution problem at time t;
f a t  represents the number of passengers passing through Section a at moment t;
f n t  represents the passenger flow through Node n at moment t;
Z a t  represents the temporal impedance of Section a at moment t;
Z n t  represents the temporal impedance of Node n at time t;
A t  represents the set of rail transit network Sections at moment t;
A u t  represents the set of segments in the Path u of the rail transit network at time t;
N t  represents the set of nodes of the rail transit network at time t;
N u t  represents the set of nodes in the Path u of the rail transportation network at time t;
  f u , w t  represents the passenger flow on Path u assigned to w by the OD point pair at time t;
q w  represents the amount of passenger flow distribution at the OD point to w;
ρ u , w t  is a binary variable that takes one to indicate that the amount of passenger flow distribution from OD point to w assigned to Path u at time t, and 0 otherwise;
δ a , u , w t  takes 1 to indicate that at time t the road segment a is on the u-th path of the OD point pair w, or 0 otherwise;
δ n , u , w t  takes 1 to indicate that Node n is on the u-th path of the OD point pair w at time t, or 0 otherwise;
s a  represents the length of Section a;
v  represents the speed at which the railcar is traveling;
y s , n t  represents the renewal time of continuing to wait for a vehicle at Node n at moment t;
y h , n t  represents the transfer time for transferring to another line at Node n at moment t;
α , β , τ  are amplification factors;
Z u , w t  represents the impedance value on the u-th path of the OD point w at moment t;
Z w t 0  represents the shortest path length between the OD point pair w at the moment  t 0  before the disturbance;
γ u , w t  is taken as 1 to indicate that the passenger flow from OD point w at time t is borne by the rail path u, or 0 otherwise.
Equation (12) indicates the minimization of the objective value in the all-or-nothing flow distribution problem. Equations (13)–(15) assign the passenger flow distribution volume from the OD point pair w to path u. Equations (16)–(19) are used to compute the passenger flow passing through “road section a” and “station n” at moment t, respectively. Equations (20)–(22) are employed to calculate the impedance of road section a and node n along path u at moment t. Equations (23) and (24) determine the passenger flow distribution volume borne by the rail transit network and also calculate the amount of passenger flow left to be borne by the rail transit line network at moment t.

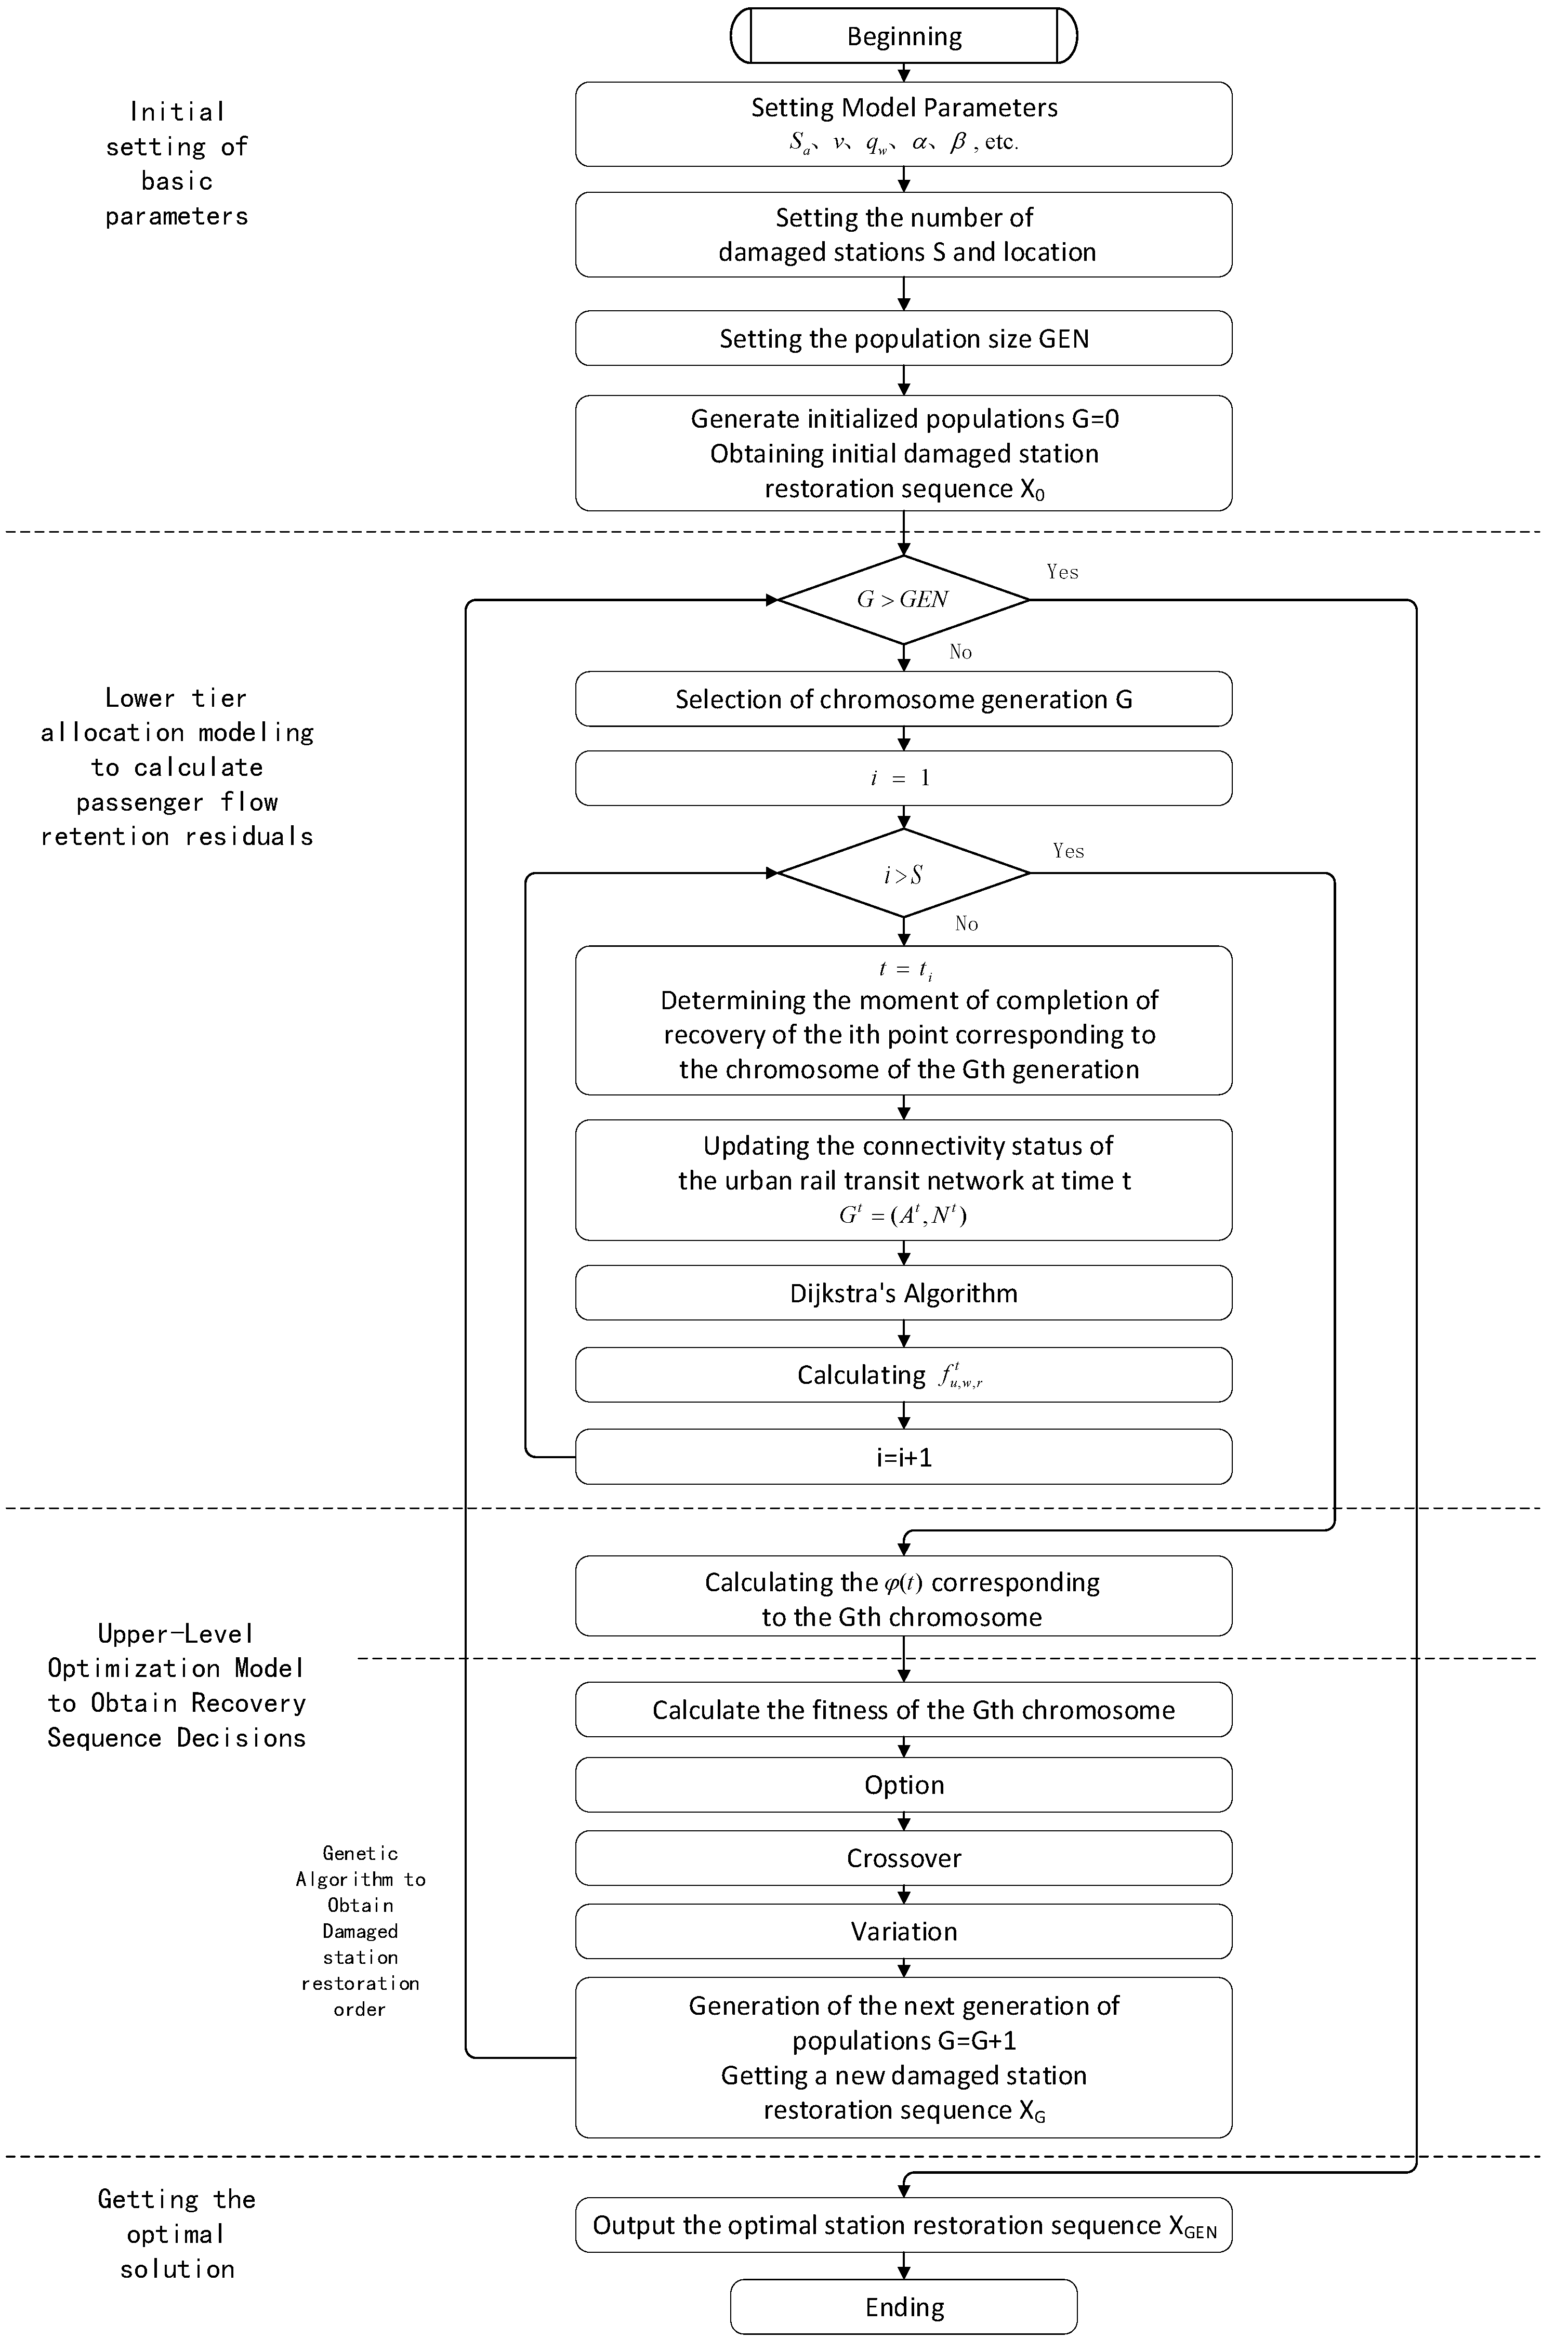
3.4. Algorithm Design
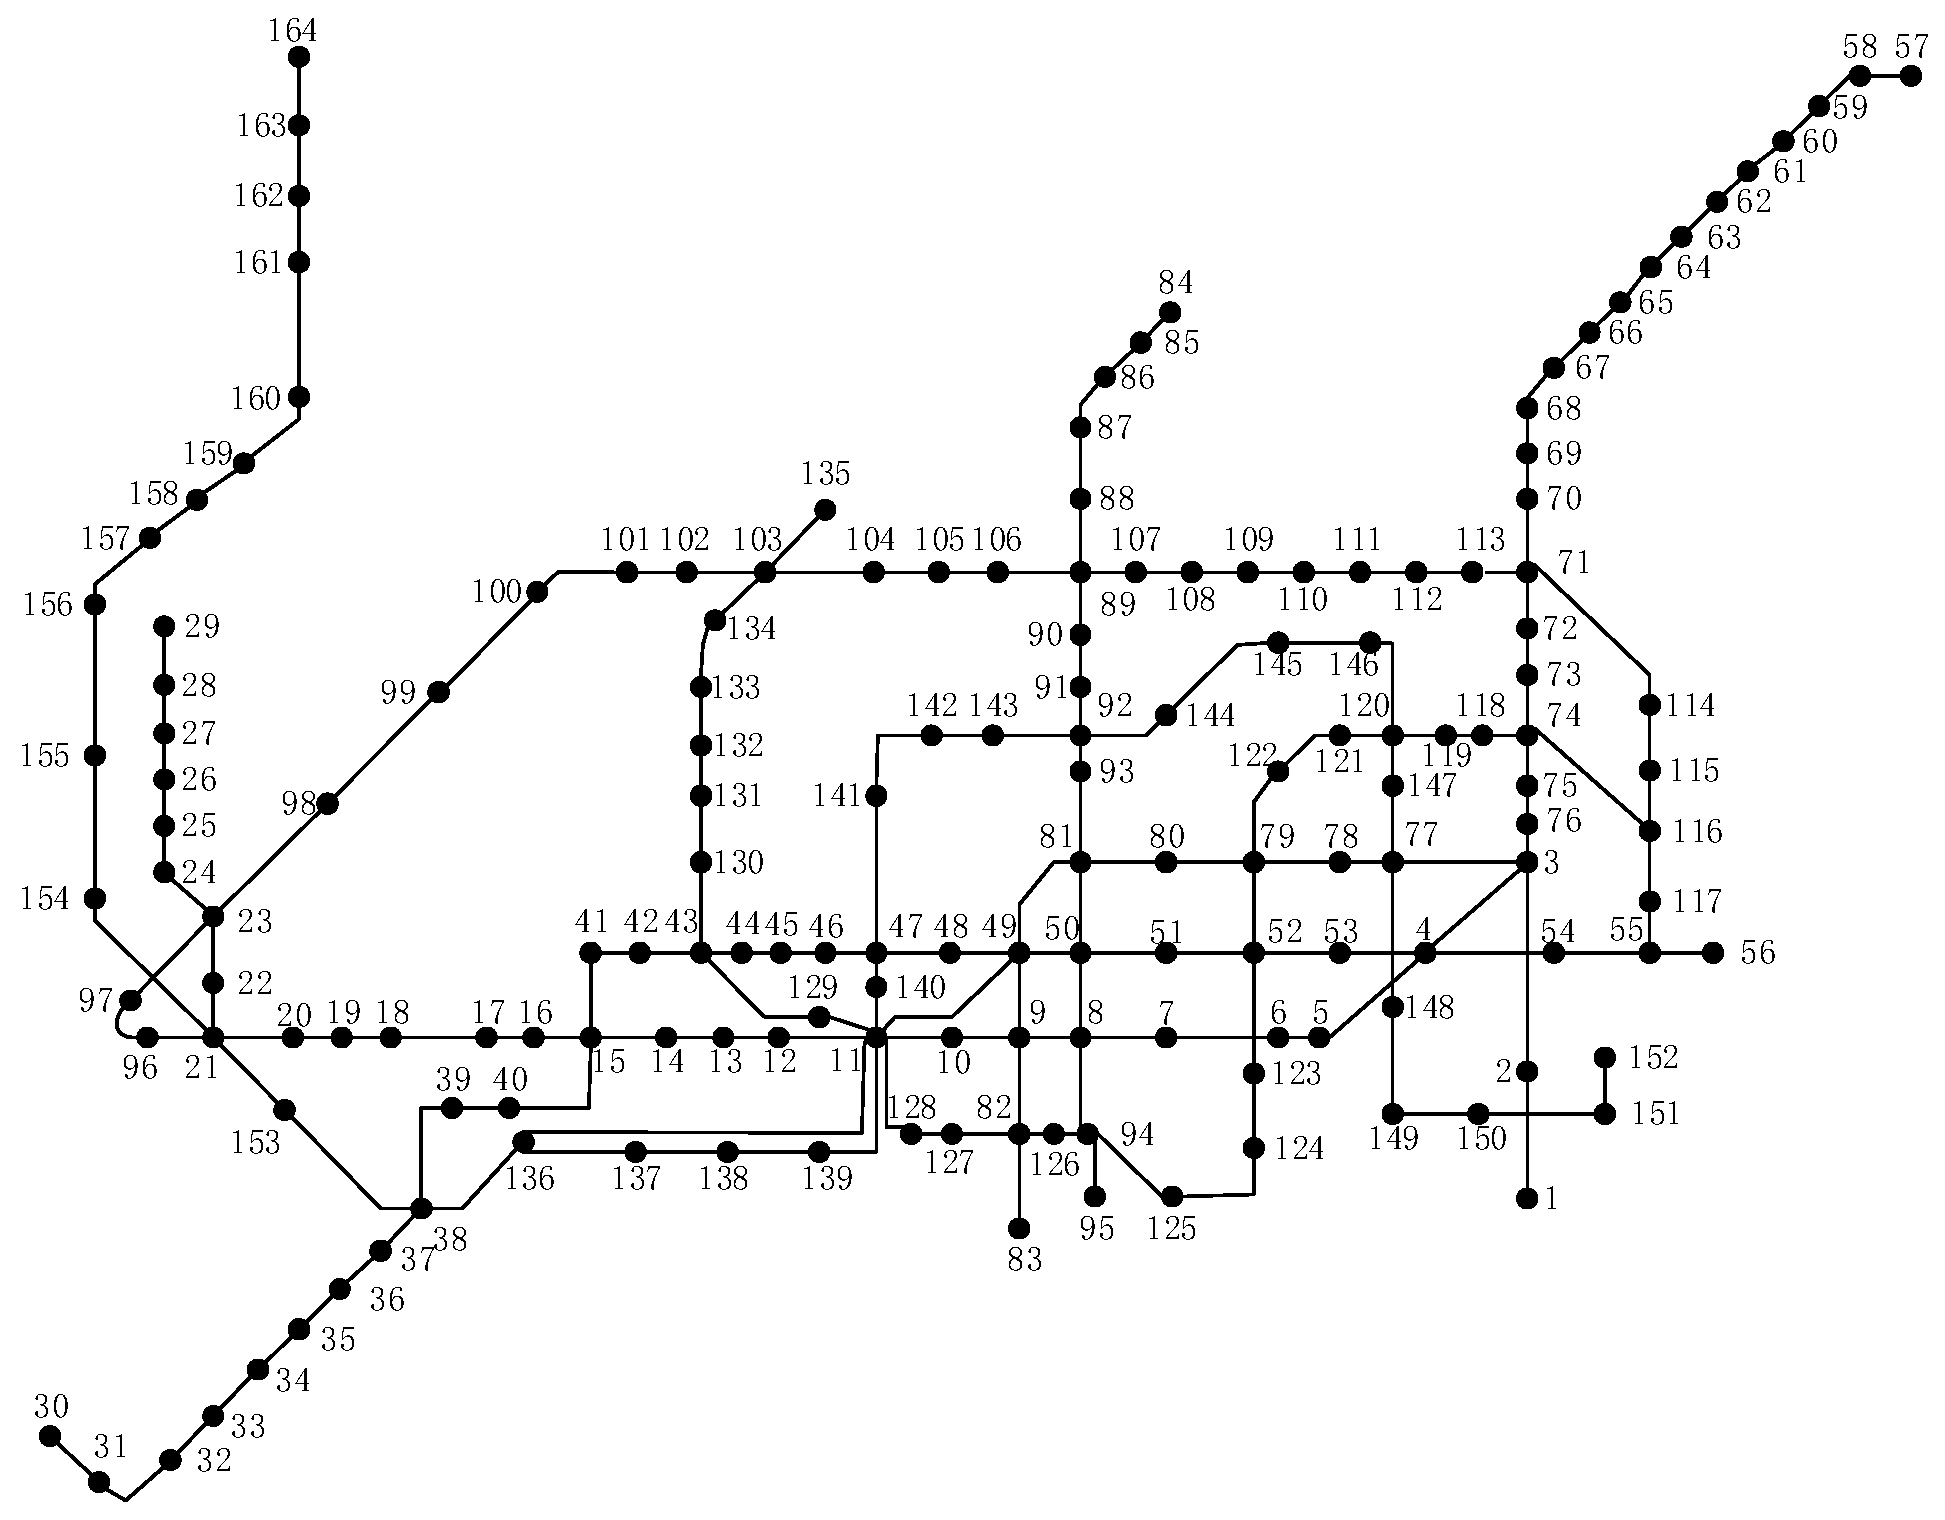
In this paper, the bi-level programming model is solved using a genetic algorithm and a disquote algorithm, in which the genetic algorithm is used to solve the upper-layer model to determine the optimal network node recovery based on the integrated toughness index [28]. The disquote algorithm is applied to solve the shortest path in the lower-layer planning. The algorithm-specific steps are described as follows.
Step 1: The initialization of parameters.
Step 2: To initialize the population, one of the initial chromosomes is randomly selected for calculation, and the result serves as the initial state of the population.
Step 3: The decision for restoring damaged station is sequentially input into the lower-layer model to calculate the optimal solution of the lower-layer passenger flow distribution model at each moment. This enables researchers to obtain the passenger flow distribution volume and impedance value of each OD point-to-point passenger flow distribution volume on the rail transit network. Then, the passenger flow distribution volume borne by the rail transit is determined according to the multiplier relationship between the real-time path impedance and the original path impedance. After that, calculates the network performance φ(t), which is input into the upper-layer model to obtain the upper-layer objective function.
Step 4: Based on the roulette wheel method, the chromosome with the better toughness performance is selected to participate in the subsequent calculations.
Step 5: The number of iterations, G, must be greater than the maximum number of iterations, GEN. If it is, one must proceed to Step 6; otherwise, increment G by one (i.e., G = G + 1), update the chromosome of generation G + 1, and at the same time, perform crossover and mutation on the chromosome before returning to Step 3.
Step 6: The solution for the optimal chromosome is recorded, and the algorithm finalizes.
The algorithm flow is shown in Figure 4.

4. Case Study

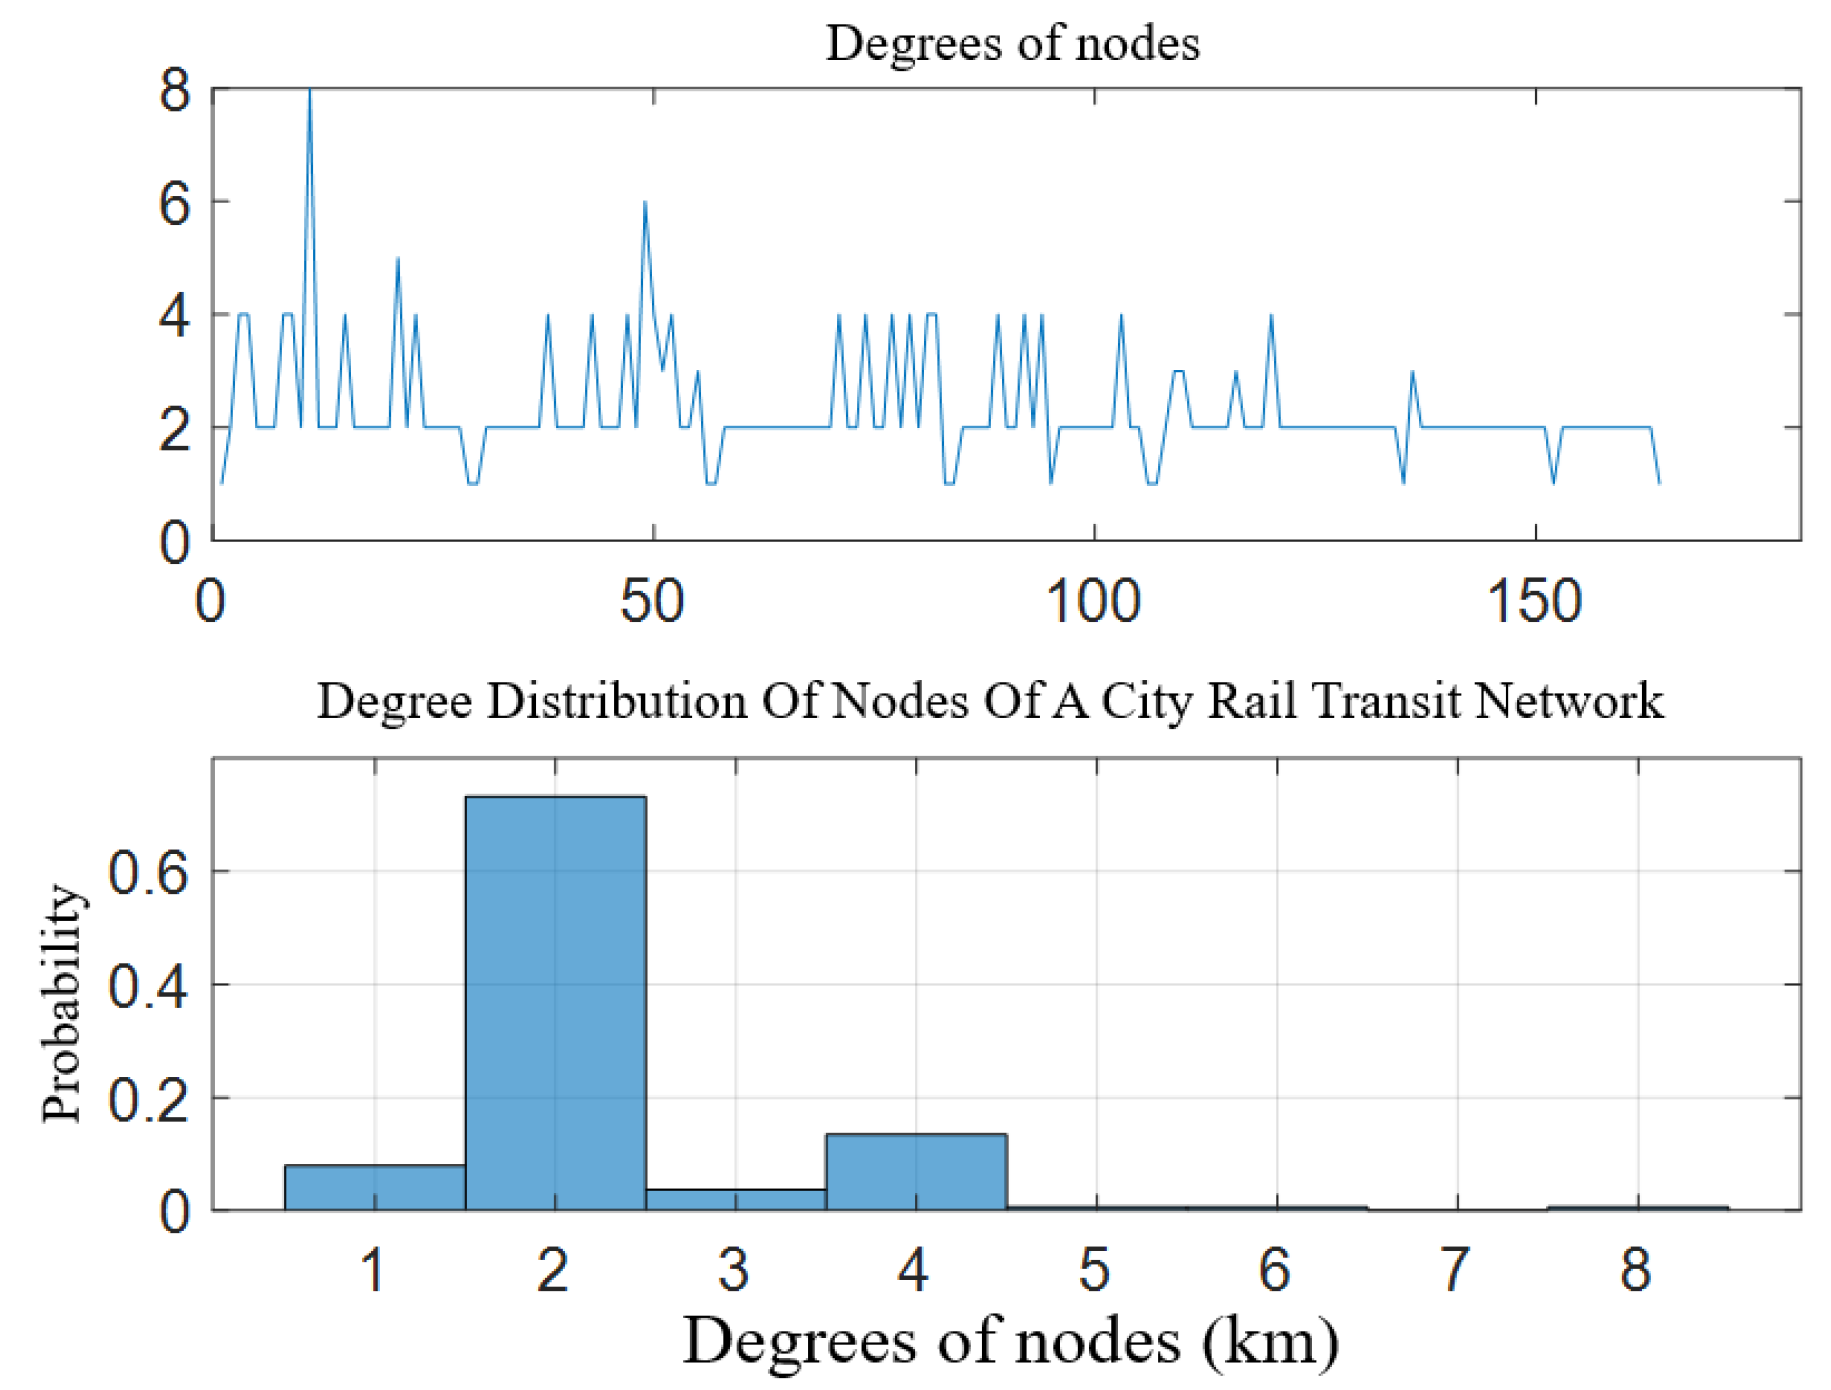
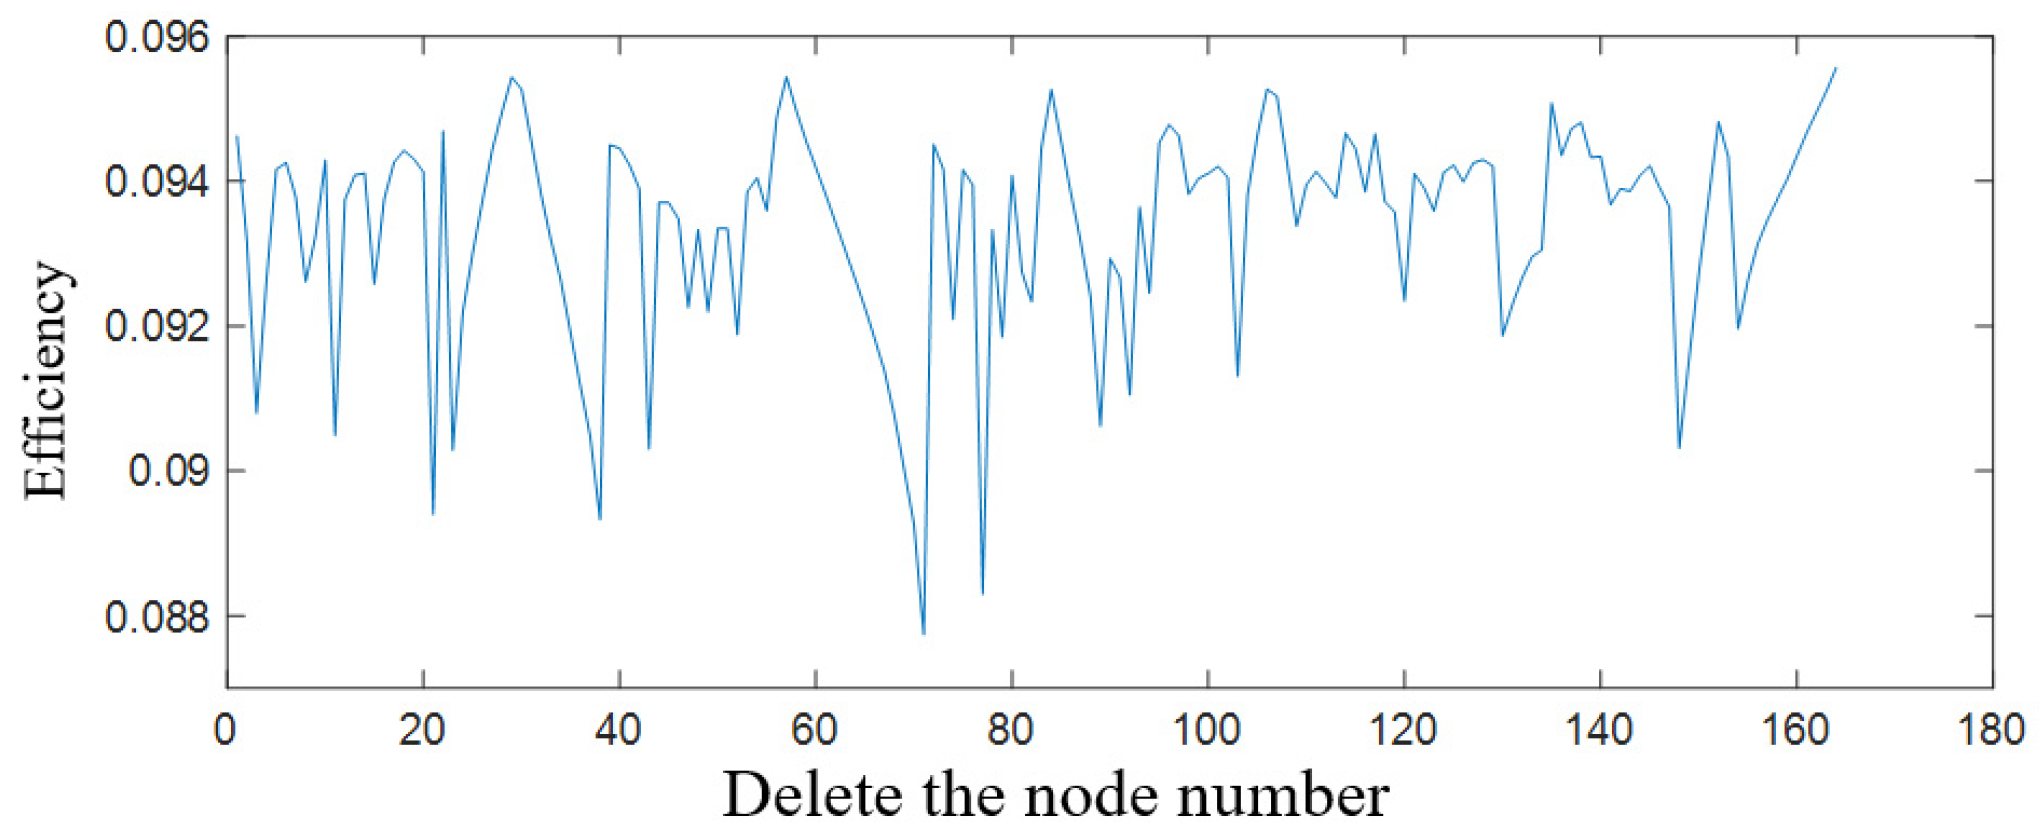
4.1. Analysis of Urban Rail Transit Network Structure

This paper employed a city’s urban rail transit network as a case study. It comprises eight operational lines, forming a network with a “checkerboard + ring + radiation” topological structure, as illustrated in Figure 5.
Using the weighted adjacency matrix of the network, the degree of each node, p, in the network can be calculated, which represents the total number of connected edges between a node and the other nodes in the network. Figure 6 presents the degree distribution of nodes within the urban rail transit network, in which nodes with a degree of two are the most numerous and have the highest probability, indicating that the network is skewed toward ordinary nodes. However, nodes with a high degree value pose a relatively higher potential risk of intentional external attacks.
To assess the vulnerability of the network structure, individual sites are separately subjected to attacks, so that they suffers damage and are incapable of normal operation. Subsequently, the average efficiency of the network and passenger retention rate are calculated for generating the trend graphs illustrating the network’s efficiency and passenger retention rate when a single site is attacked, as shown in Figure 7 and Figure 8, respectively.
The degree of network nodes, average efficiency of the network, and passenger retention rate can be used as evaluation indices to rank the importance of each node within the network. This paper lists the top 10 node labels and their corresponding values for each evaluation index, as shown in Table 1.

4.2. Interference Scenario Design
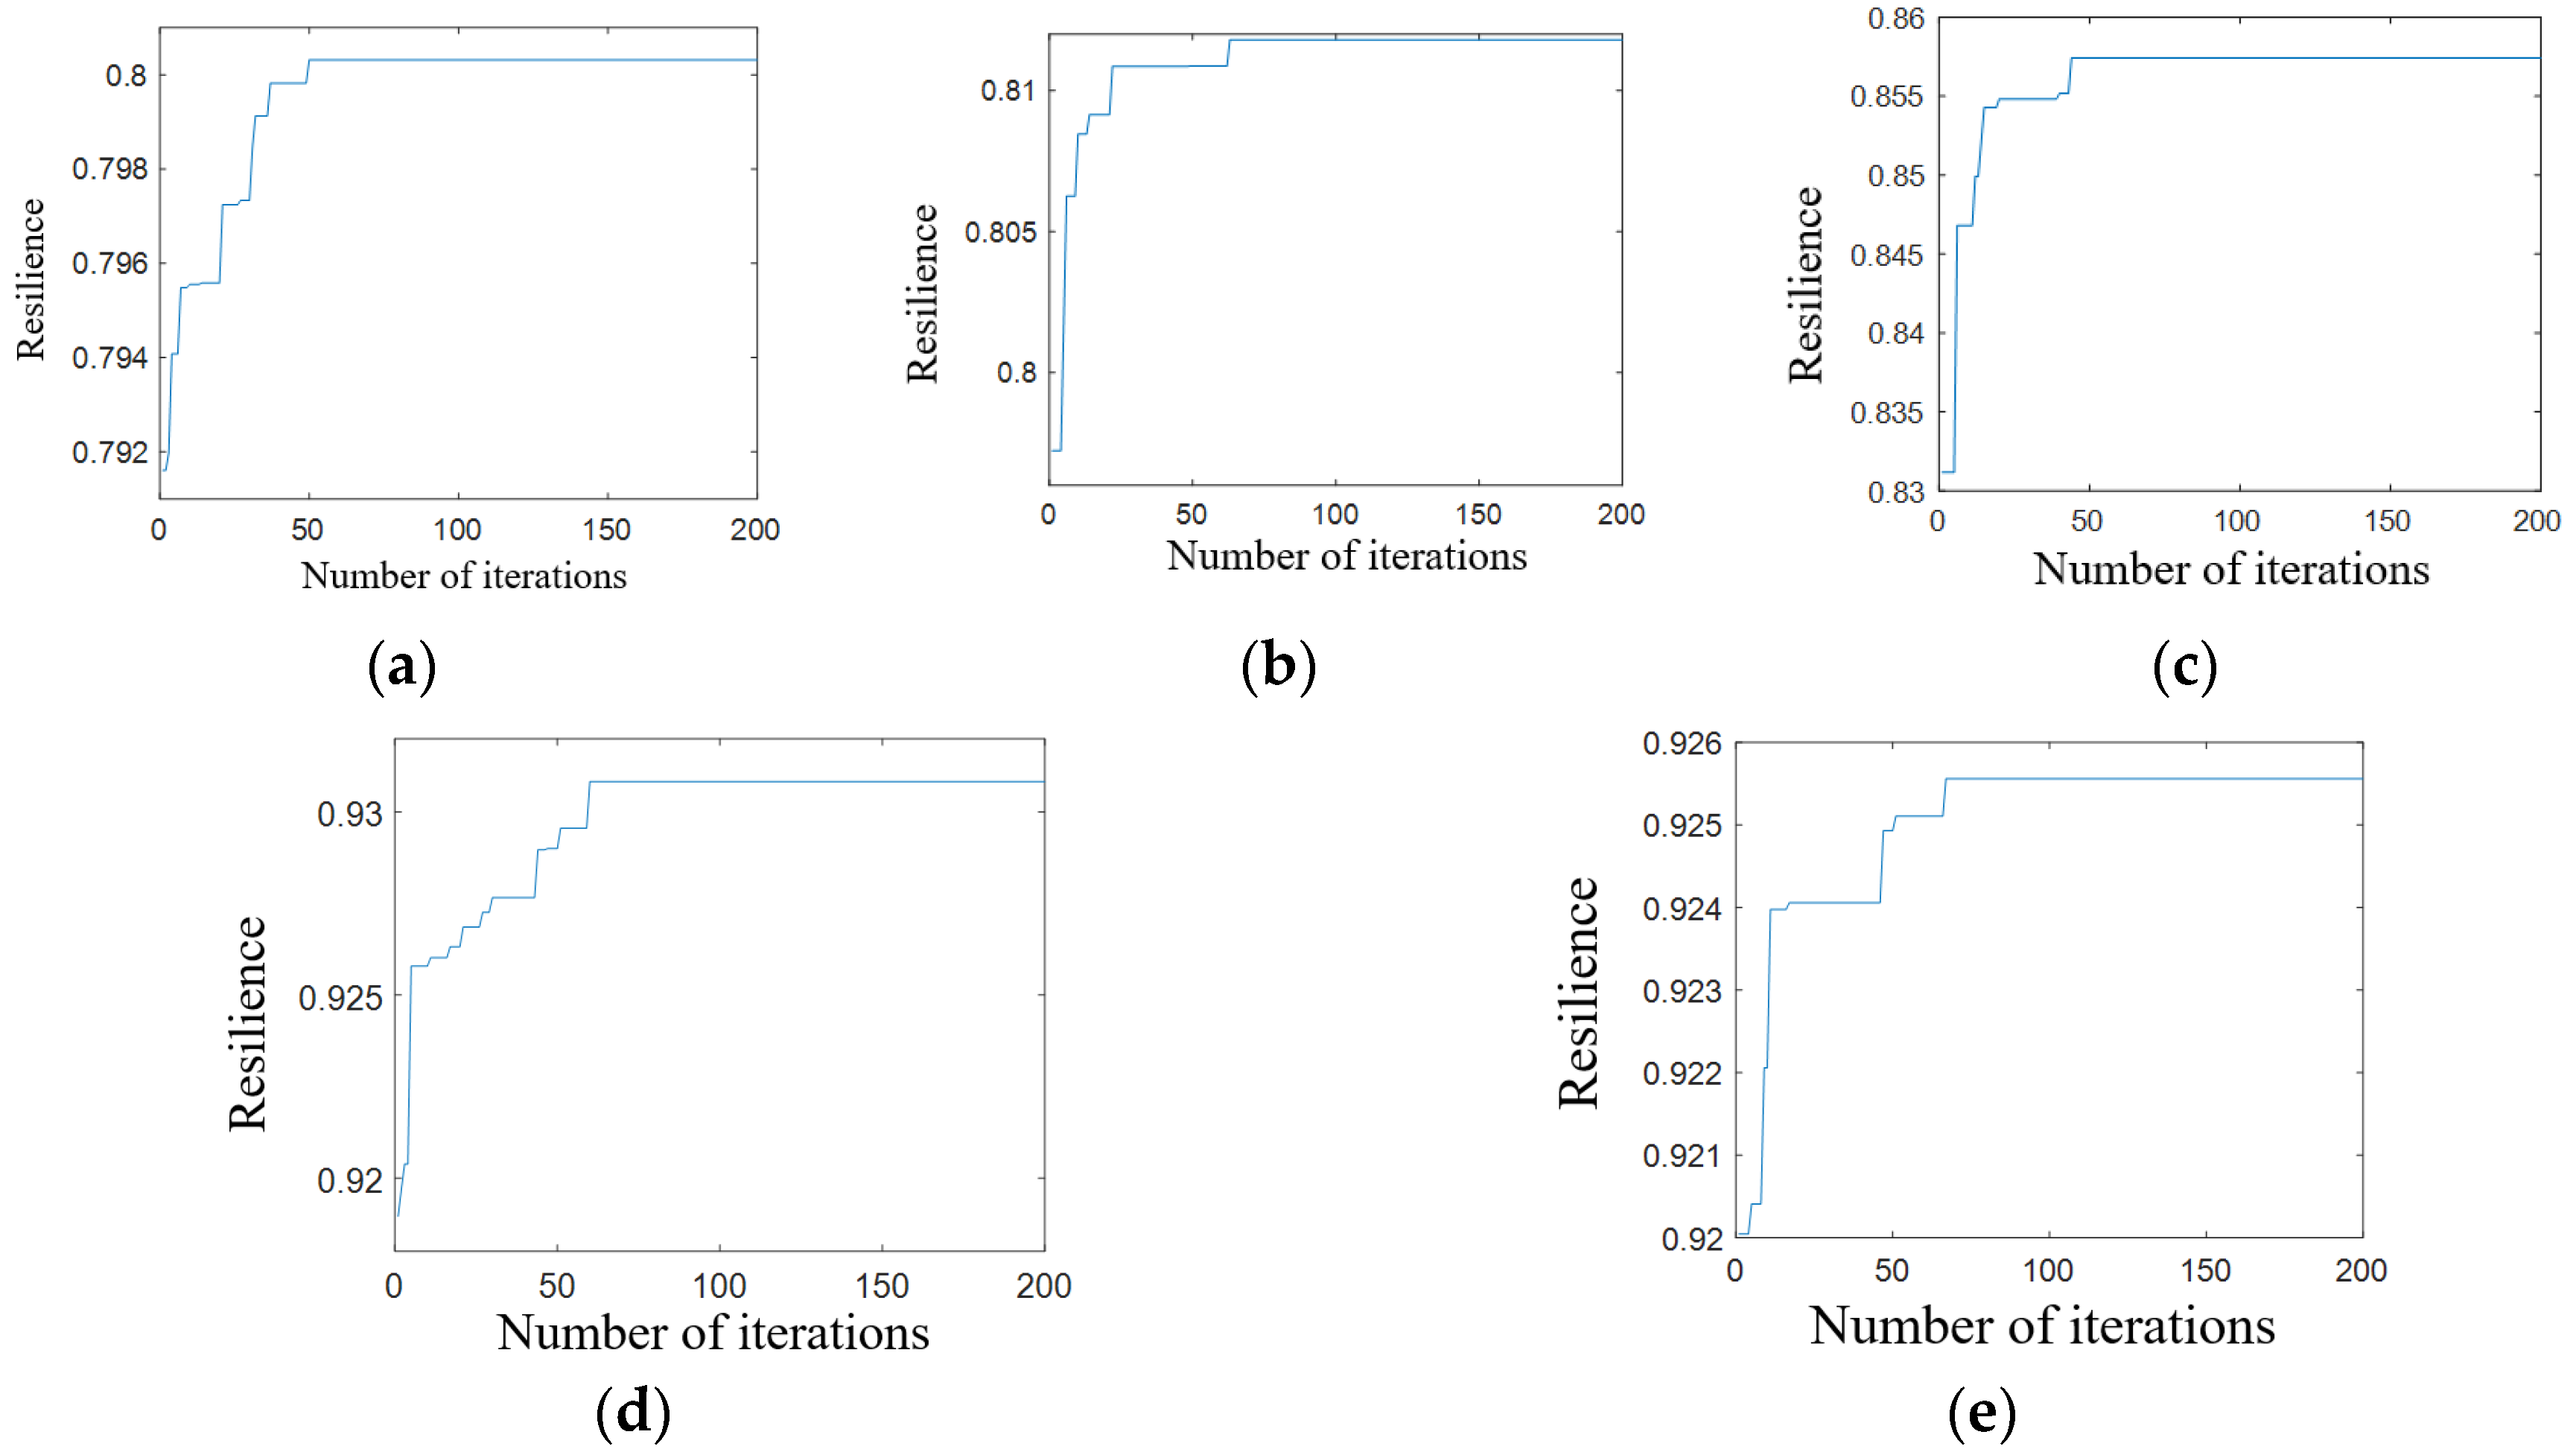
The urban rail transit network is subject to a variety of external interferences, and each of them can have varying impacts on the urban rail transit network, which, in turn, will affect the selection of the optimal station restoration strategy. This paper categorizes external interference into three types according to the scope and degree of interference: random interference, range of interference, and intentional interference [29,30,31]. For random interference, this paper randomly selected ten stations using the random number function in MATLAB R2021b, as shown in Figure 9a. In the case of range interference, we identified three flood-prone points in the city and the set the corresponding radius of inundation; this results in ten closed stations, as shown in Figure 9b. To mimic intentional interference, we select the top ten stations ranked by the importance of node degree, network efficiency, and passenger retention rate from the analysis results in Section 4.1 and design three intentional interference scenarios oriented toward violence, as shown in Figure 9c. The serial numbers of damaged nodes included in all interference scenarios are summarized in Table 2.

4.3. Model Solution

Based on field surveys, the following parameters were obtained: the average operation speed of a train is 35 km/h; average renewal time    y s , n t  = 40 s; average transfer time  y h , n t  = 8 min; and magnification factor α = β = 1.6 . To make up for the shortcomings of data scarcity and too much subjectivity, the Delphi method and entropy weighting method are used to determine the subjective and objective weights of passenger flow loss rate and network service efficiency, respectively. Then, the multiplicative synthetic normalization method [32] was applied to couple the subjective and objective weights into a composite weight, and the combined weights of OD passenger flow loss rate and network service efficiency loss rate were 0.5092 and 0.4908, respectively.
For each modeling scenario, the parameters applied for the genetic algorithm were fixed as follows: the population size is 100; the number of iterations is 200; the penalty factor is 2; the crossover probability is 0.9; and the variance probability is 0.01. The iteration results are depicted in Figure 10. It was found that the number of iterations for the five interference scenarios are 51, 67, 47, 59, and 63, respectively, which are below the presupposed maximum number of 200 iterations, indicating that the set parameters converge well and can be applied to solve the integrated toughness optimal recovery model [33].

4.4. Analysis of Results

The network toughness obtained by using comprehensive toughness optimal restoration, random restoration, and importance prioritized restoration strategies under five interference scenarios, respectively, is calculated. This will provide the station restoration order and network toughness for each of the different restoration strategies across the five interference scenarios, as displayed in Table 3.
(1) In five different interference scenarios, the integrated toughness–optimal restoration strategy outperforms the importance-first restoration strategy and the stochastic restoration strategy. The network toughness values for the integrated toughness optimal recovery strategy are 0.8003, 0.8118, 0.8574, 0.9308, and 0.9256, respectively. This results in a reduction in cumulative network performance loss by 7.36%, 11.74%, 8.44%, 2.14%, and 2.75%, respectively, compared to those of the stochastic recovery strategy. This indicates that in the same scenarios, the proposed integrated toughness optimal recovery strategy minimizes the network performance loss.
(2) The differences in network toughness obtained using different recovery strategies under the range interference scenario are minimal, with network toughness values of 0.9308, 0.9113, 0.9110, 0.9285, and 0.9266, and a small fluctuation value of 0.022, respectively. However, under the target interference scenario, significant variations in network toughness are observed, with fluctuation values of 0.114, 0.111, and 0.081. Therefore, careful considerations are necessary when selecting specific recovery strategies for addressing target interference.
(3) In terms of the overall results of the restoration decisions, most of the stations prioritized for restoration are interchange stations with a high passenger flow rate, such as stations 71, 74, 4, 103, 21, and 89.

5. Conclusions and Discussions

The major findings from this research are summarized as follows:
(1) Among the under-five interference scenarios, the comprehensive toughness–optimal restoration strategy proposed in this paper yields the most effective rail transit network restoration, followed by the importance-first restoration strategy, and lastly, the stochastic restoration strategy.
(2) The comprehensive resilient optimal recovery strategy proposed in this paper can significantly minimize the loss of network performance in the target interference scenario.
(3) The priority for the recovery of subway station depends on their passenger flow. Stations with a higher passenger flow experience greater performance degradation after a failure, resulting in more cumulative loss and reduced network resilience. Therefore, interchange stations with higher passenger flow are typically given priority for recovery.
Note that the rail transportation network restoration model presented in this paper does not account for various factors such as the scale of the station in relation to restoration time, resources allocation, the transfer time of the engineering team, and their execution capacity, etc. These issues should be thoroughly investigated in future studies. Meanwhile, the lower-layer model can be considered to establish a balanced distribution model for a more accurate passenger flow allocation study based on a topology consisting of a network of rail transit lines and associated conventional bus lines and urban road networks.
Based on the study of the optimal recovery strategy for comprehensive resilience, it is suggested that urban rail transit operation management should enhance the protection of important nodes of the network in the phase of interference defense to improve the robustness of subway networks. In the performance recovery phase, a recovery strategy decision-making mechanism is established, and the number of external recovery resources is added and rationally allocated to improve the rapidity of site restoration. At the same time, the establishment of urban rail transit network operation managers and emergency management personnel standardized work mechanisms, and then effectively enhanced the whole system to deal with various types of interference resilience recovery levels.

Author Contributions

Conceptualization, M.Z. and H.Z.; data curation, M.Z.; formal analysis, M.Z., H.Z., Z.Z. and Y.B.; investigation, M.Z.; methodology, M.Z., H.Z. and Z.Z.; project administration, M.Z.; software, M.Z., H.Z. and Y.B.; validation, M.Z. and Y.B.; visualization M.Z., H.Z., Z.Z. and Y.B.; writing—original draft, M.Z. and Y.B.; writing—review and editing, M.Z. and Z.Z. All authors have read and agreed to the published version of the manuscript.

Funding

This research received no external funding.

Institutional Review Board Statement

Ethical review and approval were waived for this study due to the studies not involving humans or animals.

Informed Consent Statement

Patient consent was waived due to the studies not involving humans.

Data Availability Statement

The source of all traffic data at the intersection used in this paper is the actual field survey in Dalian, Liaoning Province. The author guarantees the authenticity and reliability of the data used in the validation section.

Conflicts of Interest

The authors declare no conflict of interest.

References

  1. Yang, Q.; Yang, D.; Li, P.; Liang, S.; Zhang, Z. Resilient city: A Bibliometric analysis and visualization. Discret. Dyn. Nat. Soc. 2021, 2021, 5558497. [Google Scholar] [CrossRef]
  2. Chen, Y.; Wang, J.; Jin, F. Robustness of China’s air transport network from 1975 to 2017. Phys. A Stat. Mech. Its Appl. 2020, 539, 122876. [Google Scholar] [CrossRef]
  3. Wang, S.; Chen, C.; Zhang, J.; Gu, X.; Huang, X. Vulnerability assessment of urban road traffic systems based on traffic flow. Int. J. Crit. Infrastruct. Prot. 2022, 38, 100536. [Google Scholar] [CrossRef]
  4. Hong, J.; Tamakloe, R.; Lee, S.; Park, D. Exploring the topological characteristics of complex public transportation networks: Focus on Variations in both single and integrated systems in the Seoul metropolitan area. Sustainability 2019, 11, 5404. [Google Scholar] [CrossRef]
  5. Gao, P.; Hu, J.; Wei, G. Robustness Analysis of Urban Transit Network Based on Complex Network with Varied Weight. Comput. Simul. 2013, 30, 153–156. [Google Scholar] [CrossRef]
  6. Yin, Y.; Huang, W.; Xie, A.; Li, H.; Gong, W.; Zhang, Y. Syncretic K-shell algorithm for node importance identification and invulnerability evaluation of urban rail transit network. Appl. Math. Model. 2023, 120, 400–419. [Google Scholar] [CrossRef]
  7. Yoon, Y.J. Planning of Optimal Rehabilitation Strategies for Infrastructure Using Time Float and Multiyear Prioritization Approach. Ph.D. Thesis, Purdue University, West Lafayette, IN, USA, 2012. [Google Scholar]
  8. Zheng, W.; Hu, J.; Wen, C.; Tang, R. Research on urban rail failure recovery considering network resilience. China Saf. Sci. J. 2023, 33, 179. [Google Scholar] [CrossRef]
  9. Zhang, J.; Ren, G.; Song, J. Resilience-based restoration sequence optimization for metro networks: A case study in China. J. Adv. Transp. 2022, 2022, 8595356. [Google Scholar] [CrossRef]
  10. Zhang, J.; Ren, G.; Ma, J.; Gao, J.; Zhu, X. Decision-making method of repair sequence for metro network based on resilience evaluation. J. Transp. Syst. Eng. Inf. Technol. 2020, 20, 14. [Google Scholar] [CrossRef]
  11. Zhang, Y.; Xu, H.; Lu, Q.-C.; Lin, S.; Song, J. Vulnerability Analysis of Bus Network Based on Land-Use Type of Bus Stops: The Case of Xi’an, China. Sustainability 2023, 15, 12566. [Google Scholar] [CrossRef]
  12. Ma, Z.; Yang, X.; Wu, J.; Chen, A.; Wei, Y.; Gao, Z. Measuring the resilience of an urban rail transit network: A multi-dimensional evaluation model. Transp. Policy 2022, 129, 38–50. [Google Scholar] [CrossRef]
  13. Hosseini, Y.; Mohammadi, R.K.; Yang, T.Y. Resource-based seismic resilience optimization of the blocked urban road network in emergency response phase considering uncertainties. Int. J. Disaster Risk Reduct. 2023, 85, 103496. [Google Scholar] [CrossRef]
  14. Sarhadi, H.; Tulett, D.M.; Verma, M. An analytical approach to the protection planning of a rail intermodal terminal network. Eur. J. Oper. Res. 2017, 257, 511–525. [Google Scholar] [CrossRef]
  15. Starita, S.; Scaparra, M.P. Optimizing dynamic investment decisions for railway systems protection. Eur. J. Oper. Res. 2016, 248, 543–557. [Google Scholar] [CrossRef]
  16. Starita, S.; Scaparra, M.P. Passenger railway network protection: A model with variable post-disruption demand service. J. Oper. Res. Soc. 2018, 69, 603–618. [Google Scholar] [CrossRef]
  17. Zhao, T.; Zhang, Y. Transportation infrastructure restoration optimization considering mobility and accessibility in resilience measures. Transp. Res. Part C Emerg. Technol. 2020, 117, 102700. [Google Scholar] [CrossRef]
  18. Lu, Q.; Liu, P.; Xu, B.; Cui, X. Resilience-based protection decision optimization for metro network under operational incidents. J. Transp. Eng. 2023, 23, 209–220. [Google Scholar] [CrossRef]
  19. von Ferber, C.; Holovatch, T.; Holovatch, Y.; Palchykov, V. Public transport networks: Empirical analysis and modeling. Eur. Phys. J. B 2009, 68, 261–275. [Google Scholar] [CrossRef]
  20. Berche, B.; von Ferber, C.; Holovatch, T.; Holovatch, Y. Public transport networks under random failure and directed attack. Physics 2010, 2, 42–54. [Google Scholar] [CrossRef]
  21. Saadat, Y.; Ayyub, B.M.; Zhang, Y.; Zhang, D.; Huang, H. Resilience of metrorail networks: Quantification with Washington, DC as a case study. ASCE-ASME J. Risk Uncertain. Eng. Syst. Part B Mech. Eng. 2019, 5, 041011. [Google Scholar] [CrossRef]
  22. Cimellaro, G.P.; Renschler, C.; Arendt, L.; Bruneau, M.; Reinhorn, A.M. Community resilience index for road network systems. In Proceedings of the 8th International Conference on Structural Dynamics, Leuven, Belgium, 4–6 July 2011; pp. 370–376. [Google Scholar]
  23. Ma, C.Q.; Zhang, S.; Chen, Q.; Rui, C. Characteristics and Vulnerability of Rail Transit Network based on Perspective of Passenger Flow Characteristics. J. Traffic Transp. Eng. 2020, 20, 208–216. [Google Scholar] [CrossRef]
  24. Bruneau, M.; Chang, S.E.; Eguchi, R.T.; Lee, G.C.; O’Rourke, T.D.; Reinhorn, A.M.; Shinozuka, M.; Tierney, K.; Wallace, W.A.; Von Winterfeldt, D. A Framework to Quantitatively Assess and Enhance the Seismic Resilience of Communities. Earthq. Spectra 2003, 19, 733–752. [Google Scholar] [CrossRef]
  25. Nan, C.; Sansavini, G. A quantitative method for assessing resilience of interdependent infrastructures. Reliab. Eng. Syst. Saf. 2017, 157, 35–53. [Google Scholar] [CrossRef]
  26. Ouyang, M.; Dueñas-Osorio, L.; Min, X. A three-stage resilience analysis framework for urban infrastructure systems. Struct. Saf. 2012, 36/37, 23–31. [Google Scholar] [CrossRef]
  27. Wardrop, J.G. Some theoretical aspects of road traffic research. Proc. Inst. Civ. Eng. 1952, 1, 325–362. [Google Scholar] [CrossRef]
  28. Zhang, D.-M.; Du, F.; Huang, H.; Zhang, F.; Ayyub, B.M.; Beer, M. Resiliency assessment of urban rail transit networks: Shanghai metro as an example. Saf. Sci. 2018, 106, 230–243. [Google Scholar] [CrossRef]
  29. Chen, J.Q.; Zuo, T.; Zhu, M.; Peng, Q.; Yin, Y. Repair strategies for a damaged urban rail transit network. J. Saf. Environ. 2022, 22, 316–323. [Google Scholar] [CrossRef]
  30. Dui, H.; Zheng, X.; Wu, S. Resilience analysis of maritime transportation systems based on importance measures. Reliab. Eng. Syst. Saf. 2021, 209, 107461. [Google Scholar] [CrossRef]
  31. Baroud, H.; Barker, K.; Ramirez-Marquez, J.E. Importance measures for inland waterway network resilience. Transp. Res. Part E Logist. Transp. Rev. 2014, 62, 55–67. [Google Scholar] [CrossRef]
  32. Chen, G.F.; Wei, H. Tunnel gas risk assessment based on EW-AHP and unascertained measurement theory. Nonferrous Met. Sci. Eng. 2021, 12, 89–95. [Google Scholar] [CrossRef]
  33. Henry, D.; Ramirez-Marquez, J.E. Generic metrics and quantitative approaches for system resilience as a function of time. Reliab. Eng. Syst. Saf. 2012, 99, 114–122. [Google Scholar] [CrossRef]
Figure 1. Modeling methods for urban rail transportation networks. (a) Actual urban rail transit network. (b) Space-L modeling. (c) Space-P modeling. (d) Space-B modeling. (e) Space-C modeling.
Sustainability 15 15018 g001
Figure 2. Performance change curve of urban rail transit network.
Sustainability 15 15018 g002
Figure 3. Passenger route selection under the influence of interference.
Sustainability 15 15018 g003
Figure 4. Flowchart of the algorithm for the bi-level programming model.
Sustainability 15 15018 g004
Figure 5. Topological structure of a city’s rail transit network.
Sustainability 15 15018 g005
Figure 6. Degree distribution of the rail transit network in the case study city.
Sustainability 15 15018 g006
Figure 7. Trends in network efficiency changes.
Sustainability 15 15018 g007
Figure 8. Trends in passenger retention.
Sustainability 15 15018 g008
Figure 9. Schematic diagram of different scenarios of urban rail transit interference in a city. (a) Schematic diagram of random interference. (b) Schematic of range interference. (c) Schematic diagram of intentional interference.
Sustainability 15 15018 g009
Figure 10. Convergence curves of the genetic algorithm. (a) Scenario 1. (b) Scenario 2. (c) Scenario 3. (d) Scenario 4. (e) Scenario 5.
Sustainability 15 15018 g010
Table 1. Statistical of the top 10 rail transit networks in the study city.
Ordered ListNetwork Efficiency RankingPassenger Retention Ranking
NodesDegreeNodesNetwork EfficiencyNodesPatronage Retention Rate
118710.0877710.8582
495770.0883700.8826
215700.0893690.8905
1204380.0893680.9024
1034210.08941090.9161
944690.0900890.9184
924230.0903670.9231
894430.0903660.9293
8241480.0903880.9294
814370.090530.9307
Table 2. Node numbers for specific target interference.
Type of
Interference
Interference MethodNode Number
Target InterferenceDegree11 49 21 120 103 94 92 89 82 81
Network Efficiency71 77 70 38 21 69 23 43 148 37
Patronage Retention Rate71 70 69 68 109 89 67 66 88 3
Range InterferenceWaterlogged4 53 70 71 72 113 148 162 163 164
Random InterferenceRandomized function5 6 47 64 74 78 126 128 131 164
Table 3. Station restoration sequence and network resilience under various recovery strategies in different interference conditions.
ScenarioRecovery StrategyStation Restoration SequenceNetwork Resilience
Target InterferenceInterference based on DegreeIntegrated Resilient Optimal Recovery11 103 89 92 21 94 82 81 49 1200.800318428
Randomized Recovery103 81 11 120 89 94 92 49 21 820.74546206
Criticality-Based Prioritized Recovery StrategyBased On Degree11 49 21 120 103 94 92 89 82 810.773513976
Based On Network Efficiency21 11 89 92 103 49 82 120 94 810.794944533
Based On The Degree Of Traffic Loss89 103 21 82 94 49 92 11 120 810.712920272
Interference based on Network Efficiency Integrated Resilient Optimal Recovery21 23 71 77 69 70 148 43 37 380.811797298
Randomized Recovery69 71 23 38 148 21 43 70 37 770.726484518
Criticality-Based Prioritized Recovery StrategyBased On Degree21 23 38 43 71 77 37 69 70 1480.802326971
Based On Network Efficiency71 77 70 38 21 69 23 43 148 370.739769381
Based On The Degree Of Traffic Loss71 70 69 23 38 21 37 77 148 430.772879502
Interference based on Patronage RetentionIntegrated Resilient Optimal Recovery71 3 88 89 109 70 69 67 66 680.857429135
Randomized Recovery88 71 66 68 69 70 67 89 109 30.790675767
Criticality-Based Prioritized Recovery StrategyBased On Degree71 89 3 66 67 68 69 70 88 1090.818073808
Based On Network Efficiency71 70 69 89 68 3 103 67 66 880.816691631
Based On The Degree Of Traffic Loss71 70 69 68 109 89 67 66 88 30.815236679
Range InterferenceWaterloggedIntegrated Resilient Optimal Recovery71 70 148 4 113 53 72 162 163 1640.930825361
Randomized Recovery4 148 71 53 70 113 164 163 72 1620.911348662
Criticality-Based Prioritized Recovery StrategyBased On Degree4 71 70 113 53 163 162 72 148 1640.911008611
Based On Network Efficiency71 70 148 4 113 53 163 162 72 1640.928465347
Based On The Degree Of Traffic Loss71 70 4 148 72 162 113 53 163 1640.926634499
Random InterferenceRandomized FunctionIntegrated Resilient Optimal Recovery64 74 78 47 131 5 6 128 164 1260.925559653
Randomized Recovery131 6 78 74 5 47 128 164 64 1260.900800084
Criticality-Based Prioritized Recovery StrategyBased On Degree74 47 78 64 131 5 6 128 126 1640.921360873
Based On Network Efficiency74 47 131 64 78 126 5 6 128 1640.921035007
Based On The Degree Of Traffic Loss64 6 47 128 74 5 78 131 126 1640.921597407
Disclaimer/Publisher’s Note: The statements, opinions and data contained in all publications are solely those of the individual author(s) and contributor(s) and not of MDPI and/or the editor(s). MDPI and/or the editor(s) disclaim responsibility for any injury to people or property resulting from any ideas, methods, instructions or products referred to in the content.

