Article

Dynamic Spatiotemporal Land Use Evolution in China’s Plateau Lake Basins in Response to Landscape Ecological Sensitivity

1
College of Landscape Architecture and Horticulture Science, Southwest Forestry University, Kunming 650224, China
2
Southwest Landscape Engineering & Technology Center of National Forestry and Grassland Administration, Kunming 650224, China
*
Author to whom correspondence should be addressed.
Sustainability 2023, 15(20), 15020; https://doi.org/10.3390/su152015020
Submission received: 4 September 2023 / Revised: 14 October 2023 / Accepted: 16 October 2023 / Published: 18 October 2023

Abstract

:
Ecological sensitivity measures an ecosystem’s reaction and restoration difficulty to exogenous disturbances. Regional ecological and environmental challenges can be identified using ecological sensitivity evaluation. The regional characteristics and environmental challenges of plateau lakes were quantified to create four assessment indexes: landform, natural conditions, human activities, and ecological security. Eleven ecologically sensitive characteristics were chosen. We evaluated the landscape ecological sensitivity of the Erhai Lake Basin, China, using ArcGIS and the analytical hierarchy process (AHP). The results showed that the Erhai Lake Basin was mostly forest from 1990 to 2020 and that the dynamic land-use attitude increased and then reduced. The cultivated land became mostly woods and grassland. The largest building area was tied to reverting farms to woods and urban construction. The highest weight was from single-factor ecologically sensitive vegetation covering, followed by river systems and roadways, and lowest was from landslides and collapses. The ecologically sensitive areas with more vegetation and a greater distance from roads and woodland are harder to recover from harm. According to the thorough sensitivity analysis, the study region’s high sensitivity area is 1102.36 km2 (26.16%) and the higher sensitivity area is 1177.10 km2 (27.93%). The ecological sensitivity increases from neighborhoods to nature reserves. High-sensitivity areas were in hilly woods and grasslands with few people. The low-sensitivity area was around water and homes. The dynamic stability of the area ecological environment influenced ecological sensitivity. This study aims to provide sustainable land use solutions for the Erhai Lake Basin and a scientific basis for managing and protecting ecologically vulnerable areas.

1. Introduction

A river basin bears the development of human civilization; it is the origin of human settlements. It gradually forms a composite ecosystem where people and nature live together [1]. Plateau lakes are the primary water source for human production and life in a basin. They have a remarkable ecological value, with rich natural resources [2]. Their close interrelation with local climate regulation, water provisioning, maintenance of biodiversity, and other ecological functions establishes a profound connection [3]. They are essential for local social, economic, and cultural development [4]. With continuous developments in climate change and tourism, the contradiction between man and land has intensified. The high-altitude environment’s restrictions on the relatively enclosed nature of the highland lake ecosystems, which results in a limited supply of land for urban construction and insufficient natural habitats, which are the main manifestations of this [5]. The rapid pace of economic development exacerbates lake pollution and ecological degradation, bringing about profound alterations to the ecological and environmental foundation of highland lake basins, particularly at the Erhai Lake Basin [6,7].
Ecological sensitivity refers to the degree of ecological systems under the influence of human activities and the natural environment in a specific area [8]. This can reflect the possibility of ecological environment destruction and the difficulty of restoration in a region [9]. Ecological sensitivity is one of the crucial indicators characterizing the ecological security of an area [10]. It plays an essential role in guidance for the protection of ecological environments as well as for the spatial planning of an area [11]. Many scholars have studied ecological sensitivity based on land-use evolution; the origins of relevant research trace back to earlier within international contexts, accompanied by a higher degree of methodological maturity. A geographic information system was first introduced to analyze the ecological sensitivity of a study area [12]. This mainly focused on the influence of large-scale internal and external environmental changes on a single ecological issue [13,14], including the ecological sensitivity of ecosystems under natural conditions such as climate [15], soil [16], and landforms [17] as well as the selective felling of trees, climate change, hydrological ecosystems, and wetlands [18,19]. There are two main aspects to an ecological sensitivity analysis in China. One is the evaluation of ecological sensitivity of a single factor in the ecosystem of a study area. This includes the study of environmental issues such as soil erosion, soil salinization, acid rain, and geological hazards [20,21,22,23]. The other pays attention to the comprehensive assessment of ecological sensitivity in a specific area, guiding the layout planning of urban land use. The research scope can be at a national level, covering areas such as provinces, river basins, cities, counties, scenic spots, and villages [24,25,26]. The research methods mainly involve traditional analytical methods such as AHP, principal component analysis, expert scoring, and the maximum value method [27,28,29]. Scholars such as Sun Linlin conducted an ecological sensitivity assessment of the Yellow River Scenic Area in Zhengzhou from four aspects, namely topography and geomorphology, natural environment, scenic resources, and human activities, providing references for ecological protection and high-quality development of the scenic area [30]. Wu Cuicui used an “adapt to local conditions” evaluation model and a multi-factor perspective to find out how sensitive the ecological environment is in the Yellow River Basin. He then made strategic suggestions for building an ecological civilization based on these findings [31]. Although research on ecological sensitivity is developing rapidly, limitations remain regarding the index selection and research methods; these cannot comprehensively reflect an ecological sensitivity assessment in a study area [32]. The Analytic Hierarchy Process (AHP) is the most commonly used and reliable method in ecological sensitivity research to determine the weights of selected indicators and thereby determine the relative importance of this factor in comprehensive evaluation [33]. AHP is a hierarchical and structured decision-making method proposed by American operations researcher T.L. Saaty in the 1970s to analyze the multi-indicator systems of a plan [34].
In recent years, many scholars have evaluated regional ecological sensitivity based on land use patterns. For example, Lin Rongqing took the middle route of the South-to-North Water Diversion Project as the study area, selected human and natural factors to establish an ecological sensitivity index system, and studied the problems and causes of the ecological environment in the middle route of the South-to-North Water Diversion Project through single-factor and comprehensive ecological sensitivity evaluations [35]. Ma Lingxiao et al. analyzed the degree of matching between land use function and ecological sensitivity in the Qingdao West Coast New Area [36]. Jing Ying used GIS 10.8 software to divide the ecological sensitivity of Lanzhou New Area, analyzed the land ecological function zoning combined with land carrying capacity, and put forward specific land use suggestions according to the ecological function zoning of Lanzhou New Area [37]. Hao Shouning et al. explored and analyzed the ecological sensitivity of the Nyang River Basin in Tibet under the influence of land use changes from 1995 to 2020, providing a theoretical basis for land use planning and ecological environmental protection in this basin [38].
The Erhai Basin is located in the central part of Dali Prefecture, Yunnan Province, China, running through the territories of Dali City and Erhai County. Erhai Lake is the second-largest plateau lake in Yunnan. It has seven main functions: water supply, agricultural irrigation, power generation, climate regulation, fishery, shipping, and tourism [39]. Erhai Lake Basin is located at the Lancang River, Jinsha River, and Yuanjiang River watershed. It is at the junction of the Qinghai–Tibet Plateau and Yunnan–Guizhou Plateau. It is an integral part of the Loess Plateau–Sichuan–Yunnan ecological barrier in China and forms two ecological protective barriers, three ecozones, one region, and multiple points for a national ecological security barrier system. It is also a national treasure-house of biodiversity [40]. It is responsible for the building of ecological security barriers in the western plateau of the Yangtze River Basin. The Erhai Basin is also an ecologically sensitive and fragile area. In recent years, environmental problems such as eutrophication and deterioration of water quality in Erhai Lake have become prominent, and the destruction of the ecosystem in the lakeside zone is extremely serious. Therefore, it is urgent and necessary to carry out research on land use change and ecological sensitivity in the Erhai Basin. Presently, research concerning ecological sensitivity predominantly focuses on the scale of major river basins, with limited attention directed towards highland lake basins [5]. Moreover, there is a notable emphasis on water quality variations, while in-depth investigations into the intricate interplay between lakes, ecosystems, and human habitats remain insufficient [41]. Given the heightened vulnerability of Lake Erhai, approaching the issue from a landscape perspective and conducting an ecological sensitivity analysis to unveil the degree of sensitivity with which ecosystems within highland lake basins respond to natural and anthropogenic factors represents an area that requires further refinement. This avenue of research not only serves as a focal point for ecological conservation and restoration, but also stands as a critical trajectory urgently awaiting exploration by experts and scholars.
To learn more about how ecosystems in ecologically fragile areas respond to disturbances from the outside and how hard it is to fix them, it is important to find out how ecologically sensitive zones are spread out in the basin [42]. This effort not only facilitates the presentation of such features, but also furnishes essential groundwork for the formulation of judicious planning and protective measures. Using the Erhai Lake Basin as the study area, we selected Landsat series image data of the Erhai Lake Basin from 1990 to 2020, based on Google Earth Engine (GEE), and analyzed the spatial evolution characteristics of land use at the Erhai Lake Basin for 30 years. Combined with the spatial analysis methods of ArcGIS 10.8 software and an AHP [43], eleven factors from four aspects (landform, natural conditions, human activities, and ecological security) were selected to perform an ecological sensitivity assessment of this area. This research is of significance for the provision of ecological restoration strategies for plateau-lake basins, promoting the sustainable development of land use and protecting the ecological environment of the Erhai Lake Basin.

2. Study Area and Data Source

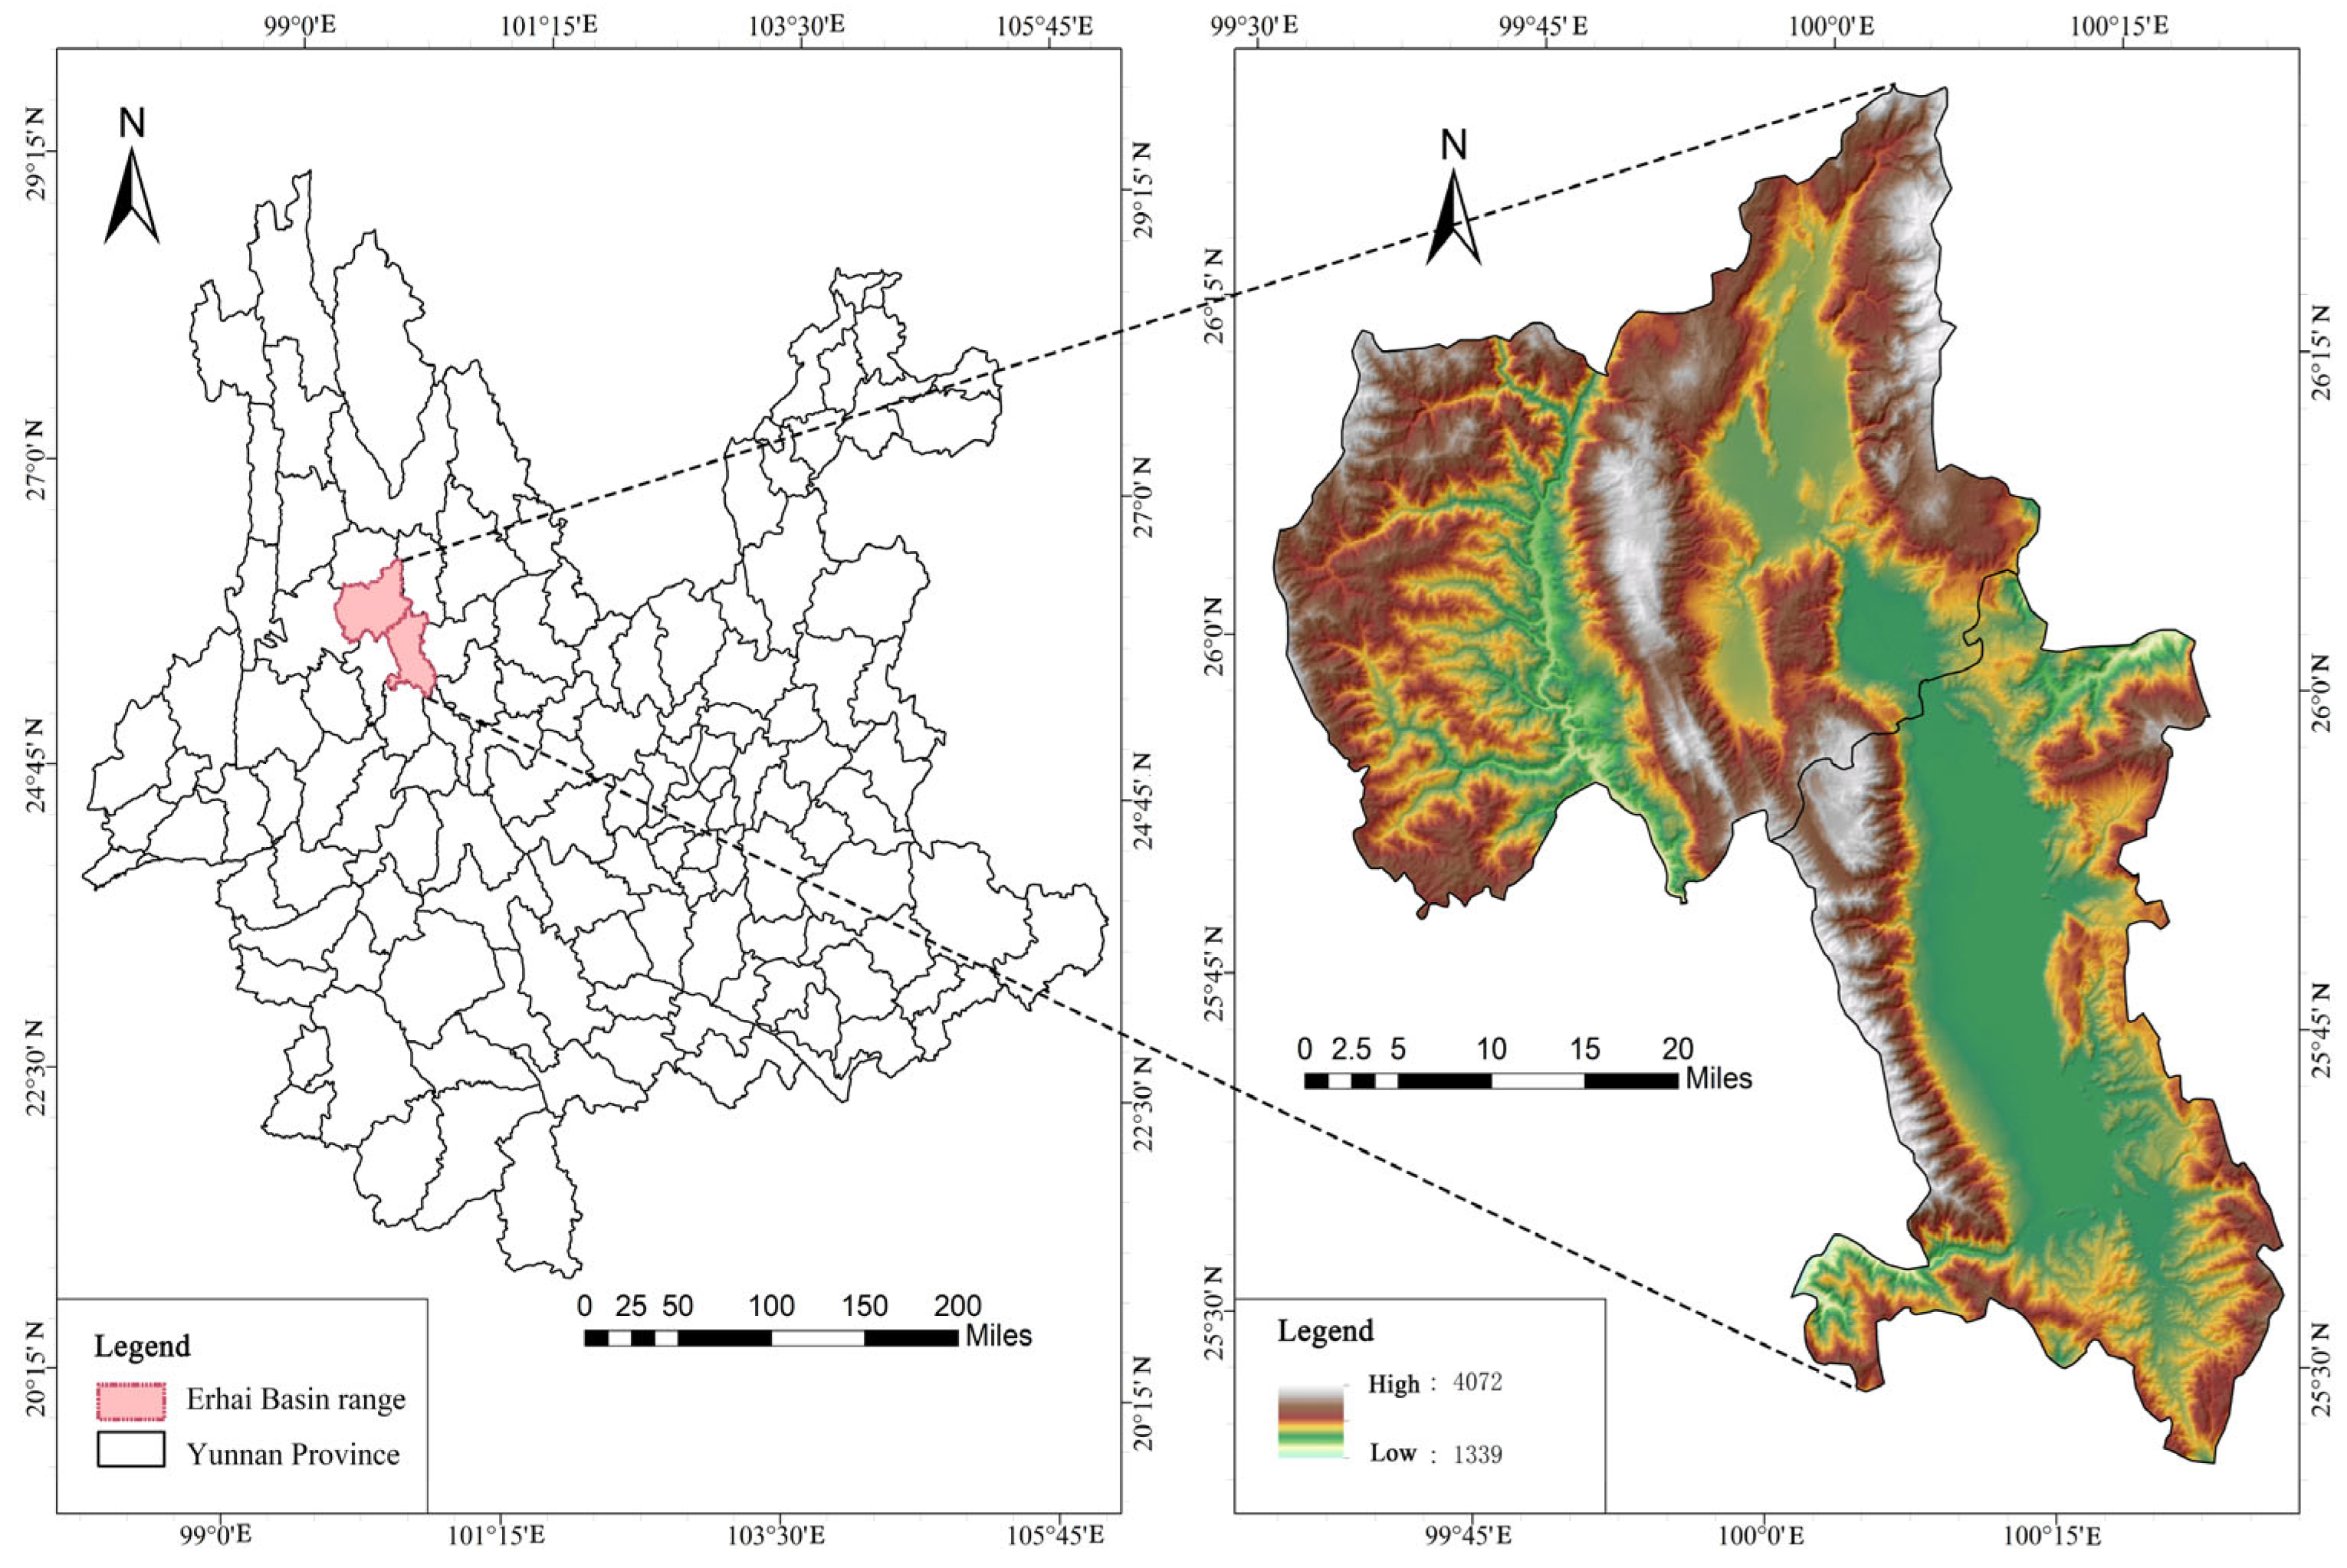
2.1. Overview of the Study Area

Erhai Lake (100°05′ E 100°17′ E, 26°36′ N 26°58′ N) is located in the Bai Autonomous Prefecture, Dali City, Yunnan Province, China. The north bank links Eryuan County, the east foot of Cangshan Mountain, and the west foot of Yuan Mountain. The Erhai Lake Basin, with a total area of 2565 km2, belongs to the Lancang River Basin, which has a mild climate and abundant rainfall. The annual average temperature is 15.7 °C, the lake is ice-free all year round, and the annual average precipitation is 1000–12,000 mm. In 1994, the Cangshan and Erhai Nature Reserves were promoted to national protected areas. Erhai Lake has many plants, high vegetation coverage, a rich biodiversity, obvious location advantages, and is rich in history and culture; factors that are essential for the politics, economy, and culture of Dali. The total study area was 4254.91 km2 (Figure 1).

2.2. Data Source and Processing

Erhai Lake Basin was the research study area. Since the reform and opening up, China has experienced the largest and fastest urbanization process in world history. With the improvement in people’s economic strength, the scale of cities has continuously expanded, the economic strength of cities has continuously increased, and the urban landscape has been completely renewed. In the past 30 years, due to the continuous improvement of domestic information systems, land use raw data from 1990, 2000, 2010, and 2020 were selected with a time interval of 10 years. The land use data is sourced from the Resource and Environment Science Data Centre of the Chinese Academy of Sciences (http://www.resdc.cn/ (accessed on 3 September 2023)). This dataset was made by manually looking at Landsat 8 remote sensing images and figuring out what they showed. For the first-level ecosystem types, the overall accuracy of the evaluation was over 94.3% [44,45]. Considering the complexity of the secondary classification system data, as well as the relatively single ecosystem types at the regional scale, this paper reclassifies it into six major categories: woodland, grassland, cultivated land, water area, built-up land, and unutilized land, in accordance with the land use cover change (LUCC) classification system. The data of residential areas, traffic, and water systems were downloaded from the website of the National Geographic Information Resources Directory Service System (http://www.webmap.cn/ (accessed on 3 September 2023)).
For the data processing, the basin range as well as the grid and DEM data of land-use types were extracted. An accuracy of 30 m was obtained by cutting. ArcGIS 10.8 software was used to process and analyze the DEM data; ENVI 15.6 software was then used to process the Landsat 8 satellite remote-sensing images (e.g., cutting, radiometric calibration, atmospheric corrections, and multi-spectral fusion) to obtain the vegetation coverage data of the Erhai Lake Basin, also with an accuracy of 30 m.

3. Methods

The spatial distribution framework of ecological sensitivity in the Erhai Lake Basin is constructed as follows: (1) The characteristics of land use change. The land use situation and dynamic change characteristics of Erhai Lake Basin in 1990, 2000, 2010, and 2020 were statistically analyzed by ArcGIS 10.8 software, and the land use transfer matrix, single land use dynamic degree, and comprehensive land use dynamic degree were constructed to measure the characteristics of land use change in the Erhai Lake Basin. (2) Construction of a landscape ecological sensitivity evaluation index system. Eleven indicators are selected from four aspects of topography, natural environment, human activities, and ecological security as ecological sensitivity evaluation factors to construct a comprehensive evaluation index of landscape ecological sensitivity in the De’ang Ethnic Township. (3) Determination of evaluation index weight The AHP analytic hierarchy process is used to calculate the single-factor evaluation index weight of the study area with the help of Yaahp 10.3 software. (4) Single-factor and multi-factor evaluation of ecological sensitivity. Based on the single-factor grading standard, the ecological sensitivity single-factor evaluation index is quantized in ArcGIS 10.8 software. The weighted overlay method is used to weightedly sum the single-factor index of ecological sensitivity and its weight, calculate the comprehensive score of ecological sensitivity in the Erhai Lake Basin through a calculator, and draw a comprehensive evaluation map.

3.1. Land-Use Dynamic Attitude

There are single land-use dynamic attitudes (L) and comprehensive land-use dynamic attitudes (Lc). The single land-use dynamic attitude reflects the speed and amplitude of single land-use-type changes for a specific time range [36]. The comprehensive land-use dynamic attitude reflects the overall change in all land-use types in a studied research area for a specific time range. The formulas are as follows:
L = U b U a U a × 1 T × 100
L c = i = 1 n L i j L u i × 1 T × 100 %
where L is the single land-use dynamic attitude; Ua and Ub are the areas of land-use types at the initial and final stages of the study, respectively; T is the time range of the study (year); Lc is the comprehensive land-use dynamic attitude; Lui is the area of land-use-type i at the initial stage of the study; and Lij is the absolute value of the area of land-use-type i transformed into non-type i land use during the study period [46].

3.2. Land-Use Transfer Matrix

The land-use transfer matrix intuitively describes the direction and change characteristics of land-use category transfers, reflecting the conversion relationship between different land-use categories [47]. The formula is as follows:
A i j = A 11 A 12 A 21         A 1 n A 2 n A n 1 A n 2         A n n  
where A represents the land area, Aij represents the area before the transfer of class i land into class j land, and n is the number of land-use types.

3.3. Land-Use Changes

The degree of land use indicates the comprehensive level of land use in a study area, as well as the breadth and depth of land resource utilization [48]. It is usually represented by a hierarchical assignment according to different classes. The formula is as follows:
K = 100 × i = 1 n A i × C i  
where K is the comprehensive index of land use in the study area, Ai is the i-th level land-use classification index, and Ci is the percentage of the i-th level land-use classification area. In this study, the land-use types were divided into four grades. Unutilized land was assigned the first grade; woodland, grassland, and water were assigned the second grade; cultivated land was assigned the third grade; and construction land was assigned the fourth grade. Thus, the Ai values were 1, 2, 3, and 4, respectively.

3.4. Ecological Sensitivity Assessment

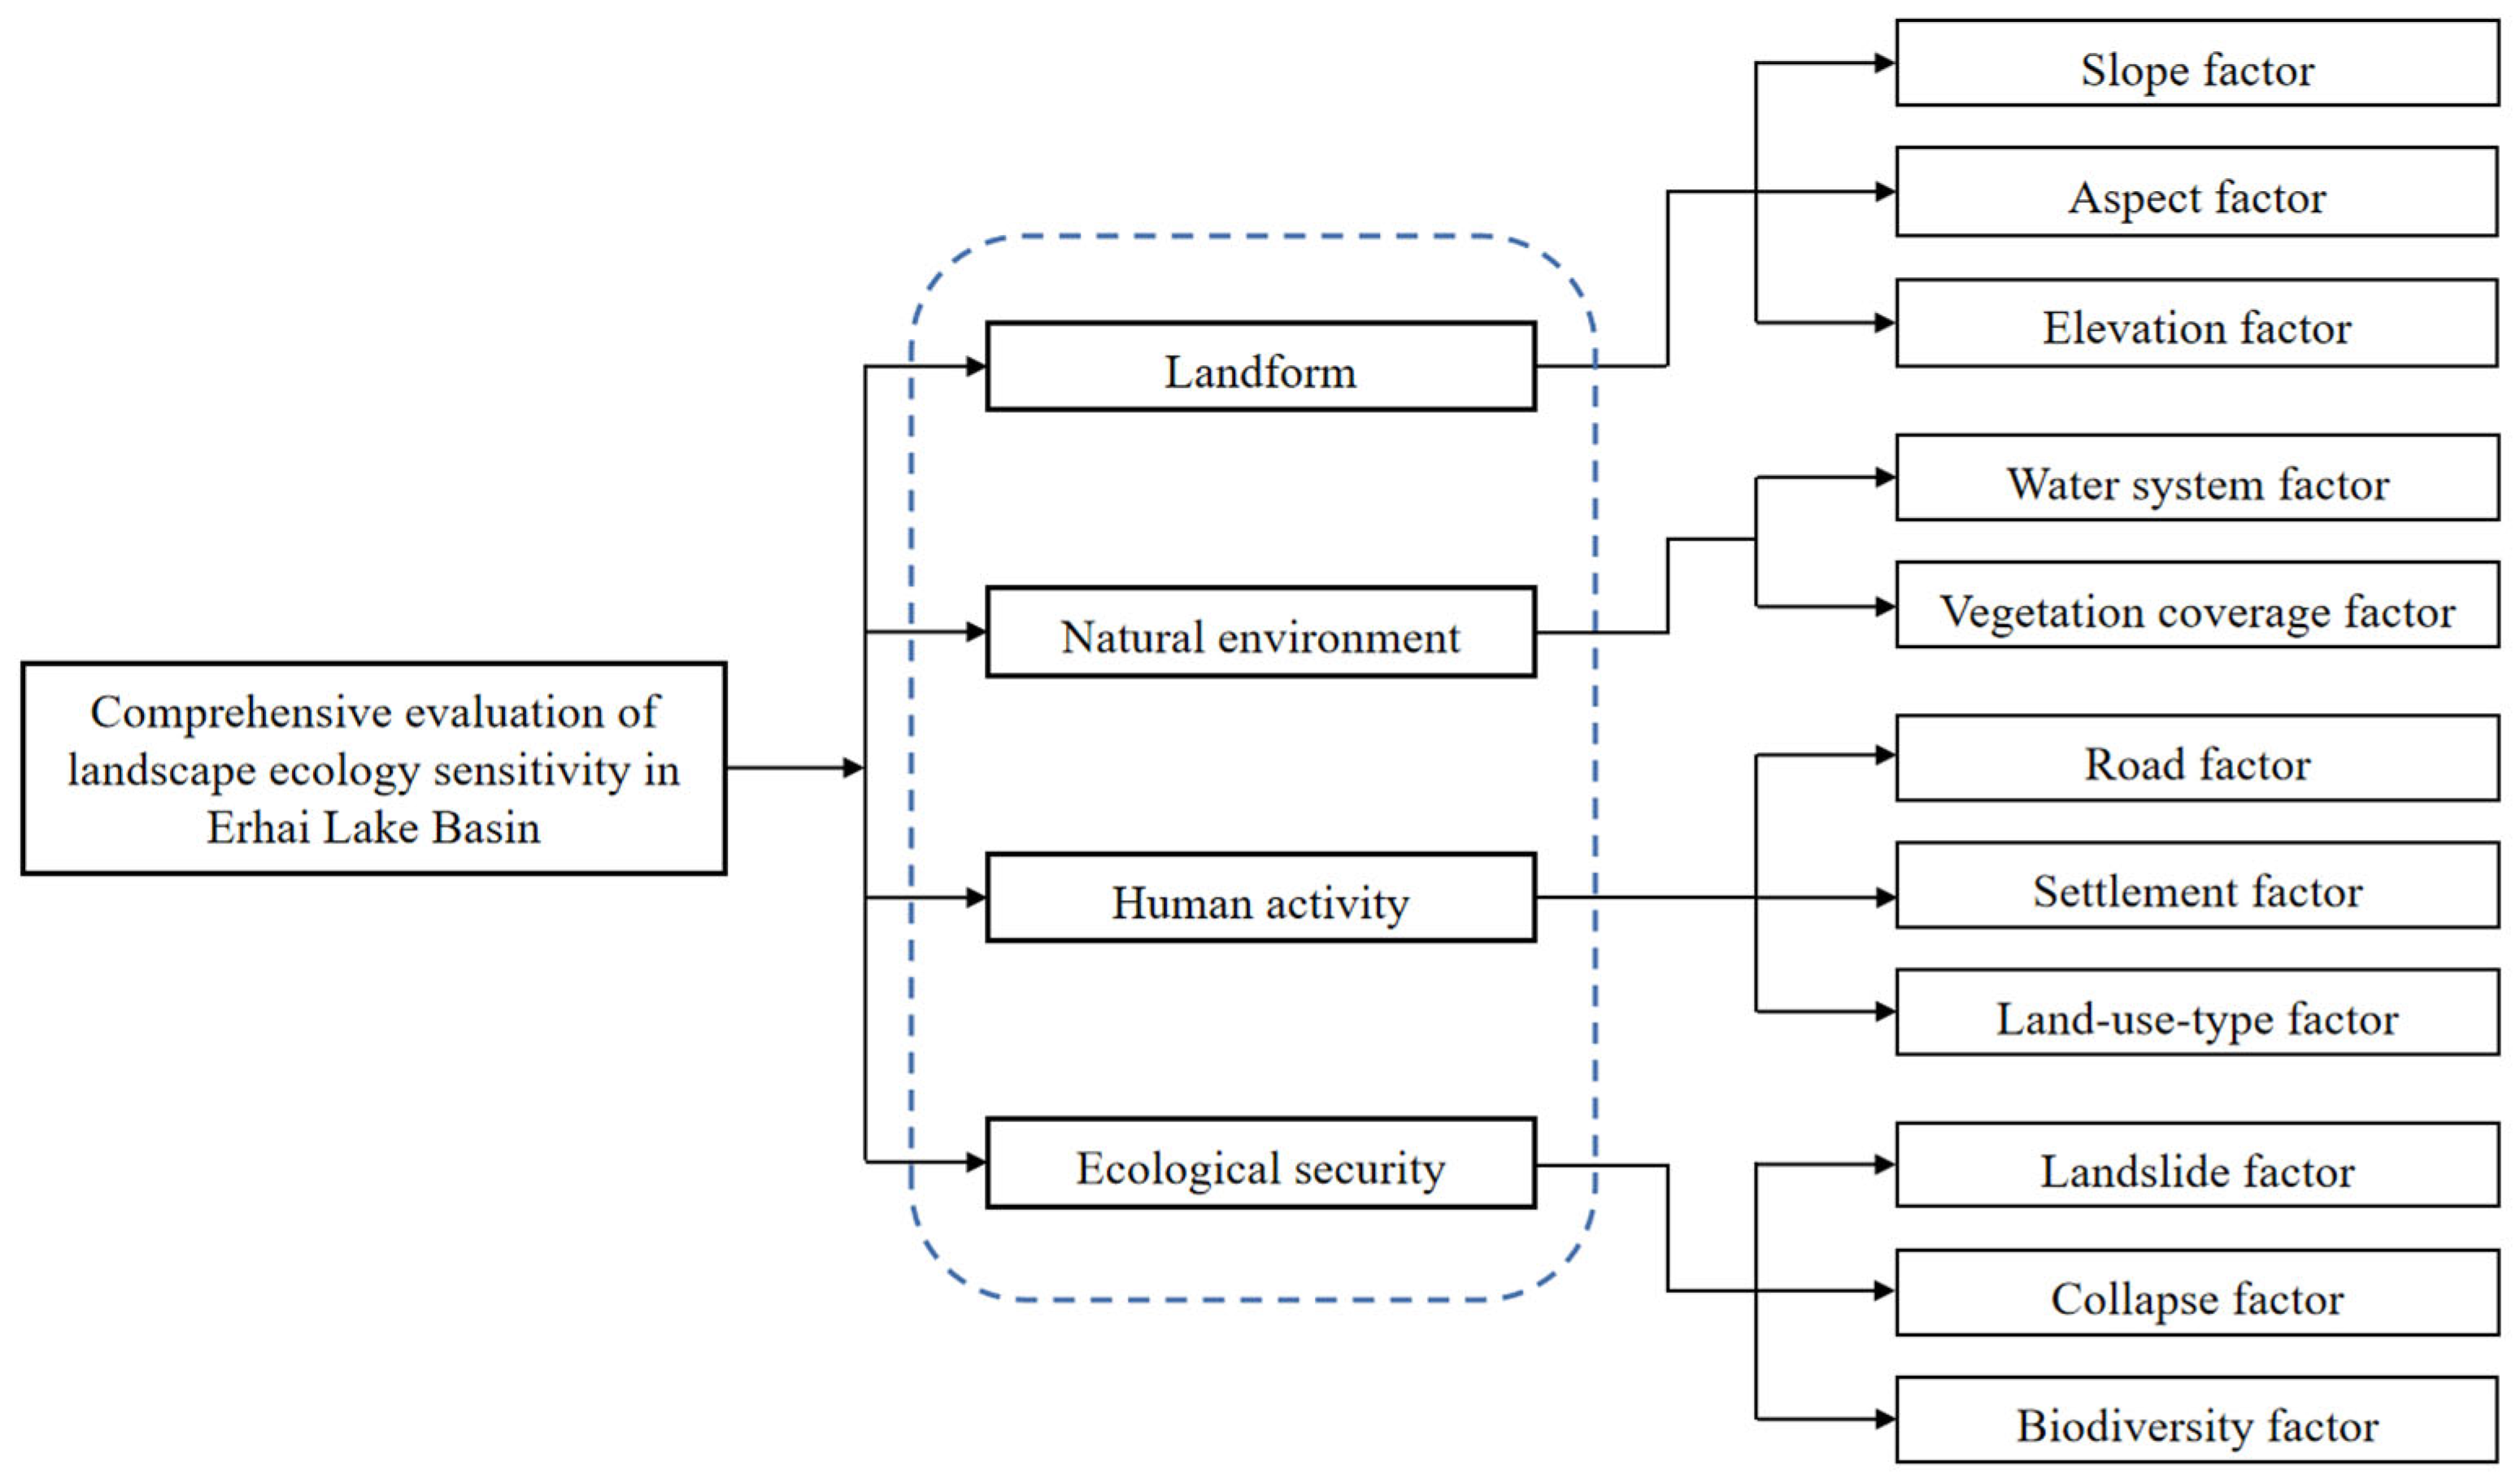
3.4.1. Selection of Influencing Factors

The actual investigation of the Erhai Basin in Dali was based on the research of Chinese scholars Sun Linlin [30], Wu Boyang [49], Hu Xiwu [31], Wu Cuicui [50], Zhang Bao [51], and Weng Jiali [52] on the construction and classification standards of regional ecological sensitivity evaluation indicators. These were based on the characteristics of the research area and data availability, including landform, natural conditions, human activities, and ecological security (four criteria levels of consideration) [53]. The study included 11 indicators (slope, aspect, water system, vegetation coverage, roads, residential points, land-use type, landslides, collapse, and biodiversity) as ecologically sensitive assessment factors to build a landscape eco-sensitivity evaluation indicator system suitable for the research area (Figure 2).

3.4.2. Determination of the Weights of Influencing Factors

The weight value of every single factor was established according to the AHP method. The assessment factors were compared with each other in combination with an expert scoring method to determine the weight of each assessment factor [54]. Five numbers (1, 3, 5, 7, and 9) were used to represent five importance indicators (equally important, slightly important, relatively important, fundamental, and significant, respectively) [55]. Expert scoring determined the importance of the assessment factors in the ecological environment and a judgment matrix was constructed. After a consistency test, the weights of the 11 assessment factors were finally obtained. A comprehensive distribution map of ecological sensitivity in the study area was obtained by summing the single-factor index of ecological sensitivity with the weighted sum.
C i = i = 1 m S k m  
where Ci represents the sensitivity factor index of a spatial unit to the i-th item, m is the number of indicators of the i-th factor, and Sk is the spatial sensitivity distribution of the k-th indicator.

3.4.3. Establishment of the Judgment Matrix

The weighting value of each single factor was established according to an AHP. In combination with the expert grading method, the evaluation factors were compared to determine their various weights. We assumed that the standard layer element was X and the index factors of the corresponding scheme layers were x1, x2, x3, x4xn. We then compared the factors x1 and x2, x1, and x3, as shown in Table 1. We divided the importance degree from 1 to 9. The greater the value, the higher the importance. The results are shown in Table 2. We then standardized the judgment matrix, as shown in Formula (6).
X = x 1 / x 1 x 1 / x 2 x 2 / x 1 x 2 / x 2         x 1 / x n x 2 / x n x n / x 1 x n / x 2         x n / x n X = 1 x 12 x 21 1         x 1 n x 2 n x n 1 x n 1         1 1  

3.4.4. Weighted Overlay Analysis

A weighted overlay analysis is a standard method for a GIS spatial analysis. This method calculates the weight of each assessment factor based on the analytic hierarchy process and then performs a weighted superposition analysis. First, the vector map of the assessment factors was rasterized and the raster data were reclassified according to the assessment grade. The weights of each assessment factor were then weighted and superimposed using the raster calculator in ArcGIS 10.8 software. A comprehensive analysis map of the ecological sensitivity of the Deang Township at Santai Mountain was obtained. The formula used was as follows:
P i = m = 1 n B m × D i ( m )
where Pi represents the total ecological sensitivity value of the i-th assessment unit; m and i represent the assessment factor and assessment unit, respectively; n represents the total number of assessment factors; Bm represents the weight of the m-th assessment factor; and Di(m) represents the assessment value of the ecological sensitivity of the m assessment factors in the i-th assessment unit.

4. Results and Analysis

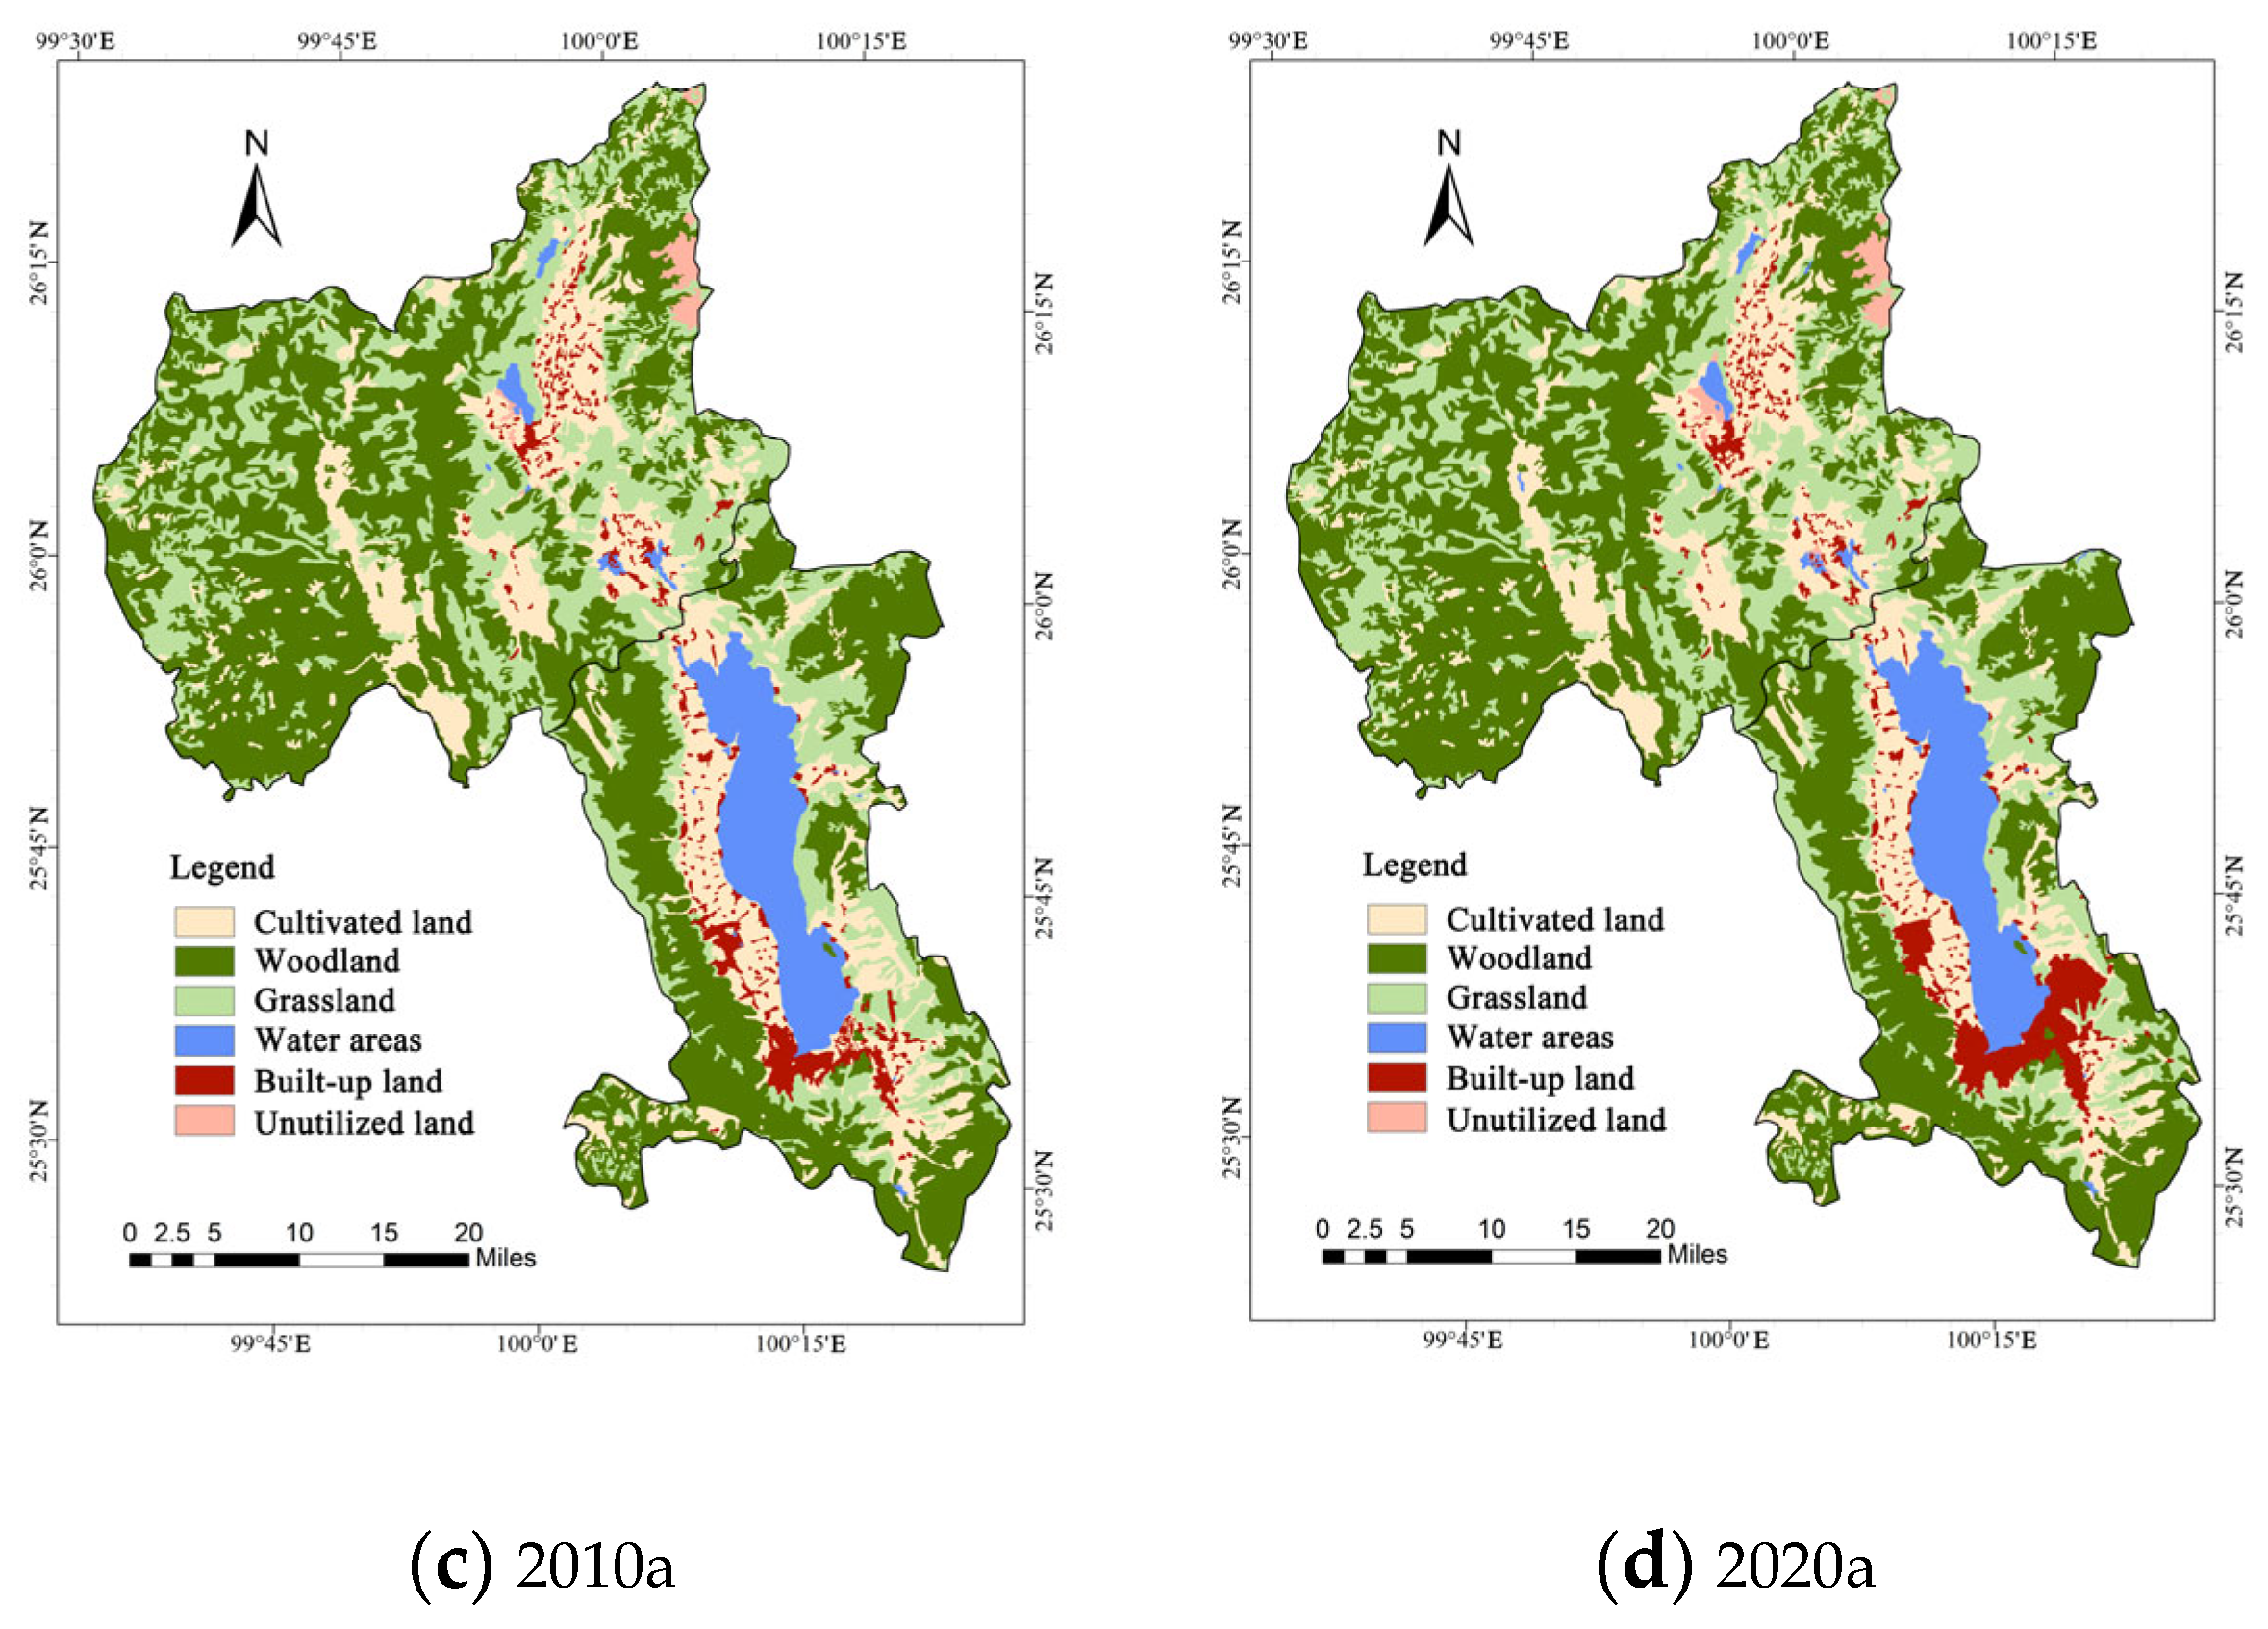
4.1. Analysis of Land-Use Change

4.1.1. Temporal and Spatial Dynamics of Land Use

According to the four remote-sensing images, the land-use situation of the Erhai Lake Basin in the 30 years from 1990 to 2020 was obtained (Figure 3). From the spatial distribution of the land use, we observed that the Erhai Lake Basin was mainly forested and widely distributed in the mountainous area on the west and the southernmost side. The overall trend in land utilization within this basin follows a pattern of three increases, two decreases, and one remaining unchanged. Specifically, there is an upward trend in the total changes observed in woodland, built-up land, and unutilized land, while a decline is noted in cultivated land and grassland. The water area remained unchanged; it was mainly distributed in Erhai Lake in the south of the study area and Chibi Lake in Eryuan County. The cultivated land and grassland area decreased, mainly in the plain area on the west side and upstream of Erhai Lake. The areas of woodland, built-up land, and unutilized land increased. The built-up land was distributed around the water area and concentrated in the south of Erhai Lake, along with a minor proportion of unutilized land.

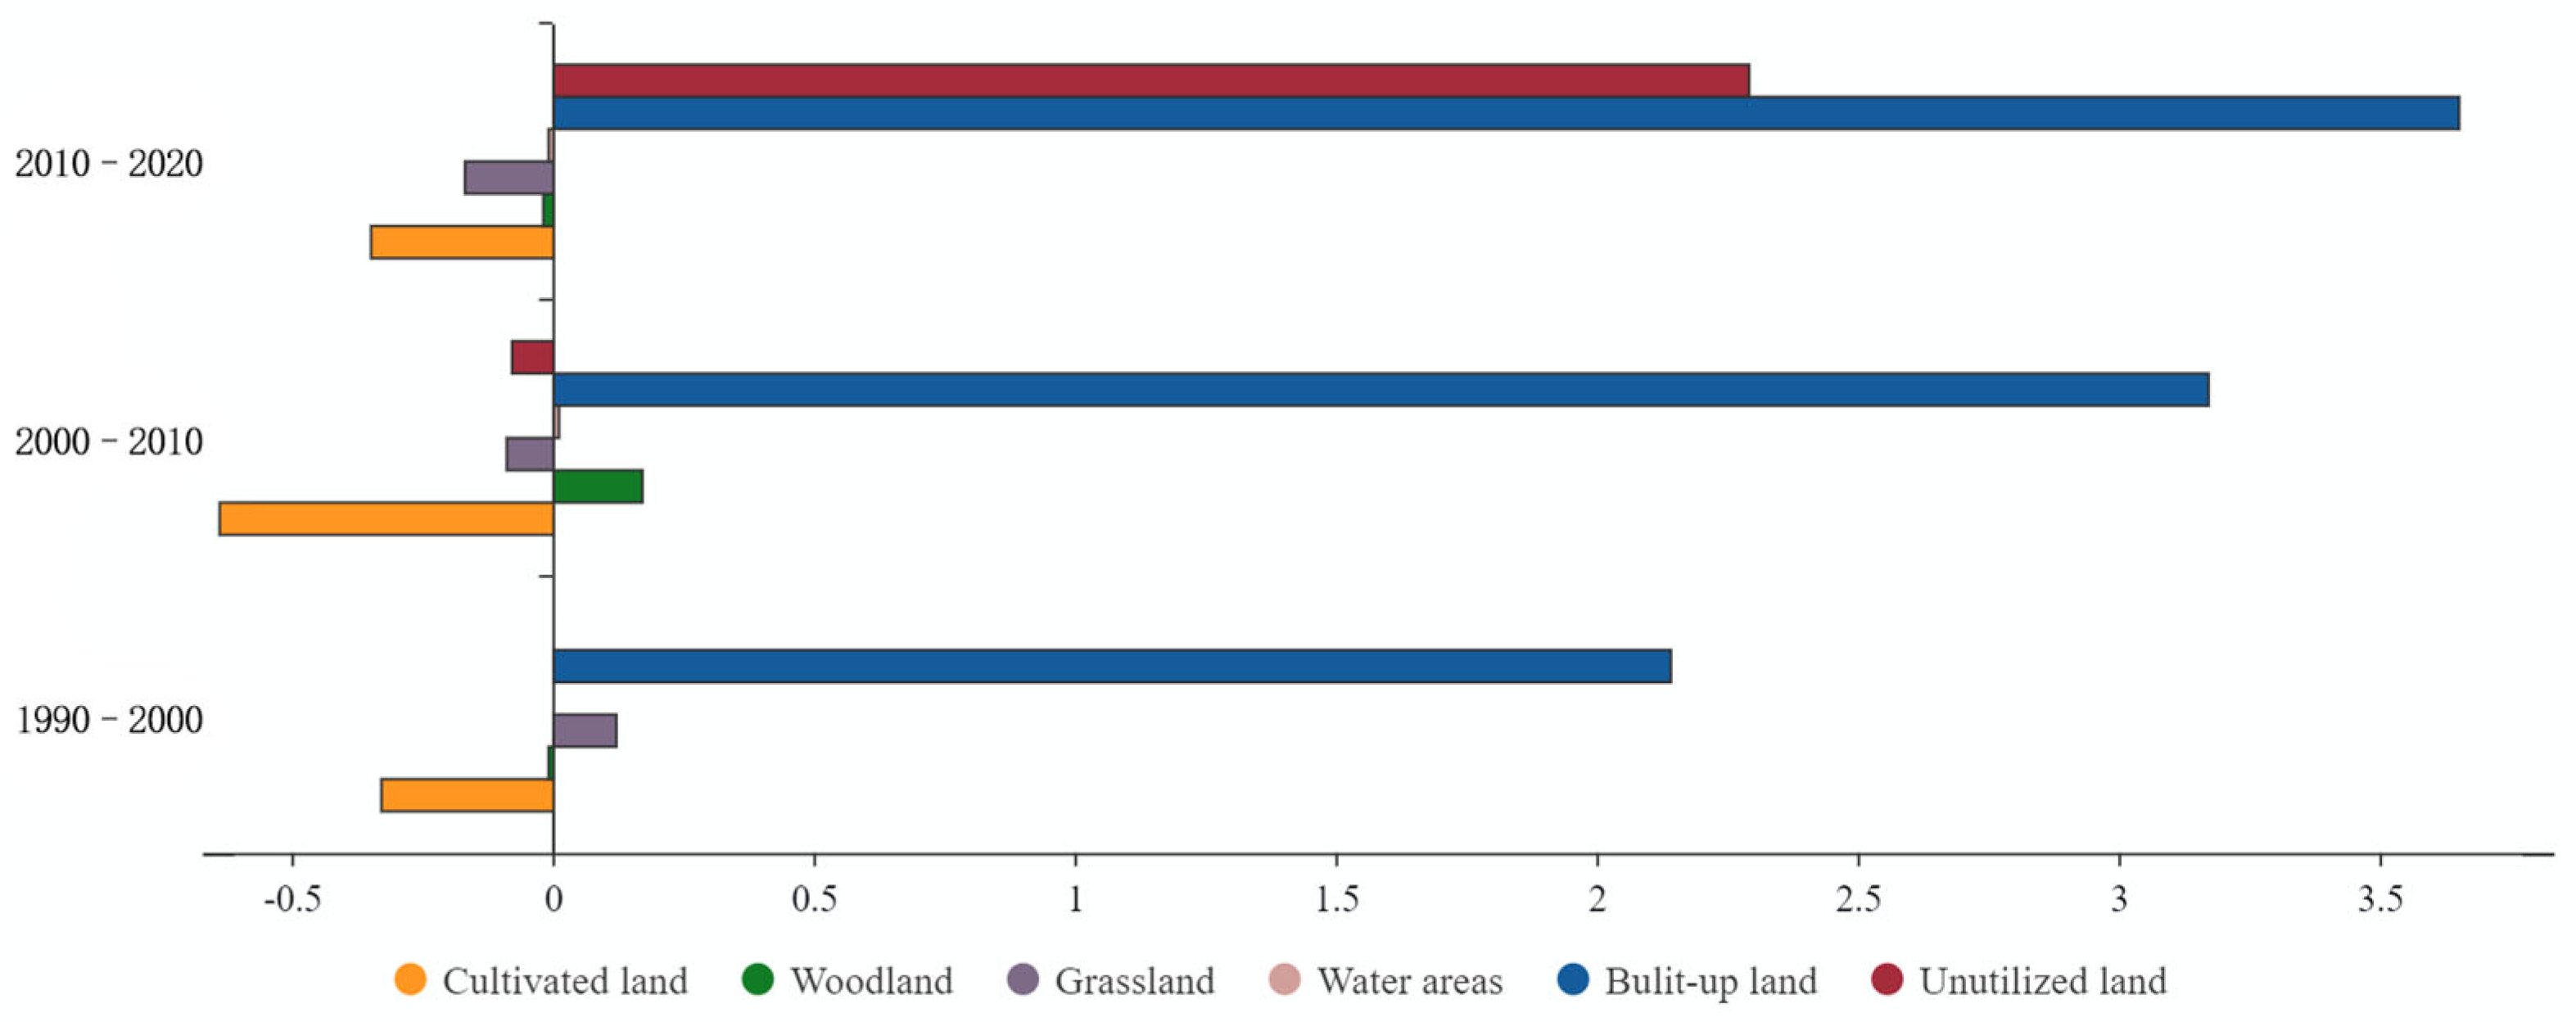
4.1.2. Land-Use Dynamic Attitude

Over the past 30 years, the extensive land use in the study area exhibited a dynamic trend of initially increasing and subsequently decreasing (Table 3; Figure 4). From 1990 to 2000, the comprehensive land-use activity in the region was 0.14%; this doubled to 0.30% from 2000 to 2010, and then decreased to 0.25% from 2010 to 2020 with an overall increase of 0.11%. Judging from the single land-use dynamic attitude, the built-up land area continued to grow due to a population increase and subsequent rapid urbanization during the past 30 years. This type of land use was the strongest in 2010–2020. The changing trend of cultivated land and grassland areas was consistent and gradually decreased. The change rate was rapid at first and then slowed; this may have been related to the policy of studying the gradual transition of regional industrial modes from primary industries to tertiary industries and returning farmland to forest. Woodland first increased and then decreased, grassland continued to decrease, unutilized land reached its maximum in 2010–2020, and the water area remained unchanged.

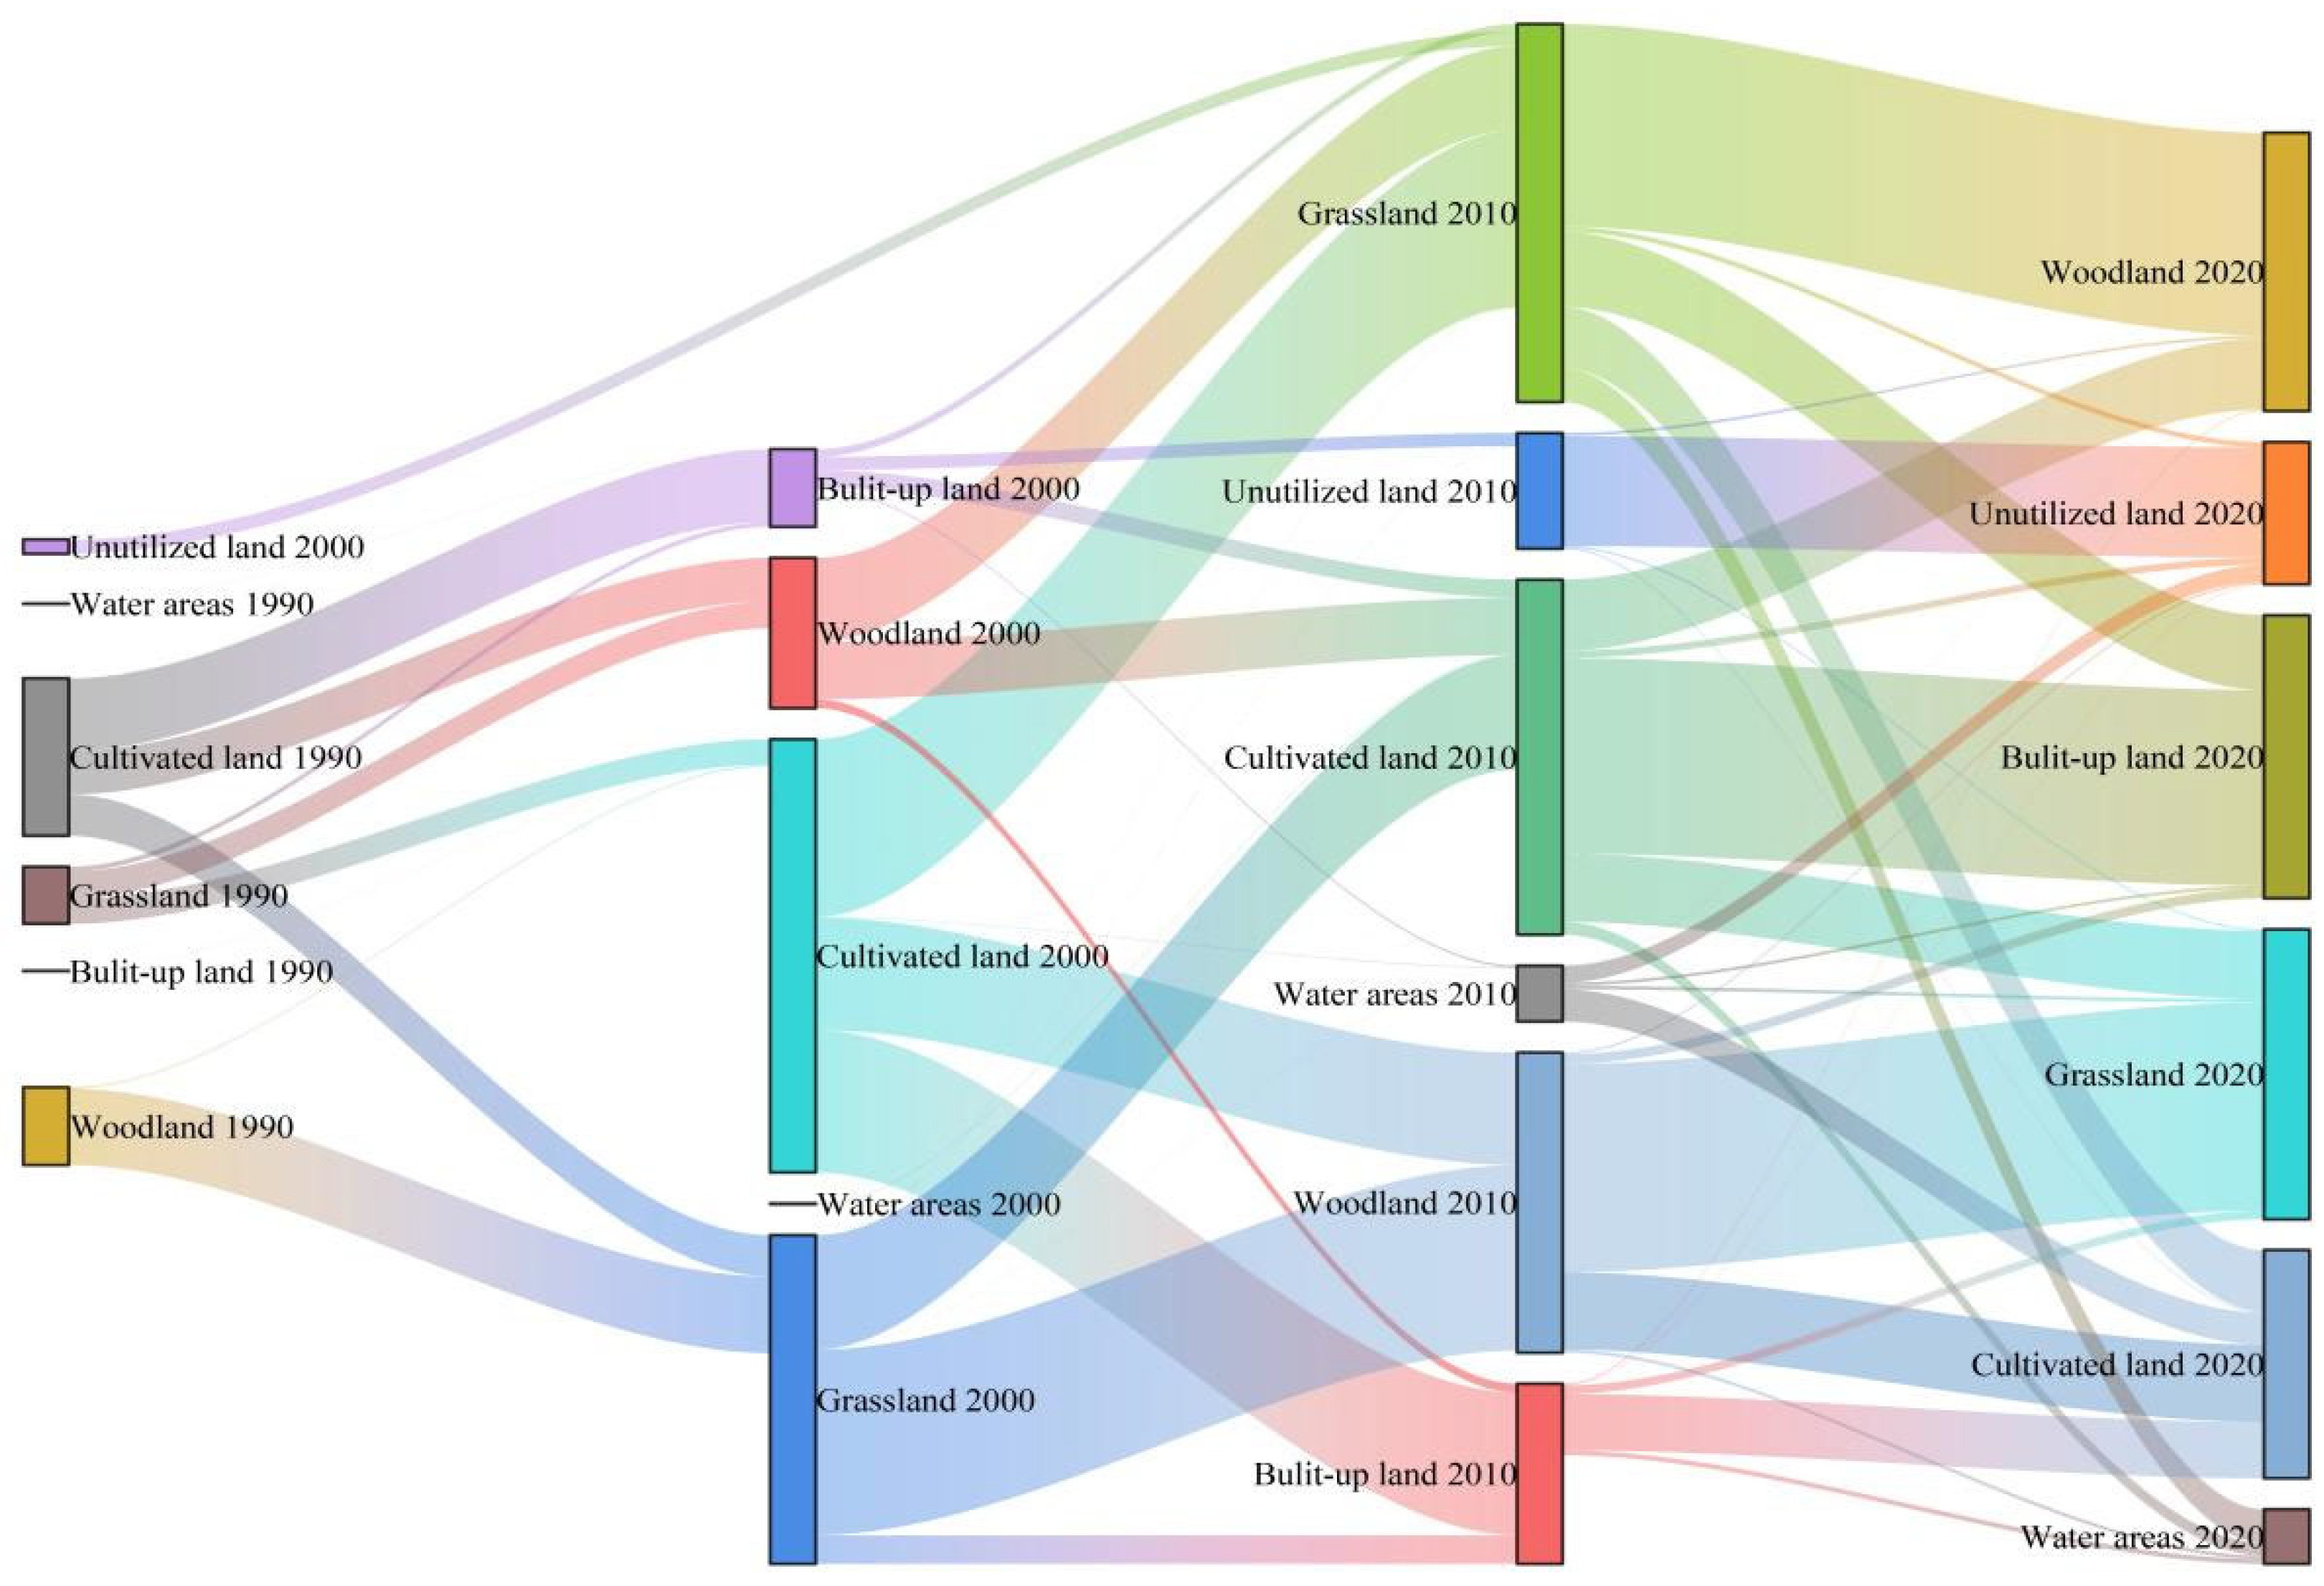
4.1.3. Characteristics of Land-Use Transfer

From 1990 to 2020 (Table 4; Figure 5), the most cultivated land was mainly transferred to grassland, woodland, and built-up land, indicating that the policy of returning farmland to forests and ecological restoration in the basin had played an important role in those years. The transfer scales of the water area and unutilized land area were small. The transfer area of built-up land was the largest, indicating that production and living land had gradually increased with the population growth. The area transfer of land-use types at the Erhai Lake Basin mainly occurred with grassland, woodland, cultivated land, and built-up land. Of these, the scales of built-up land and grassland transfer were the most obvious.

4.2. Landscape Ecological Sensitivity Assessment

4.2.1. Selection of Single-Factor Landscape Ecological Sensitivity Assessment Factors

Based on the classification standards of ecological sensitivity assessment factors by Chinese scholars such as Wei Chanjuan, He Suling, Liu Lan, and Tang Xiaolan, as well as the General Rules for Comprehensive Management Planning of Soil and Water Conservation GB/T 15772-2008 [56] and the Detailed Rules for Garden Slopes, the different sensitivity degrees of each assessment factor were divided into low-sensitivity areas, lower sensitivity areas, medium-sensitivity areas, higher sensitivity areas, and high-sensitivity areas. The index with the most significant influence on the landscape ecological sensitivity of Erhai Lake Basin was vegetation coverage, followed by water system and roads (Table 5). The indexes with the least influence were collapse and landslides. The influence degree of the assessment factors was vegetation coverage > water system > roads > land-use type > slope > biodiversity > elevation > residential areas > aspect > landslide > collapse [3,57,58,59].

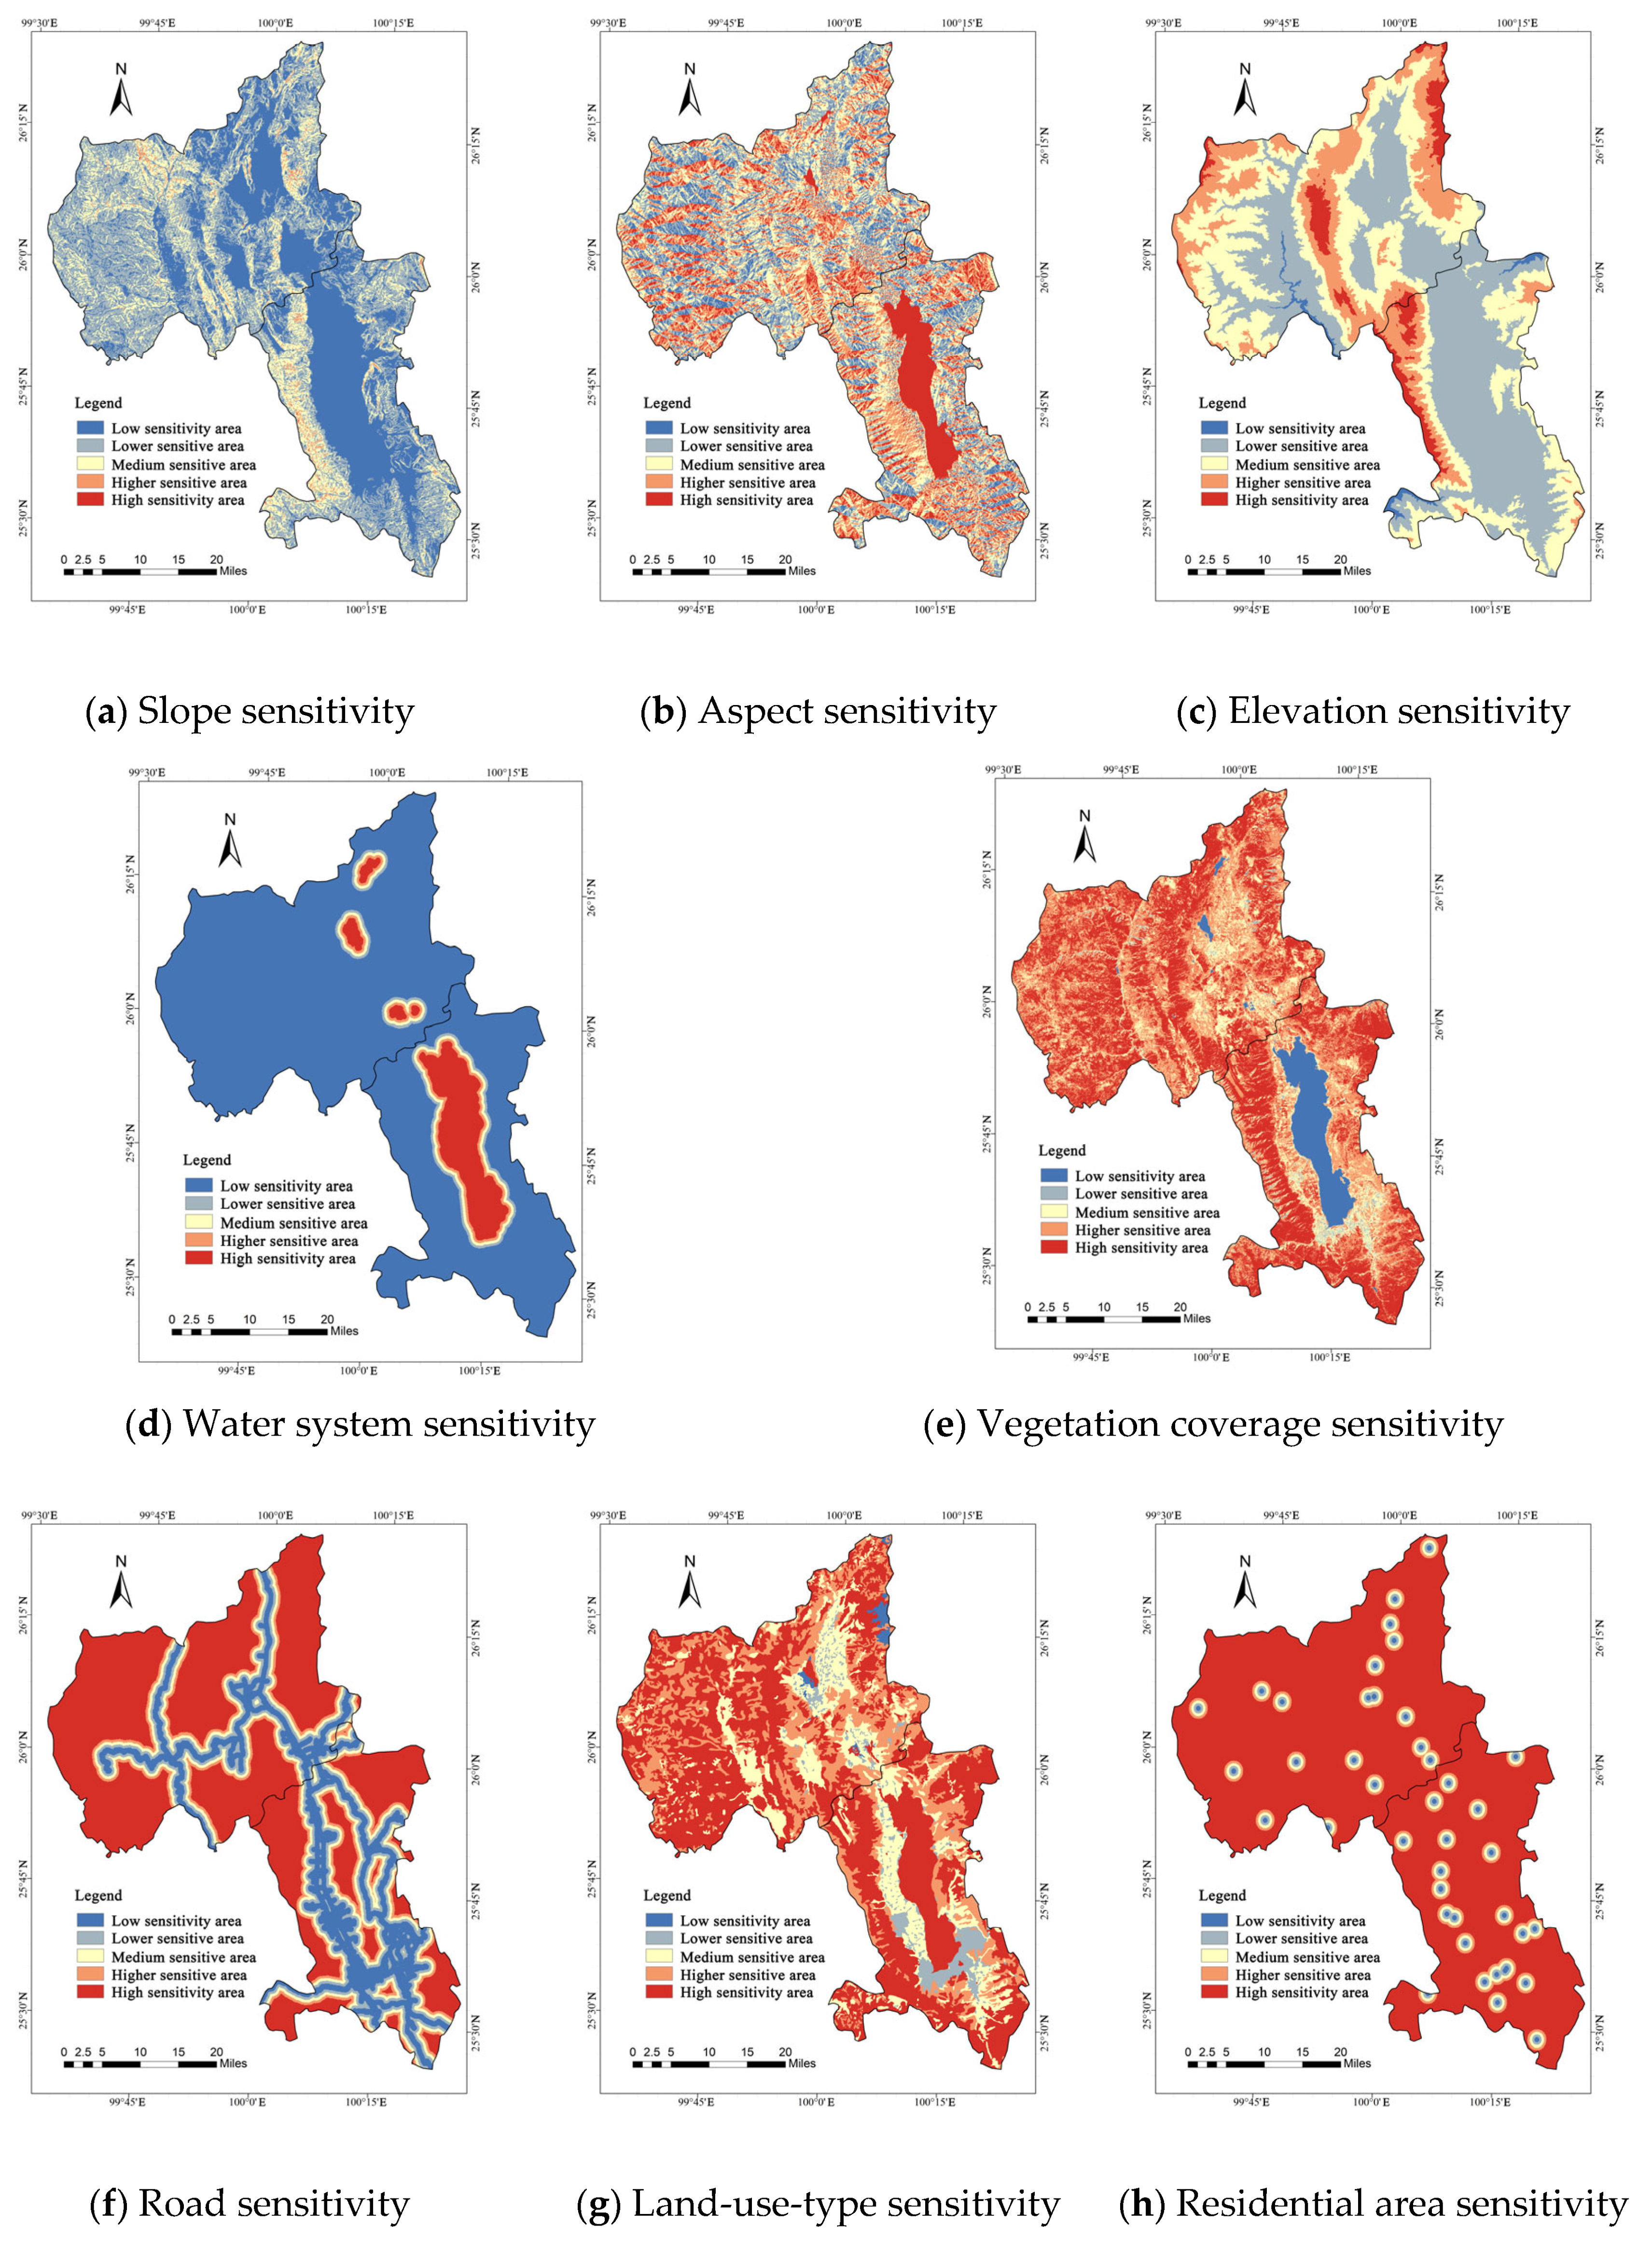
4.2.2. Single-Factor Landscape Ecological Sensitivity Assessment Results

We selected eleven single factors as important indicators to evaluate the ecological sensitivity of the Erhai Lake Basin, which were closely related to its ecological environment. The distribution results of the single-factor landscape ecological sensitivity assessment at the Erhai Lake Basin in 2020 are presented below.
Three influencing factors—slope, aspect, and elevation—were selected for landform (Figure 6a–c). Slope is one of the critical factors affecting ecological sensitivity assessments. The greater the slope, the higher the ecological sensitivity and the less suitable it is for development and construction (Table 6). The lower sensitivity area accounted for the highest proportion (36.14%). The overall terrain was relatively flat. The high-sensitivity area and the higher sensitivity area accounted for a smaller proportion (6.11% and 0.54%, respectively), mainly distributed in the Cangshan Mountain and the mountainous area on the northwest side of the basin. Slopes are positively correlated with solar radiation; this can change surface moisture and temperature, thus affecting the growth and development of animals and plants. The south slope of the study area was sunny and the north slope was shaded. The sunny slope had a good climate, a relatively healthy and stable ecosystem, strong resistance to the environment, low sensitivity, a relatively poor shaded climate, and high ecological sensitivity. Susceptible areas were widely distributed in the study area, which comprised 705.34 km2. Elevation has a significant influence on the growth, humidity, and CO2 concentration of vegetation. The maximum elevation in the whole region was 4072 m; the minimum elevation was 1339 m. The areas with high ecological sensitivity were located in protected and forest areas, whereas the areas with low ecological sensitivity were mainly located in ravines as well as water and its surrounding areas. This area was flat, suitable for human habitation, and had strong anti-interference abilities.
The natural conditions included the distance from the water system and the vegetation coverage (Figure 6d,e). A water system regulates the climate, conserves soil and water, and maintains an ecological balance. The closer a water system, the higher the ecological safety factor and the higher the ecological sensitivity, and vice versa. The water bodies in the study area were the most ecologically sensitive areas and were mainly concentrated in the Erhai Lake, Dali West Lake, Cibi Lake, and Haixi Reservoir. The study area was rich in water resources; the hydrosphere was closely connected to other areas. Once polluted, it is difficult to recover; this leads to serious ecological issues. Protecting and managing water bodies should be prioritized to avoid a loss of water bodies caused by human activities.
The vegetation coverage of the study area was uneven. The maximum area of high-sensitivity was 1829.39 km2 (43.02%) and was mainly concentrated in the western, southern, and northern mountainous areas (Table 6). The vegetation coverage and ecological sensitivity in the plain area below the mountains were relatively low. Most of the woodland was coniferous and blunt, with single tree species and poor resistance. The woodland had many young forests, soft water, and soil conservation functions, as well as severe soil erosion issues.
Human activities choose the distances from a road, the land-use types, and the settlement factors (Figure 6f–h). The influence of human activities on the ecological sensitivity was powerful, and the results demonstrated a negative correlation. The roads around the lake were mainly distributed at Dali Station, Fengyangyi Village, Longkan Wharf, and Dali Ancient City in the study area, as well as other areas where people gathered; scenic spots were densely distributed. Roads usually divide the surrounding land, weakening the interaction between various land-use types with a single surrounding environment, resulting in less woodland and a greater number of buildings. The closer the road, the stronger the human activities and the lower the ecological sensitivity, and vice versa. The land-use type is the concrete embodiment of human activity intensity. The ecological sensitivity of land-use types at Erhai Lake was generally high (25.82% and 51.50% for water and woodland, respectively) (Table 6). The residential areas at the Erhai Lake Basin were mainly concentrated around Erhai Lake. Generally speaking, the more frequent the human activities, the stronger the anti-interference ability of plants; however, the growth condition is poor, but the ability to restore the original state after it being destroyed is relatively simple. Plants grow well in areas with fewer human activities, but they lack the interference of these human activities; thus, their anti-interference ability and resilience are weak. The closer the residential area, the stronger the human activities and the lower the ecological sensitivity.
Landslide, collapse, and biodiversity factors were selected for ecological security (Figure 6i–k). Climatic conditions, elevation, and other factors affect the occurrence of landslides and collapses. The higher the slope, the greater the possibility of landslides and collapses. The low-sensitivity area of our study was large and the probability of landslides and collapse was small. The susceptible area was mainly concentrated around Cangshan and Shangguan. Biodiversity is conducive to maintaining the stability of an ecosystem and a good ecosystem can provide space for living; thus, the biodiversity of the woodland and water areas was excellent. The Erhai Lake Basin has a remarkable ecological value and is a vital treasure-house of biodiversity in the country. Its susceptible area was 51.50% at its highest and its relatively high sensitivity accounted for 25.82%. It was widely distributed in the study area; mainly in woodland and water areas (Table 6).

4.2.3. Comprehensive Assessment of Ecological Sensitivity

Using the grid calculator in ArcGIS, the sensitivity of the 11 ecological factors was analyzed by weighted superposition and a comprehensive assessment map of ecological sensitivity was obtained (Figure 7). The results showed that the influence degree was higher sensitivity area > high-sensitivity area > medium-sensitivity area > lower sensitivity area > low-sensitivity area (Table 7).
The study area primarily comprised a higher sensitivity area of 1177.10 km2 (27.93%) and a high-sensitivity area of 1102.36 km2 (26.16%), mainly distributed across high-altitude woodland areas and grassland with little human activity. This region has essential ecological service functions, but its ecological balance is exceptionally fragile; once it is destroyed, it will lead to serious environmental issues.
Next was the medium-sensitivity area of 940.42 km2 (22.32%) and the lower sensitivity area of 649.19 km2 (15.41%). These areas were in transition from residential areas to nature reserves. The low-sensitivity areas were mainly distributed in the construction land around the lake and Eryuan County. These areas had a certain intensity of development and construction; they are key development areas for tourism. In such a development process, it is easy to destroy the ecological balance. The circulation of regional resources must be recognized.

5. Discussion

The research findings reveal that the combined extent of the high-sensitivity area” and the higher-sensitivity area accounts for 54.09% of the study region, whereas the “low-sensitivity area” constitutes a proportion of 8.18%. This observation underscores the relatively elevated ecological sensitivity within the study area. However, it also suggests that the ecological stability and carrying capacity of the ecosystem are relatively diminished, rendering it susceptible to external environmental influences. Of course, under the relatively stable conditions of the geological environment, climatic conditions, and human activities, changes in the local socio-economic situation and local development plans have an important impact on changes in the local ecological environment. Local development usually relies on the participation of local residents in the decision-making process to develop tourism based on the natural potential of land development. This scenario is intricately linked to the favorable ecological environment prevalent in the study region.
According to the results of the research, of the four groups of influencing factors, the natural conditions group has the most weight and has the biggest effect on the ecological sensitivity of the study region. Subsequently, human activities contribute to this impact. This hierarchy is attributed to the analysis of the eleven influencing factors, revealing that vegetation coverage possesses the most substantial influence on the ecological sensitivity of the study area. Notably, the distribution of high-sensitivity areas within aquatic and forested regions of the land use types underscores the critical role of water systems within the ecosystem. Thus, this finding corroborates the significance of land use type factors in ecological sensitivity assessment, aligning with previous research [55,60,61,62].
In the realm of ecological sensitivity assessment, there is a lack of standardized evaluation criteria. Within this study, a comprehensive approach is adopted by considering landforms, natural conditions, human activities, and ecological security. This approach facilitates a holistic understanding of the ecological sensitivity of the region, allowing for a reasoned comprehension of the variations in the regional ecosystem attributed to diverse influencing factors.
At the same time, the original data and its collection method are the key to this study. Choosing different data often has an important impact on land development policies [63]. Due to constraints inherent to data collection, certain influential factors such as soil erosion, precipitation, and temperature impacts on the ecological environment were not incorporated into the assessment. Consequently, there remains room for further enhancement of the ecological sensitivity assessment factor system within the study area. We determined an index of comprehensive ecological sensitivity using the weighted superposition method. The ecological sensitivity of the Erhai Lake Basin was divided into five grades—a low-sensitivity area, a lower-sensitivity area, a medium-sensitivity area, a higher-sensitivity area, and a high-sensitivity area—to guide the protection and development of the ecosystem at the Erhai Lake Basin and promote a harmonious coexistence between man and nature. The data in the experiment are free and open, reducing the resource consumption of field investigations.
Worldwide, foreign research on watershed human settlements focuses on forming a comprehensive water resource utilization mechanism through watershed development and management, promoting the integrated development of human settlements along the watershed through resource-based construction. Different types of watersheds have different development and management models [64], so the ecological environment of the watershed should be managed and developed according to local conditions. Rural cultural landscapes [65], UNESCO World Heritage Sites [66], and the physicochemical properties of soil [67,68] have profound influences on the development of watershed human settlements and should be incorporated into watershed planning and development.

6. Conclusions

Due to the vital concerns of the state and society for ecological protection and ecological restoration, the conflict between sustainable development and human activities in ecologically fragile areas is intensifying [69]. Presently, the lifting of restrictions due to the COVID-19 pandemic has reinvigorated global tourism and the public especially favors places with beautiful environments. According to the data, during the first half of 2023, the total number of domestic tourists and overall revenue experienced year-on-year growth of 63.9% and 95%, respectively. Within the Erhai Lake basin area, there was a 40% year-on-year increase in visitor volume. While this rapid economic resurgence is underway, it simultaneously imposes significant pressure on the local ecological environment. The intensification of human activities disturbs the balance of local ecological environments. A comprehensive understanding of ecological sensitivity has become particularly crucial in promoting ecological conservation and fostering sustainable development. The Erhai Lake Basin, one of the nine plateau lakes in Yunnan Province, is an integral part of the ecosystem. The principles of comprehensive treatment, systematic treatment, and source treatment should be observed. The ecological changes at the Erhai Lake Basin have a substantial environmental impact [70]. An urgent understanding of the ecological sensitivity of this area can strengthen ecological protection and sustainable development.
This study was targeted at the lack of ecological sensitivity assessment work in the Erhai Lake Basin in China. We selected the land-use information of the Erhai River Basin for 30 years from the GEE platform, and the temporal and spatial change characteristics of the Erhai River Basin from 1990 to 2020 were analyzed. Combined with the spatial analysis method of ArcGIS 10.8 software and an AHP, the ecological sensitivity of this area was evaluated. Our conclusions were as follows.
(1)
It was necessary to analyze remote-sensing data to solve the issue of the land classification of ecologically fragile and plateau areas. The main land area in 1990–2020 was woodland, with an annual average of approximately 45.05%, followed by grassland, accounting for approximately 26.20%. During the past 30 years, the range of various land-use types has changed. Woodland, built-up land, and unutilized land have demonstrated an increasing trend, whereas cultivated land and grassland have demonstrated a decreasing trend. The water area has remained unchanged. Among the transferred areas, the cultivated land area and the building area were the largest, demonstrating that the development of tourism and population growth have promoted urbanization. Climate change and ecological restoration projects have promoted the ecological protection of the Erhai Lake Basin.
(2)
With the evolution of land use, we could clearly understand the changes in land use in the study area, with a particular impact on ecological sensitivity. Our single-factor ecological sensitivity assessment had 11 influencing factors; essential indicators for the evaluation of a sea basin. Vegetation coverage and the distance from the water system were necessary influencing factors for natural conditions, accounting for a relatively large proportion. Land use and the distance from a road played a key role in human activities, whereas landslides, collapses, and slopes had less of an influence. The ecological value of the Erhai Lake Basin is remarkable; thus, biodiversity factors were also noted to be important indicators.
(3)
The comprehensive sensitivity of the overall study area was 1102.36 km2 (26.16%) and the higher sensitivity area was 1177.10 km2 (27.93%). Ecological sensitivity gradually increased from residential areas to nature reserves. The high-sensitivity areas in the study area were widely distributed, which is more conducive to multi-mode protection and planning. The high-sensitivity and higher sensitivity areas were mainly distributed in mountainous woodlands and grasslands, as well as areas extending 100 m away from the west side of Erhai Lake. In areas with fewer human activities, human interference resistance was weak, which could strengthen the ecological restoration function of the area and protect its ecological function. The medium-sensitivity areas were mainly distributed in the transition areas, from residential areas to nature reserves such as cultivated land and water areas. Limiting development activities and strengthening land-use monitoring are necessary to reduce human intervention in nature. The low-sensitivity and lower sensitivity areas were mainly distributed around the waters and residential areas, mainly areas of human activity. These were close to the water. Thus, it is possible to ensure a degree of intensity for open construction whilst improving basic service facilities, establishing green corridors, broadening lakeside buffer spaces, and protecting the ecological security of water resources in the basin [71].

Author Contributions

Conceptualization, Y.S.; Data curation, J.W., B.G. and Y.Z.; Formal analysis, J.W.; Methodology, Y.S.; Project administration, Y.S.; Supervision, Y.S.; Writing—original draft, J.W.; Writing—review and editing, J.W., Y.S., B.G. and Y.Z. All authors have read and agreed to the published version of the manuscript.

Funding

This research was funded by the National Natural Science Foundation of China, grant number 51968064; the Yunnan Provincial Department of Education Science Research Fund Project, grant number 2022Y617; and the Industrial Technology Leading Talent Project, grant number YNWRCYJS-2020-022.

Institutional Review Board Statement

Not applicable.

Informed Consent Statement

Not applicable.

Data Availability Statement

Not applicable.

Conflicts of Interest

The authors declare no conflict of interest.

References

  1. Hooper, T.; Beaumont, N.; Griffiths, C.; Langmead, O.; Somerfield, P.J. Assessing the sensitivity of ecosystem services to changing pressures. Ecosyst. Serv. 2017, 24, 160–169. [Google Scholar] [CrossRef]
  2. Zhao, Z.Y.; Zhang, Y.T.; Lii, Y.H.; Wang, C.; Wu, X. Comprehensive evaluation and spatio-temporal variations of ecological sensitivity on the QinghaiTibet Plateau based on spatial distance index. Sheng Tai Xue Bao 2022, 42, 7403–7416. [Google Scholar]
  3. Zhou, Y.L.; Yang, Y.F.; Yuan, W.Y. Analysis and Evaluation on Ecological Sensitivity of Xiaoqinghe River Basin in Jinan Based on GIS. J. Northwest For. Univ. 2016, 31, 50–56+62. [Google Scholar]
  4. Gashaw, T.; Tulu, T.; Argaw, M.; Worqlul, A.W.; Tolessa, T.; Kindu, M. Estimating the impacts of land use/land cover changes on ecosystem service values: The case of the Andassa watershed in the upper Blue Nile basin of Ethiopia. Ecosyst. Serv. 2018, 31, 219–228. [Google Scholar] [CrossRef]
  5. You, N.S.; Meng, J.J. Ecological Functions Regionalization and Ecosystem Management Based on the Ecological Sensitivity and Ecosystem Service in the Middle Reaches of the Heihe River. J. Desert Res. 2017, 37, 186–197. [Google Scholar]
  6. Chapman, S.; Mustin, K.; Renwick, A.R.; Segan, D.B.; Hole, D.G.; Pearson, R.G.; Watson, J.E.M.; Richardson, D. Publishing trends on climate change vulnerability in the conservation literature reveal a predominant focus on direct impacts and long timescales. Divers. Distrib. 2014, 20, 1221–1228. [Google Scholar] [CrossRef]
  7. Chandra, A.; Gaganis, P. Deconstructing vulnerability and adaptation in a coastal river basin ecosystem: A participatory analysis of flflood risk in Nadi, Fiji Islands. Clim. Dev. 2016, 8, 256–269. [Google Scholar] [CrossRef]
  8. Ding, H.; Zhao, X.M.; Guo, X. Evaluation of ecological sensitivity in Poyang Lake area of Jiangxi Province. Res. Soil. Water Conserv. 2020, 27, 257–264. [Google Scholar]
  9. Chen, S.; Jiang, W.; Chen, Y.; Wang, X. An ecological sensitivity analysis based on GIS in Fuyang District, Hangzhou City, Zhejiang Province, China. J. Zhejiang AF Univ. 2015, 32, 837–844. [Google Scholar]
  10. Duan, Y.Q.; Zhang, L.D.; Fan, X.Y.; Hou, Q.H.; Hou, X.M. Smart City oriented Ecological Sensitivity Assessment and Service Value Computing basedon Intelligent sensing data processing. Comput. Commun. 2020, 160, 263–273. [Google Scholar] [CrossRef]
  11. Turner, B.L.; Kasperson, R.E.; Matson, P.A.; McCarthy, J.J.; Corell, R.W.; Christensen, L.; Eckley, N.; Kasperson, J.X.; Luers, A.; Martello, M.L.; et al. A framework for vulnerability analysis in sustainability science. Proc. Natl. Acad. Sci. USA 2003, 100, 8074–8079. [Google Scholar] [CrossRef] [PubMed]
  12. Butt, M.A.; Nisar, K.; Mahmood, S.A.; Sami, J.; Qureshi, J.; Jaffer, G. Toward GIS–based approach for identification of ecological sensitivity areas: Multi–criteria evaluation technique for promotion of tourism in Soon ValleyPakistan. J. Indian. Soc. Remote Sens. 2019, 47, 1527–1536. [Google Scholar] [CrossRef]
  13. Peng, B.; Huang, Q.; Elahi, E.; Wei, G. Ecological environment vulnerability and driving force of Yangtze River urban agglomeration. Sustainability 2019, 11, 6623. [Google Scholar] [CrossRef]
  14. Ersayin, K.; Tagil, S. Ecological sensitivity and risk assessment in the Kizilirmak Delta. Fresenius Environ. Bull. 2017, 26, 6508–6516. [Google Scholar]
  15. Palmer, M.A.; Reidy Liermann, C.A.; Nilsson, C.; Flörke, M.; Alcamo, J.; Lake, P.S.; Bond, N. Climate change and the world’s river basins: Anticipating management options. Front. Ecol. Environ. 2008, 6, 81–89. [Google Scholar] [CrossRef]
  16. Creamer, R.E.; Hannula, S.E.; Van Leeuwen, J.P.; Stone, D.; Rutgers, M.; Schmelz, R.M.; De Ruiter, P.C.; Hendriksen, N.B.; Bolger, T.; Bouffaud, M.L.; et al. Ecological network analysis reveals the inter–connection between soil biodiversity and ecosystem function as affected by land use across Europe. Appl. Soil Ecol. 2016, 97, 112–124. [Google Scholar] [CrossRef]
  17. Steenberg, J.W.; Millward, A.A.; Nowak, D.J.; Robinson, P.J.; Ellis, A. Forecasting urban Forest ecosystem structure, function, and vulnerability. J. Environ. Manag. 2017, 59, 373–392. [Google Scholar] [CrossRef]
  18. Gonzalez, P.; Neilson, R.P.; Lenihan, J.M.; Drapek, R.J. Global patterns in the vulnerability of ecosystems to vegetation shifts due to climate change. Global Ecol. Biogeogr. 2010, 19, 755–768. [Google Scholar] [CrossRef]
  19. Pielke, R.A.; Avissar, R. Influence of landscape structure on localand regional climate. Landsc. Ecol. 1990, 4, 133–155. [Google Scholar] [CrossRef]
  20. Yu, J.; Li, F.; Wang, Y.; Lin, Y.; Peng, Z.; Cheng, K. Spatiotemporal evolution of tropical forest degradation and its impact on ecological sensitivity: A case study in Jinghong, Xishuangbanna, China. Sci. Total Environ. 2020, 727, 138678. [Google Scholar] [CrossRef]
  21. Li, T.; Liu, K.; Ma, L.Y.; Bao, Y.B.; Wu, L. Evaluation on resolution Effects driven by land use changes over Danjiang River basin of Qinling Mountain. J. Nat. Resour. Policy Res. 2016, 31, 583–595. [Google Scholar]
  22. Qu, S.; Wang, L.; Lin, A.; Yu, D.; Yuan, M.; Li, C.a. Distinguishing the impacts of climate change and anthropogenic factors on vegetation dynamics in the Yangtze River Basin, China. Ecol. Indic. 2020, 108, 105724. [Google Scholar] [CrossRef]
  23. Kong, Y.F. Study on the Ecological Planning of Jixi National Wetland Park based on Ecological Sensitivity Evaluation. Master’s Thesis, Shandong Jianzhu University, Jinan, China, 2015. [Google Scholar]
  24. Wang, S. Liaoning Province ecological sensitivity evaluation and its driving forces. J. Nat. Sci. Res. 2021, 1, 35–38. [Google Scholar]
  25. Wei, W.; Zhou, T.; Guo, Z.C.; Li, Z.Y.; Zhang, X.Y. Spatiotemporal evolution of land ecological sensitivity in arid inland river basin based on remote sensing index: A case of Wuwei City in Shiyang River Basin. Chin. J. Ecol. 2020, 39, 3068–3079. [Google Scholar]
  26. Zhang, H.X.; Liu, L.R. Evaluating ecological environmental sensitivity in poor county of Lyuliang mountain area based on GIS. Ecol. Appl. 2020, 39, 30–37. [Google Scholar]
  27. Xuan, L.; Huang, C.; Chen, W.; Wang, X.; Bai, X.; Yin, Z.; Li, X.; Han, J. Ecological sensitivity assessment based on GIS and Analytic Hierarchy Process: Case study of Longnan county in Jiangxi province. Nanchang Univ. J. Nat. Sci. 2019, 43, 599–605. [Google Scholar]
  28. Fotheringham, A.S.; Charlton, M.E.; Brunsdon, C. Geographically weighted regression: A natural evolution of the expansion method for spatial data analysis. Environ. Plan. A 1998, 30, 1905–1927. [Google Scholar] [CrossRef]
  29. Zhu, F.; Zhang, H.W. “AHP + entropy weight method” based CW–TOPSIS model for predicting rockburst. China Saf. Sci. J. 2017, 27, 128–133. [Google Scholar]
  30. Sun, L.; Xu, D.; Liu, B. Research on Ecological Sensitivity Evaluation of Yellow River Scenic Area in Zhengzhou. For. Resour. Manag. 2022, 6, 95–100. [Google Scholar]
  31. Cuicui, W. Study on Evaluation Method of Ecological Sensitivity in Lanzhou Section of Yellow River Basin. Master’s Thesis, Lanzhou Jiaotong University, Lanzhou, China, 2022. [Google Scholar]
  32. Ouyang, Z.Y.; Wang, X.K.; Miao, H. China’s eco–environmental sensitivity and its spatial heterogeneity. Sheng Tai Xue Bao. 2020, 20, 9–12. [Google Scholar]
  33. Chen, W.; Zhao, Y.; Cui, D.; Lü, S.; Lu, J.; Muyassar, S. Ecological sensitivity study of oasis supported by GIS: A case study of Yili river valley. Bull. Surv. Mapp. 2023, 5, 107–114. [Google Scholar]
  34. Zheng, S.Y.; Li, Y.Q.; Dong, Y.K.; Wang, J.X. Research on the Spatio–temporal Variation of NDVI in Erhai Lake Basin Under the Influence of Multi–factors. Lemmer 2022, 29, 83–98. [Google Scholar]
  35. Lin, R. Ecological Sensitivity Assessment of the Central Route of South-to-North WaterDiversion Project Reserve. Master’s Thesis, China University of Mining and Technology, Beijing, China, 2019. [Google Scholar]
  36. Ma, L.; Li, B. Matching degrees between ecological sensitivity and land-use functions: A study of The WestCoast of Qingdao New District. J. Beijing Norm. Univ. (Nat. Sci.) 2018, 54, 412–419. [Google Scholar]
  37. Jing, Y. Land Use Changes in Lanzhou New Area Impact on Ecological Environment and Evaluation. Master’s Thesis, Gansu Agricultural University, Lanzhou, China, 2018. [Google Scholar]
  38. Hao, S.; Su, L.; Guo, Y. Effects of Land Use Changes on Ecological Sensitivity of Nyang River Basin in Tibet. Bull. Soil Water Conserv. 2023, 43, 303–309. [Google Scholar]
  39. Liu, H.; Sun, L.H.; Lv, W.K. Evaluation and Change Analysis of Ecosystem Service Value in Erhai Lake Basin Based on Land Use Change. Ecol. Econ. 2022, 38, 147–152. [Google Scholar]
  40. Du, Y.Y.; Hu, Y.N.; Yang, Y.; Peng, J. Building ecological security patterns in southwestern mountainous areas based on ecological importance and ecological sensitivity: A case study of Dali Bai Autonomous Prefecture, Yunnan Province. Acta Ecol. Sin. 2017, 37, 8241–8253. [Google Scholar]
  41. Ma, Y.J.; Huang, X.J.; Xu, M.M.; Zhong, T.Y.; Du, W.X. Sensitivity Analysis of Ecosystem Service Value to Coastal Tideland Development in Jiangsu Province. China Land Sci. 2006, 20, 28–34. [Google Scholar]
  42. He, S.L.; Zou, F.Q.; Wang, J.L. Ecological sensitivity evaluation of Longnan County based on AHP and MSE weighting method. Chin. J. Ecol. 2021, 40, 2927–2935. [Google Scholar]
  43. Lu, Y.; Li, H. Spatio–temporal dynamic evolution of habitat quality based on land use change from 2000 to 2020: Taking Wuhan metropolitan area as an example. Res. Soil Water Conserv. 2022, 29, 391–398. [Google Scholar]
  44. Xu, X.L.; Liu, J.Y.; Zhang, Z.X.; Zhou, W.C.; Zhang, S.W.; Li, R.D.; Yan, C.Z.; Wu, S.X.; Shi, X.Z. A Time Series Land Ecosystem Classification Dataset of China in Five-Year Increments (1990–2010). J. Global Change Data Discov. 2017, 1, 52–59. [Google Scholar] [CrossRef]
  45. Xu, X.L.; Pang, Z.G.; Yu, X.F. Spatial-Temporal Pattern Analysis of Land Use/Cover; Scientific and Technical Documentation Press: Beijing, China, 2014. [Google Scholar]
  46. Peng, W.; Sitong, Q.; Huirong, H. Spatial-temporal evolution characteristics of land use change and habitat quality in the Lhasa River Basin over the past three decades. JAL 2023, 40, 492–503. [Google Scholar]
  47. Yao, P.; Yunhe, Y.; Wenjuan, H.; Han, H.X. Temporal and spatial variation characteristics of habitat quality in the source region of the Yellow River based on land use and vegetation cover change. Sheng Tai Xue Bao 2022, 42, 7978–7988. [Google Scholar]
  48. Andong, H.; Mingsong, Z.; Min, G. Spatial–temporal evolution characteristics of land use in Anhui Province from 1980 to 2020. STEJ 2022, 22, 4627–4635. [Google Scholar]
  49. Boyang, W.; Yingjie, G.; Chunfeng, L. Developing ecological protection strategies for scenic spots based on ecological sensitivity-A case study of Yaoshan Scenic Spot. J. Gansu Agric. Univ. 2023, 58, 180–188+199. [Google Scholar]
  50. Xi, W.; Sanyou, C.; Yingjie, L. Study on land use change and ecological sensitivity in 30 years based on Landsat TM and Oll data–aase study of Qinling Mountains of Huyi District in Xi’an. J. Quat. Sci. 2022, 42, 1655–1672. [Google Scholar]
  51. Bei, Z. Ecological Protection and Utilization of Xuefeng Mountain National Forest Park Based on Ecological Sensitivity Evaluation. Master’s Thesis, Central South University of Forestry & Technology, Changsha, China, 2021. [Google Scholar]
  52. Jiali, W.; Xiaogang, W.; Shiyu, L.; Yiyang, L.; Manhong, X. Study on Ecological Sensitivity of Rural Landscape in Meikou, Nanping City. J. Southwest For. Univ. 2020, 40, 153–159. [Google Scholar]
  53. Wu, C.S.; Huang, C.; Liu, G.H.; Liu, Q.S. Assessment of ecological vulnerability in the Yellow River delta using the fuzzy analytic hierarchy process. Sheng Tai Xue Bao 2018, 38, 4584–4595. [Google Scholar]
  54. Zou, T.H.; Chang, Y.X.; Chen, P.; Liu, J.F. Evaluation of eco-environmental vulnerability in Jilin Province based on an AHP-PCA entropy weight model. Chin. J. Eco-Agric. 2023, 31, 1511–1524. [Google Scholar]
  55. Yi, D.; Zhao, X.M.; Guo, X.; Zhao, L.H.; Zhang, H.; Han, Y.; Roshan, S.; Luo, Z.J. Delimitation of urban development boundary based on ecological sensitivity evaluation and CA-Markov simulation in plain city: A case of Nanchang, Jiangxi, China. Chin. J. Appl. Ecol. 2020, 31, 208–218. [Google Scholar]
  56. GB/T 15772-2008; General Rule of Planning for Comprehensive Control of Soil and Water Conservation. Standardization Administration of the People’s Republic of China: Beijing, China, 2009.
  57. Xu, Y.; Liu, R.; Xue, C.B.; Xia, Z.H. Ecological Sensitivity Evaluation and Explanatory Power Analysis of the Giant Panda National Park in China. Ecol. Indic. 2023, 146, 109792. [Google Scholar] [CrossRef]
  58. Wei, C.J.; Meng, J.J. Ecological sensitivity assessment and spatial pattern analysis of land resources in China. Acta Sci. Nat. Univ. Pekin 2022, 58, 157–168. [Google Scholar]
  59. Zhang, T.Y.; Wang, L.; Han, Y.; Zhang, M. Sensitivity Evaluation of Soil Salinization in Manasi River Basin Based on GIS and RS. Soils 2017, 49, 812–818. [Google Scholar]
  60. Shi, N.N.; Quan, Z.J.; Han, Y.; Wang, Q.; Xiao, N.; Gao, X. Analysis of Land Resources Carrying Capacity in Wuhai City Based on Ecological Sensitivity. Res. Soil Water Conserv. 2017, 24, 239–243. [Google Scholar]
  61. Yang, G.H.; Ma, R.H.; Zhang, L. Current situation and major problems of lakes in China and protection strategies. Hupo Kexue 2010, 22, 799–810. [Google Scholar]
  62. Vojtek, M.; Vojteková, J. Land Use Change and its Impact on Surface Runoff from Small Basins: A Case of Radiša Basin. Folia Geogr. 2019, 61, 104. [Google Scholar]
  63. Brunn, S.D.; Matlovičová, K.; Mušinka, A.; Matlovič, R. Policy implications of the vagaries in population estimates on the accuracy of sociographical mapping of contemporary Slovak Roma communities. GeoJournal 2018, 83, 853–869. [Google Scholar] [CrossRef]
  64. Hanušin, J.; Huba, M.; Ira, V. Organization for the Development of the Senegal River Basin (OMVS) and Integrated Water Resources Management (IWRM): What Benefits and Difficulties of the Omvs for Iwrm in Senegal? Folia Geogr. 2020, 61, 1. [Google Scholar]
  65. Brylev, V. Changes of Dispersed Settlements in Rural Cultural Landscape From the Strategic Perspective (With Special Attention to the Village Hrusov in Central Slovakia). Folia Geogr. 2020, 62, 106–132. [Google Scholar]
  66. Lukyanets, V. Russian Saline Lakes Elton and Baskunchak as Challengers to the Unesco World Heritage List. Folia Geogr. 2019, 61, 87. [Google Scholar]
  67. Berila, A.; Isufi, F. Physical and Chemical Properties of Soils in Potential Approaches of Volynic Polisse, Violated by Root Sponge. Folia Geogr. 2021, 61, 98. [Google Scholar]
  68. Vojtek, M.; Vojteková, J. Determination Of Dissection Index (DI) Using Gis & Rs Techniques: A Case Study on Drenica River Basin. Folia Geogr. 2019, 63, 5–18. [Google Scholar]
  69. Raufifirad, V.; Heidari, Q.; Hunter, R.; Ghorbani, J. Relationship between socioeconomic vulnerability and ecological sustainability: The case of Aran–V–Bidgol’s rangelands, Iran. Ecol. Indic. 2018, 85, 613–623. [Google Scholar] [CrossRef]
  70. Li, Y.M.; Guan, C.W.; Zhu, J. GIS–based ecological sensitivity analysis in Xingyun Lake Basin. Res. Soil Water Conserv. 2017, 24, 266–271. [Google Scholar]
  71. Wang, H.; Liu, X.F.; Yang, Y.F. Tourism project layout of wetland park based on the ecological sensitivity evaluation: A case of Chishan lake national wetland park. Ecol. Econ. 2019, 32, 219–223. [Google Scholar]
Figure 1. Geographical location of the study area.
Sustainability 15 15020 g001
Figure 2. Ecological sensitivity assessment index system.
Sustainability 15 15020 g002
Figure 3. Spatial distribution of land use at Erhai Lake Basin at different periods.
Sustainability 15 15020 g003aSustainability 15 15020 g003b
Figure 4. Dynamic change map of single land use in the study area from 1990 to 2020.
Sustainability 15 15020 g004
Figure 5. Direction of land-use transfer at the Erhai River Basin from 1990 to 2020.
Sustainability 15 15020 g005
Figure 6. Single-factor sensitivity analysis chart of the Erhai Lake Basin in 2020.
Sustainability 15 15020 g006aSustainability 15 15020 g006b
Figure 7. Comprehensive sensitivity analysis of the Erhai River Basin in 2020.
Sustainability 15 15020 g007
Table 1. Judgment matrix model.
Xx1x2x3x4xn
x1x1/x1x1/x2x1/x3x1/x4x1/xn
x2x2/x1x2/x2x2/x3x2/x4x2/xn
x3x3/x1x3/x2x3/x3x3/x4x3/xn
x4x4/x1x4/x2x4/x3x4/x4x4/xn
xnxn/x1xn/x2xn/x3xn/x4xn/xn
Note: x is the judgment matrix; xij indicates the importance of factor i to factor j (i, j = 1, 2, 3, 4... n).
Table 2. The importance and value of the assessment factors.
Degree ValueMeaning
1Factor i is as important as factor j
3Factor i is slightly more important than factor j
5Factor i is more important than factor j
7Factor i is significantly more important than factor j
9Factor i is absolutely more important than factor j
2, 4, 6, and 8The intermediate value between the above judgments
ReciprocalComparing factor i with factor j, the importance ratio is xij and the importance ratio of factor j to factor i is 1/xij
Table 3. Land-use dynamic attitude in the study area from 1990 to 2020.
YearsCultivated LandWoodlandGrasslandWater AreasBuilt-Up LandUnutilized LandComprehensive
Land-Use Degree
1990–2000−0.33%−0.01%0.12%0.00%2.14%0.00%0.14%
2000–2010−0.64%0.17%−0.09%0.01%3.17%−0.08%0.30%
2010–2020−0.35%−0.02%−0.17%−0.01%3.65%2.29%0.25%
Table 4. Land-use transfer matrix of the Erhai Lake Basin from 1990 to 2020.
Land-Use Type2020a (km2)
Cultivated LandWoodlandGrasslandWater AreasBuilt-Up LandUnutilized LandTotal
1990a
(km2)
Cultivated land696.6537.8647.962.9283.161.60870.16
Woodland18.581826.1553.900.673.830.431903.57
Grassland27.2764.67992.147.4022.311.191114.98
Water areas7.040.070.75249.670.533.70261.76
Built-up land10.160.011.381.1464.242.8279.75
Unutilized land0.000.803.250.000.0021.6525.70
Total759.991929.801098.94261.78174.0731.334255.91
Table 5. Single-factor grading criteria and weights for landscape ecological sensitivity in the study area.
Grading/
Impact Factor (IF)
LandformNatural ConditionHuman ActivityEcological SecurityGrading Assignment
SlopeAspectElevation/mDistance from Water Areas/mVegetation CoverageDistance from Road/mDistance from Residential Areas/mLand-Use TypeLandslide/°Collapse/°Biological Diversity
Low-sensitivity area0°~10°Due southh < 1800>20000~0.2<500<500Unutilized land0~120~10Woodland; water1
Lower sensitivity area10°~20°Southeast; southwest1800~23001500~20000.2~0.4500~1000500~1000Built-up land12~2410~20Grassland3
Medium-sensitivity area20°~30°Due east; due west2300~28001000~15000.4~0.61000~15001000~1500Cultivated land24~3620~30Cultivated land5
Higher sensitivity area30°~40°Northeast; northwest2800~3300500~10000.6~0.81500~20001500~2000Grassland36~4830~40Built-up land7
High-sensitivity area>40°Due northh > 3300<5000.8~1>2000>2000Woodland; water areas>48>40Unutilized land9
Weight0.09410.03730.05930.13940.27880.120.04580.10490.02230.01880.0794
Table 6. Single-factor sensitivity assessment results.
Sensitivity FactorsLow-Sensitivity AreaLower Sensitivity AreaMedium-Sensitivity AreaHigher Sensitivity AreaHigh-Sensitivity Area
Area (km2)Proportion (%)Area (km2)Proportion (%)Area (km2)Proportion (%)Area (km2)Proportion (%)Area (km2)Proportion (%)
Slope1395.3533.111522.7936.141015.2724.09257.636.1122.750.54
Aspect445.8910.581000.5023.741064.1525.25997.9623.68705.3416.74
Elevation42.811.011819.9142.771421.8933.41761.4817.89209.474.92
Water system3634.9885.4197.072.2892.712.1887.872.06343.128.06
Vegetation coverage259.476.1056.211.32643.8915.141463.0834.411829.3943.02
Road729.3317.14440.9110.36368.268.65316.717.442400.2756.40
Residential areas36.120.85103.172.42169.283.98219.415.163727.7887.59
Land-use type31.420.74174.764.11759.0317.841098.7725.822191.7751.50
Landslide1655.1839.281794.1642.58693.0216.4570.231.671.050.02
Collapse1395.3533.111522.7936.141015.2724.09257.636.1122.750.54
Biological diversity31.420.74174.764.11759.0317.841098.7725.822191.7751.50
Table 7. Comprehensive assessment of landscape ecological sensitivity at the Erhai Lake Basin.
Sensitivity FactorsLow-Sensitivity AreaLower Sensitivity AreaMedium-Sensitivity AreaHigher Sensitivity AreaHigh-Sensitivity Area
Area (km2)Proportion (%)Area (km2)Proportion (%)Area (km2)Proportion (%)Area (km2)Proportion (%)Area (km2)Proportion (%)
Comprehensive Sensitivity344.738.18649.1915.41940.4222.321177.1027.931102.3626.16
Disclaimer/Publisher’s Note: The statements, opinions and data contained in all publications are solely those of the individual author(s) and contributor(s) and not of MDPI and/or the editor(s). MDPI and/or the editor(s) disclaim responsibility for any injury to people or property resulting from any ideas, methods, instructions or products referred to in the content.

