Article

How Does Environmental Tax Influence the Scale and Efficiency of Green Investment among China’s Heavily Polluting Enterprises?

1
School of Public Finance and Taxation, Southwestern University of Finance and Economics, Chengdu 611130, China
2
School of Economics, Anhui University, Hefei 230601, China
*
Author to whom correspondence should be addressed.
Sustainability 2023, 15(20), 15021; https://doi.org/10.3390/su152015021
Submission received: 1 September 2023 / Revised: 12 October 2023 / Accepted: 13 October 2023 / Published: 18 October 2023
(This article belongs to the Section Economic and Business Aspects of Sustainability)

Abstract

:
This paper investigates the impact of environmental tax on corporate green investment behavior using archival data from China’s A-share-listed companies. We took advantage of the quasi-natural experiment based on China’s environmental “fee-to-tax” reform and employed the difference-in-differences (DID) method. This study goes beyond the existing studies by integrating the scale of green investment with the financial circumstances of the firms to comprehensively assess the effectiveness of green investment. Using the refined Richardson residual econometric model, we accurately measured the green investment efficiency, expanding the policy evaluation of the environmental fee-to-tax transition beyond the investment scale to include efficiency. Our findings indicated that the environmental tax promotes green investment, especially among state-owned firms, firms with fewer financial constraints, and those operating in regions with weaker environmental governance. However, we discovered a trade-off between the growth in the green investment scale and the efficiency of such investments, suggesting a decrease in efficiency due to the tax. Further investigation revealed that corporate agency issues contributed to the heterogeneity in the impact of the environmental tax on green investment efficiency, with firms facing severe agency problems and experiencing more misuse of green investment. This implied that addressing agency issues could alleviate the distortionary effects of the environmental tax on green investment efficiency.

1. Introduction

Since the inception of China’s reform and opening up, the nation’s economy has experienced an accelerated pace of expansion. However, this rapid advancement is starkly juxtaposed with the escalating severity of environmental pollution [1]. Environmental concerns and the notion of ecological civilization have been propelled to the forefront, receiving escalating levels of attention and emerging as the focal points within China’s strategic framework. China’s economic objective has transitioned from a phase of high-speed growth to a period of high-quality development. The pivotal challenge currently faced is the reconciliation of environmental considerations with economic progress, striving to realize sustainable development whereby environmental preservation and economic prosperity mutually sustain one another.
Enterprises, in their role as consumers of resources and energy, also serve as major contributors to environmental pollution. This pollution, which creates negative externalities, leads to a situation where corporations internalize the profits from activities that generate pollutants, while the costs to society resulting from these emissions are spread widely. While eco-innovation can bring positive outcomes for businesses [2,3], green investment inherently involves characteristics such as greater societal benefits compared to economic advantages, substantial investment costs, and extended implementation timeframes. These attributes conflict with a business’s primary objective of maximizing profit, reducing their willingness to take on environmental responsibilities. Investing in environmentally friendly equipment and promoting green innovation require significant capital expenditure, leading to increased production costs and potential impacts on business performance. This, in turn, reduces businesses’ motivation to proactively invest in environmental protection. Consequently, steering corporations towards willingly assuming responsibility for environmental governance, incentivizing green investments, and facilitating their transition to becoming environmentally sustainable entities has become a critical issue in contemporary environmental governance efforts.
Environmental regulation serves as a crucial instrument, incentivizing enterprises to protect the environment. While administrative order-based environmental regulations yield prompt results due to their mandatory nature, they incur high implementation costs, lack adaptability, and fail to sufficiently stimulate innovation in environmental technology. Furthermore, they are often linked to adverse socio-economic impacts. Conversely, green taxes, because of their market-oriented attributes, stand as effective tools for environmental management. They send price signals that effectively redirect resources towards eco-friendly sectors, thereby enhancing environmental pollution management and control [1]. In 2018, the enforcement of the Environmental Protection Tax Law in China marked a significant stride towards embracing market-based regulation. This current environmental protection tax system, when compared with the earlier implemented sewage fee system in China, exhibits advancements in legislative hierarchy, compliance baseline, and collection and management standards. It tactfully integrates the rigidity of tax law with the adjustability of regional disparities, facilitating an improvement in tax compliance among enterprises. Notably, the contemporary environmental protection tax policy employs the pollutant sewage fee standard as the minimum threshold and establishes a maximum limit of ten times this amount. It executes a regional differentiation of tax standards, with 12 provinces (or regions) augmenting the tax rate while the remainder preserve the original standard. This differentiation furnishes invaluable exogenous shocks that can be utilized to conduct empirical studies on the impacts of the environmental tax policy.
This study investigates the effects of the 2018 environmental tax reform on green investment in China, specifically focusing on the scale and efficiency of such investments. The impact of the environmental tax reform on the investment behaviors of micro-firms has sparked a dichotomy of views. Advocates posit that the reform enhances competitiveness by further internalizing the cost of detrimental environmental externalities, thereby stimulating firms to allocate resources towards environmental protection and green innovation. Conversely, critics maintain that the reform elevates cost expenditure for heavily polluting firms, curbs their cash flow for investment, and ultimately diminishes investment in environmental protection. Our research aims to provide a thorough evaluation of the 2018 environmental tax reform’s influence on corporate green investment behaviors. We undertook a multifaceted examination using microdata from China’s A-share-listed heavy polluting industries from 2012 to 2020, employing the difference-in-diffe DID method. Furthermore, we quantified the deviation of green investment from the firms’ optimal level and innovatively examined the impact of the environmental tax reform on green investment efficiency. This research seeks to contribute to the existing literature by integrating the firms’ financial sustainability with environmental protection efforts to comprehensively evaluate the incentivizing effect and efficiency of green investment prompted by the 2018 environmental tax reform. To this end, this paper offers three distinct contributions.
Firstly, to the best of our knowledge, this is the first attempt that expanded the exploration of heavy polluters’ investment behavior to encompass green investment efficiency in response to the environmental tax. We empirically examined how the augmentation in environmental tax, which was brought forth by China’s Environmental Protection Tax Law in 2018, influences both the level and efficiency of green investments by these heavy polluters. Our justification for evaluating both the level and the effectiveness of green investment resided in the following premise: heavy polluting enterprises bear a social obligation to increase green investment, thereby enhancing their environmental management standards. They are also expected to invest additional resources in pollution control measures as well as emission reduction strategies. However, due to the high costs and limited short-term returns associated with green investment, the majority of such investments are driven by external pressures, particularly in the wake of environmental tax reforms. Consequently, an enterprise’s green investment behaviors may be reactive and strategic, potentially diverting from the optimal level of green investment. This divergence could result in inefficient green investments, leading to a misallocation of resources. It is widely recognized by scholars and policymakers that corporate financial sustainability (CFS) plays a pivotal role in sustainable economic development and social welfare. The fragility of financial sustainability can pose a significant risk to social welfare, among other things [4,5]. Firms can optimize their financial sustainability by enhancing investment efficiency and the net present value (NPV) of their projects. This study introduced an innovative dimension to the green investment efficiency literature by quantifying green investment efficiency, utilizing an improved Richardson residual econometric model. This broadened the empirical literature on correlated policy evaluations by comprehensively appraising the implications of the 2018 environmental tax reform on both the scale and efficiency of corporate green investments.
Secondly, we employed the difference-in-differences (DID) approach, set the experimental and control groups by introducing a dummy variable based on whether the region in which the firms were situated raised the environmental tax rate following the reform in the environmental protection tax, and utilized the year 2018 as the temporal cutoff. This identification strategy offered certain advantages. A majority of existing studies evaluating the policy related to this environmental tax reform relied on industry-wide samples. The division between the experimental and control groups was based on whether the firms belonged to heavily polluting industries [6,7,8,9,10]. Non-polluting industries may serve as less optimal control groups, given they typically comprise sectors with minimal environmental impact, such as information technology, finance, and education. These are starkly different from heavy polluting industries like coal, steel, chemical, and petroleum, particularly in regard to corporate governance, financial decision-making, and environmental regulation by the government. When considering green investment and innovation, their investment needs and motivations bear fundamental divergences. Consequently, we focused our research on heavy polluting industries, rather than the entire industrial sector, as heavy polluters are more responsive to environmental taxes. Moreover, the primary objective of the environmental tax reform is to encourage emission reduction, improve environmental management for heavy polluting enterprises, and foster their transformation towards sustainable development. Crucially, we made further differentiation between the treatment and control groups based on whether the region amplified environmental tax. This enabled us to delve deeper into the policy effect of the environmental tax increase in terms of the intensive margin rather than the extensive margin. Several recent studies have recognized this identification issue for improvement [11,12,13]; however, the scope of these studies remains limited, and the efficiency of green investment has yet to be examined.
Thirdly, this study examines the differential impact of environmental taxes on the augmentation of excessive green investment, specifically by assessing the severity of the corporate agency problem. It further explores the potential of mitigating the distortionary influence of such taxes on green investment efficiency through addressing these agency problems. In doing so, this study offers insights into catalyzing more efficient green investment. Meanwhile, the empirical evidence regarding the effects of China’s environmental tax policy also provides valuable policy implications for other countries. As policymakers, governments can provide tax exemptions or financial incentives to companies with high green investment efficiency, and based on scientific principles, formulate more scientific environmental regulatory policies respecting the market characteristics, promoting the sustainable development of both enterprises and the environment. As corporate decision-makers, they can enhance the efficiency of green investment in businesses by effectively implementing measures aimed at addressing agency problems, such as improving corporate decision-making transparency, strengthening accountability systems, and bolstering regulatory measures.
The remainder of the paper is organized as follows. Section 2 describes the policy context, reviews the relevant literature, and formulates the hypotheses. Section 3 illustrates the research sample, details the variables, and defines the empirical model. Section 4 presents the empirical findings, robustness checks, and heterogeneity analyses regarding the environmental tax reform’s influence on both the scale and the efficiency of green investment. Finally, Section 5 concludes the study.

2. Institutional Background and Literature Review

2.1. Background of the EPTL Policy

Since the 1970s, China has witnessed a transformative evolution in the collection of environmental protection taxes, transitioning from a fee-based mechanism to a tax-oriented structure. The inception of China’s pollutant discharge fee mechanism took place in 1979, and in 2018, the formal execution of the Environmental Protection Tax Law brought an end to almost four decades of pollution fee levies, marking the significant transition from a fee to a tax regime.
Tracing back to 1978, China instituted a pollution fee structure at the legislative level. This system required enterprises to pay fees for various types of pollutants that exceed the national legal standards, based on the quantity and concentration of their emissions. In 1982, the fee collection standards, objectives, and procedures were explicitly defined, leading to a nationwide implementation of the pollution fee framework, which has since been continually reformed. Alongside this, China has enacted a series of complementary policies, encompassing pollution permits, pollution rights trading, and volatile organic compound (VOC) emission fees. For instance, a total of 12 provinces have obtained approval from the central government to pilot the use and trading of pollution rights on a reimbursable basis. Concurrently, 16 provinces have initiated their own pilot programs, with the details outlined in Appendix A. Collectively, these policy endeavors are targeted at strengthening environmental governance, reducing pollution levels, and fostering sustainable development throughout China. These efforts are grounded in market principles, emphasizing the importance of sustainable practices and aligning economic incentives with environmental goals.
The Environmental Protection Tax (EPT) was officially incorporated into China’s modern tax system in 2018. Although some basic provisions are similar to the previous pollutant emission fees, the EPT has made significant progress in terms of collection and management procedures, revenue management, and tax reductions and exemptions. Most importantly, local authorities in various provinces have begun to implement localized tax rates, collection techniques, and standards for the EPT, leading to noticeable regional differences. Compared to the pollutant emission fee system before 2018, the environmental tax rates in 12 provinces have increased, while 19 other regions have strictly adhered to the absolute sense of tax burden neutrality, keeping the burden of the environmental tax at the original level.
Specifically, Beijing implements the highest statutory tax limit, ranking first in the country in terms of the intensity of its government environmental regulations. This is closely followed by Tianjin. Some regions have implemented differentiated tax standards, mainly of two types. The first is the tiered system represented by regions like Jiangsu and Hebei, which divides the jurisdiction into several tiers according to the economic level and pollution conditions, applying different tax amounts, respectively. The second is the pollutant classification system represented by Shandong, Shanghai, and five other provinces, which applies different tax standards specifically for ammonium nitrogen, heavy metals, phosphorus, and the chemical oxygen demand (COD) in water pollutants and nitrogen oxides, sulfur dioxide, heavy metals, etc., in air pollutants. This differentiated method of levying environmental taxes is more flexible and enhances the regional adaptability of the policy. In addition to this, 12 provincial administrative units, including Heilongjiang, Jilin, Liaoning, Anhui, Xinjiang, and others, implement the statutory minimum tax standard. This reform provides a quasi-natural experiment, with areas with similar tax burdens and those with increased tax burdens serving as the control and treatment groups, respectively, offering valuable opportunities to study the impact of environmental taxes on the investment behaviors of heavily polluting enterprises. Appendix B provides a comprehensive introduction to the applicable tax rates in each region.

2.2. Literature Review and Hypothesis Development

The relevant literature stems from two main branches. The first branch focuses on the impact of environmental taxes. Porter’s hypothesis posits that environmental regulation not only advocates for environmental preservation but also propels firms to innovate, subsequently enhancing productivity. This, in turn, escalates operational efficiency, thereby counteracting the increased costs incurred from environmental regulations and improving operational efficiency [14]. Currently, there is growing attention on empirical studies examining the effects of stricter environmental regulations resulting from environmental tax reforms. A substantial body of literature has inferred an array of positive effects of environmental taxes on firms. For instance, environmental taxes have been observed to stimulate green innovation [7,11], bolster productivity [9], spur environmental investment [15,16], improve market competitiveness [10], enhance firm performance [12], assist in de-capacities [8], and advance corporate environmental social responsibility [13].
Nevertheless, it is important to note that other studies have discovered that environmental tax reforms could potentially serve as disincentives. For instance, while they yield favorable emission reductions, they may do so at the expense of production [17], impose additional costs that crowd out investment [18], inhibit innovation [6,19], impair exports [20], obstruct productivity enhancements [21,22], diminish firm competitiveness [23,24], displace employment with adverse impact on the local labor market [25], and exhibit negative effects on economic development [26].
Additionally, with regard to the carbon tax implemented in countries outside of China, extensive literature focuses on how businesses respond to the carbon tax levied for achieving zero emissions and combating global climate change. Among them, the recent study by Kay and Jolley (2023) used the input–output (IO) model to generate the price and income effects of the carbon tax and found a 10–30 percent price increase among carbon-intensive industries in the US in the face of a carbon tax [27]. They also discovered that industries facing elastic pricing systems might experience a decrease in income similar to that encouraged by the carbon tax [27]. Wang et al. (2016) focused on the distributional effects of the carbon tax and how to take measures to lessen potential negative impacts [28]. They found that sectors with a higher energy intensity were more affected by a unified carbon tax, and that protective measures for these industries faced a trade-off between environmental benefits and economic growth [28].
Another string of research focused on the scale and efficiency of green investment. Currently, there is no consensus regarding the findings related to the scale of green investment. While some studies affirmed the beneficial impact of such investments on corporations [29,30,31,32,33], a body of literature also surfaced that posits a negative effect [34,35,36,37]. Additionally, current investigations into the efficiency of green investments are conspicuously scarce. The growing green investment in China has been met with skepticism regarding its efficiency [38,39,40].
The main focus of this study revolves around four primary hypotheses, as follows.
Firstly, the primary emphasis was placed on the economic incentive mechanism. It was postulated that an increase in regional environmental taxes intensified the cost of discharge for heavily polluting industries within the given region. This financial burden compels these enterprises to seek strategies for emission reduction, consequently decreasing their tax liability. Of all the potential strategies, the most significant ones include bolstering green investment, enhancing environmental protection facilities, and adopting green technologies. An additional significant avenue involves the establishment of innovative incentives. In the long run, firms will actively seek out more efficient emission solutions, engage in technological advancements, and enhance production efficiency to strengthen their market competitiveness [9,10,41,42]. Furthermore, the escalation of environmental taxes also raises corporations’ awareness of their environmental responsibilities and customer demands. Over the long term, this awareness will influence the competitive dynamics of the market in which they operate, ultimately facilitating their decision to invest in green initiatives. In light of this, we propose Hypothesis 1.
H1. 
Environmental protection tax stimulates green investment among heavily polluting enterprises.
Differential characteristics among enterprises can significantly impact the effectiveness of governmental policy interventions. The ownership structure of enterprises, as a fundamental institutional arrangement, directly influences their strategic decision-making and economic behavior. Notably, there are stark disparities between state-owned enterprises (SOEs) and non-state-owned enterprises (NSOEs) regarding business objectives, policy compliance, and social responsibility. In the realm of environmental protection policies—which reflect the government’s intent—SOEs shoulder greater social responsibility and are subject to more stringent environmental regulations [43,44]. Consequently, they are more motivated to undertake green investments. Additionally, SOEs, in general, maintain stronger political ties with local governments. This political connection often encourages businesses to align more closely with local government policy orientations, spurring additional motives to enhance environmental investment, thereby positively influencing green investment [45]. In contrast, NSOEs, in their quest to maximize profits, often lack the motivation to invest in environmental protection in the absence of rigorous environmental regulations. Hence, following the implementation of the new environmental tax reform, designed to enforce stricter environmental regulation and higher collection standards, SOEs experience more substantial policy impacts and a pronounced policy effect. Such enterprises are thereby compelled to increase their green investment significantly and seek strategies to minimize their tax obligations. In light of this, we propose Hypothesis 2a.
H2a. 
The impact of the environmental protection tax on green investment is significantly more pronounced for the firms that are state-owned.
Secondly, financial constraints refer to the challenges that businesses face while securing external financing. These constraints play a significant role in shaping their financial decision-making. More stringent financial constraints may curtail a firm’s ability to update equipment and make investment decisions. Enterprises confronted with high financial constraints, owing to the impediments from acquiring external financing, could be restricted in their ability to modernize environmental equipment and execute green investment plans. Simultaneously, businesses under severe financial constraints might be subjected to elevated lending rates, thereby escalating their financing costs. This, in turn, could further constrict the scope of feasible debt a firm can withstand, thus impinging on their capacity for green investment. As a result, the impact of higher environmental tax rates compelling firms to amplify green expenditures is more discernible in firms with lower financial constraints. Post-environmental tax reform, the scale of investment in these less financially constrained enterprises undergoes a notable surge. In light of this, we propose Hypothesis 2b.
H2b. 
The impact of the environmental protection tax on green investment is significantly more pronounced for the firms that are less financially constrained.
Furthermore, the degree of regional environmental protection governance is intimately linked with the green investment status of heavily polluting firms prior to the reform. In regions characterized by inadequate environmental protection governance, the firms that possess a low environmental protection awareness or lack incentives for green investment strive to avoid their tax burden. Confronted with an escalated tax strain and rigid tax regulations following the environmental protection tax reform, these enterprises are compelled to strategize and amplify their green investments. Consequently, the environmental tax reform produces a more pronounced incentivizing effect on the enterprises situated in regions with a limited environmental governance capacity. In light of this, we propose Hypothesis 2c.
H2c. 
The impact of the environmental protection tax on green investment is significantly more pronounced for the firms that are situated in regions with a deficient environmental governance capacity.
Compared to the other forms of investment, green investment is typically characterized by high costs and low immediate returns. The increase in green investment prompted by the environmental tax acts as an incentive due to external pressure. This motivation is primarily driven by the necessity to comply with governmental regulations and to preserve the company’s reputation. In such circumstances, cash flow is often not optimally utilized [46,47], and firms are more prone to making excessive capital investments. These new investments may deviate from the principles of economic efficiency and optimal capital utilization, thus diminishing investment efficiency and resulting in excessive green investment. For companies already grappling with overinvestment, this could further compromise the efficiency of green investments, possibly redirecting funds from non-green investments that could have contributed to net worth growth, towards green investments that may not be efficiently allocated. Conversely, firms that have underinvested are contending with amplified cash flow constraints, and the incentives proposed by the environmental tax are comparatively minor, leading to a limited propensity towards inefficient green investment. In light of this, we propose Hypothesis 3.
H3: 
The environmental protection tax diminishes the green investment efficiency of heavy polluters and exacerbates overinvestment.
Principal-agent problems are prevalent in contemporary corporate systems and often have a significant impact on investment efficiency. In the situations where the interests of the manager and the firm’s shareholders diverge, the manager may deviate from the optimal portfolio due to personal interests. In situations where the interests of a manager and the firm’s shareholders diverge, the manager may opt for a portfolio that deviates from the optimal choice, propelled by personal interests [48,49,50,51]. Such friction typically incurs greater losses in investment efficiency. Therefore, firms with more pronounced agency issues are more susceptible to ill-judged investment decisions by managers, with a higher propensity for large, inefficient green investments spurred by environmental taxes. In light of this, we propose Hypothesis 4.
H4: 
The distortionary impact of the environmental tax on green investment efficiency is more pronounced for heavily polluting enterprises with more serious agency problems.

3. Data and Research Design

3.1. Data and Sample Selection

To conduct an exhaustive exploration of the multifaceted impacts of the 2018 Environmental Protection Tax Law on corporate green investment behavior, our study focused on a sample of companies operating in heavily polluting industries, which were particularly sensitive to environmental protection tax reforms. These industries were clearly identified by the Chinese Ministry of Environmental Protection in 2008 and included sectors such as thermal power, steel, cement, electrolytic aluminum, coal, metallurgy, chemical engineering, petrochemicals, building materials, papermaking, brewing, pharmaceuticals, fermentation, textiles, tanning, and mining. Adopting this classification, we selected heavy polluting enterprises listed on the A-share market of the Shanghai and Shenzhen stock exchanges to form our research sample. Furthermore, it is important to note that significant adjustments were made in China’s environmental regulatory framework after the 18th National Congress in 2012. Thus, our research sample spanned from 2012 to 2020, covering this period of regulatory changes. We obtained financial data at the firm level from Wind and the China Securities Market and Accounting Research (CSMAR) database. Complementary to this, the data on environmental investments was exacted from the annual reports of the listed firms, while provincial-level data regarding the degree of regional environmental protection governance was sourced from the China Statistics Bureau.
Our sample underwent several filtering procedures as follows. (1) We excluded firms listed after 2012. (2) Firms exhibiting abnormal ST and ST* statuses were removed from the analysis. (3) Firms with substantial missing financial data were excluded. (4) To minimize the impact of extreme values on the empirical findings, all the continuous variables in the study were winsorized at the first and 99th percentiles. Our final sample consisted of 3193 valid firm-year observations.

3.2. Variables

3.2.1. Dependent Variables

(1)
Level of green investment
The primary explained variable addressed in this paper was corporate investment behavior, firstly specifically focusing on the scale of corporate green investment (GI) in the benchmark model. The 26 specific green investment expenditure items encompass various aspects, including environmental protection facilities and equipment, environmental protection technology enhancement, wastewater facilities, waste gas facilities, dust removal facilities, dust facilities, waste residue facilities, heavy metal treatment costs, noise treatment costs, wastewater treatment costs, waste gas treatment costs, waste residue treatment costs (including solid waste), facility operating costs, sewage charges, greening fees, environmental protection fees, water resources compensation fees, mineral resources compensation fee (including environmental restoration deposit), soil and water conservation and ecological construction, reclamation, environmental assessment, environmental protection research and development, online monitoring (including monitoring fee), environmental protection training fee, hazardous waste disposal fee, and others. This measure is standardized based on the annual operating incomes of the firms. As part of a robustness analysis, we recalibrated the environmental investment indicator by constructing an alternative indicator, GI_2, using the total assets instead of the total operating incomes. This involved multiplying 100 by the total amount of the firm’s environmental investment divided by the total assets at the end of the year.
(2)
Efficiency of green investment
In an ideal market scenario, optimal corporate decisions aim to maximize corporate value. Unfortunately, the reality is often far from this ideal. The investment behavior of firms is often influenced by various factors, including internal factors such as business strategy and financial status, as well as external factors such as the institutional environment and government intervention. These factors can lead to suboptimal investment decisions, resulting in deviations from the optimal level. This paper employed Richardson’s (2006) residual econometric model, which assesses investment efficiency based on cash flow, to quantify and measure the green investment efficiency of heavily polluting enterprises [52]. The essence of the Richardson residual econometric model is to use residuals to measure the degree of inefficiency in corporate investment, overcoming the difficulty of quantifying the degree of inefficiency. Richardson (2006) constructed an optimal investment model using an accounting approach, which contains related explanatory variables such as investment opportunities, the asset–liability ratio, cash flow, company size, company operation years, stock returns, and the previous year’s incremental investment [52]. The appropriateness of this approach lies in the alignment between green investment decisions and the core business of enterprises. The model effectively gauges the sensitivity of green investment to cash flow, and simultaneously measures the extent of divergence of green investment from the optimal level. Specifically, it enables the detection of underinvestment and overinvestment in green initiatives. The regression model of green investment efficiency employed in this study is outlined below.
G I i c t = α 0 + α 1 T o b i n Q i t 1 + α 2 L e v i t 1 + α 3 R o e i t 1 + α 4 C a s h f l o w i t 1 + α 5 I n v i t 1 + α 6 a g e i t 1 + α 7 S i z e i t 1 + I n d c + Y e a r t + ε i c t
In Model (1), i represents the firm, c represents the industry, and t represents the year. The variable GI represents the level of green investment by the firm each year. Among the explanatory variables, TobinQ represents the firm growth, Lev represents financial leverage, Roe represents profitability, Cash represents the cash flow ratio, age represents the number of years the firm has been listed, and Size represents the firm’s size. t − 1 represents a lag of one year for the variables, and the industry and year fixed effects are controlled. The residual ε_ict indicates the discrepancy between the optimal investment size and the actual executed investment. The absolute value of this residual, referred to as investment efficiency, is denoted as the variable GI_E. A larger absolute value of GI_E indicates a higher degree of deviation and, therefore, lower investment efficiency. Following the prior studies [26,50,52,53], we classified a positive residual as overinvestment and a negative residual as underinvestment in green initiatives based on the sign of the residual.
Figure 1 visually depicts the distribution of green investment efficiency in both the overinvestment and underinvestment sub-samples. A notable asymmetry was observed in the distribution of both sub-samples, with the degree of deviation ranging from 0 to 3.3 for green underinvestment and zero to four for green overinvestment. Within the zero to one range, the density of green underinvestment was significantly higher than that of overinvestment, indicating a more centralized distribution. Conversely, green overinvestment exhibited a more diverse dispersion, suggesting that the prevalence of deviation in green overinvestment was higher, with a greater variance in the degree of deviation. This implied that green overinvestment was more generally prone to efficiency deviations. The significant distribution patterns and characteristics of efficiency deviations in the green underinvestment and overinvestment samples yielded insightful information, aiding us in further comprehending the heterogeneous impacts of environmental taxes on green underinvestment and overinvestment.

3.2.2. Variable of Interest

The core explanatory variable ( P o s t t × T r e a t j ) in this paper is the difference-in-differences (DID) interaction term between ( P o s t t ) “before and after the point of policy” and ( T r e a t j ) “whether it is in the province where the tax burden is raised”. For the firms in the province where the tax burden of environmental protection was raised, ( T r e a t j ) was assigned a value of 1. Otherwise, it implied that the firm’s tax burden remained unchanged after the reform and was not affected, and ( T r e a t j ) was assigned a value of 0. The official implementation of the Environmental Protection Tax Law occurred in 2018. Thus, ( P o s t t ) takes the value of one if after 2018; otherwise, it takes the value of zero.

3.2.3. Control Variables

In this study, we controlled various dimensions such as corporate structure, financial status, and corporate governance. We have selected the following 10 indicators as the control variables.
(1)
Firm size (Size): This was measured as the logarithm of the firm’s year-end assets, indicating resource endowment and risk tolerance. Larger firms, given their advantages, tend to invest more in environmental protection. They are also more likely to be scrutinized, and thus more attentive to environmental concerns.
(2)
Age (Age): This was measured as the natural logarithm of the years since the public listing. Different life cycle stages of a firm influence its investment preferences. We anticipate that firms in mature stages, with well-established governance mechanisms, are more likely to invest in environmental protection due to potential innovation benefits and positive societal responses.
(3)
Financial leverage (Lev): This was measured as the total liabilities deflated by the total assets, depicting the company’s risk resistance and its influence on financing and investment decisions. High financial leverage may deter firms from proactively investing in environmental protection to avoid potential losses.
(4)
Cashflow Ratio (Cashflow): This was calculated as the net cash flow from annual operating activities divided by the total assets. It reflects the firm’s cash obtainability, which affects the performance assessment and the confidence to increase investment levels, including investment in green initiatives.
(5)
Profitability (Roe): This was measured as the ratio of the total net profit to the average total net assets, indicating corporate profitability. A higher value suggests stronger profitability and a greater capacity for green investment.
(6)
Growth (TobinQ): This was measured as the ratio of the firm’s market value to its total assets. A higher Tobin’s Q implies better growth prospects, which encourages firms to uphold legal compliance and social responsibility, including green investment.
(7)
Shareholding Concentration (Top10): This was measured as the ratio of the total shares held by the top ten shareholders to the total issued shares of the company. It reflects the dispersion of corporate control, affecting corporate decisions, investments, and distributions. A high shareholding concentration may suppress environmental investment due to its inherent high costs and low returns.
(8)
Proportion of Independent Directors (Indep): This is the ratio of independent directors to the total board seats and reflects the governance structure of the firm, thereby influencing its investment decisions.
(9)
Institutional Investor Shareholding (Inst): This is the proportion of shares held by institutional investors in relation to other shareholders, reflecting market confidence in the company’s operations. The support and advice of institutional investors can also influence corporate investment decisions.
(10)
Agency Cost (AC): This was measured by the rate of management expenses. Lower agency costs often reflect serious principal-agent problems, which can impact both the level and efficiency of green investments.

3.2.4. Other Variables

We also delved into the heterogeneous impacts of the environmental protection tax reform on the investment behaviors of heavy polluters. To facilitate this, we have formulated five distinct subgroup dummy variables: (1)–(3) were designed to analyze the heterogeneity related to the levels of green investment and (4)–(5) examined the efficiency of this green investment. The relevant variables are as follows.
(1)
Nature of property rights (Soe): State-owned enterprises were conferred a value of 1, with all others receiving a value of 0.
(2)
Regional environmental governance level (EG): The formula we used to measure it was to divide the total investment completed in industrial pollution control in that province in a given year by the added value of the industry in that province. Here, the total investment completed in industrial pollution control refers to the funds used to form fixed assets in the investment of industrial pollution source control and urban environmental infrastructure construction. This includes investment in the control of new and old industrial pollution sources, investment in environmental protection that is concurrent with the project’s construction, and funds invested in urban environmental infrastructure construction.
The regions with ratios at or above the median were classified as strong governance regions and assigned a value of 1. Conversely, those below the median were considered weak governance regions and given a value of 0.
(3)
Financing constraint status (D_fc): Following the methodology of Whited and Wu (2006) and Hadlock and Pierce (2010), we calculated the FC and WW indices [54,55]. Details outlined in Appendix C The absolute values of these indices served as measures of a firm’s financing constraints. A higher index value indicated greater financing constraints. Firms with values above the median were categorized as having high financing constraints and were assigned a value of 1. Those below the median were classified as low financing constraint firms and were assigned a value of 0.
(4)
Executive shareholding status (D_Mshare): The executive shareholding ratio was equal to the total number of shares held by executives divided by the total number of outstanding shares. A higher executive shareholding ratio suggested fewer conflicts of interest between managers and shareholders, thereby indicating fewer agency problems within the company. For the firms with an executive shareholding ratio above the median, the executive shareholding statuses were assigned a value of 1, while those below the median were assigned a value of 0.
(5)
Agency cost status (D_AC): We used the management expense ratio as a measure of a firm’s agency cost. The ratio was obtained by dividing the management expenses by the total operating revenues. Firms with an agency cost ratio above the median were assigned a value of 1, whereas those below the median were assigned a value of 0. Lower agency costs were correlated with a higher propensity for agency issues.

3.2.5. Descriptive Statistics

Table 1 summarizes the descriptive statistics for our sample, detailing the distribution of the available data. Over the 2012–2020 period, the mean values of GI and GI_2, representing the scale of environmental investment of the listed companies in the heavy pollution industry, standardized by their revenues and total assets, were 0.2466 and 0.6826, respectively. Both exhibited standard deviations of approximately 1.3 and 1.5, respectively, and the mean value of green investment efficiency (E_GI) was 0.0286, with a standard deviation of 0.0345, signifying that the level and efficiency of green investment substantially varied among the firms. This variation provided sufficient fluctuations for the regression analysis. On average, the leverage (Lev) of the enterprises was approximately 46.2%; the mean value of the net profit margin (ROE) was 4.4%; and the mean value of cash flow (Cash) was 0.0614, equivalent to 6% of the total assets. The proportion of state-owned enterprises (SOEs) was 50.52%, and the top ten shareholders generally held more than half of the total shares, resulting in robust equity stability. It is important to note that the mean value of the DID was 0.09, which was relatively small. This was because our research sample spanned the years 2012 to 2020, and the environmental fee-to-tax reform was implemented in 2018. Consequently, there were fewer post-reform observations in the sample.

3.3. Research Design

The Environmental Protection Tax Law of 2018 was enacted upon the preceding reform of the sewage fee regime and introduced a new policy that grants local governments a certain degree of autonomy in setting tax rates. The shifting burdens of environmental protection tax throughout the provinces, both preceding and succeeding the reform, exhibited notable disparities. Certain regions experienced an augmentation in their environmental tax obligations, whereas others maintained a relatively static burden. This divergence provided an unparalleled experimental and control group for our empirical investigations. Building upon the quasi-experimental event of the Environmental Protection Tax Law in 2018, we utilized a difference-in-differences model to examine the impact of the reform on the investment behaviors of heavily polluting enterprises. Our baseline model is as follows.
y i j c t = β 0 + β 1 P o s t t T r e a t j + α C o n t r o l i j c t + γ j + λ t + μ c + ε i j c t
Here, I denotes an individual, j represents a province, c signifies an industry, and t indicates a year. The investment behavior of firm I in year t is symbolized by y i j c t . This model will form the basis for further exploration of the efficiency of firms’ green investment in the extended analysis section. The dummy variable at a specific point in time is denoted by P o s t t while T r e a t j represents a subgroup dummy variable. The key explanatory variable, the DID interaction term, is symbolized by P o s t t × T r e a t j . C o n t r o l i j c t constitutes the set of control variables. The province fixed effects, time fixed effects, and industry fixed effects are represented by γ j , λ t , and μ c respectively. Lastly, ε i j c t is the disturbance term.

4. Empirical Results

4.1. Environmental Tax and Level of Green Investment

4.1.1. Baseline Regression

To examine the impact of the environmental protection tax reform on the investment behavior among heavy polluting firms, we began by conducting an empirical regression analysis. In this analysis, we used the level of corporate green investment as the explained variable. Table 2 presents the results of the baseline regression of the DID model, focusing on the coefficients of the interaction terms of Post × Treat. In column (1), we regressed the core explanatory variables while only controlling for the year, province, and industry fixed effects. Column (2) extended the analysis by including individual firm fixed effects into the previous model. The coefficients in both columns were found to be significantly positive, indicating that heavy polluters in regions where taxable pollutant levies have been increased tended to expand their green investments after the implementation of the reform. Column (3) presents the regression results when simultaneously controlling for all tiers of fixed effects, including the year, province, and industry fixed effects. Here, the coefficient of the interaction term was 0.727, significant at the 1% level. This suggests that, under the influence of the 2018 environmental protection tax policy, the scale of green investment by heavy polluting firms in the regions with increased environmental protection tax burdens increased by an average of approximately 0.7% compared to the regions where the taxable pollutant levy standards remain unchanged. Such findings reinforced the inference that the environmental protection tax policy notably incentivizes environmental protection investment among heavy polluters, thereby verifying Hypothesis 1.
This was generally consistent with most prior studies, even though the identification methods and data we used were not the same. For instance, similar conclusions have been made by Liao and Shi (2018), and Liu et al. (2022) that the environmental tax stimulates environmental investment [15,16]. Among them, Liao and Shi (2018) adopted a narrow concept of green investment, considering it as investment in traditional hydropower and environmental pollution control [15]. However, this was in contrast with the findings of Albrizio et al. (2017) who discovered that environmental taxes could introduce additional costs, thus crowding out investment [18].

4.1.2. Robustness Checks

(1)
Parallel trends
In this subsection, we conducted several robustness tests to ensure the reliability of our findings. The DID model necessitated a parallel trend assumption to ensure an accurate identification. For our study, we must confirm that, prior to the official implementation of the Environmental Protection Tax Law in 2018, a common trend in the level of green investment between the experimental and control groups existed, implying no significant difference. We employed the empirical strategy of an event study methodology and formulated the following regression equation.
y i j c t = β 0 + β 1 P o s t t 2018 T r e a t j + β 2 D 2012 t T r e a t j + β 3 D 2013 t T r e a t j + β 4 D 2014 t T r e a t j + β 5 D 2015 t T r e a t j + β 6 D 2016 t T r e a t j + α C o n t r o l i j c t + γ j + λ t + μ c + ε i j c t
Since the reform was officially enacted in 2018, we set 2017 as the baseline year. D2012 to D2017 are dummy variables, with the associated coefficients of their interaction terms measuring the disparity in the investment behavior between the experimental and control groups within a specified year. All the other variables were set up following the same approach as our baseline model for green investment (2). The first column of Table 3 presents the regression results. The coefficient for our core explanatory variable was 0.712, significant at a 0.1 level and remarkably similar in magnitude to the coefficient estimate of our benchmark model. Simultaneously, the coefficients on the interaction terms with the treatment group were not statistically significant for any of the years prior to 2018, suggesting a common trend in green investment among both groups pre-reform.
Furthermore, we plan to delve into the dynamic effects of the 2018 environmental tax reform by utilizing the event study methodology, and the augmented regression model is as follows.
y i j c t = β 0 + t = 2012 2020 β t D t T r e a t j + α C o n t r o l i j c t + γ j + λ t + μ c + ε i j c t
where D t denotes a year-specific dummy variable. As 2017 serves as the baseline year, it is consequently excluded from the regression analysis. The findings, presented in the second column of Table 3, illustrated that subsequent to the reform in 2018, there was a significant ascension in the green investment levels in the treatment group, a trend which extended until 2019, albeit with a non-significant stimulus effect observed in 2020. The policy impact did not exhibit a significant delay. Overall, these results confirmed that the implementation of the environmental protection tax policy served as a positive incentive for promoting environmental investment behavior among heavily polluting enterprises, and these results were robust.
(2)
Concern for endogeneity
In order to validate the reliability of our regression results, we conducted several robustness checks, which included substituting the explanatory variable measures, removing concurrent policy disruptions, and addressing potential endogeneity concerns using propensity score matching—difference-in-differences (PSM–DID), along with further control for firm-specific fixed effects.
Firstly, it is noteworthy that potential endogeneity issues stemming from the selection of our sample may be present, which we aimed to alleviate through the employment of propensity score matching. The regression results of the difference-in-differences (DID) model, applying the matched sample, are presented in the first column of Table 4. The DID coefficient estimate was 0.302, which was statistically significant, underscoring the reliability of our baseline model’s identification. Secondly, the omitted variables can also introduce endogeneity issues. The precise measurement of firm-level investment preferences and risk-monitoring capabilities was challenging. Thus, we additionally incorporated firm fixed effects into our baseline regressions to mitigate potential influences from firm-specific factors that remained unchanged over time. The regression results, reported in column (2) of Table 4, indicated a significant coefficient estimate of 0.289 for the DID interaction term at the 0.1% level. Overall, these robustness tests reinforced the reliability of our regression findings.
(3)
Using alternative measures of GI
In the benchmark regression of this study, the green investment (GI) indicator was derived by multiplying 100 by the total volume of a company’s environmental investment and then dividing this by the company’s annual total operating incomes. We proposed to recalibrate this environmental investment index by substituting the total operating incomes with the total assets. This alternative measure was denoted as GI_2. The primary measure was standardized to depict the magnitude of the company’s green investment over an entire accounting period. Conversely, the year-end total assets provided a static reflection of the enterprise’s financial status, and this new indicator (GI_2) could depict the relative scale of a firm’s green investment at the close of the accounting year. Each has its own advantage over the other. The regression results, obtained after replacing with the explanatory variable (GI_2), are presented in Table 4, column (3). These results mirrored the benchmark model’s significantly positive results. Specifically, the regression coefficient for the core variable in column (3) was 0.67, significant at the 1% level.
(4)
Accounting for industry-specific policies
Additionally, to account for the influence of industry-specific policies implemented in China during our sample period, we incorporate two interaction terms: one between the industry and the time trend, and the other between the industry and the squared time trend. This approach aided in mitigating potential confounding factors and excluded alternative explanatory possibilities. The results of these regressions are presented in column (4) of Table 4. The estimated coefficient for the DID variable was 0.739, statistically significant at the 1% level. In conclusion, we strived to bolster the reliability of our empirical analyses by investigating the causal relationship between environmental tax and the enhancement in green investment based on the robustness test results covering various aspects of the research methodology and variable construction.

4.1.3. Heterogeneity Analysis

To further investigate the varying effects of the environmental tax reform on the environmental investment behavior of heavily polluting firms with different attributes, we conducted regressions based on different sub-samples by the internal composition and external constraints.
(1)
Differentiating firms based on the nature of their property rights
Acknowledging that enterprises of different property rights exhibit vast disparities in business philosophy and government relations, which may result in distinct effects of environmental protection tax policies on their green investment behavior, we conducted regressions for sub-samples on the basis of their state-owned and non-state-owned status. The results are presented in columns (1) and (2) of Table 5, respectively. Our findings indicated that the coefficients of the interaction terms were significantly positive across both groups. Specifically, the estimated coefficient for state-owned enterprises was 1.101, which was significantly higher than the coefficient estimate of 0.448 for non-state-owned enterprises. This suggests that environmental tax had a more profound influence on green investments in state-owned enterprises. On one side, state-owned enterprises shoulder greater social responsibility and encounter more government environmental regulation pressure. On the other side, these enterprises typically maintain tight political links with local governments, aligning more closely with the policy directions of these governments, and might have other incentives to augment their investment in green initiatives. In conclusion, the introduction of the 2018 environmental protection tax law had a more powerful impact on green investment of state-owned enterprises, thereby verifying Hypothesis 2.
(2)
Differentiating the firms based on the tightness of their financial constraints
Building upon the prior studies by Whited and Wu (2006) and Hadlock and Pierce (2009), we calculated the FC and WW indices, using the absolute magnitudes of these indices as a measure of a firm’s financial constraints [54,55]. A higher value of the indices signified greater financial limitations experienced by the firm. Based on these indices, we categorized the study sample into two groups. Firms exceeding the median index value were designated as having more pronounced financial constraints, while those below were identified as experiencing fewer financial constraints. Severe financial constraints can hinder firms’ capabilities to renew their equipment, make informed investment choices, and respond to green investment incentives triggered by environmental taxes. The regression results are reported in Table 6, and columns (1) and (2) correspond to the firms with high and low financial constraints, respectively. The coefficients for the interaction term estimates were 0.541 and 1.011, which were notably significant at the 1% level, with a significant divergence in the sizes of the coefficients. This disparity suggests that the environmental tax reform wielded a considerably stronger impact on firms with fewer financial constraints, and a limited effect on firms with more stringent financial constraints. The results of the heterogeneity analysis, based on the definition of the WW index value, are presented in columns (3) and (4). These results portrayed similar traits and drew parallels with Hypothesis 2.
(3)
Differentiating firms based on regional environmental governance
In this analysis, we delved deeper into the consideration of the potentially heterogeneous impact of external environmental governance conditions on the promotion of green investment during the environmental protection tax reform. The diverse economic development level and regulatory enforcement capacity across China’s various regions prompted us to base our groupings on the local government’s environmental governance level where the firm was located. We categorized enterprises based on whether the ratio of completed investment in industrial pollution control to the value added of the industry in the province of their location was below or above the median. The firms falling below the median were positioned in regions characterized by weaker levels of environmental governance, while those above the median were located in regions with stronger levels of environmental governance.
Table 7 presents the empirical findings of how the environmental tax reform influenced green investment in enterprises located in regions with varying environmental governance levels. The coefficient estimates were significantly positive across both sub-samples. However, the interaction term coefficient estimate was 1.069 for the firms in regions with lower environmental governance levels, which considerably surpassed the coefficient estimate of 0.448 in the other sub-sample. This indicated that the environmental protection tax served as a more powerful stimulus for green investment in enterprises located in regions with weak environmental governance. This finding verified Hypothesis 2.
For the firms situated in regions with weaker environmental governance, the introduction of the environmental protection tax exerted a more substantial impact. The tax reform policy effectively elevated the green threshold required for enterprises’ survival, thus compelling heavily polluting firms to amplify green investment to boost competitiveness. Conversely, the regulatory influence was less pronounced for firms in regions with a higher environmental governance level and a mature governance environment. These enterprises were more likely to exhibit a stronger green awareness and have better pre-existing green investment arrangements prior to the implementation of the environmental tax reform.

4.2. Environmental Tax and Green Investment Efficiency

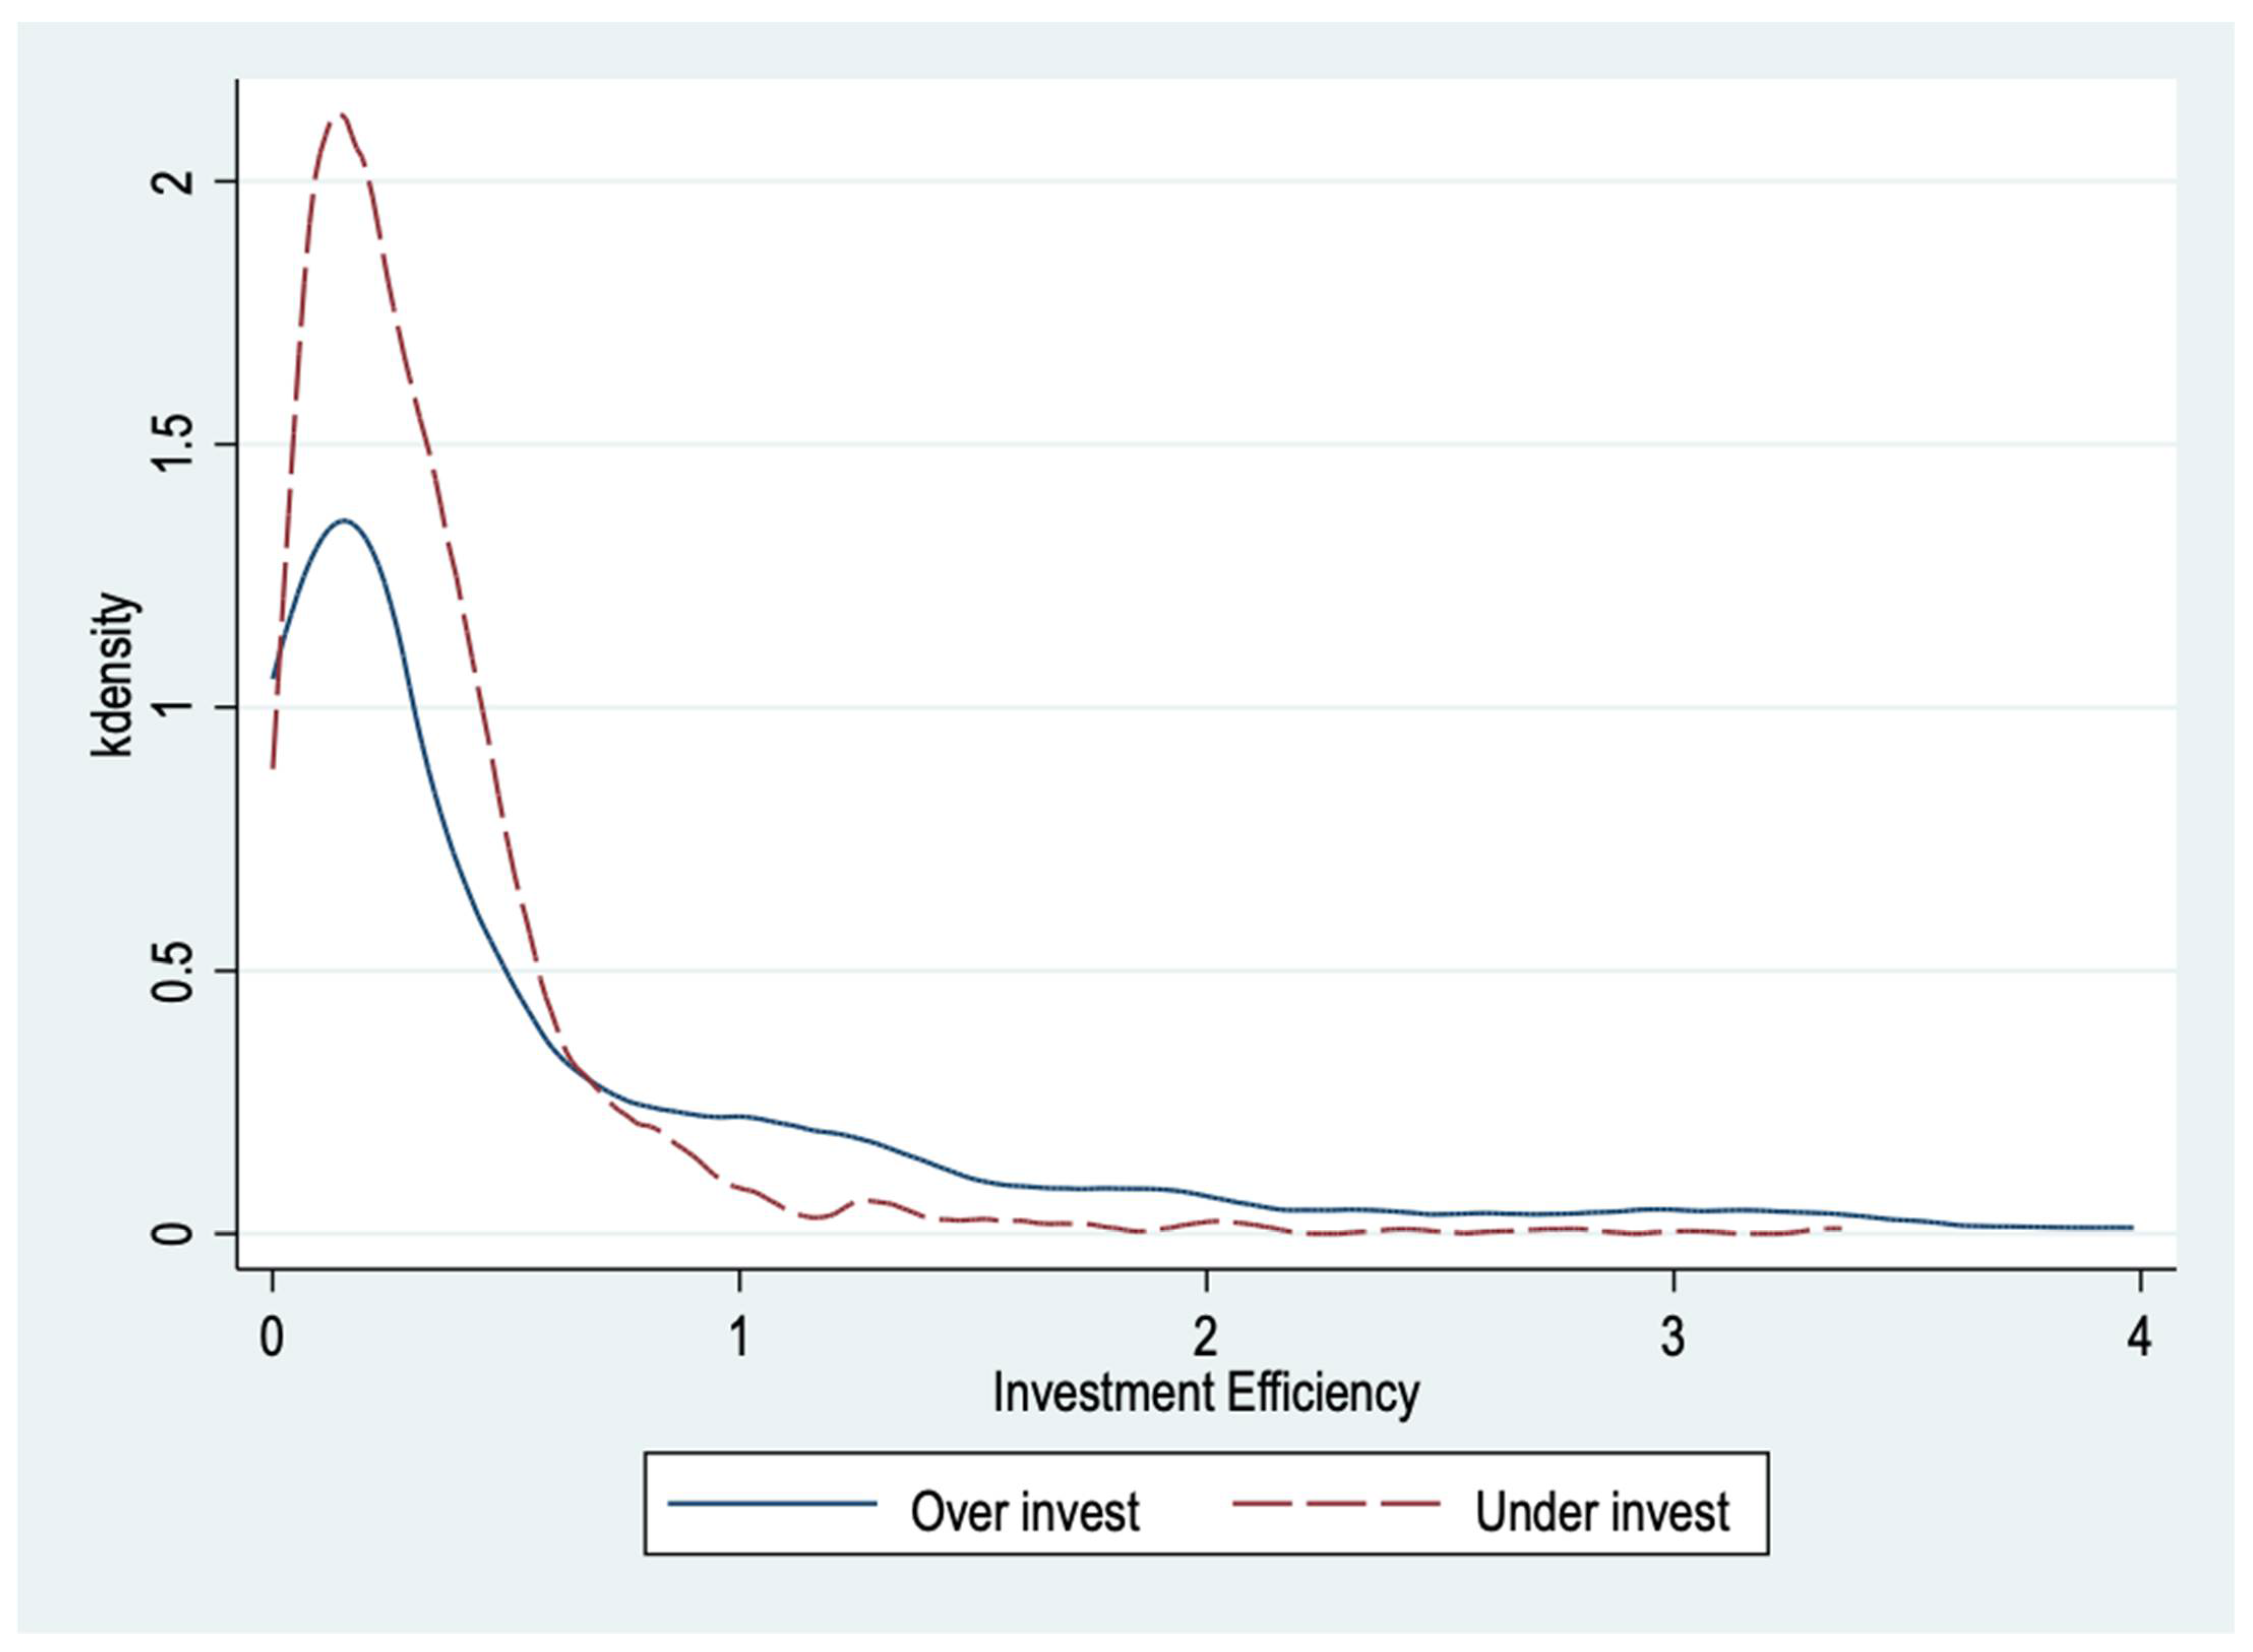
4.2.1. Overinvestment vs. Underinvestment

In this section, we further expanded the scope of the investment behavior analysis of heavy polluting firms and discussed the impact of the 2018 Environmental Protection Tax Law on these firms’ green investment efficiency. We substituted the explained variable in Equation (1) with the green investment efficiency ( I n v e i j c t ) to assess whether the environment tax exacerbated the inefficient green investments of heavily polluting firms. We constructed the following model (5).
I n v e i j c t = β 0 + β 1 P o s t t T r e a t j + α C o n t r o l i j c t + γ j + λ t + μ c + ε i j c t
Firstly, the full sample was regressed based on model (4), followed by further regression of the sample of firms divided according to the two deviation states, i.e., overinvestment and underinvestment in green initiatives. The regression results are presented in Table 8. Column (1) regressed the full sample of firms and displayed that the coefficient of the interaction term was 0.24, significant at the 1% level. This finding implied that after the reform, the investment efficiency deviation of heavy polluting firms in regions with higher taxable pollutant levy standards increased, suggesting that the environmental tax reduced investment efficiency. Column (2) presents the regression result for the underinvestment sub-sample, and its interaction term was not significant, which suggests that the environmental tax did not significantly affect the green investment efficiency of heavy polluters with underinvestment. Lastly, column (3) exhibits the regression result for overinvestment firms, with an estimated interaction term coefficient of 0.634, which was significant at the 1% level. This result suggests that the environmental tax significantly exacerbated overinvestment in heavy polluting firms, thereby verifying Hypothesis 3.
The current research on green investment efficiency is extremely limited, and our study makes an important complement. Our research attempts to explain some of the reasons why the environmental tax’s effect on environmental improvement was found to be weak in some literature [38,38], from the perspective of green investment efficiency.

4.2.2. Parallel Trend Tests

To bolster the credibility of the regression outcomes regarding green investment efficiency, it was necessary to verify that the green investment efficiency of both the experimental group and the control group followed a common trend prior to the reform. Based on the explanatory variable settings in Equations (3) and (4) as mentioned earlier, the results are presented in Table 9. Column (1) revealed an estimated DID interaction term coefficient of 0.23, aligning with the benchmark model of green investment efficiency. The interaction term coefficients associated with the years prior to 2018 in the treatment group proved to be insignificant, thereby passing the parallel trend test. The dynamic effect estimations in column (2) revealed a decrease in investment efficiency occurring in 2020, following the 2018 environmental tax reform. This two-year lag in policy impact can be attributed to two potential factors: firstly, it was tied to the measure of green investment efficiency, where the explanatory variables in Richardson’s residual model were all lagged by one year, and green investment efficiency was appraised based on the corporate governance-related factors from the preceding period. Secondly, external environmental protection tax pressures prompted the firms initially experiencing overinvestment to reallocate non-environmental investment funds—funds that could otherwise generate net value growth—to green investments, which were less efficient, a process that takes some time to finalize. In sum, the implementation of the environmental protection tax policy exacerbated the excessive green investment of heavy polluting firms, and the regression results were robust.

4.2.3. The Role of the Agency Problem

We further explored the underlying mechanisms wherein environmental tax impacted green investment efficiency by conducting heterogeneity analyses. Drawing on the corporate agency theory [56], we conjectured that the discordance between the interests of a firm’s managers and shareholders can lead to a greater magnitude of investment efficiency deviation, precipitating an increased propensity towards overinvestment triggered by environmental taxes, particularly within firms plagued by pronounced agency issues. We aimed to examine whether the influence of environmental tax on firms’ investment efficiency fluctuated in response to varying degrees of agency problems, predicated from the state of these issues within different firms.
Firstly, we employed executive shareholding as a proxy for agency problems, as higher executive shareholding signified a greater alignment of interests between managers and shareholders [57]. The firms with executive shareholding above the median were considered to have fewer severe agency problems (assigned a value of 1), while those below the median were regarded as having more severe agency problems (assigned a value of 0). We constructed a triple difference variable (DDD) by multiplying this dummy variable for the executive shareholding status with the difference-in-differences (DID) interaction term. This variable captured the relationship between the impact of the environmental protection tax on the firms’ investment efficiency and executive shareholding, and the relevant results are reported in column (1) of Panel A, Table 10. The DDD coefficient was estimated at −0.272, which was significant at the 1% level, suggesting that the firms with fewer severe agency issues effectively mitigated the distortionary effect of the environmental tax on investment efficiency. The overinvestment exacerbation attributed to the environmental tax was more pronounced in firms with severe agency problems. The regression results for the two subgroups are reported, respectively, in columns (2) and (3) of Panel A in Table 10, indicating that environmental tax exacerbated overinvestment in the firms with low executive ownership, while investment efficiency remained largely unaltered in the firms with higher executive ownership and fewer severe agency problems, thereby verifying Hypothesis 4.
Secondly, we gauged agency costs, and consequently agency problems, via the management expense ratio. Firms with agency costs above the median were classified as having fewer severe agency problems, which were assigned a value of 1, while those below were classified as having more severe agency issues and assigned a value of 0. The regression results of incorporating the DDD variable into the model are portrayed in column (1) of Panel B, Table 10. The DDD coefficient estimate was −0.263, which was significant at the 1% level. Similar conclusions are reflected in columns (2) and (3). These findings collectively indicated that environmental tax deteriorated the investment efficiency and exacerbated overinvestment in the firms with more pronounced agency issues. Hypothesis 4 was verified again.
Thus far, based on all the regression results regarding the environmental tax reform and the level and efficiency of investment, Hypotheses 1 to 4 have all been verified.

5. Conclusions

The coexistence of environmental performance and business performance has long been a widely discussed topic among scholars. Our research found a trade-off between the growth scale of green investment and the efficiency of the investment. Taxes result in a decrease in efficiency but resolving agency issues can mitigate the distortionary effects of an environmental tax on the efficiency of green investments. Some studies based on the Organization for Economic Cooperation and Development (OECD) countries have examined this issue from various angles. Darnall et al. (2007) conducted an in-depth study on the complex relationship between the stringency of environmental policies, environmental performance, and business performance, demonstrating the potential for win–win situations [58]. Darnall et al. (2008a) found that external pressures and internal strategies can complement each other; specifically, organizations that adopt environmental management systems (EMS) are likely to extend their focus beyond their organizational boundaries and minimize the environmental impact of the entire system through the implementation of green supply chain management (GSCM) [59]. Darnall et al. (2008b) reached similar conclusions, with facilities incentivized to adopt a more comprehensive EMS when their complementary resources and capabilities experienced greater overall performance improvements [60].
It is worth noting that there are some differences between the OECD countries and China. The OECD countries are typically more mature and proactive in terms of environmental policies and practices, although China has made significant efforts and progress in environmental policies in recent years. For instance, the OECD countries usually involve a higher degree of public participation in the implementation of environmental policies. As the largest developing country in the world, China maintains rapid economic growth, but the enforcement, supervision, and longevity of its environmental policies still need improvement.
Based on our study, we propose the following policy suggestions.
On one hand, for policymakers, the government should ensure that environmental policies are based on scientific principles, creating a conducive environment for efficient green investment, stimulating sustainable economic growth while protecting the environment. For instance, the government could provide tax reductions or fiscal rewards to companies that have a high efficiency in green investment, promoting the adoption of advanced technologies to increase investment efficiency and environmental benefits. Furthermore, the government should also make efforts to address agency issues in businesses; for example, improving corporate governance, enhancing transparency, and strengthening regulatory measures through external policies.
On the other hand, for micro-enterprises, they should cooperate extensively with environmental organizations and the academic community, strengthen environmental protection awareness, and enhance internal accountability systems within the company. These measures can effectively alleviate agency problems and ensure the effectiveness of green investment. Collaborative strides amongst stakeholders are crucial for development.

Author Contributions

Conceptualization, L.Z. and Y.L.; methodology, Y.T. and L.Z.; data, Y.L. and Y.T.; writing—original draft, L.Z. and Y.L.; writing—review and editing, L.Z. and Y.T. All authors have read and agreed to the published version of the manuscript.

Funding

This research was funded by the Philosophy and Social Science Planning Projects of Anhui Province, Project Title: Research on the Dynamic Adjustment Mechanism of Personal Income Tax in China under the “Dual Circulation” Development Pattern, Approval Number: AHSKQ2021D162.

Institutional Review Board Statement

Not applicable.

Informed Consent Statement

Not applicable.

Data Availability Statement

Not applicable.

Conflicts of Interest

The authors declare no conflict of interest.

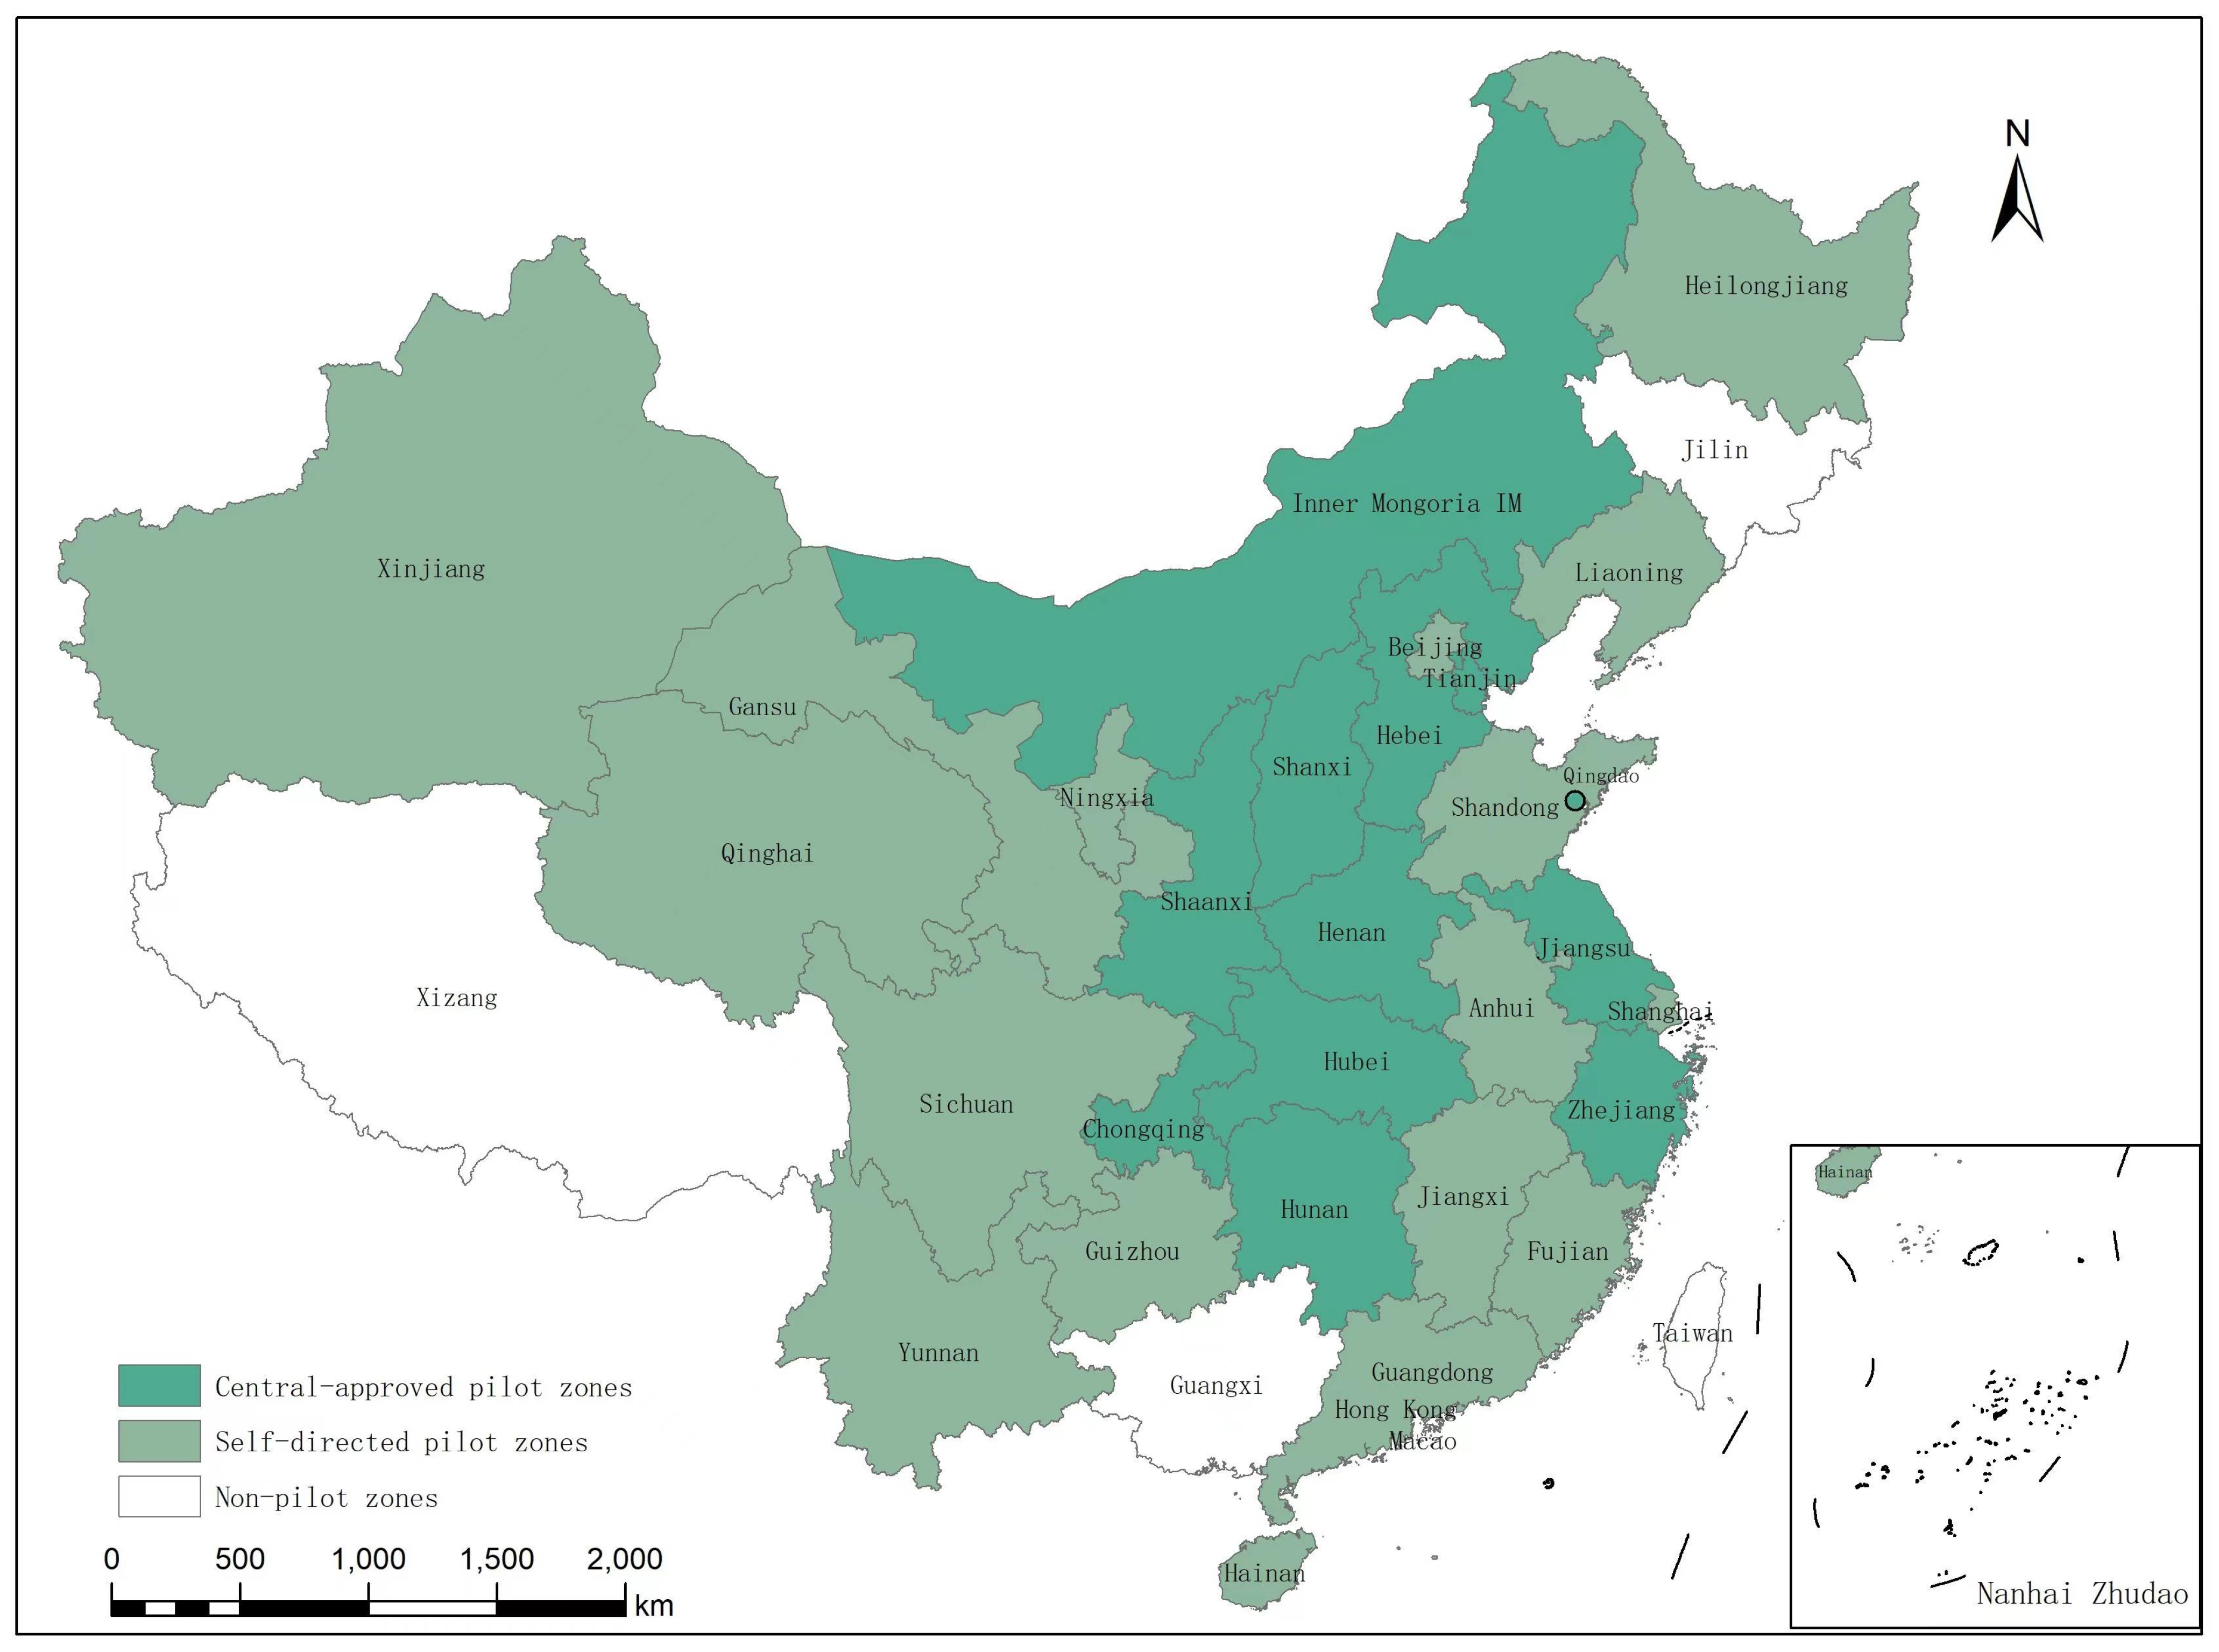
Appendix A. Distribution of Pilot Zones for Emission Trading in China

Figure A1. Distribution of pilot zones for emission trading in China.
Sustainability 15 15021 g0a1

Appendix B. Tax Rates on Water and Air Pollutants Across the Regions, 2018

Table A1. Tax rates on water and air pollutants across the regions, 2018.
RegionsTax Rate
Water Pollutants
(Yuan/Pollution Equivalent)
Air Pollutants
(Yuan/Pollution Equivalent)
Tax burden increases
(Treatment group)
Beijing1412
Henan,
Hunan
5.64.8
Sichuan2.83.9
Chongqing33.5
Guizhou, Hainan2.82.4
Guangxi2.81.8
Shanxi2.11.8
JiangsuNanjing: 8.4;
others: 5.6
Nanjing: 8.4;
others: 4.8
HebeiTier 1: major pollutants 11.2, others 5.6;
Tier 2: major pollutants 7, others 5.6;
Tier 3: 5.6
Tier 1: major pollutants 9.6, others 4.8;
Tier 2: major pollutants 6, others 4.8;
Tier 3: 4.8
ShandongAmmonia nitrogen, COD, five heavy metals 3;
others 1.4
Sulfur dioxide, nitrogen oxides 6;
Others 1.2
Tax burden remains
(Control group)
Tianjin1010
ShanghaiCOD5;
Ammonia nitrogen 4.8;
others 1.4
Sulfur dioxide 6.65;
nitrogen oxides 7.6;
others 1.2
Guangdong2.81.8
Yunnan1.41.2
HubeiPhosphorus, ammonia nitrogen, COD, five heavy mentals 2.8;
others 1.4
Sulfur dioxide, nitrogen oxides 2.4;
others 1.2
ZhejiangFive heavy mentals 1.8;
others 1.4
Four heavy mentals 1.8;
others 1.4
FujianPhosphorus, ammonia nitrogen, COD, five heavy mentals 1.5;
others 1.4
1.2
Heilongjiang, Jilin, Liaoning, Anhui, Gansu, Shaanxi, Jiangxi, Qinghai, Inner Mongolia, Ningxia, Xinjiang, Tibet1.41.2

Appendix C. The Description of the WW and FC Score

A description of how we measured the financing constraints based on Whited and Wu (2006) and Hadlock and Pierce (2009) [54,55].
(i)
We drew upon White and Wu (2006) and constructed the WW index based on the following equation [54].
WW = −0.091 × CF − 0.062 × CashDiv + 0.021 × Lev − 0.044 × Size + 0.102 × ISG-0.035 × SG
where CF is the ratio of cash flow to total assets; CashDiv is a dummy variable for cash dividend payments; Lev is the ratio of liabilities to assets; Size is the logarithm of the total assets; ISG is the industry average sales growth rate; and SG is the sales revenue growth rate.
(ii)
We drew upon Hadlock and Pierce (2009) to construct the FC index based on the following equation [55].
P Q U F C = 1   o r   0 Z i , t = e Z i , t 1 + e Z i , t
Z i , t = α 0 + α 1 s i z e i , t + α 2 l e v i , t + α 3 C a s h D i v t a i , t + α 4 M B i , t + α 5 N W C t a i , t + α 6 E B I T t a i , t
where Size indicates the scale of enterprise assets and the natural logarithm of total assets; Lev indicates the financial leverage ratio of the enterprise, and the asset–liability ratio = the total liabilities/total assets; CashDiv indicates a cash dividend paid by the company in the current year; MB indicates the market-to-account ratio of the enterprise = market value/book value; NWC indicates the net working capital = working capital—monetary funds—short-term investment; EBIT indicates the earnings before interest and tax; and ta indicates the total assets.
We ran a Logit regression on Equation (A1), fitting the annual occurrence probability P of the financing constraints for each firm, and defined it as the FC Index. The larger the FC value, the more severe the financing constraint problem of the company.

References

  1. Guo, J.J.; Fang, Y.; Yang, Y. Does China’s pollution levy standards reform promote emissions reduction? J. World Econ. 2019, 42, 121–144. [Google Scholar]
  2. Berman, E.; Bui, L.T.M. Environmental regulation and productivity: Evidence from oil refineries. Rev. Econ. Stat. 2001, 83, 498–510. [Google Scholar] [CrossRef]
  3. Jaffe, A.B.; Peterson, S.R.; Portney, P.R.; Stavins, R.N. Environmental regulation and the competitiveness of U.S. manufacturing: What does the evidence tell us? J. Econ. Lit. 1995, 33, 132–163. [Google Scholar]
  4. Soppe, A. Sustainable corporate finance. J. Bus. Ethics 2004, 53, 213–224. [Google Scholar] [CrossRef]
  5. Iotti, M.; Bonazzi, G. Analysis of the risk of bankruptcy of tomato processing companies operating in the inter-regional interprofessional organization. Sustainability 2018, 10, 947. [Google Scholar] [CrossRef]
  6. Wen, H.; Deng, W.; Guo, Q. The effects of the environ tax on heavily polluting firms in China. PLoS ONE 2021, 16, e0261342. [Google Scholar] [CrossRef]
  7. Huang, S.; Lin, H.; Zhou, Y.; Ji, H.; Zhu, N. The influence of the policy of replacing environmental protection fees with taxes on enterprise green innovation—Evidence from China’s heavily polluting industries. Sustainability 2022, 14, 6850. [Google Scholar] [CrossRef]
  8. Ji, L.; Zeng, T. Environmental “Fee-to-Tax” and heavy pollution enterprises to de-capacity. Sustainability 2022, 14, 5312. [Google Scholar] [CrossRef]
  9. He, Y.; Zhu, X.; Zheng, H. The influence of environmental protection tax law on total factor productivity: Evidence from listed firms in China. Energy Econ. 2022, 113, 106248. [Google Scholar] [CrossRef]
  10. Liu, T.; Fang, Y.; Shi, Q.; Ren, L. Research on the effect of the new environmental protection law on the market competitiveness of China’s heavily polluting enterprises. Sustainability 2023, 15, 10311. [Google Scholar] [CrossRef]
  11. Zheng, Q.; Li, J.; Duan, X. The impact of environmental tax and R&D tax incentives on green innovation. Sustainability 2023, 15, 7303. [Google Scholar]
  12. Peng, M.; Wei, C.; Jin, Y.; Ran, H. Does the environmental tax reform positively impact corporate environmental performance? Sustainability 2023, 15, 8023. [Google Scholar] [CrossRef]
  13. Jiang, X.; Li, G.; Fan, X. Environmental protection fee-to-tax and corporate environmental social responsibility: A test based on corporate life cycle theory. Sustainability 2023, 15, 2128. [Google Scholar] [CrossRef]
  14. Porter, M.E.; Van der Linde, C. Toward a new conception of the environment competitiveness relationship. J. Econ. Perspect. 1995, 9, 97–118. [Google Scholar] [CrossRef]
  15. Liao, X.; Shi, X. Public appeal, environmental regulation and green investment: Evidence from China. Energy Policy 2018, 119, 554–562. [Google Scholar] [CrossRef]
  16. Liu, G.; Yang, Z.; Zhang, F.; Zhang, N. Environmental tax reform and environmental investment: A quasi-natural experiment based on China’s environmental protection tax law. Energy Econ. 2022, 109, 106000. [Google Scholar] [CrossRef]
  17. Li, G.; Masui, T. Assessing the impacts of China’s environmental tax using a dynamic computable general equilibrium model. J. Clean Prod. 2019, 208, 316–324. [Google Scholar] [CrossRef]
  18. Albrizio, S.; Kozluk, T.; Zipperer, V. Environmental policies and productivity growth: Evidence across industries and firms. J. Environ. Econ. Manag. 2017, 81, 209–226. [Google Scholar] [CrossRef]
  19. Bergek, A.; Berggren, C.; KITE Research Group. The impact of environmental policy instruments on innovation: A review of energy and automotive industry studies. Ecol. Econ. 2014, 106, 112–123. [Google Scholar] [CrossRef]
  20. Shi, X.; Xu, Z. Environmental regulation and firm exports: Evidence from the eleventh five-year plan in China. J. Environ. Econ. Manag. 2018, 89, 187–200. [Google Scholar] [CrossRef]
  21. Cai, W.; Ye, P. How does environmental regulation influence enterprises’ total factor productivity? A quasi-natural experiment based on China’s new environmental protection law. J. Clean Prod. 2020, 276, 124–125. [Google Scholar] [CrossRef]
  22. Wang, L.; Ma, P.; Song, Y.; Zhang, M. How does environmental tax affect enterprises’ total factor productivity—Evidence from the reform of environmental fee-to-tax in China. J. Clean Prod. 2023, 413, 137441. [Google Scholar] [CrossRef]
  23. Gray, W.B.; Shadbegian, R.J. Plant vintage, technology, and environmental regulation. J. Environ. Econ. Manag. 2003, 46, 384–402. [Google Scholar] [CrossRef]
  24. Zhang, Y.; Wang, J.; Xue, Y.; Yang, J. Impact of environmental regulations on green technological innovative behavior: An empirical study in China. J. Clean Prod. 2018, 188, 763–773. [Google Scholar] [CrossRef]
  25. Yip, C.M. On the labor market consequences of environmental taxes. J. Environ. Econ. Manag. 2018, 89, 136–152. [Google Scholar] [CrossRef]
  26. Wang, J.; Wang, K.; Shi, X.; Wei, Y.M. Spatial heterogeneity and driving forces of environmental productivity growth in China: Would it help to switch pollutant discharge fees to environmental taxes? J. Clean Prod. 2019, 223, 36–44. [Google Scholar] [CrossRef]
  27. Kay, D.; Jolley, G.J. Using input–output models to estimate sectoral effects of carbon tax policy: Applications of the NGFS scenarios. Am. J. Econ. Sociol. 2023, 82, 187–222. [Google Scholar] [CrossRef]
  28. Wang, Q.; Hubacek, K.; Feng, K.; Wei, Y.M.; Liang, Q.M. Distributional effects of carbon taxation. Appl. Energy 2016, 184, 1123–1131. [Google Scholar] [CrossRef]
  29. Hart, S.L. A natural-resource-based view of the firm. Acad. Manag. Rev. 1995, 20, 996–1014. [Google Scholar] [CrossRef]
  30. Banerjee, S.B. Managerial perceptions of corporate environmentalism: Interpretations from industry and strategic implications for organizations. J. Manag. Stud. 2001, 38, 489–513. [Google Scholar] [CrossRef]
  31. Tang, M.F.; Walsh, G.; Lerner, D.; Fitza, M.A.; Li, Q.H. Green innovation, managerial concern and firm performance: An empirical study. Bus. Strategy Environ. 2018, 27, 39–51. [Google Scholar] [CrossRef]
  32. Gu, Y.; Ho, K.C.; Yan, C.; Gozgor, G. Public environmental concern, CEO turnover, and green investment: Evidence from a quasi-natural experiment in China. Energy Econ. 2021, 100, 105379. [Google Scholar] [CrossRef]
  33. Chen, Y.; Ma, Y. Does green investment improve energy firm performance? Energy Policy 2021, 153, 112252. [Google Scholar] [CrossRef]
  34. Hart, S.L.; Ahuja, G. Does it pay to be green? An empirical examination of the relationship between emission reduction and firm performance. Bus. Strategy Environ. 1996, 5, 30–37. [Google Scholar] [CrossRef]
  35. Berrone, P.; Fosfuri, A.; Gelabert, L.; Gomez-Mejia, L.R. Necessity as the mother of ‘green’ inventions: Institutional pressures and environmental innovations. Strateg. Manag. J. 2013, 34, 891–909. [Google Scholar] [CrossRef]
  36. Weche, J.P. Does green corporate investment really crowd out other business investment? Indusial Corp. Chang. 2018, 28, 1279–1295. [Google Scholar]
  37. Fan, H.; Zivin, J.; Kou, Z.; Liu, X.; Wang, H. Going Green in China: Firms’ Responses to Stricter Environmental Regulations. Natl. Bur. Econ. Res. 2019, 26540. [Google Scholar] [CrossRef]
  38. Lee, K.-H.; Min, B. Green R&D for eco-innovation and its impact on carbon emissions and firm performance. J. Clean Prod. 2015, 108, 534–542. [Google Scholar]
  39. Xu, Q.; Lei, Y.; Ge, J.; Ma, X. Did investment become green in China? Evidence from a sectoral panel analysis from 2003 to 2012. J. Clean Prod. 2017, 156, 500–506. [Google Scholar] [CrossRef]
  40. Liu, B.L.; Zhao, Z.; Zhang, M.; Zhou, D. Green investment efficiency in the Chinese energy sector: Overinvestment or underinvestment? Energy Policy 2022, 160, 112694. [Google Scholar] [CrossRef]
  41. Rubashkina, Y.; Galeotti, M.; Verdolini, E. Environmental Regulation and Competitiveness: Empirical Evidence on the Porter Hypothesis from European Manufacturing Sectors. Energy Policy 2015, 83, 288–300. [Google Scholar] [CrossRef]
  42. Liao, Z. Environmental policy instruments, environmental innovation and the reputation of enterprises. J. Clean Prod. 2018, 171, 1111–1117. [Google Scholar] [CrossRef]
  43. Zhu, Q.H.; Liu, J.J.; Lai, K.H. Corporate Social Responsibility Practices and Performance Improvement Among Chinese National State-Owned Enterprises. Int. J. Prod. Econ. 2016, 171, 417–426. [Google Scholar] [CrossRef]
  44. Liu, L.; Zhao, Z.; Zhang, M.; Zhou, C.; Zhou, D. The effects of environmental regulation on outward foreign direct investment’s reverse green technology spillover: Crowding out or facilitation? J. Clean Prod. 2021, 284, 124689. [Google Scholar] [CrossRef]
  45. Wang, K.; Zhang, H.M.; Tsai, S.B.; Wu, L.D.; Xue, K.K.; Fan, H.J.; Chen, Q. Does a board Chairman’s political connection affect green investment? From a sustainable perspective. Sustainability 2018, 10, 582. [Google Scholar] [CrossRef]
  46. Zhang, D.; Cao, H.; Zou, P. Exuberance in China’s renewable energy investment: Rationality, capital structure and implications with firm level evidence. Energy Policy 2016, 95, 468–478. [Google Scholar] [CrossRef]
  47. Yu, X.; Yao, Y.; Zheng, H.; Zhang, L. The role of political connection on overinvestment of Chinese energy firms. Energy Econ. 2020, 85, 104516. [Google Scholar] [CrossRef]
  48. Jensen, M.C. Agency costs of free cash flow, corporate finance, and takeovers. Am. Econ. Rev. 1986, 76, 323–329. [Google Scholar]
  49. Biddle, G.C.; Hilary, G. Accounting quality and firm-level capital investment. Account. Rev. 2006, 81, 963–982. [Google Scholar] [CrossRef]
  50. Biddle, G.C.; Hilary, G.; Verdi, R.S. How does financial reporting quality relate to investment efficiency? J. Account. Econ. 2009, 48, 112–131. [Google Scholar] [CrossRef]
  51. Benlemlih, M.; Bitar, M. Corporate social responsibility and investment efficiency. J. Bus. Ethics 2018, 48, 647–671. [Google Scholar] [CrossRef]
  52. Richardson, S. Over-investment of free cash flow. Rev. Account. Stud. 2006, 11, 159–189. [Google Scholar] [CrossRef]
  53. Wu, H.; Hao, Y.; Weng, J.H. How does energy consumption affect China’s urbanization? New evidence from dynamic threshold panel models. Energy Policy 2019, 127, 24–38. [Google Scholar] [CrossRef]
  54. Whited, T.M.; Wu, G. Financial constraints risk. Rev. Financ. Stud. 2006, 19, 531–559. [Google Scholar] [CrossRef]
  55. Hadlock, C.J.; Pierce, J.R. New evidence on measuring financial constraints: Moving beyond the KZ index. Rev. Financ. Stud. 2010, 23, 1909–1940. [Google Scholar] [CrossRef]
  56. Jensen, M.; Meckling, W. Theory of the firm: Managerial behavior, agency costs and ownership structure. J. Financ. Econ. 1976, 3, 305–360. [Google Scholar] [CrossRef]
  57. Aggarwal, R.K.; Samwick, A.A. Empire-builders and shirkers: Investment, firm performance, and managerial incentives. J. Corp. Financ. 2006, 12, 489–515. [Google Scholar] [CrossRef]
  58. Darnall, N.; Jolley, G.J.; Ytterhus, B. Understanding the relationship between a facility’s environmental and financial performance. Environ. Policy Corp. Behav. 2007, 213–259. [Google Scholar] [CrossRef]
  59. Darnall, N.; Jolley, G.J.; Handfield, R. Environmental management systems and green supply chain management: Complements for sustainability? Bus. Strategy Environ. 2008, 17, 30–45. [Google Scholar] [CrossRef]
  60. Darnall, N.; Henriques, I.; Sadorsky, P. Do environmental management systems improve business performance in an international setting? J. Int. Manag. 2008, 14, 364–376. [Google Scholar] [CrossRef]
Figure 1. Kernel density of corporate overinvestment versus underinvestment.
Sustainability 15 15021 g001
Table 1. Descriptive statistics.
VariableNO.MeanS.D.25th QuartileMedian75th Quartile
GI31930.24661.3050.01200.04530.1735
GI_231930.68261.4990.05250.19460.6289
E_GI31930.47620.86160.12120.26080.4783
DID31930.09050.2870000
Size319322.6681.30321.73022.46723.517
Age (log)31932.4600.61072.0792.6392.944
Lev31930.46180.20230.30340.46440.6146
Cash31930.06140.06720.02170.06000.0995
ROE31930.04390.25820.01980.05950.1091
Tobin Q31931.7901.1181.1261.4472.013
Top 1031930.57370.15180.46740.57650.6765
Inst31930.44210.23290.27400.45500.6190
SOE31930.50520.5000011
EG31930.41500.4928001
Agency costs31930.07400.05870.03830.06240.0948
Mshare31930.07760.154900.00010.0528
Table 2. Baseline regression results (GI).
VariableGreen Investment (GI)
(1)(2)(3)
Post × Treat1.008 ***0.721 ***0.727 ***
(0.078)(0.104)(0.104)
Size −0.028
(0.027)
Age −0.212 ***
(0.049)
AC 1.249 ***
(0.447)
Lev 0.349 **
(0.149)
Cashflow 0.299
(0.361)
Roe 0.075
(0.095)
TobinQ −0.018
(0.025)
Inst 0.134
(0.132)
Top10 −0.076
(0.203)
Indep −0.205
(0.451)
_cons0.155 ***0.181 ***1.143 *
(0.024)(0.024)(0.613)
Industry FE ControlledControlled
Province FE ControlledControlled
Year FE ControlledControlled
N319331933193
R20.0490.1030.113
Standard errors are reported in parentheses. ***, **, and * indicate a statistical significance at the 1%, 5%, and 10% levels, respectively.
Table 3. Parallel trend test for green investment.
VariableParallel Trend
(1)(2)
Post2018 *Treat0.712 ***
(0.167)
D2012 *Treat−0.046−0.047
(0.193)(0.193)
D2013 *Treat−0.025−0.025
(0.190)(0.189)
D2014 *Treat−0.011−0.011
(0.190)(0.189)
D2015 *Treat0.0200.020
(0.192)(0.191)
D2016 *Treat−0.022−0.023
(0.192)(0.191)
D2018 *Treat 0.783 ***
(0.207)
D2019 *Treat 1.036 ***
(0.205)
D2020 *Treat 0.271
(0.212)
Control variablesControlledControlled
Industry FEControlledControlled
Province FEControlledControlled
Year FEControlledControlled
N31933193
R20.1130.117
Standard errors are reported in parentheses. ***, **, and * indicate a statistical significance at the 1%, 5%, and 10% levels, respectively.
Table 4. Robustness checks.
PSM–DIDControl for Firm-Fixed EffectAlternative
GI
Consider the Industry-Specific Policies
(1)(2)(3)(4)
Post *Treat0.302 ***0.289 ***0.670 ***0.739 ***
(0.101)(0.102)(0.118)(0.103)
Control variablesControlledControlledControlledControlled
Firm fixed effect Controlled
Industry *t Controlled
Industry * t 2 Controlled
Industry FE ControlledControlledControlled
Province FE ControlledControlledControlled
Year FE ControlledControlledControlled
N3193319331933193
R20.0340.5870.1330.138
Standard errors are reported in parentheses. ***, **, and * indicate a statistical significance at the 1%, 5%, and 10% levels, respectively.
Table 5. Heterogeneity test based on the state-owned status of the firm.
VariableGreen Investment
(1)
SOEs
(2)
NSOEs
Post *Treat1.101 ***0.448 ***
(0.186)(0.97)
Control variablesControlledControlled
Industry FEControlledControlled
Province FEControlledControlled
Year FEControlledControlled
N16131580
adj. R20.1900.123
Standard errors are reported in parentheses. ***, **, and * indicate a statistical significance at the 1%, 5%, and 10% levels, respectively.
Table 6. Heterogeneity test based on the tightness of firms’ financial constraints.
Based on the FC ScoresBased on the WW Scores
(1)
Higher Financial Constraints
(2)
Lower Financial Constraints
(3)
Higher Financial Constraints
(4)
Lower Financial Constraints
Post *Treat0.541 ***1.011 ***0.374 ***0.933 ***
(0.119)(0.178)(0.087)(0.199)
Control variablesControlledControlledControlledControlled
Industry FEControlledControlledControlledControlled
Province FEControlledControlledControlledControlled
Year FEControlledControlledControlledControlled
N1596159614441444
R20.1270.1310.1650.166
Standard errors are reported in parentheses. ***, **, and * indicate a statistical significance at the 1%, 5%, and 10% levels, respectively.
Table 7. Heterogeneity test based on the level of regional environmental governance.
VariableGreen Investment
(1)
Higher Level of Regional Environmental Governance
(2)
Lower Level of Regional Environmental Governance
Post *Treat0.448 ***1.069 ***
(0.096)(0.188)
Control variablesControlledControlled
Industry FEControlledControlled
Province FEControlledControlled
Year FEControlledControlled
N16131580
adj. R20.1900.123
Standard errors are reported in parentheses. ***, **, and * indicate a statistical significance at the 1%, 5%, and 10% levels, respectively.
Table 8. The effect on the total investment efficiency.
VariableGreen Investment Efficiency
(1)
All
(2)
Underinvestment
(3)
Overinvestment
Post *Treat0.240 ***0.0160.634 **
(0.086)(0.047)(0.255)
Control variablesControlledControlledControlled
Industry FEControlledControlledControlled
Province FEControlledControlledControlled
Year FEControlledControlledControlled
N21191447672
adj. R20.1390.2330.242
Standard errors are reported in parentheses. ***, **, and * indicate a statistical significance at the 1%, 5%, and 10% levels, respectively.
Table 9. Parallel trend test for green investment efficiency.
VariableParallel Trend
(1)(2)
Post2018 *Treat0.230 *
(0.130)
D2013 *Treat−0.057−0.058
(0.142)(0.141)
D2014 *Treat−0.056−0.053
(0.141)(0.141)
D2015 *Treat0.0780.077
(0.142)(0.142)
D2016 *Treat−0.008−0.009
(0.144)(0.144)
D2018 *Treat 0.021
(0.181)
D2019 *Treat 0.134
(0.157)
D2020 *Treat 0.465 ***
(0.160)
Control variablesControlledControlled
Industry FEControlledControlled
Province FEControlledControlled
Year FEControlledControlled
N21192119
R20.1390.142
Standard errors are reported in parentheses. ***, **, and * indicate a statistical significance at the 1%, 5%, and 10% levels, respectively.
Table 10. Agency problems and the effect of environmental tax on green investment efficiency.
Panel A: Executive Shareholding Ratio
VariableGreen Investment Efficiency
(1)
All
(2)
Firms with a Lower Executive Shareholding Ratio
(3)
Firms with a Higher Executive Shareholding Ratio
Post *Treat0.400 ***0.390 ***0.121
(0.113)(0.137)(0.116)
Post *Treat *D_AC1−0.272 ***
(0.126)
Control variablesControlledControlledControlled
Industry FEControlledControlledControlled
Province FEControlledControlledControlled
Year FEControlledControlledControlled
N211910591060
R20.1410.1590.158
Panel B: Agency costs
VariableGreen investment efficiency
(1)
All
(2)
Firms with lower agency costs
(3)
Firms with higher agency costs
Post *Treat0.339 ***0.423 ***0.096
(0.098)(0.134)(0.112)
Post *Treat *D_AC2−0.263 **
(0.125)
Control variablesControlledControlledControlled
Industry FEControlledControlledControlled
Province FEControlledControlledControlled
Year FEControlledControlledControlled
N211910591060
R20.1400.1770.144
Standard errors are reported in parentheses. ***, **, and * indicate a statistical significance at the 1%, 5%, and 10% levels, respectively.
Disclaimer/Publisher’s Note: The statements, opinions and data contained in all publications are solely those of the individual author(s) and contributor(s) and not of MDPI and/or the editor(s). MDPI and/or the editor(s) disclaim responsibility for any injury to people or property resulting from any ideas, methods, instructions or products referred to in the content.

