Article

Analysis and Comparison of Wind Potential by Estimating the Weibull Distribution Function: Application to Wind Farm in the Northern of Morocco

1
Innovating Technologies Team, National School of Applied Sciences, Tetouan, Abdelmalek Essaadi University, Tetouan 93000, Morocco
2
Energy, Materials and Computing Physics Research Group, ENS, Abdelmalek Essaadi University, Tetouan 93020, Morocco
3
Graduate School of Intelligent Data Science, National Yunlin University of Science and Technology, 123 University Road, Section 3, Douliou 640301, Yunlin, Taiwan
4
Department of Cyber-Physical Systems, St. Petersburg State Marine Technical University, 190121 Saint-Petersburg, Russia
5
LIMAS Laboratory, Faculty of Sciences Dhar El Mahraz, Sidi Mohammed Ben Abdellah University, Fez 30050, Morocco
*
Authors to whom correspondence should be addressed.
Sustainability 2023, 15(20), 15087; https://doi.org/10.3390/su152015087
Submission received: 27 August 2023 / Revised: 10 October 2023 / Accepted: 12 October 2023 / Published: 20 October 2023

Abstract

:
To assess wind energy potential in Northern Morocco, a validated approach based on the two-parameter Weibull distribution is employed, utilizing wind direction and speed data. Over a span of two years, from January 2019 to December 2020, measurements taken every 10 min are collected. This study is centered on a comprehensive and statistical analysis of electricity generated from a wind farm situated in the Tetouan region in Morocco. This wind farm boasts a total capacity of 120 MW, comprising 40 wind turbines, each with a 3 MW capacity, strategically positioned along the ridge. Among the available techniques for estimating Weibull distribution parameters, the maximum likelihood method (MLM) is chosen due to its statistical robustness and exceptional precision, especially for large sample sizes. Throughout the two-year period, monthly wind speed measurements fluctuated between 2.1 m/s and 9.1 m/s. To enhance accuracy, monthly and annual theoretical power densities were recalculated using the Weibull parameters and compared with actual measurements. This has enabled the detection of production disparities and the mitigation of forecast errors throughout the entire wind farm. In conclusion, over the two-year production period, turbines WTG 30 and WTG 33 displayed the most significant shortcomings, primarily attributed to orientation issues within the “Yaw system”.

1. Introduction

In recent years, an increasing number of countries have adopted wind power as a means to diversify their energy resources and address the escalating demand for electricity [1]. Conversely, conventional methods of power generation have come under scrutiny due to their association with global warming and greenhouse gas emissions [2,3,4]. In response to this global challenge, several governments have taken significant strides towards fostering electricity production through renewable energy sources, including geothermal, solar, biomass, and wind [5,6,7,8]. Among these, wind energy has emerged as a pivotal element in the pursuit of sustainable electricity generation and holds substantial promise as a renewable energy source [9]. However, the successful establishment and operation of wind farms necessitate meticulous preliminary studies to accurately evaluate the technical potential and optimize the harnessing of wind energy resources [10,11].
Numerous research endeavors have concentrated on assessing the potential of wind energy to offer guidance for future projects. For example, in a study conducted by the authors of [12], the utilization of the Weibull distribution was employed to scrutinize the wind energy potential in four distinct regions within Iran’s Bushehr province. By assessing wind energy density at varying heights, the primary objective of the study was to furnish valuable insights to facilitate the development of economically viable wind farms. The findings from this research pointed to an average energy density of approximately 265 W/m2 at a height of 40 m in the province.
Similarly, Chandel et al. [13] conducted an investigation into the wind potential within a specific location situated in the western Himalayas. This research involved the collection of wind measurements at both one-minute and ten-minute intervals throughout the day. The ensuing statistical analysis revealed that the location exhibited moderate wind conditions, making it suitable for specific applications like water pumping and decentralized energy production.
Another study conducted by the authors of [14] examined the wind potential of Vesleskarvet by analyzing average wind speeds measured over an eleven-year span. The study reported an average speed of 10.9 m/s and a wind energy density of 1650 W/m2.
In a separate investigation, Allouhi et al. [15] delved into the theoretical wind potential of six coastal areas in the Kingdom of Morocco, specifically Dakhla, Laayoune, Essaouira, Tetouan, Alhouceima, and Assila. By considering five years’ worth of wind speed and direction measurements from the chosen sites and applying the Weibull distribution, the authors discerned that Dakhla and Laayoune were conducive to grid-connected wind energy production, while Assila and Essaouira exhibited suitability for stand-alone, non-grid applications.
In an endeavor to discern a relationship between the Chinese economy and the distribution of wind energy potential, Jiang et al. [16] employed three numerical estimation methods: maximum likelihood estimation (MLE), method of moments (MM), and least-squares method (LSM). Various formulations of the Weibull distribution were employed in this study. A pivotal discovery emerged, highlighting that even regions characterized by low wind speeds could offer substantial technical support for investment and development within the country.
In light of the insights gained from the aforementioned studies, it becomes evident that these estimates can provide a valuable understanding of the primary energy source and wind energy production potential. However, to confer credibility upon theoretical studies, it is imperative to engage in a comparison between the theoretical analysis and real-world practical cases. This validation process is crucial during the preliminary study phase commonly referred to as the “pre-project” stage.
This study offers a comprehensive statistical and comparative analysis of wind energy generation within a wind farm situated in the northern region of the Kingdom of Morocco, built during the period 2015–2017 and commissioned in 2017, which is a significant project to add to the list of renewable energy projects benefiting under Morocco’s 13-09 law permitting any entity to produce and inject energy into the national grid (O.N.E) [17], and to contribute to achieving the target of national energetic strategy launched by the order of H.M. King Mohamed VI in a 2009 speech [18].
The research is dedicated to scrutinizing the concordance between theoretical predictions and real-world measurements of active and reactive power outputs within a wind park comprising 40 turbines strategically positioned along the crest of the Tetouan region. Each individual turbine boasts a generating capacity of 3 MW, resulting in a cumulative potential power output of 120 MW.
The current investigation employs the Weibull distribution to forecast the electrical energy production throughout the project’s study phase. This projection will subsequently undergo a rigorous comparison with the actual measurements collected during the operational phase of the park. The application of the Weibull function is predicated on wind speed and direction data gathered at 10 min intervals over a span of two years (2019–2020).
To enhance the clarity and coherence of this paper, the article is organized into the following sections:
The initial section offers a broad introduction, outlining the context by discussing prior studies in the field of wind energy estimation. The second section provides a detailed description of the site under investigation, including its geographical location. It also entails an analysis that compares the anticipated energy production to the theoretical values initially derived during the project’s design phase. Furthermore, this section introduces the Weibull analysis, conducted through the maximum likelihood method (MLM), which aims to estimate the shape and scale parameters essential for simulating theoretical electrical power generation. The third section underscores the importance of incorporating technical key performance indicators (KPIs), such as technical availability over time, to effectively pinpoint and optimize disparities between theoretical and actual energy production values. This section also provides a comprehensive interpretation and discussion of the results obtained. Finally, the fourth and last section brings this study to a close by summarizing the key findings and main points.
By adhering to this structured approach, this work offers a thorough and enlightening examination of wind energy production and fosters a deeper comprehension of the wind farm’s performance and potential optimization avenues.

2. Materials and Methods

2.1. Study Site Location

The Tetouan wind farm is strategically situated in the northern region of Morocco, in close proximity to the charming city of Tetouan. Positioned along the majestic crest of the Tetouan region, this wind farm capitalizes on its prime location harnessing the full potential of the favorable winds that grace this geographical area.
Located at the precise coordinates of 35°35′54.4″ N 5°34′38.2″ W, the Tetouan wind farm embodies the harmonious convergence of nature and renewable energy. These coordinates pinpoint the exact spot where the raw power of the wind is captured and transformed into a clean and sustainable source of electricity.
The winds that sweep across this coastal region of Morocco offer exceptional wind resources, making the Tetouan wind farm an exemplary project in terms of both environmental and economic significance. The towering wind turbines gracefully capture the natural energy of the wind, converting its force into clean, renewable electricity that powers the surrounding homes and industries.
By strategically situating itself along the crest of Tetouan, the wind farm maximizes its energy production while minimizing its impact on the local environment. This carefully chosen location capitalizes on the unique geographic features of the region, optimizing the efficiency of each wind turbine and contributing to the transition towards greener and more sustainable energy.
In essence, the Tetouan wind farm embodies Morocco’s commitment to promoting renewable energy and diversifying its energy mix. With its ideal location and exceptional wind resources, this wind farm plays a pivotal role in the journey towards a cleaner and more environmentally friendly future for the Tetouan region and beyond.

2.2. Estimating Energy Density/Production

The Weibull probability distribution estimates the probability of a specific wind speed and must be calculated before wind turbine installation. The Weibull distribution has two free parameters (shape and scale parameters) which are calculated in various ways. Many studies have conducted research to determine a more reliable method among various Weibull parameter estimation methods. However, since these studies showed different results, studies on determining the reliable Weibull parameter estimation methods continue [19].

2.3. Weibull Probability Distribution Function

The Weibull function is used as an empirical model to approximate the measured wind speed data for the chosen site. The two model parameters shape (k) and scale (c) are estimated using different numerical methods. Thus, the fitted Weibull function is used to calculate wind power potential of the site. Weibull probability density function (PDF) and cumulative distribution function (CDF) as a function of wind speed are given in Equations (1) and (2), respectively.
f ( v ) = k c ( v c ) k 1 e [ ( v c ) k ]
F ( v ) = 1 e [ ( v c ) k ]
Using the fitted Weibull function, wind characteristics such as mean wind speed (Vm), most probable wind speed (Vmp) and wind power density (Pd) are estimated using Equations (3)–(5). To compare the estimated wind characteristics, actual wind power density (Pa) is determined using Equation (6) [20,21,22].
V m = c Γ ( 1 + 1 K )
V m p = c ( k 1 k ) 1 K
P d = ρ a c 2 Γ ( 1 + 3 k )
P a = 1 2 ρ a v 3
where Pa is the actual wind power and ρ a is the air density equal to 1.225 Kg/m3. The variance and standard deviation of the Weibull are given in Equations (7) and (8).
σ w 2 = c 2 { Γ ( 1 + 2 k ) ( Γ ( 1 + 1 k ) ) 2 }
σ w = c 2 { Γ ( 1 + 2 k ) ( Γ ( 1 + 1 k ) ) 2 }

2.4. Parameters Estimations
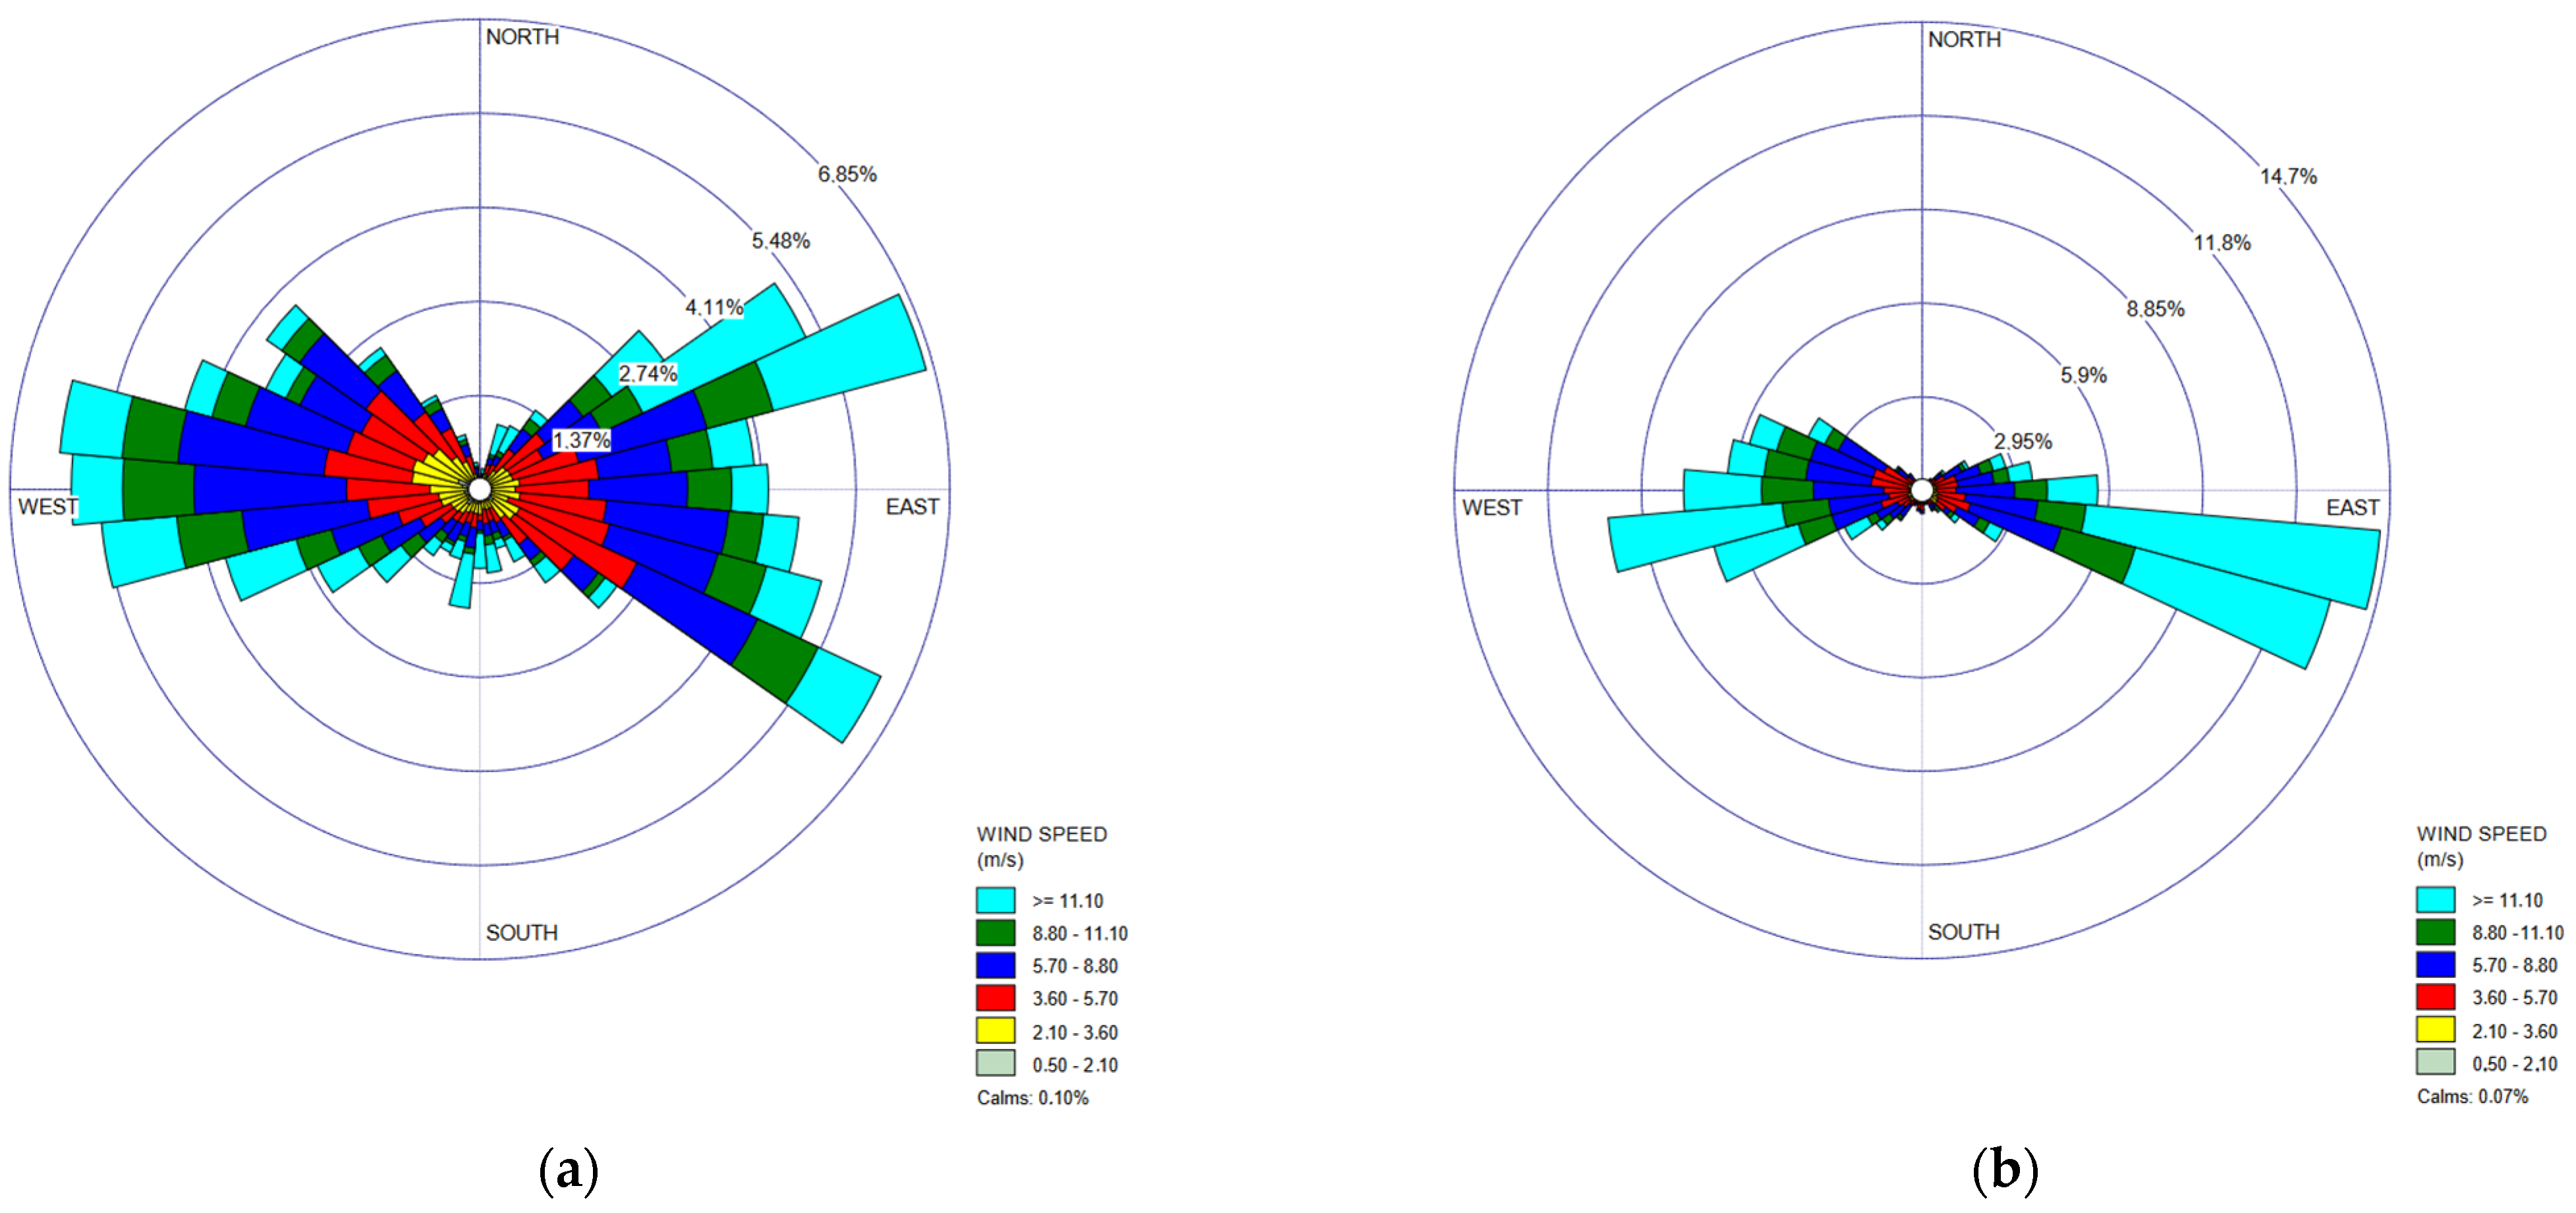
There are many methods to estimate the ‘c’ and ‘k’ parameters. The most simple and regular one is the graphical method. Nonetheless, it is the less in terms of precision. There are also other methods such as the maximum likelihood method (MLM), power density method (PDM), moment method (MM), modified/alternative maximum likelihood method (MMLM/AMLM), empirical method of Justus (EMJ), empirical method of Lysen (EML), equivalent energy method (EEM), energy pattern factor method (EPFM), and modified energy pattern factor method (MEPFM) [23].
The MLM method estimates the unobserved parameters through the observed ones. Equations (7) and (8) are used to calculate the factor k and c. Iterations are required to satisfy Equation (7)’s conditions, which determine the factor c. This method is statistically robust and more precious when the number of samples is large enough [24,25]:
k = [ i = 1 n v i k ln ( v i ) i = 1 n v i k i = 1 n ln ( v i ) n ] 1
c = [ 1 n i = 1 n v i k ] 1 k

2.5. Wind Rose

The Wind speed frequency distribution, commonly known as the Wind Rose representation, serves as a valuable and informative tool. Its main objective is to visually illustrate and provide insights into the duration and occurrence of specific wind speeds. Through the analysis of this distribution, a comprehensive understanding of the frequency of wind staying within predefined wind speed ranges can be achieved.
The Wind Rose representation presents wind speed data in a visually appealing and easy-to-understand format. It typically consists of a circular diagram divided into sections or petals, each representing a specific wind speed range. The length of each petal indicates the proportion or frequency of time during which the wind remains within that speed range. This representation enables the identification of prevailing wind patterns, dominant wind directions, and associated wind speeds.
By examining the Wind Rose representation, important information regarding the wind characteristics in a specific location or over a designated period can be extracted. For instance, it facilitates the determination of the frequency of calm or low wind conditions and moderates wind speeds or strong gusts. This knowledge is crucial in various applications such as wind energy production, architectural design, and environmental assessments.
Furthermore, the Wind Rose representation helps identify seasonal or diurnal variations in wind speed patterns. It assists in identifying the most favorable conditions for wind energy generation and optimizing the design and placement of wind turbines or other wind-dependent infrastructure.
In conclusion, the Wind Rose representation, also referred to as the wind speed frequency distribution, proves to be a powerful tool for visualizing and extracting insights about specific wind speeds.
Its comprehensive depiction of wind speed frequencies within predefined ranges provides valuable information about prevailing wind patterns, directional influences, and variations over time. This tool is indispensable in various fields relying on wind data, facilitating informed decision making, and optimizing processes related to wind energy, construction, and environmental planning [26].

2.6. Data Sample

This extract provides valuable insights into the electricity production data of a wind farm over a span of two consecutive years, ranging from January 2019 to December 2020. It encompasses several significant factors that contribute to the efficient functioning and management of the wind farm.
Firstly, the data includes information on wind speed, a critical parameter that directly influences the energy output of the wind turbines. Wind speed plays a vital role in determining the optimal operation of the turbines, as higher wind speeds typically result in an increased electricity generation. By analyzing the variations in wind speed recorded over this two-year period, valuable trends and patterns can be identified, allowing for better forecasting and decision-making processes.
Additionally, the data also encompasses the wind direction, which is another crucial aspect in wind farm operations. Wind direction helps in understanding the prevailing wind patterns and their impact on the performance of the wind turbines. By studying the historical wind direction data, it becomes possible to identify any recurring patterns or trends, enabling operators to optimize the positioning and alignment of the turbines to maximize energy production.
Furthermore, the extract contains a comprehensive history of alarms reported on the monitoring and supervision platform (SCADA) of the wind farm. This information is of great importance as it provides insights into the operational status and maintenance requirements of the wind turbines. By analyzing the alarm history, operators can identify potential issues, track their occurrence, and take proactive measures to minimize downtime and optimize the overall performance of the wind farm.
In summary, this extract from the electricity production data on the wind farm covers essential parameters such as wind speed, wind direction, and the history of alarms reported on the SCADA system. Analyzing this data can facilitate better decision making, enhance operational efficiency, and enable proactive maintenance practices, ultimately leading to the improved electricity generation and the overall performance of the wind farm.

2.7. Statistical Study

To evaluate the effectiveness of this model, three statistical tests: root mean square error (RMSE), coefficient of determination (R2), and standardized chi-square (χ2), were used. These tests were applied to evaluate the relative error with respect to wind energy density, as defined in the following relationship [27,28,29,30,31]:
R M S E = [ 1 N i = 1 N ( y i x i ) ] 1 2
χ 2 = i = 1 N ( y i x i ) 2 N n
R 2 = i = 1 n ( y i z i ) 2 i = 1 n ( y i x i ) 2 i = 1 n ( y i z i ) 2
where yi is the ith value of the probability of real data, Zi is the mean value of real data, xi is the ith estimated with both models, N is the number of observations, and n is the number of constants used.
The best results are characterized by a high value of R2 test, and low values for RMSE and χ2 tests.

3. Results and Discussion

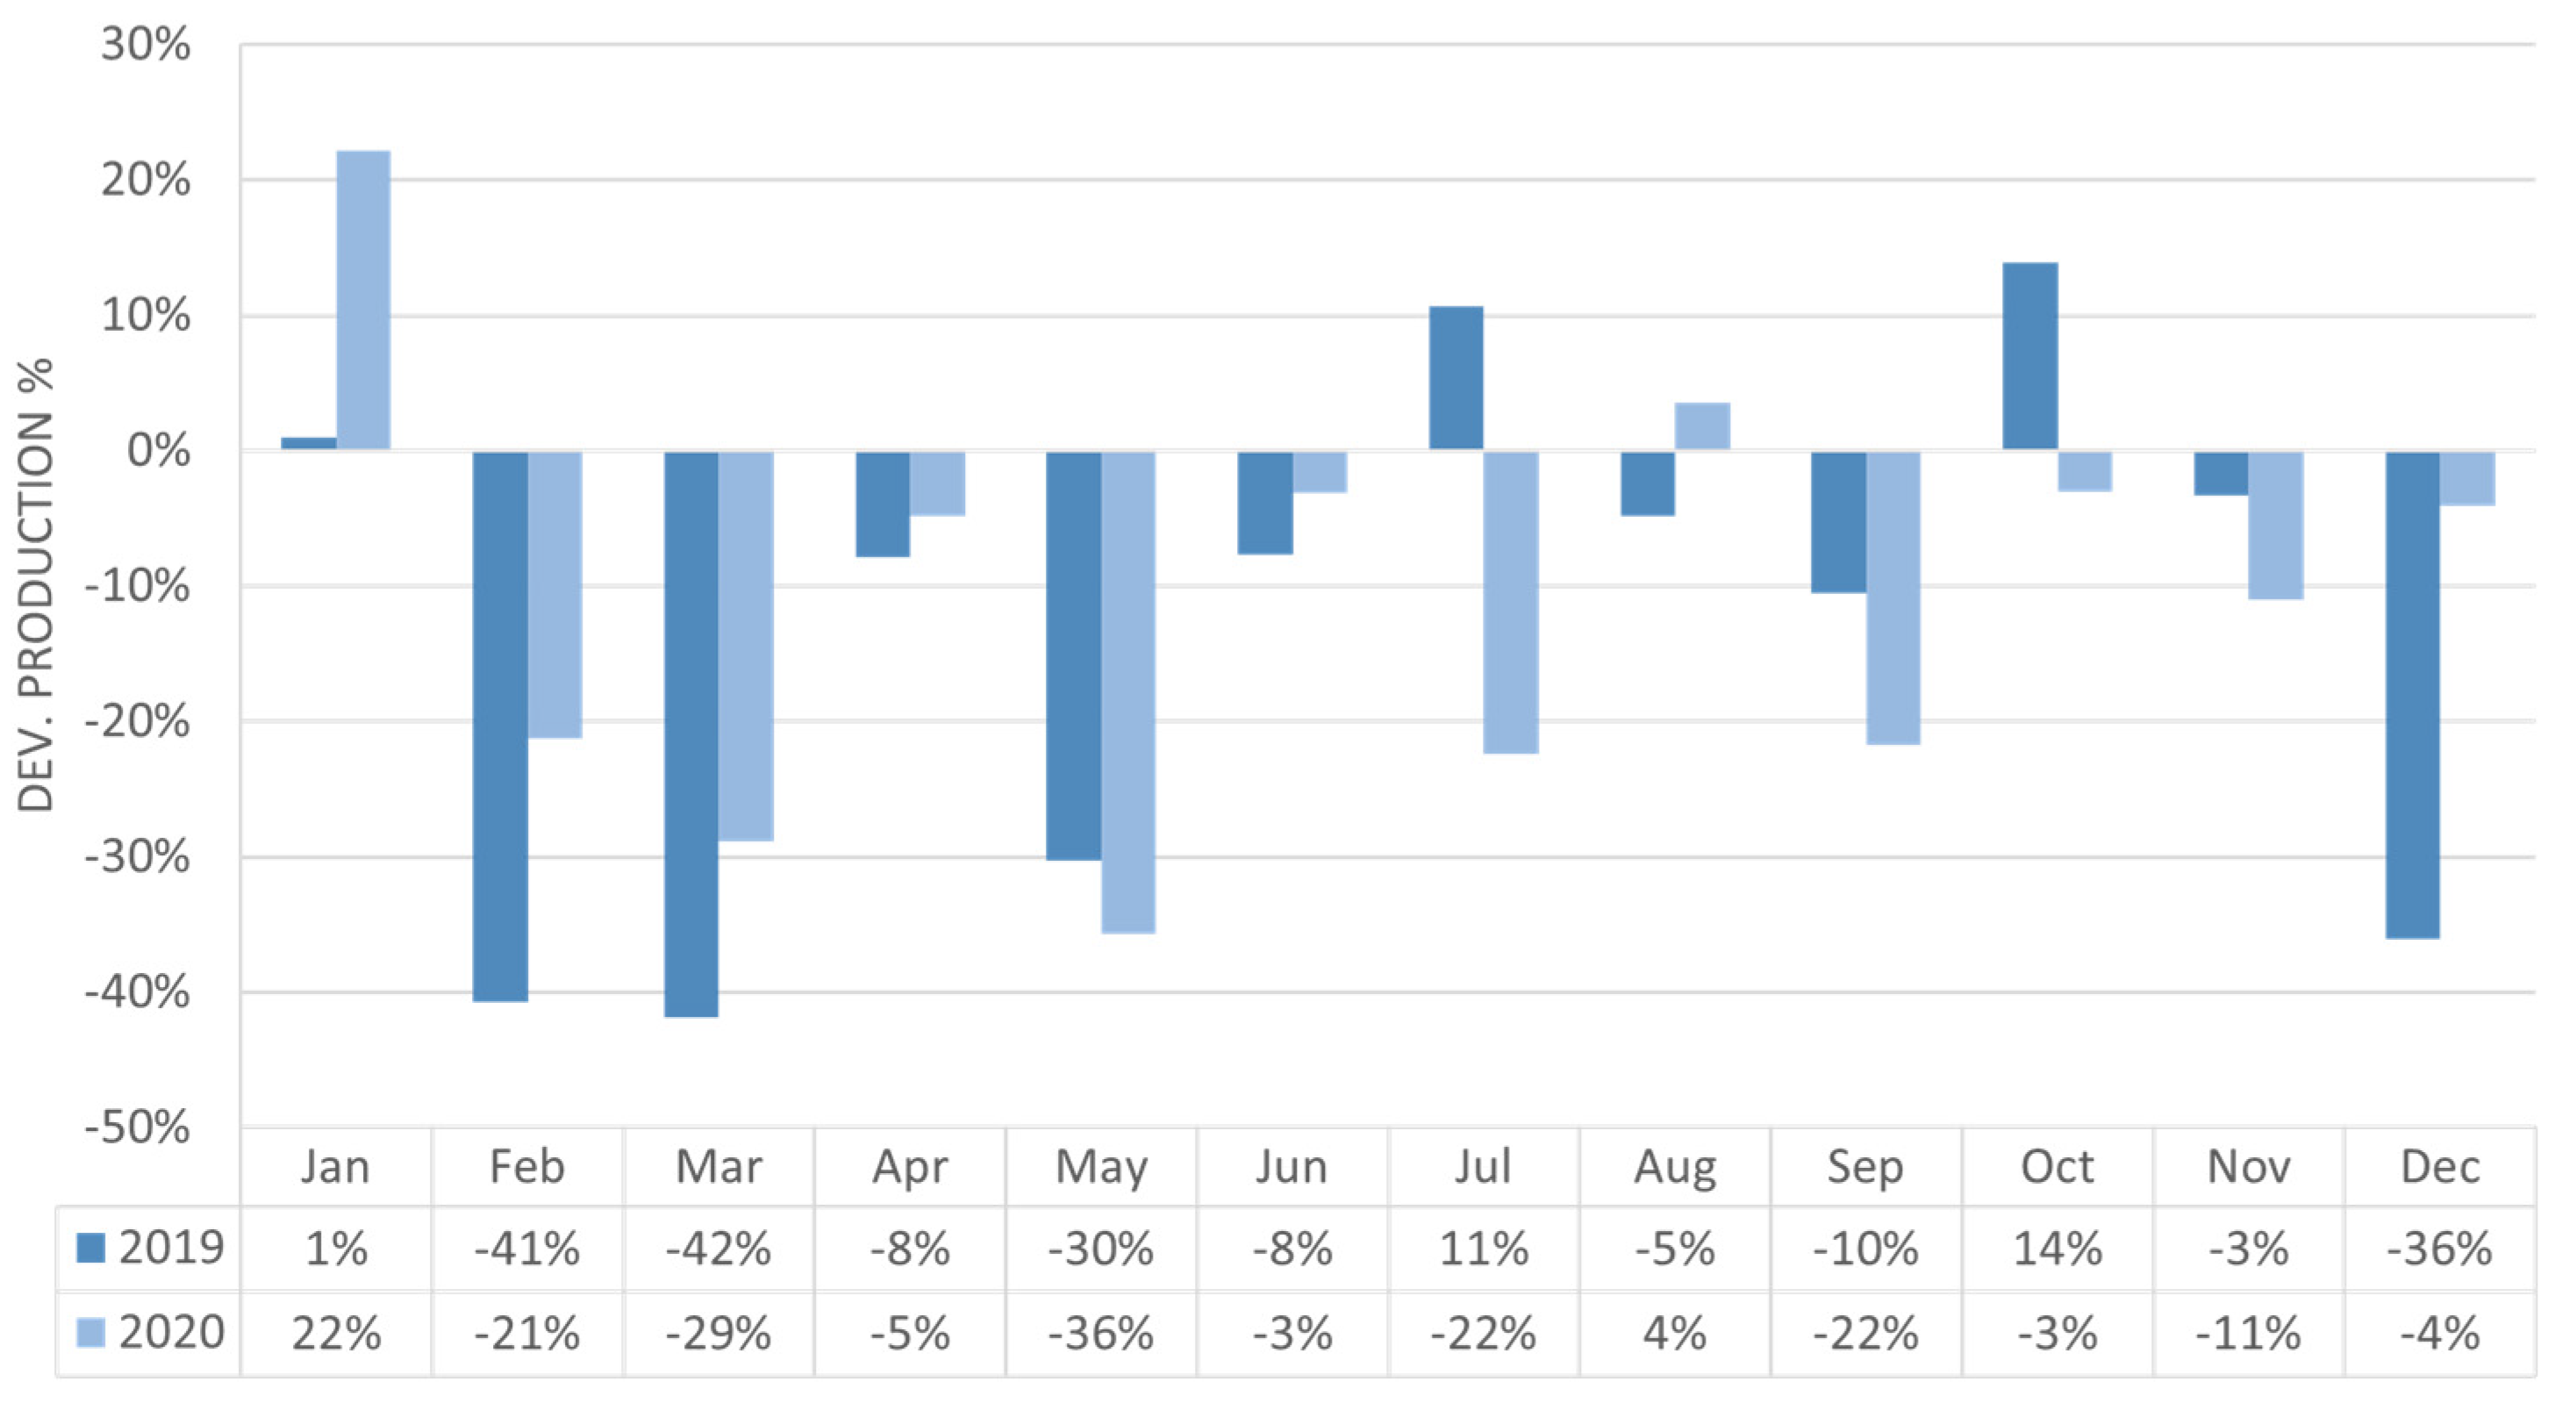
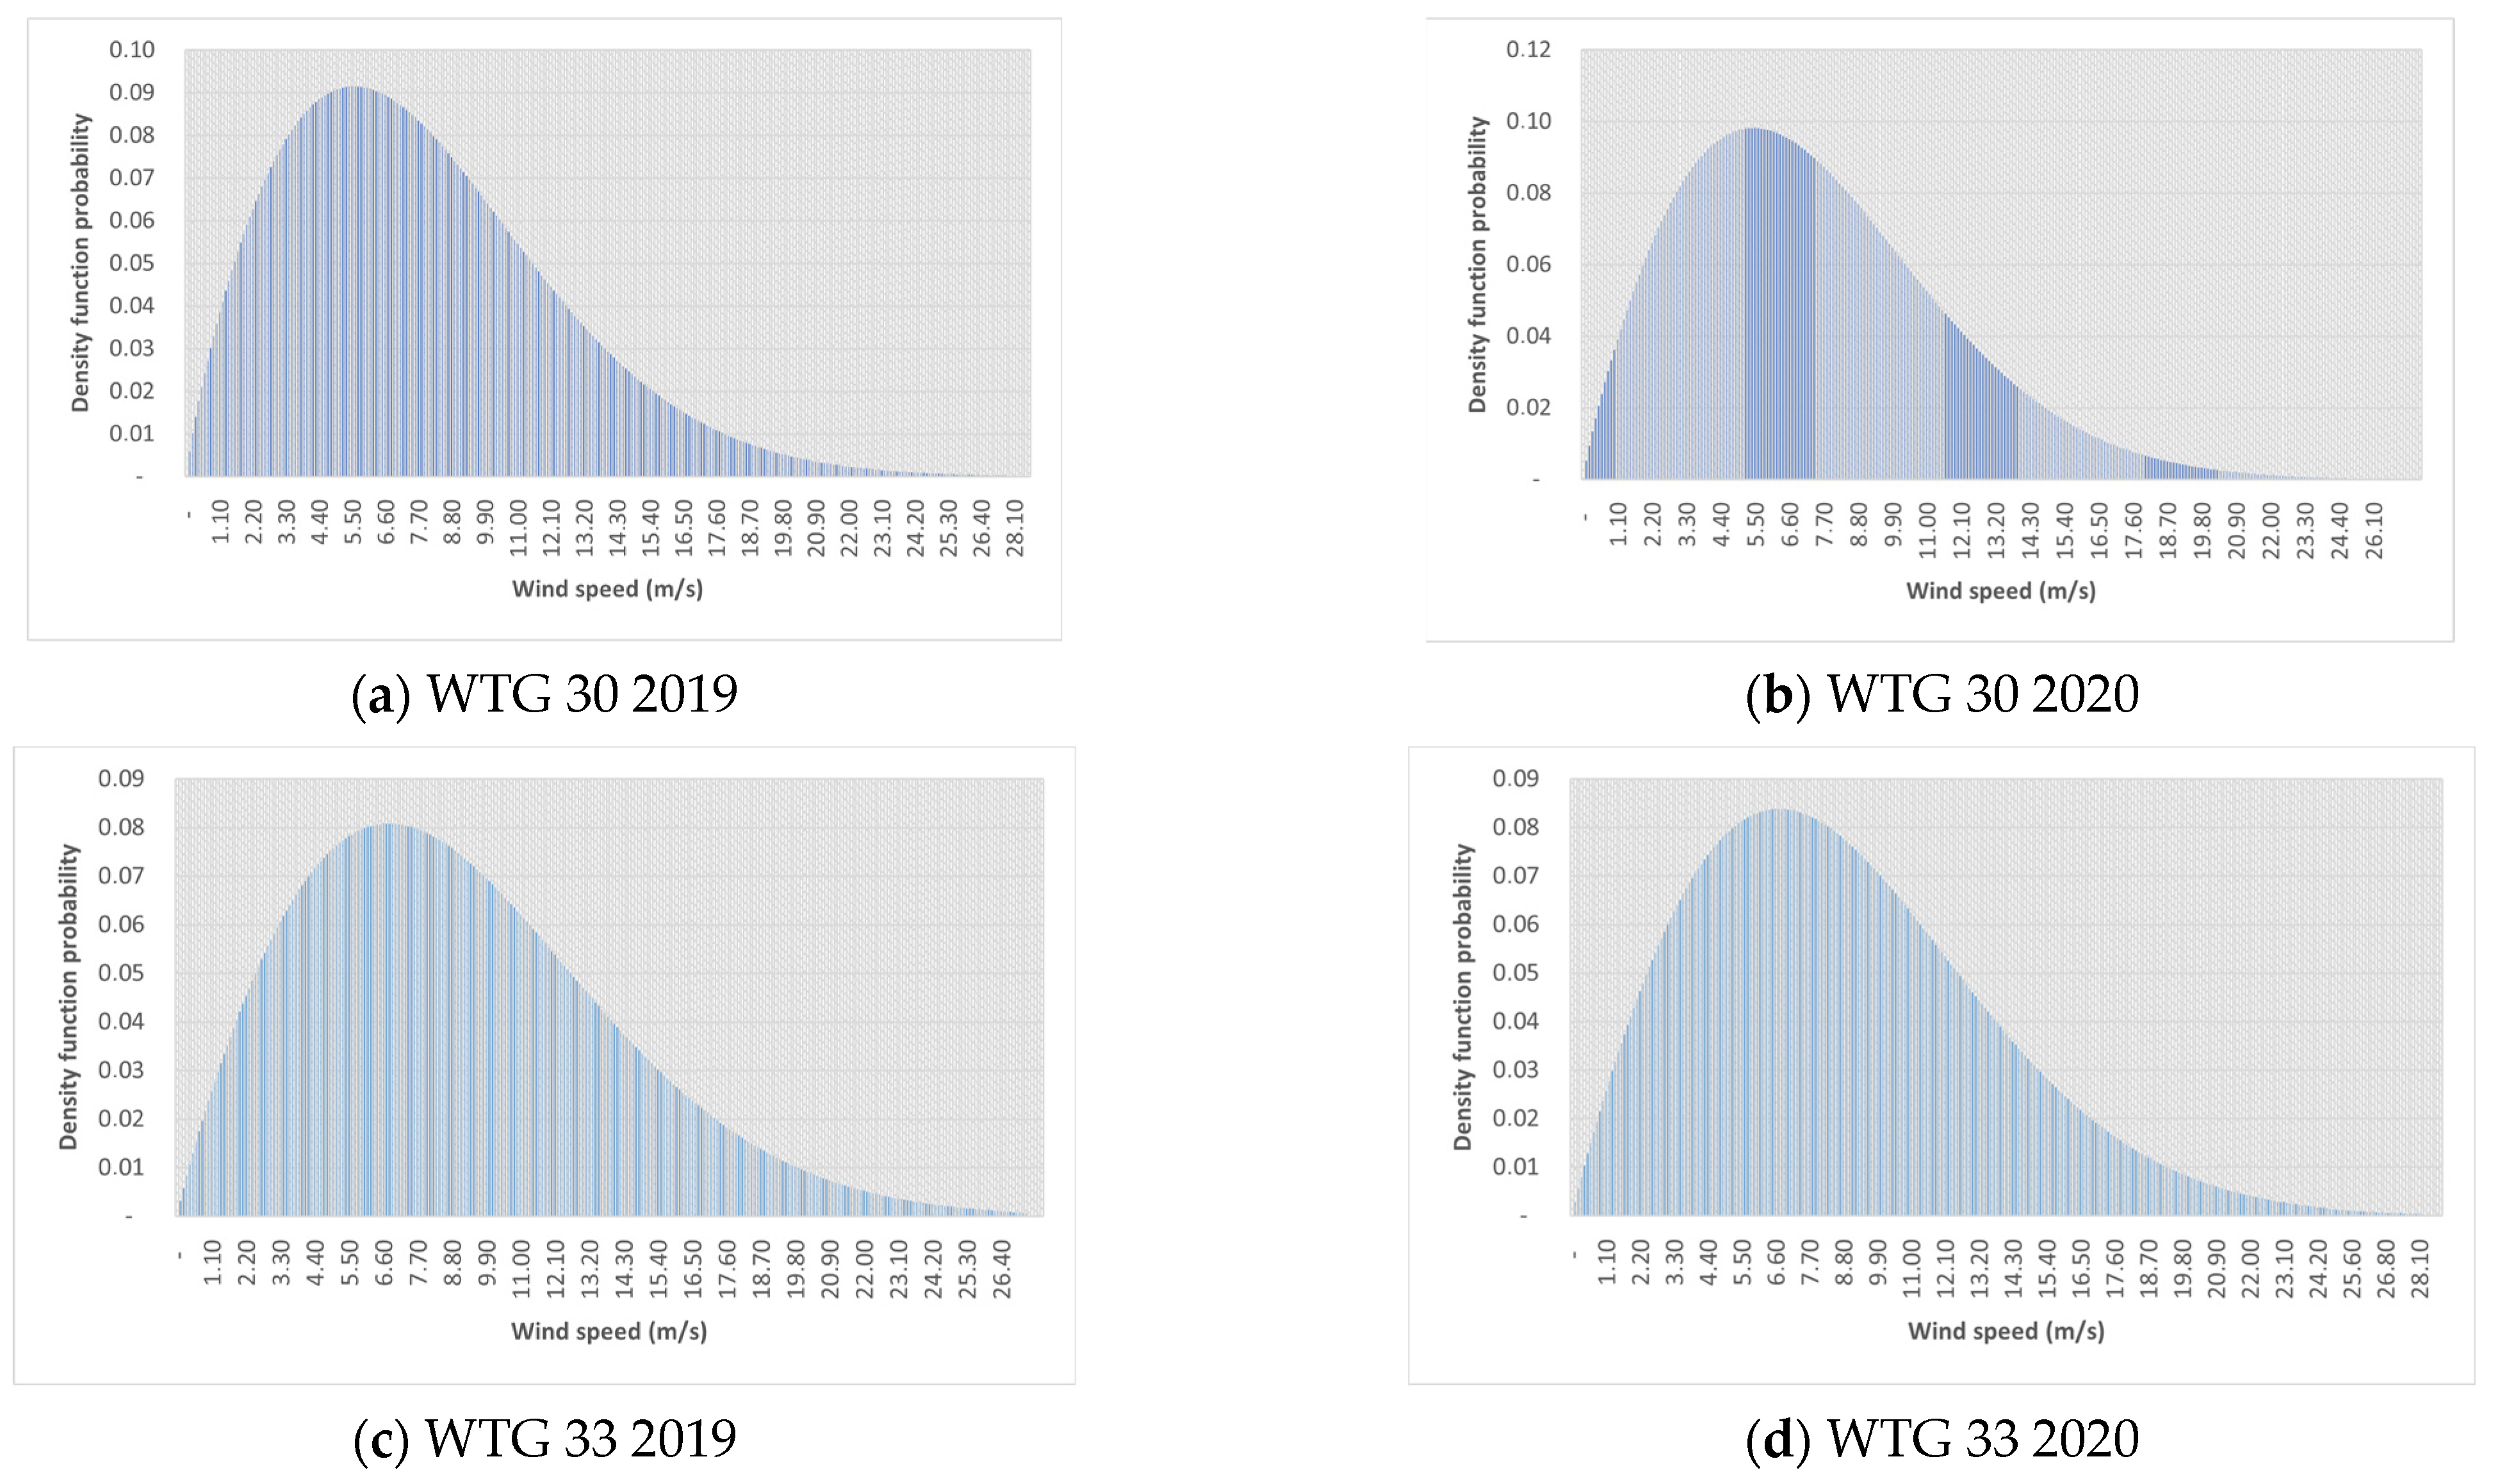
3.1. Deviation from the Theoretical Forecasted Production

The data presented in Table 1 encompasses both theoretical forecast data generated during the project’s design study phase and actual data collected through the supervisory control and data acquisition (SCADA) system over a two-year period (2019–2020). The forecast data derives from models and simulations employed in the initial wind farm design. Conversely, the actual data was recorded by the SCADA system at 10 min intervals during this period. This real-world data offers invaluable insights into the wind farm’s true performance over time and forms the foundation for our analysis.
The overall production does not meet the required level, as indicated by the theoretical forecasted data. One important aspect to address this disparity is to evaluate the credibility of the theoretical data generated during the project’s sizing study phase and subsequent stages by the engineering team. Additionally, the potential impact of technical unavailability of the wind turbines needs to be considered, and its calculation will be conducted later.
To simulate the energy production quantities, a systematic method will be followed, involving the following steps:
  • Calculation of the Weibull distribution factors (c, k).
  • Determination of the energy density.
  • Computation of the expected energy production.
At this stage, we enter the phase of concrete application of the previously defined tools, implementing advanced estimation methods to guarantee the optimal precision of our results. For this crucial step, the maximum likelihood method (MLM), recognized for its ability to improve the precision of calculations, will be used.
The execution of the MLM method will be ensured by an algorithm specially developed in Python, a programming language renowned for its flexibility and power in the field of scientific computing. This algorithm was designed to perform sophisticated iterations, considering data from our 40 wind turbines, with monthly resolution for in-depth analysis.
The process of calculating scale (c) and shape (k) factors will be completely handled by this MLM algorithm. More precisely, the parameter c, representing the scaling factor, will be estimated using wind speed measurements at a height of 80 m, our reference height. Likewise, the parameter k, embodying the form factor, will be calculated by skillfully integrating the frequency distribution of measured wind speeds with the power generated by the wind turbines for each month of the year.
The results of this complex process will be carefully recorded in Table 2, where the monthly estimates of scale (c) and shape (k) factors for the entire wind site during the years 2019 and 2020 will be found. These estimated values will constitute a fundamental pillar as an essential reference for our subsequent analyses.
Applying the method yields the estimated energy production forecast, which is based on the MLM method calculation for each individual turbine in the wind farm. This calculation is carried out monthly to ensure greater precision. As demonstrated in Table 3, the table represents the monthly calculation for the entire site, serving as an example and a preview of the adopted method. Notably, the new forecasted values bring us closer to the actual delivered energy.
Table 4 summarizes the new theoretical energy production.
More details of the monthly production evaluation for the whole wind farm during the two years are shown in Figure 1 in comparison with the new theoretical calculation.

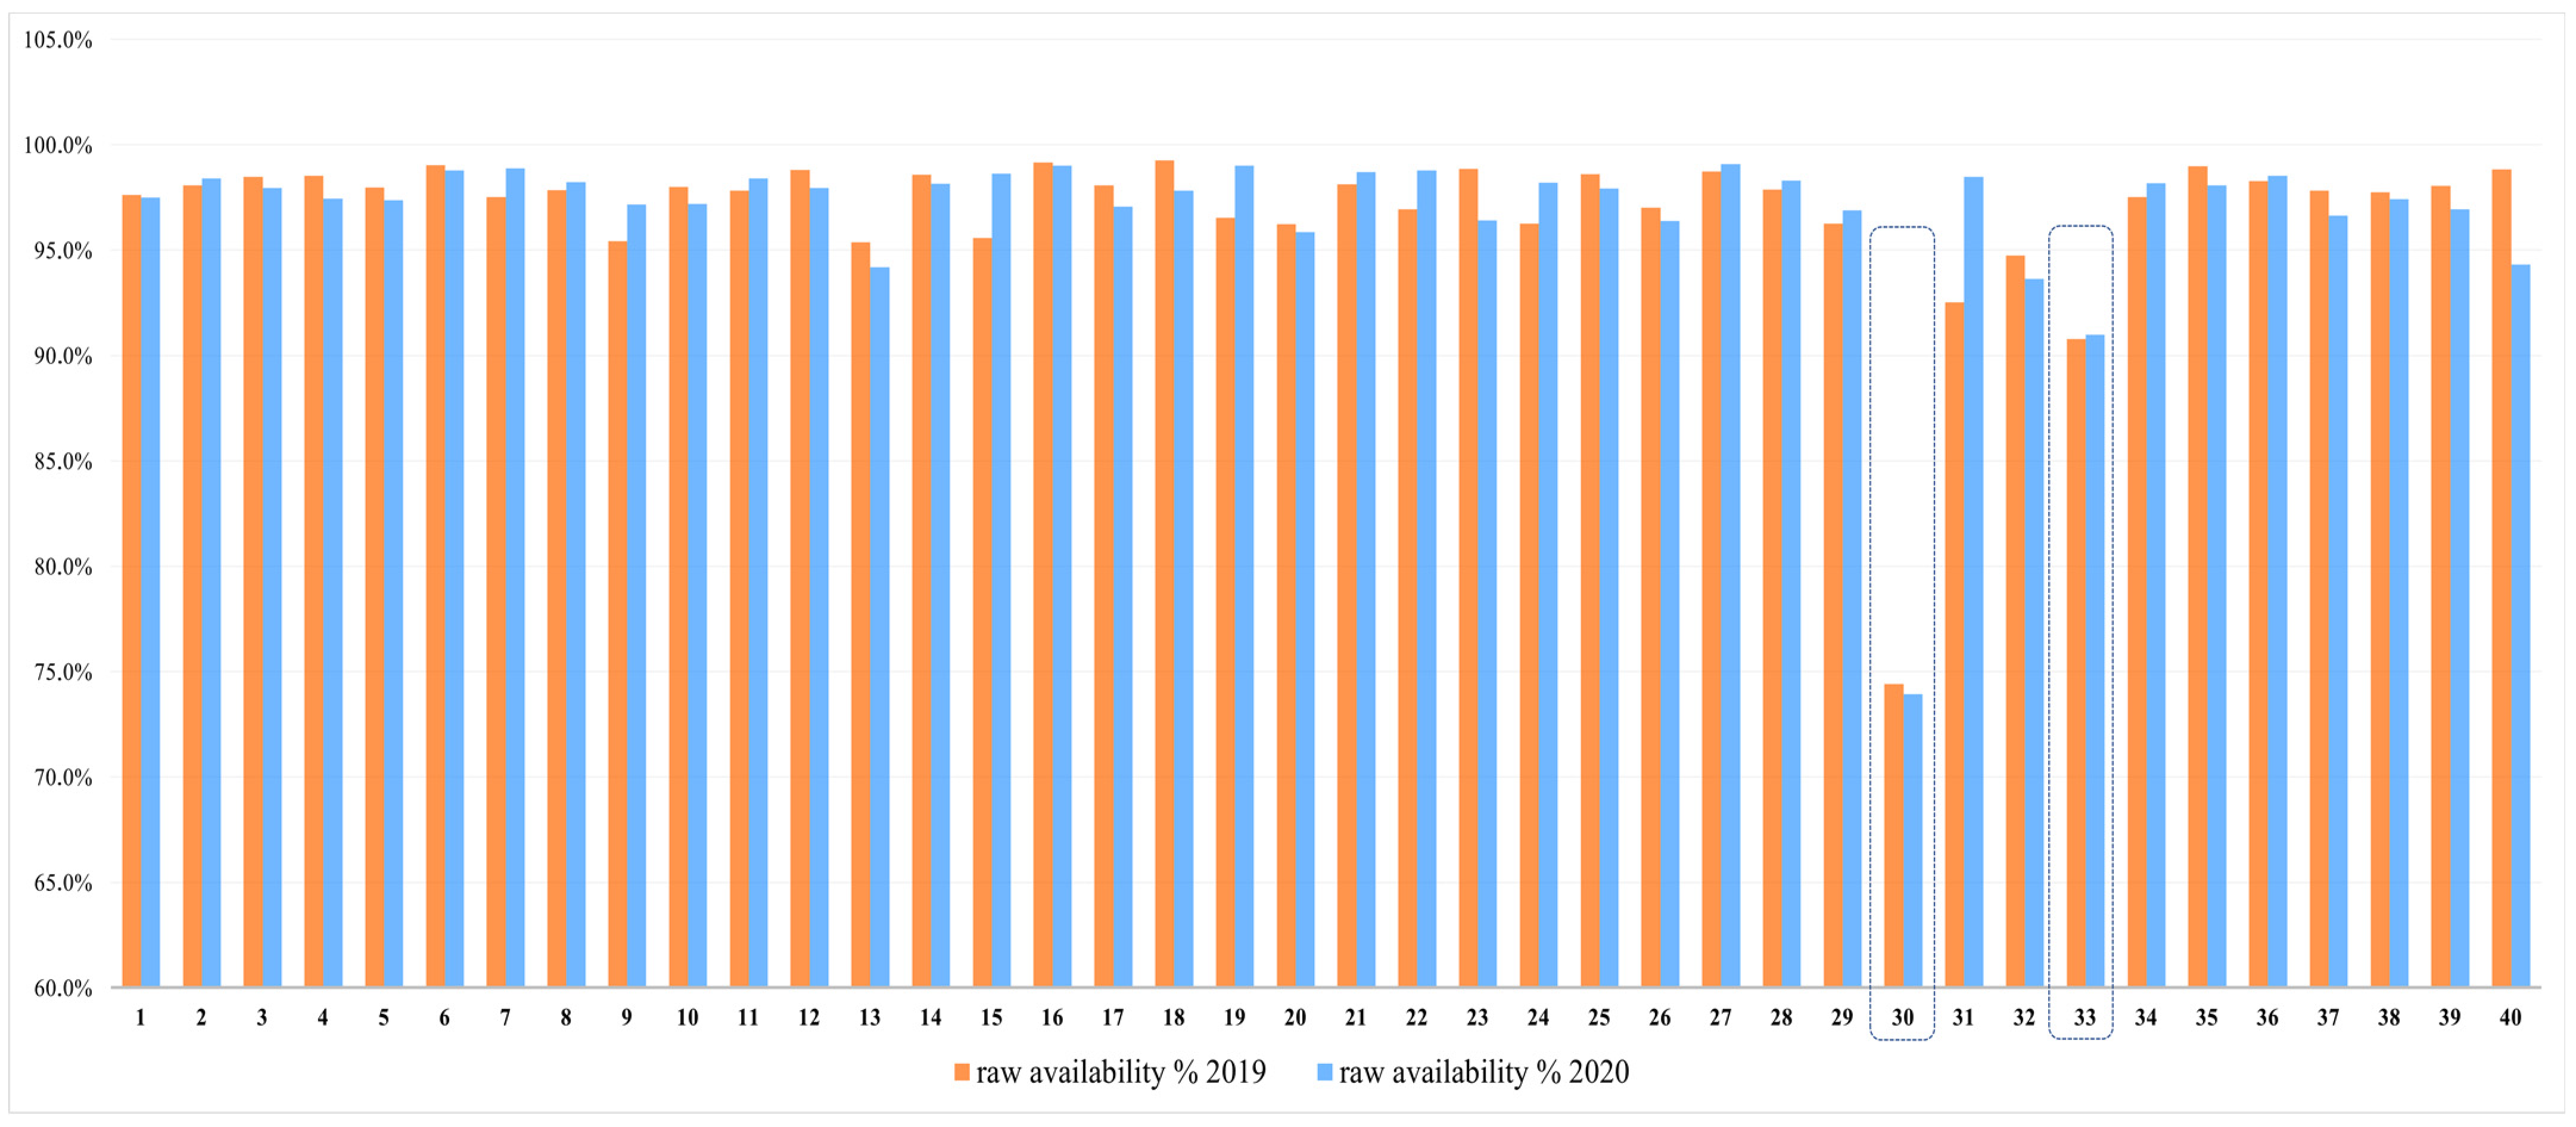
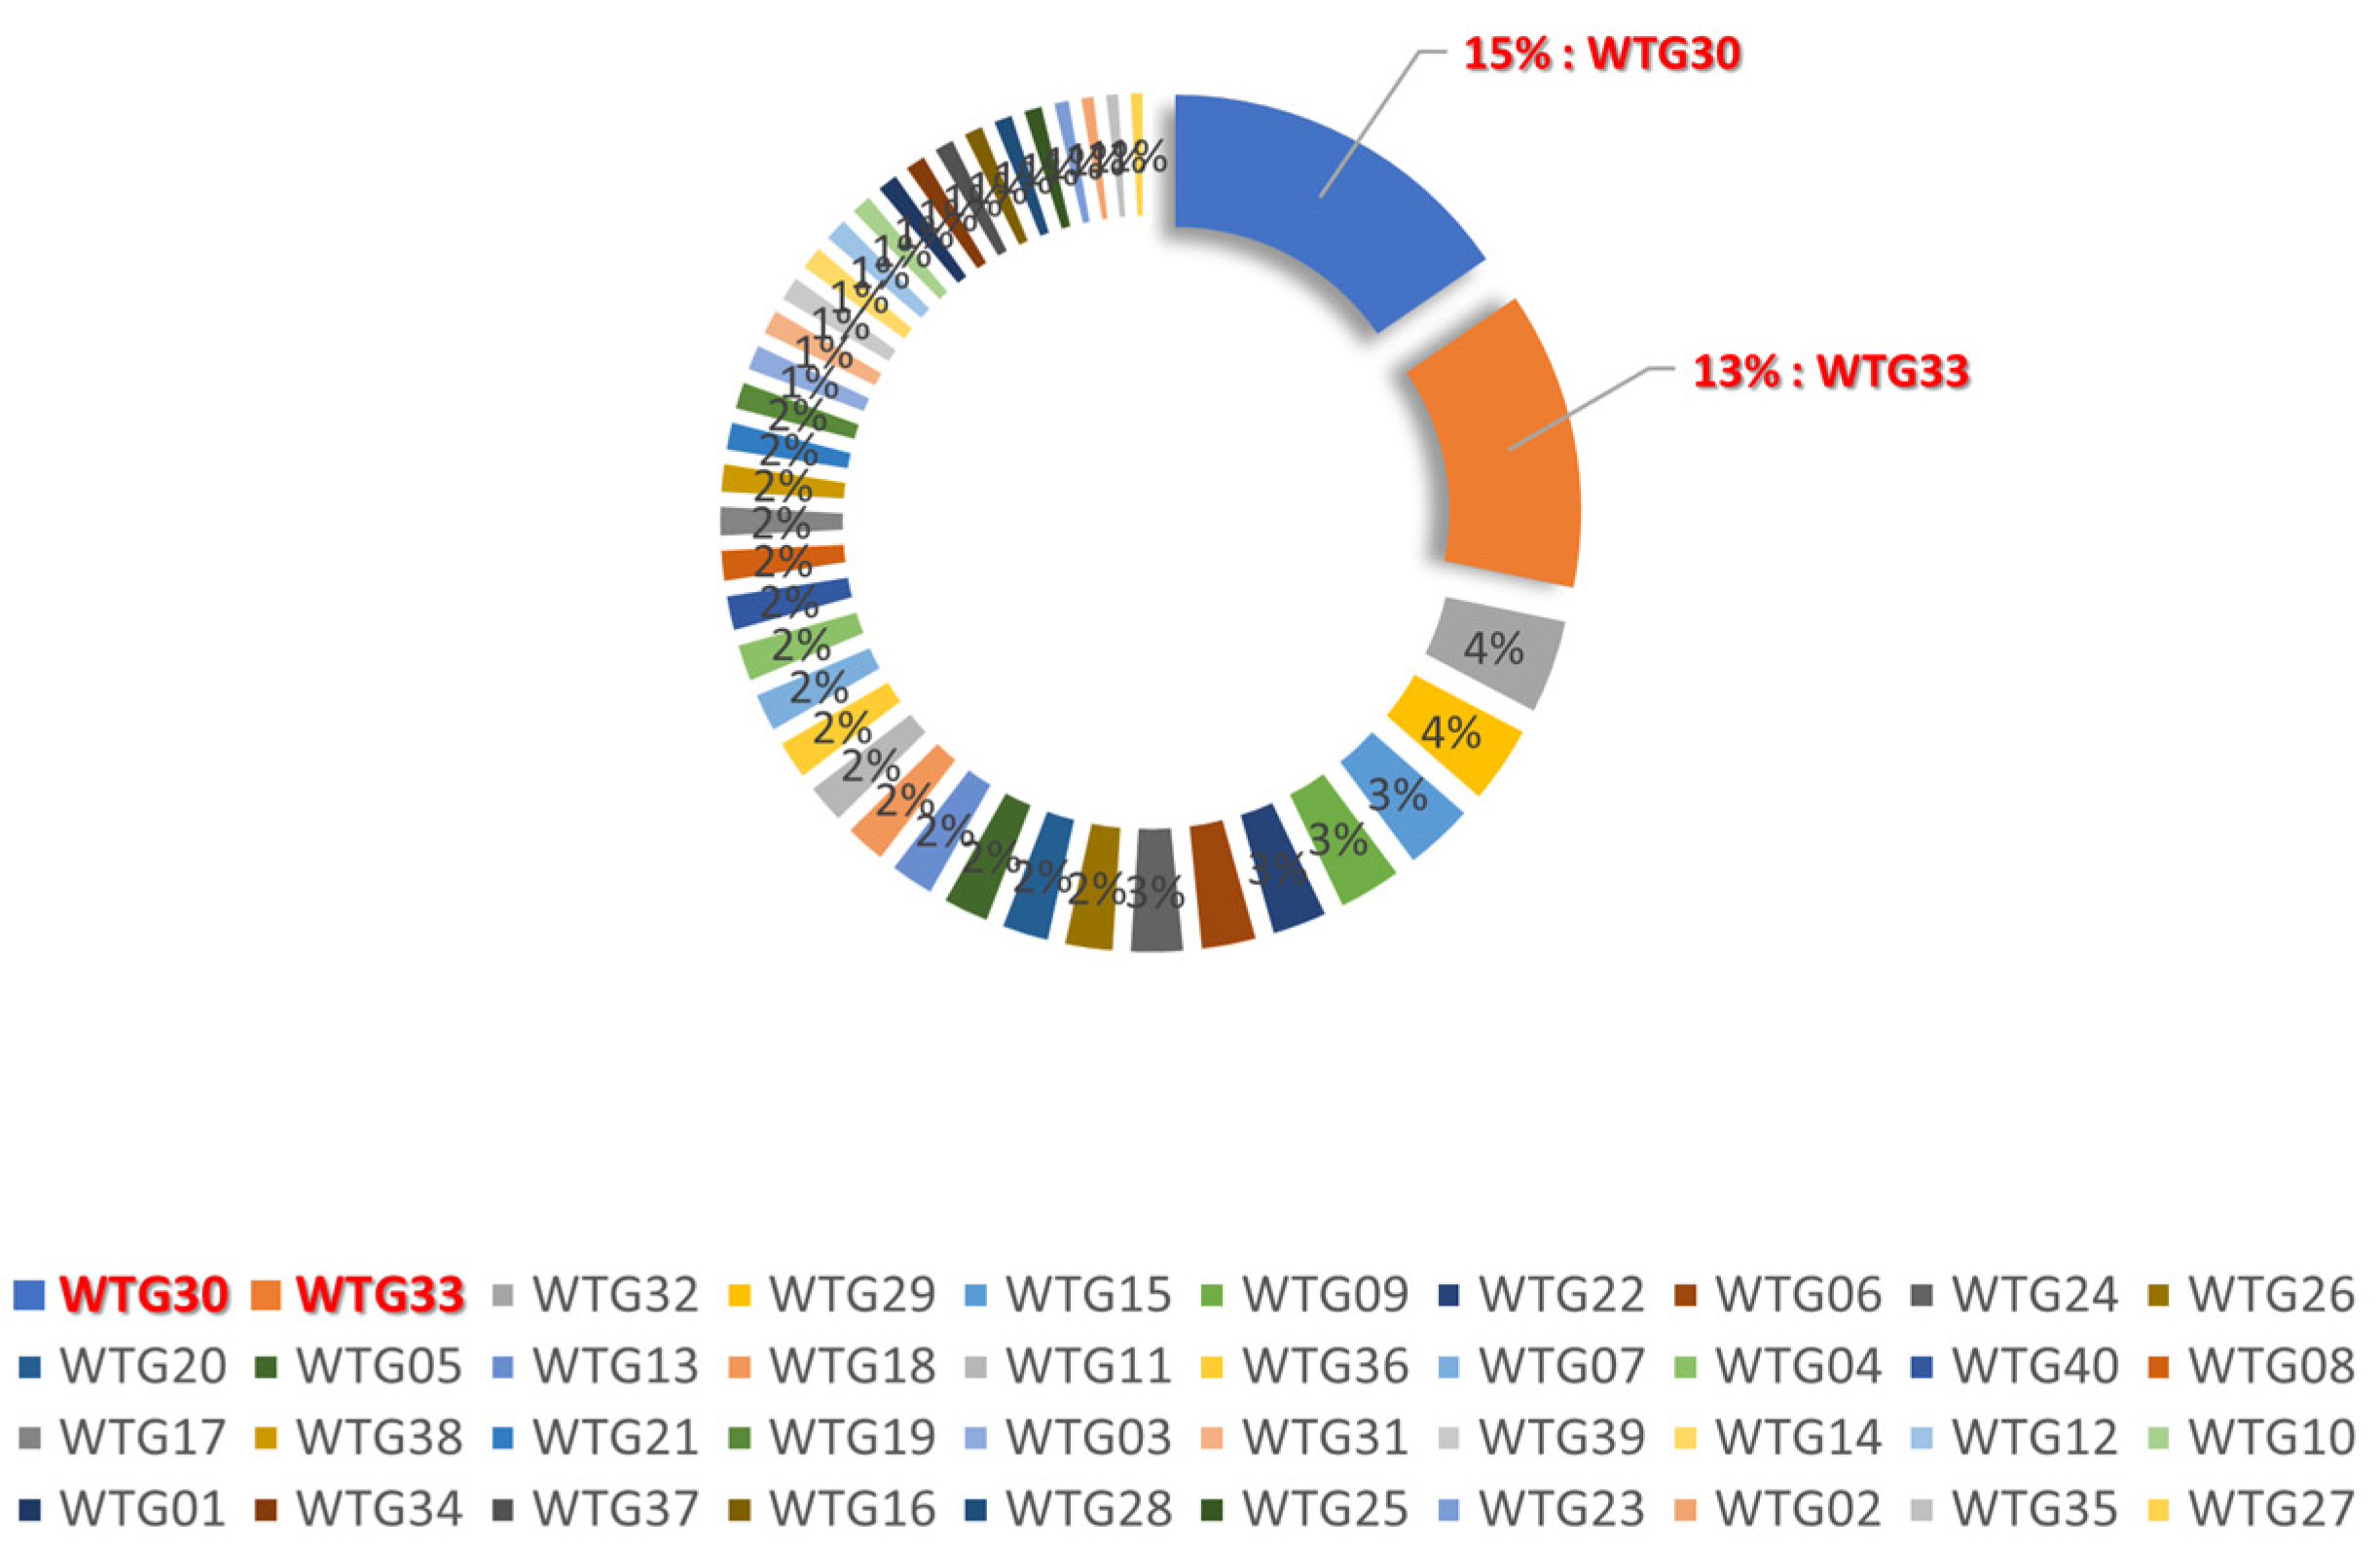
3.2. Availability Calculation Contribution

By considering and incorporating the technical availability calculation, an opportunity arises to effectively reduce the disparity between the actual and forecasted energy production values.
To achieve this, a meticulous approach was taken using the hourly calculus method on the 10 min interval matrix. The laps were carefully filtered based on the validity of wind velocity conditions, which were defined within the range of 4 m/s to 25 m/s. This filtering process ensured that only relevant data points were considered. Subsequently, a comprehensive analysis was conducted to compute the time lapses when the energy production registered null values.
The results obtained from these calculations are presented in Table 5, showcasing the significant insights into the impact of such conditions on the overall energy production. This detailed analysis provides valuable information for further improving the accuracy of energy production forecasts and optimizing the wind farm’s performance.
Table 6 summarizes the unavailability contribution in order to decrease the gaps (dev. production real vs. forecast) for the whole wind farm.
After calculating the impact of technical unavailability of the site, the deviations can now be readjusted, and the corrected deviations between real and forecasted production become as shown in Table 7.
Table 8 presents the statistical evaluation of the Weibull distributions used to estimate the wind energy potential in the Tetouan region. The effectiveness of the estimation technique is manifested through higher values of R2, as well as lower values of RMSE and χ2. These results indicate a better match between model predictions and actual data, thus highlighting the accuracy of the Weibull method for estimating wind energy potential in the Tetouan region.
Following the update, the analysis can progress to a more detailed examination of each turbine to determine if any issues are present. By observing the availability calculations for individual turbines, it becomes possible to identify any turbines experiencing problems. This can be observed in Figure 2 and Figure 3, which clearly indicate the presence of faulty turbines. The comprehensive investigation facilitates timely detection and appropriate measures to address the identified issues, ultimately optimizing the overall performance of the wind farm.
Based on the analysis conducted over the two-year period (2019–2020), it is evident that the turbines with the highest number of faults were WTG 30 and 33. Upon exploring the alarms associated with these turbines, it was discovered that a majority of them were related to orientation issues, specifically the yaw system. To gain further clarity, an evaluation of the monthly mean wind velocity for these two turbines was performed. The corresponding diagrams can be found in Figure 4, providing valuable insights into the potential relationship between monthly wind velocity and the observed orientation problems.
Based on the simulation data, it becomes evident that the average wind speed for both turbines experiences an increase from October to April. During this period, the variation in average wind speed begins to decrease. However, it is worth noting that even during this decrease, the wind speed remains significantly higher than the minimum operational threshold for the turbines.
Although WTG30 and WTG33 encountered notable production shortfalls, the prevailing weather conditions continue to be optimistic and conducive to generating more electrical energy from wind resources.
To further advance the analysis, it is crucial to ensure that the operational hours for the two turbines, like the other WTGs, remain within normal range. As mentioned earlier, this has been addressed through the availability calculations. Additionally, in order to gain deeper insights, a Weibull distribution analysis was conducted using the methods and tools mentioned earlier. This analysis enabled the simulation of shape and scale factors (c, k), and the results are illustrated in Figure 5. The figure displays the Weibull distribution of the wind profile for each year, specifically focusing on the two turbines in question.
The distribution shows that the wind profile for the two turbines is operational and available for normal production.
The next step is to explore the wind rose that shows the wind direction variance for the two turbines. Actually, a Wind Rose diagram for the whole wind farm turbines was made in order to obtain the interpretations and comparing the two faultiest turbines (WTG 30 and 33) versus the other WTGs. Figure 6 shows the wind rose for both WTG 30 and 33.
Referring to the other wind roses of the rest of unfaulty turbines, the wind profiles are not the same. That is why it was also interpreted that this perturbation in the wind directions negatively impacts the yaw system rotation, which constantly causes the turbine to stop, enter the security position, enter stand-by mode, or otherwise.
Hence, the hypothesis becomes that the yaw system suffers multiple perturbations due to wind direction changing, which impact the yaw system electrically, or mechanically, or may accelerate the degradation and consumption of the sub-components of this rotation mechanism, like sensors, motors, and different sub-components.
Analyzing the alarm history for the same period (2019–2020) for the two turbines WTG 30 and 33, it was found that the top alarms needing attention relate to these sub-components:
Wind speed sensor (anemometer);
Temperature sensor PT100;
Vibration sensor;
Yaw rotations counter (twist sensor).
These sub-parts are vulnerable to become faulty due to the frequent wind direction changing some short periods, which increases vibration on the whole tower, increases the temperature in mechanical parts that ensure rotation, and increases rotations of the yaw following wind direction which changes continuously until it reaches the maximum number of rotations. Then, it must inverse rotation. All these frequent issues decrease the production power and, in some cases, stop it until it attends the operational conditions.
To remedy this problem, we propose in Table 9 an action plan to optimize the problems and the effects of these sub-parts for the installed generator.

4. Conclusions

This study examined wind characteristics in the northern region of the Kingdom of Morocco using the Weibull distribution method. The maximum likelihood method (MLM) was chosen to accurately, simply, and robustly determine the parameters of the Weibull distribution to describe wind speed characteristics. The main findings of this study include the following:
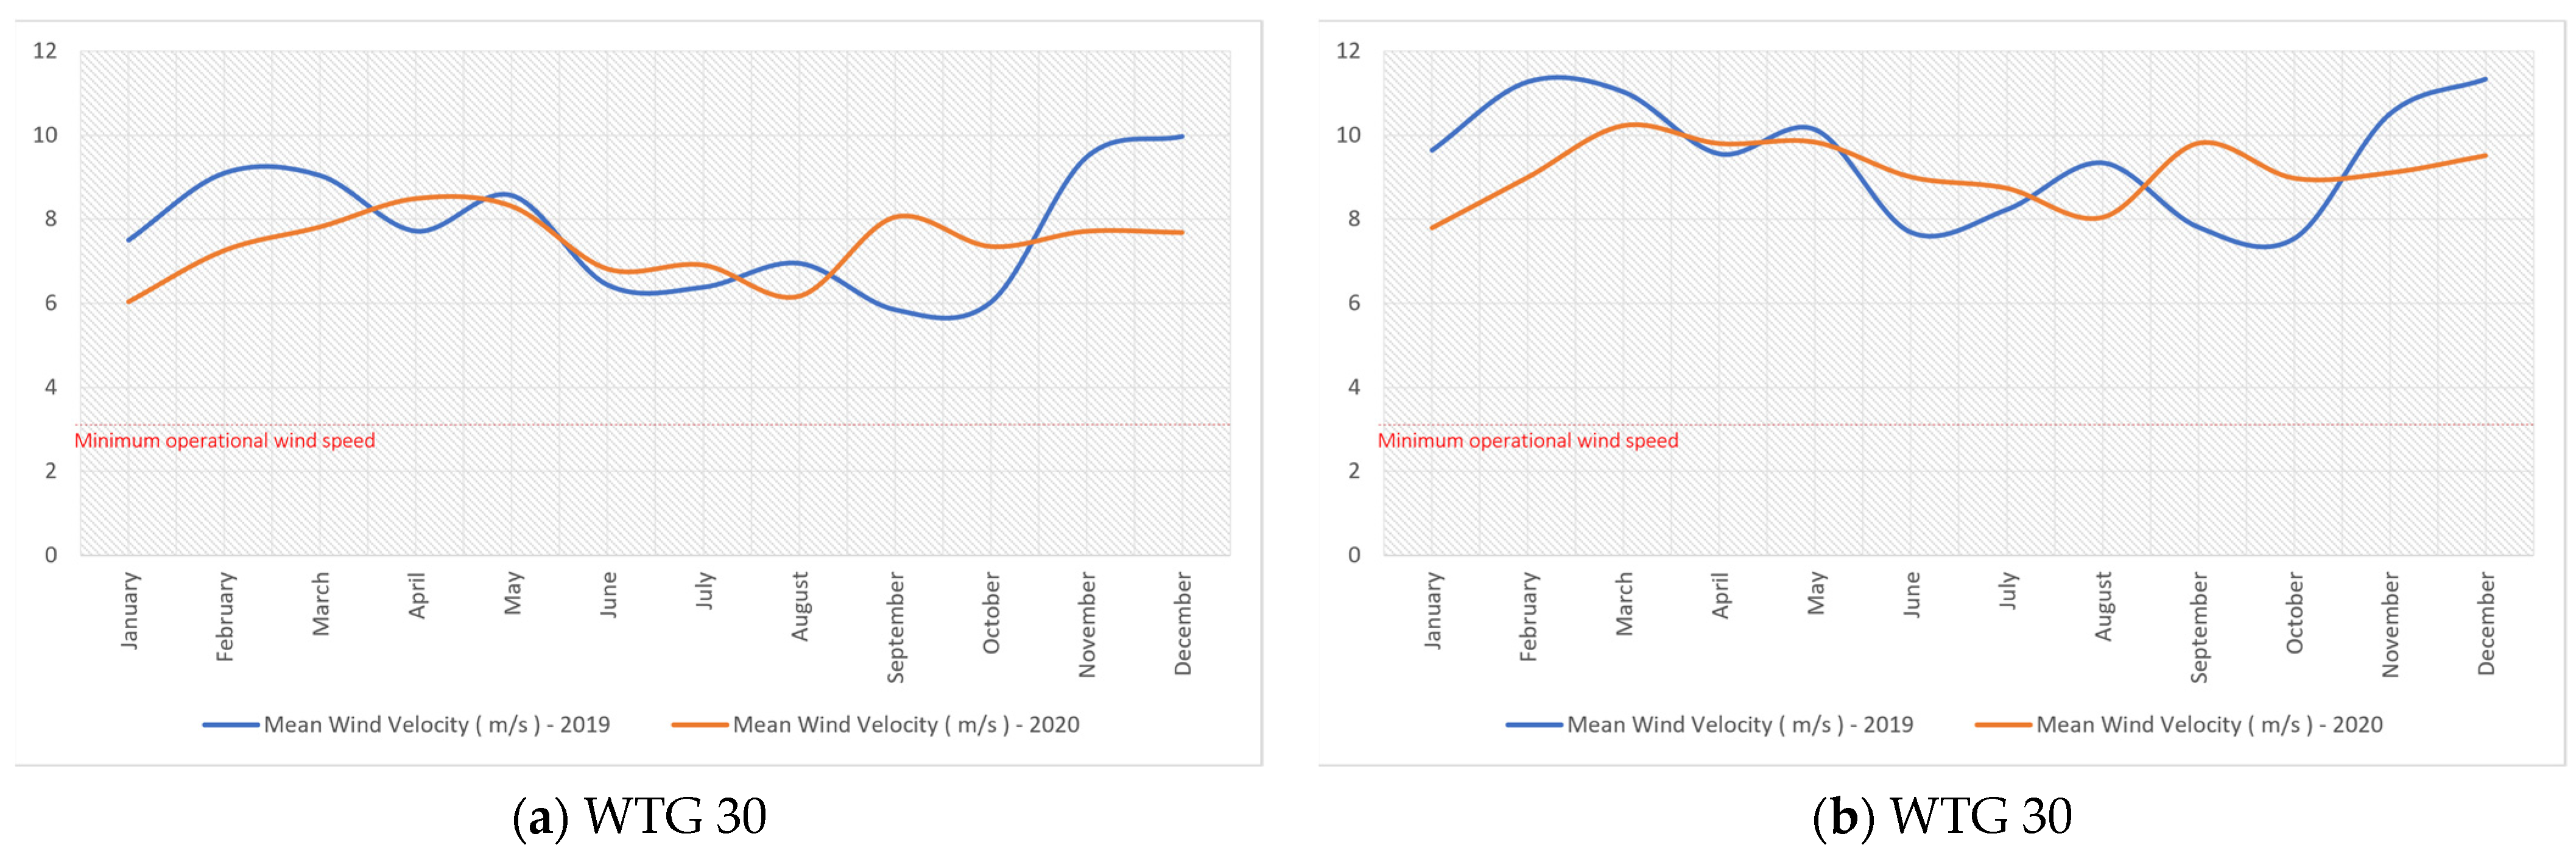
  • The monthly average wind speed over a two-year period ranged from 2.1 m/s to 9.1 m/s, which is conducive to efficient wind energy production.
  • Specifically, the period from October to April revealed relatively higher average wind speeds, which is of considerable importance for energy production.
  • This analysis demonstrated a remarkable alignment between the Weibull distribution curves and the measured data at the production site during the 2019–2020 period, with minor divergences.
  • Among the 40 wind turbines installed in the park, turbines WGT30 and WGT33 exhibited insufficient electrical energy production. This issue can be primarily attributed to orientation problems in the “Yaw system”.
Regarding future prospects, a forthcoming study intends to undertake a comparative analysis. This study will compare the Weibull distribution method based on MLM with alternative approaches, such as those developed using neural networks and support vector machines (SVM).

Author Contributions

Conceptualization, M.B.; methodology, M.B.; software, M.B., A.H.; validation, A.H. and B.B.; formal analysis, Y.E.M., A.S., S.M., and A.Z.; investigation, M.B. and B.B.; resources, M.B. and A.M.; data curation, M.B. and A.E.K. writing—original draft preparation, M.B., A.H. and Y.E.M.; writing—review and editing, M.B., B.B., S.M., A.S. and A.Z.; visualization, B.B. and S.M.; supervision, A.H. and Y.E.M. project administration, A.H. and A.Z.; funding acquisition, B.B., S.M. and A.Z. All authors have read and agreed to the published version of the manuscript.

Funding

The research is partially funded by the Ministry of Science and Higher Education of the Russian Federation as part of the World-class Research Center program: Advanced Digital Technologies (contract No. 075-15-2022-312 dated 20 April 2022).

Institutional Review Board Statement

Not applicable.

Informed Consent Statement

Not applicable.

Data Availability Statement

Not applicable.

Conflicts of Interest

The authors declare no conflict of interest.

Nomenclature

f ( v ) Probability density function.
k Weibull shape factor.
c Weibull scale factor in m/s.
F ( v ) Cumulative distribution function.
v Wind speed in m/s.
V m Mean wind speed in m/s.
Γ Gamma function.
V m p Most probable wind speed in m/s.
P d Wind power density in W.
ρ a Air density kg/m3.
P a Actual wind power density in w.
σ w Standard deviation.

References

  1. El Mourabit, Y.; Derouich, A.; Allouhi, A.; El Ghzizal, A.; El Ouanjli, N.; Zamzoumyes, O. Sustainable production of wind energy in the main Morocco’s sites using permanent magnet synchronous generators. Int. Trans. Electr. Energy Syst. 2020, 30, e12390. [Google Scholar] [CrossRef]
  2. Dogan, E.; Seker, F. The influence of real output, renewable and non-renewable energy, trade and financial development on carbon emissions in the top renewable energy countries. Renew. Sustain. Energy Rev. 2016, 60, 1074–1085. [Google Scholar] [CrossRef]
  3. Ellabban, O.; Abu-Rub, H.; Blaabjerg, F. Renewable energy resources: Current status, future prospects and their enabling technology. Renew. Sustain. Energy Rev. 2014, 39, 748–764. [Google Scholar] [CrossRef]
  4. Youness, E.M.; Aziz, D.; Abdelaziz, E.G.; Jamal, B.; Najib, E.O.; Othmane, Z.; Khalid, M.; Bossoufi, B. Implementation and validation of backstepping control for PMSG wind turbine using dSPACE controller board. Energy Rep. 2019, 5, 807–821. [Google Scholar] [CrossRef]
  5. Lund, J.W.; Boyd, T.L. Direct utilization of geothermal energy 2015 worldwide review. Geothermics 2016, 60, 66–93. [Google Scholar] [CrossRef]
  6. Kannan, N.; Vakeesan, D. Solar energy for future world: A review. Renew. Sustain. Energy Rev. 2016, 62, 1092–1105. [Google Scholar] [CrossRef]
  7. Ahmed, A.; Uddin, G.S.; Sohag, K. Biomass energy, technological progress and the environmental kuznets curve: Evidence from selected european countries. Biomass Bioenergy 2016, 90, 202–208. [Google Scholar] [CrossRef]
  8. Islam, M.; Mekhilef, S.; Saidur, R. Progress and recent trends of wind energy technology. Renew. Sustain. Energy Rev. 2013, 21, 456–468. [Google Scholar] [CrossRef]
  9. El Mourabit, Y.; Derouich, A.; El Ghzizal, A.; El Ouanjli, N.; Zamzoum, O. Nonlinear backstepping control for pmsg wind turbine used on the real wind profile of the dakhla-morocco city. Int. Trans. Electr. Energy Syst. 2020, 30, e12297. [Google Scholar] [CrossRef]
  10. Zhao, P.; Wang, J.; Xia, J.; Dai, Y.; Sheng, Y.; Yue, J. Performance evaluation and accuracy enhancement of a day-ahead wind power forecasting system in china. Renew. Energy 2012, 43, 234–241. [Google Scholar] [CrossRef]
  11. Zamzoum, O.; El, Y.; Errouha, M.; Derouich, A.; El, A. Active and reactive power control of wind turbine based on doubly fed induction generator using adaptive sliding mode approach. Int. J. Adv. Comput. Sci. Appl. 2019, 10, 397–406. [Google Scholar] [CrossRef]
  12. Dabbaghiyan, A.; Fazelpour, F.; Abnavi, M.D.; Rosen, M.A. Evaluation of wind energy potential in province of Bushehr, Iran. Renew. Sustain. Energy Rev. 2016, 55, 455–466. [Google Scholar] [CrossRef]
  13. Chandel, S.S.; Murthy, K.S.R.; Ramasamy, P. Wind resource assessment for decentralised power generation: Case study of a complex hilly terrain in western himalayan region. Sustain. Energy Technol. Assess. 2014, 8, 18–33. [Google Scholar] [CrossRef]
  14. Ayodele, T.; Ogunjuyigbe, A. Wind energy potential of vesleskarvet and the feasibility of meeting the south african’s sanae iv energy demand. Renew. Sustain. Energy Rev. 2016, 56, 226–234. [Google Scholar] [CrossRef]
  15. Allouhi, A.; Zamzoum, O.; Islam, M.; Saidur, R.; Kousksou, T.; Jamil, A.; Derouich, A. Evaluation of wind energy potential in morocco’s coastal regions. Renew. Sustain. Energy Rev. 2017, 72, 311–324. [Google Scholar] [CrossRef]
  16. Jiang, H.; Wang, J.; Wu, J.; Geng, W. Comparison of numerical methods and metaheuristic optimization algorithms for estimating parameters for wind energy potential assessment in low wind regions. Renew. Sustain. Energy Rev. 2017, 69, 1199–1217. [Google Scholar] [CrossRef]
  17. Loi n° 13-09 relative aux énergies renouvelables, promulguée par Dahir n° 1-10-16 du 26 Safar 1431 (11 février 2010) publiée au Bulletin officiel n° 5822 du 1er rabii II 1431 (18 mars 2010). Available online: https://www.amee.ma/ (accessed on 22 June 2023).
  18. Bousla, M.; Haddi, A.; El Mourabit, Y.; Sadki, A.; Mouradi, A.; El Kharrim, A. Detection and Prevention of Repetitive Major Faults of a WTG by Analysis of Alarms Through SCADA. In Digital Technologies and Applications. ICDTA 2023. Lecture Notes in Networks and Systems; Motahhir, S., Bossoufi, B., Eds.; Springer: Cham, Switzerland, 2023; Volume 668. [Google Scholar] [CrossRef]
  19. Kang, S.; Khanjari, A.; You, S.; Lee, J.-H. Comparison of different statistical methods used to estimate weibull parameters for wind speed contribution in nearby an offshore site, Republic of Korea. Energy Rep. 2021, 7, 7358–7373. [Google Scholar] [CrossRef]
  20. Mahmood, F.H.; Resen, A.K.; Khamees, A.B. Wind characteristic analysis based on weibull distribution of al-salman site, Iraq. Energy Rep. 2020, 6, 79–87. [Google Scholar] [CrossRef]
  21. Justus, C.G.; Hargraves, W.R.; Mikhail, A.; Graber, D. Methods for estimating wind speed frequency distributions. J. Appl. Meteorol. (1962–1982) 1978, 17, 350–353. [Google Scholar] [CrossRef]
  22. Lun, I.Y.; Lam, J.C. A study of weibull parameters using long-term wind observations. Renew. Energy 2000, 20, 145–153. [Google Scholar] [CrossRef]
  23. Werapun, W.; Tirawanichakul, Y.; Waewsak, A. Comparative study of five methods to estimate weibull parameters for wind speed on Phangan Island, Thailand. Energy Procedia 2015, 79, 976–981. [Google Scholar] [CrossRef]
  24. Chang, T.P. Estimation of wind energy potential using different probability density functions. Appl. Energy 2011, 88, 1848–1856. [Google Scholar] [CrossRef]
  25. Mathew, S. Wind Energy: Fundamentals, Resource Analysis and Economics; Springer: Berlin/Heidelberg, Germany, 2006; pp. 45–88. [Google Scholar] [CrossRef]
  26. Garcia, A.; Torres, J.; Prieto, E.; de Francisco, A. Fitting wind speed distributions: A case study. Sol. Energy 1998, 62, 139–144. [Google Scholar] [CrossRef]
  27. Jaramillo, O.A.; Borja, M.A. Wind speed analysis in La Ventosa, Mexico: A bimodal probability distribution case, Renew. Energy 2004, 29, 1613–1630. [Google Scholar] [CrossRef]
  28. Shata, A.S.A.; Hanitsch, R. Evaluation of wind energy potential and electricity generation on the coast of Mediterranean Sea in Egypt, Renew. Energy 2006, 31, 1183–1202. [Google Scholar] [CrossRef]
  29. Akpinar, E.K.; Akpinar, S. An assessment on seasonal analysis of wind energy characteristics and wind turbine characteristics. Energy Convers. Manag. 2005, 46, 1848–1867. [Google Scholar] [CrossRef]
  30. Al Buhari, M.H. A statistical analysis of wind speed data and an assessment of wind energy potential in Taiz-Yemen. Assiut Univ. Bull. Environ. Res. 2006, 9, 21–32. [Google Scholar]
  31. Egbert, B.; Rienk, V.G. Environmental Physics, 2nd ed.; John Wiley & Sons, Ltd.: Hoboken, NJ, USA, 1999. [Google Scholar]
Figure 1. Monthly production deviation.
Sustainability 15 15087 g001
Figure 2. WTGs availability [2019 vs. 2020].
Sustainability 15 15087 g002
Figure 3. Percentage distribution of faulty WTGs [2019–2020].
Sustainability 15 15087 g003
Figure 4. Monthly mean wind speed (m/s): (a) WGT 30; (b) WGT 33.
Sustainability 15 15087 g004
Figure 5. Weibull distribution: (a) WTG 30 in 2019; (b) WTG 30 in 2020; (c) WTG 33 in 2019; (d) WTG 33 in 2020.
Sustainability 15 15087 g005
Figure 6. Wind Rose diagram for (a) WTG 30 and (b) WTG 33.
Sustainability 15 15087 g006
Table 1. Real and theoretical energy production.
Production20192020
Real [Gwh]417.2400.7
Theoretical [Gwh]429.9429.9
Difference [%]2.976.81
Table 2. Estimated scale and shape factors (c, k) using the ML method.
20192020
Shape FactorScale FactorShape FactorScale Factor
January1.93 ± 0.0248.73 ± 0.0721.82 ± 0.0216.86 ± 0.059
February1.44 ± 0.01910.52 ± 0.1211.32 ± 0.0177.51 ± 0.096
March1.78 ± 0.02211.28 ± 0.1001.77 ± 0.0219.39 ± 0.083
April1.79 ± 0.0229.54 ± 0.0851.93 ± 0.02410.60 ± 0.088
May1.64 ± 0.01910.86 ± 0.1051.45 ± 0.0189.89 ± 0.108
June1.61 ± 0.0197.47 ± 0.0741.64 ± 0.0198.12 ± 0.080
July1.86 ± 0.0217.53 ± 0.0651.31 ± 0.0168.80 ± 0.106
August1.55 ± 0.0188.45 ± 0.0861.58 ± 0.0187.61 ± 0.076
September1.32 ± 0.0166.47 ± 0.0801.78 ± 0.02310.89 ± 0.101
October1.63 ± 0.0196.96 ± 0.0691.78 ± 0.0019.00 ± 0.003
November2.77 ± 0.03210.79 ± 0.0631.67 ± 0.0229.30 ± 0.089
December1.94 ± 0.02311.72 ± 0.0951.88 ± 0.0238.83 ± 0.074
Table 3. Estimate of the monthly electrical energy production for the wind farm.
TimeShape Factor
k
Scale Factor
c
Mean VelocityVelocity Frequency [m/s]Energetic Velocity [m/s]Capacity [W/m2]Power [W]Energy [GWh]Variance
January 20191.938.737.745.9912.60233.251,483,137.901.1017.40
February 20191.4410.529.554.6519.22637.994,056,637.292.7345.13
March 20191.7811.2810.047.1117.20556.293,537,138.362.6333.88
April 20191.799.548.486.0614.48333.362,119,669.271.5323.92
May 20191.6410.869.716.1417.62557.493,544,802.0032.6436.76
June 20191.617.476.694.1112.30186.391,185,160.040.8518.01
July 20191.857.536.684.95611.17157.09998,830.280.7413.99
August 20191.558.457.604.3214.44289.651,841,709.871.3725.12
September 20191.326.475.972.1913.07181.511,154,106.110.8320.95
October 20191.636.966.243.8711.41149.65951,531.060.7115.46
November 20192.7710.799.609.1813.13331.642,108,722.011.5214.08
December 20191.9411.7210.398.0716.88561.803,572,235.052.6631.12
January 20201.826.866.104.4210.32121.89775,024.750.5812.06
February 20201.327.516.912.5915.06279.231,775,492.661.2427.80
March 20201.779.398.355.8814.37322.932,053,351.851.5323.72
April 20201.9310.609.407.2715.30417.052,651,825.601.9125.63
May 20201.459.898.974.4018.01526.563,348,108.202.4939.60
June 20201.648.127.264.5613.22234.191,489,104.601.0720.71
July 20201.318.808.112.9717.78456.092,900,043.382.1638.73
August 20201.587.616.844.0412.77204.741,301,849.870.9719.56
September 20201.7810.899.696.8416.65502.733,196,609.822.3031.77
October 20201.789.008.015.6813.72282.061,793,498.071.3321.53
November 20201.679.308.315.3914.90342.112,175,310.181.5726.14
December 20201.888.837.845.9112.97249.041,583,504.521.1818.70
Table 4. Real and theoretical energy production.
Production20192020
Real [Gwh]417.2400.7
Theoretical [Gwh]487.7417.7
Difference [%]14.474.06
Table 5. Wind farm availability.
20192020
WTGWind Conditions
OK [4–25 m/s]
Hours Number
True Prod > 0Raw Availability %Wind Conditions
OK [4–25 m/s]
Hours Number
True Prod > 0Raw Availability %
T139,93738,98797.62%38,33437,37597.50%
T238,32537,58298.06%37,00036,41398.41%
T339,59138,99198.48%38,87638,07797.94%
T440,23939,64298.52%39,54938,53797.44%
T540,83740,00997.97%40,11439,05597.36%
T642,05841,65499.04%41,79741,29098.79%
T743,02541,95897.52%42,33441,85998.88%
T842,89841,97397.84%41,15640,42298.22%
T943,46341,47795.43%42,42141,21697.16%
T1044,39843,50797.99%43,39242,17897.20%
T1143,17942,24297.83%41,60040,93898.39%
T1238,33337,87598.81%38,77237,97897.95%
T1342,29340,33695.37%41,85339,41894.18%
T1440,45539,87698.57%40,81640,06098.15%
T1545,08743,09095.57%44,78544,17498.64%
T1640,14639,81199.17%40,43940,03799.01%
T1740,06239,28898.07%40,29639,11197.06%
T1840,24839,94599.25%40,53139,64997.82%
T1939,92438,54596.55%39,84339,44399.00%
T2040,56939,03896.23%40,51338,83795.86%
T2145,20544,35898.13%44,00643,43498.70%
T2244,71343,34996.95%43,46142,93398.79%
T2344,55444,04198.85%43,15541,60696.41%
T2443,19441,57496.25%43,08342,30598.19%
T2545,37544,73798.59%45,02244,08397.91%
T2644,85543,51497.01%44,47742,87396.39%
T2742,00241,46398.72%41,32240,94199.08%
T2844,11843,18097.87%43,46342,72498.30%
T2944,65242,97896.25%42,95041,60996.88%
T3040,87930,42274.42%41,25930,50573.94%
T3145,37041,97792.52%44,90644,22098.47%
T3245,71543,31294.74%44,86842,00893.63%
T3344,50340,39990.78%44,32640,33290.99%
T3444,57743,47497.53%45,48744,66298.19%
T3544,60444,14898.98%45,10344,23998.08%
T3645,49844,71398.27%44,44143,78798.53%
T3745,13844,15397.82%44,42842,93396.64%
T3843,70642,72097.74%42,92641,81497.41%
T3944,15743,29898.05%42,82141,50696.93%
T4044,42043,90598.84%24,75123,34294.31%
Table 6. Annual availability and unavailability of the site.
Availability %96.8%
Unavailability %3.2%
Table 7. Real and theoretical energy production and corrected annual difference.
Production20192020
Real [Gwh]417.2400.7
Theoretical [Gwh]487.7417.7
Initial difference [%]14.5%4.1%
Unavailability %3.20%
Corrected difference [%]11.26%4.07%
Table 8. Statistical test results of Weibull distribution.
20192020
R20.920.94
χ20.910.99
RMSE0.0320.019
Table 9. Action plan to optimize the problems and the effects of these sub-parts for the installed generator.
Sub-ComponentIssueRecommendations
Anemometer
  • The reading of the inductive jumps less than 2 m/s in a cycle, and this error is repeated less than 5 times in 10 s. The bookkeeper of errors itself decreases by a unit each 10 s.
  • The sign of wind does not vary in 5 min.
  • Change the anemometer.
Temperature sensor PT 100
  • The temperature environment elevates above 40 °C during a time of 1 sg.
Some of the three temperatures measured by the PT100 of the transformer of 33 KV surpasses the 155 °C.
  • Revise that the PT100 is not of an erroneous value.
  • Verify real temperature, the PT100.
Vibrations sensors
  • The PLC detects failure of the digital entrance.
  • Verify vibrations of the machine. Verify the sensor and wiring.
Yaw rotations counter
  • Failure in the signs provided by the tappets of the sensor revolution counters or failure in the value of the incremental encoder either for failures of diet, failures of the sensor, or failures of the module of entrances.
  • Difference between digital exit that activates the CW motor and its feedback.
  • Regarding the machine costs, it costs a lot to orient and surpasses 1000 sg. It is annulled when the machine itself untwists.
  • The machine marks the time of the necessary part untwisting. Time marked by the parameter: 4950 sg.
  • Untwisting towards a side and activation of the Twist sensor that indicates the opposite.
  • The two activations of any one of thermal relays of the yaw motor.
  • Verify the supply to the sensor, activation of the tappets in the PLC, and activation of the signs of the incremental encoder.
  • Verify activation of the KR100 relay, KM100 contactor, and contact to help with this.
  • Verify the untwist sensor. Diet of the same one and activation of signs.
  • Verify the state of the two motors, and replace the thermal relay. Verify digital inputs.
Disclaimer/Publisher’s Note: The statements, opinions and data contained in all publications are solely those of the individual author(s) and contributor(s) and not of MDPI and/or the editor(s). MDPI and/or the editor(s) disclaim responsibility for any injury to people or property resulting from any ideas, methods, instructions or products referred to in the content.

