Abstract
Supply chain agility has become a key success factor for businesses trying to handle upheavals and uncertainty in today’s quickly changing business environment. Proactive risk reduction is essential for achieving this agility. To facilitate real-time risk prevention and improve agility, this research study proposes an innovative strategy that makes use of machine learning as well as predictive analytics approaches. Traditional supply chain risk management frequently uses post-event analysis as well as historical data, which restricts its ability to address real-time interruptions. This research, on the other hand, promotes a futuristic methodology that uses predictive analytics to foresee possible disruptions. Based on contextual and historical data, machine learning models can be trained to find patterns and correlations as well as anomalies that point to imminent dangers. Organizations can identify risks as they arise and take preventative measures by incorporating these models into a real-time monitoring system. This study examines numerous predictive analytics methods, showing how they can be used to spot supply chain risks. These methods include time series analysis and anomaly detection as well as natural language processing. Additionally, risk assessment models are continuously improved and optimized using machine learning algorithms, assuring their accuracy and adaptability in changing contexts. This research clarifies the symbiotic relationship among predictive analytics and machine learning as well as supply chain agility using a synthesis of theoretical discourse and practical evidence. Case studies from various sectors highlight the usefulness and advantages of the suggested strategy. The advantages of this novel technique include improved risk visibility and quicker response times as well as the capacity to quickly modify operations. The development of a holistic framework that incorporates predictive analytics and machine learning into risk management procedures, setting the path for real-time risk identification as well as mitigation, is one of the theoretical contributions. On the practical side, the case studies offered in this paper show the actual benefits as well as the adaptability of the proposed approach across a wide range of businesses.
1. Introduction
The structure and operation of supply chains have grown more complex and interconnected in the modern setting of networked economies and global trade. However, because of this increased complexity, supply networks are now more susceptible to a wide range of possible disruptions. These disruptions, which cover a wide range of occurrences like earthquakes, political unrest, abrupt changes in consumer demand, and the financial collapse of suppliers have an opportunity to impair the efficient flow of products, services, and information along the supply chain [1,2,3,4,5]. This has, in turn, brought attention to how important it is for businesses to cultivate greater supply chain agility.
The ability of an organization to quickly and effectively respond to unanticipated disturbances by modifying its procedures and activities is embodied by supply chain agility. The continuity of operations and sustaining customer satisfaction become crucial in the face of such disruptions, which might happen unexpectedly and without warning. This agility includes both the tactical ability to move quickly to respond to changes as well as the strategic adaptability to accommodate such changes. The ultimate objective of supply chain agility is to achieve a competitive edge in a fluid and unpredictable business environment by not only reducing risks and minimizing interruptions but also by utilizing unanticipated possibilities [6,7].
The majority of conventional supply chain risk management techniques have been reactive, frequently depending on post-event analysis as well as historical data to resolve interruptions after they have already occurred [5,6,7]. In a time of unheard-of volatility, uncertainty, complexity, and ambiguity (VUCA), this strategy is ineffective [8]. To maintain their competitiveness and resilience in such a setting, organizations must switch from the reactive handling of risks to proactive risk mitigation. A paradigm shift that takes advantage of the convergence of two disruptive technologies, predictive analytics and machine learning, is required for accomplishing this transition [9]. To determine the possibility of upcoming events or trends, predictive analytics employs historical data, statistical algorithms, and machine learning approaches. Contrarily, machine learning enables systems to enhance their performance by learning from data, allowing them to spot patterns and correlations as well as anomalies that would not be seen using conventional analytical techniques [10,11,12]. While many organizations are still struggling to recover from the pandemic’s effects, others—such as supply chain—took the opportunity to broadly apply these modern technologies. The ability of artificial intelligence (AI) to revolutionize processes, decision-making, and overall performance makes it one of the most cutting-edge technologies that businesses must use to stay ahead of the curve [13]. The industry for supply chain solutions has profited from AI, according to data from Statista, because of advancements in real-time delivery controls, inventive manufacturing, adaptable logistic systems, and inventory management [14]. The following figure (Figure 1) shows the adoption rate in the supply chain globally during 2022–2025.
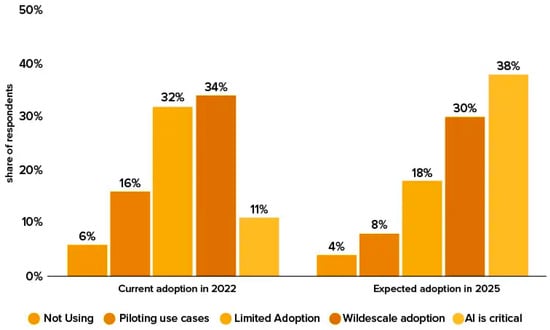
Figure 1.
Artificial intelligence adoption rate in supply chain globally (2022–2025) [14].
The integration of predictive analytics and machine learning is critical for this research study due to its potential for transformation in supply chain risk management. These sophisticated approaches enable organizations to proactively identify as well as mitigate risks in real-time, moving the paradigm from reactive crisis management to proactive risk avoidance. Organizations may optimize resource allocation, increase operational continuity, and enhance customer satisfaction by leveraging the strength of predictive analytics, historical data, and machine learning algorithms in today’s dynamic business environment. This integration significantly improves supply chain agility as well as resilience, making it essential for reducing adverse events and maintaining competition in today’s global marketplace.
The use of predictive analytics and machine learning in supply chain risk management is critical due to its transformative potential in moving risk mitigation from a reactive to a proactive paradigm. This integration profoundly modifies the conventional risk management strategy by enabling organizations to foresee and handle possible interruptions before they worsen. Businesses may spot early warning signs and abnormalities in their supply chains by leveraging the power of predictive models, historical data, and real-time analytics. For example, they can spot rapid shifts in demand, problems with suppliers’ performance, or developments in the market that could cause disruptions. This proactive approach enables prompt changes, such as modifying production schedules, reallocating resources, or finding substitute suppliers, greatly boosting the agility as well as the resilience of the supply chain. The main objective of this study is to shed light on how organizations can move from reactive risk management to a proactive as well as an anticipatory strategy by integrating predictive analytics and machine learning. It highlights the crucial role played by these technologies in enhancing supply chains’ overall agility and flexibility in an increasingly multifaceted and turbulent business environment, in addition to reducing the impact of disruptions. This research study digs at the synergy among predictive analytics and machine learning as well as supply chain risk management. The primary finding of this study is that organizations can considerably improve their agility by recognizing and reducing risks in real time or even proactively before they materialize by integrating predictive analytics as well as machine learning into supply chain risk management systems. This strategy offers a fresh means of navigating interruptions and uncertainties and marks a change from the reactive manner of risk management.
The structure of the article is as follows: A thorough assessment of the literature is presented in Section 2, with particular attention paid to the development of supply chain risk management as well as the rise of predictive analytics and machine learning. The conceptual framework is described in Section 3, which also clarifies the underlying ideas and methods used in the suggested strategy. Section 4 presents the statistical findings in this study. Case studies from diverse sectors are presented in Section 5 to show how the suggested technique can be used in practice and what it can do. The implications and difficulties of incorporating machine learning as well as predictive analytics into supply chain risk management are discussed in Section 6. Ultimately, Section 7 brings the work to a close by summarizing the major conclusions and proposing prospective directions for further investigation.
2. Related Works
The field of supply chain risk management has attracted substantial attention from researchers and practitioners due to its crucial role in guaranteeing the smooth movement of goods, services, and information within a globalized business environment [11]. This section explores a thorough analysis of previous research and connected works that have investigated various supply chain resilience and agility-improving techniques, approaches, and technology. We acquire important insights into the development of risk management systems, identify new trends, and pinpoint gaps that drove the creation of the suggested framework by studying the body of knowledge that exists in this area. This review lays the groundwork for comprehending the wider context within which our study brings unique insights and developments through an analysis of many views and empirical findings. Many research investigations have examined the incorporation of cutting-edge technology into supply chain risk management, illuminating its various aspects, possible advantages, and present difficulties [12]. With a focus on their methodology, conclusions, and the gaps they jointly disclose, the scholarly initiatives that have contributed to comprehending this dynamic terrain are thoroughly reviewed in this section.
Small- and medium-sized enterprises (SMEs) were the focus of Wong et al.’s [15] research. They created a structural model that combined supply chain agility, supply chain re-engineering, and AI-driven risk management skills. The study determined the positive impact of AI utilization on risk management, its effect on re-engineering abilities, and the intermediary function these capabilities play in improving supply chain agility by using partial-least-squares-based structural equation modelling (PLS-SEM) as well as artificial neural network (ANN) strategies. This study shed light on how AI can be used to handle complications brought on by demand uncertainty, enabling knowledgeable decisions and quick resource allocation.
A unique multi-agent-based supply chain management system supported by big data analytics was introduced by Giannakis and Louis [16]. This framework was created to affect supply chain agility through autonomous corrective control actions. Responding, flexibility, and speed were the three main elements of agility that the study discovered, and the organizational architecture of the system was organized by these findings. This investigation demonstrated how cutting-edge technologies can improve agility throughout dimensions, which has implications for quick, adaptable, and responsive supply chain operations.
Observations into the elements influencing supply chain agility in the automobile industry were provided by Jayender and Kundu [17]. Their research sought to understand how this partnership affects the industry’s capacity to remain nimble by examining the possibility of interoperability among big data analytics and ERP systems. It was suggested to use a graph-theory-based technique to improve agility and handle implementation problems. This study highlighted the requirement for novel strategies to guarantee agility in complex businesses.
Shamout [18] examined supply chain data analytics and how it influences supply chain agility. The investigation evaluated causal recipes that forecast high levels of supply chain agility utilizing a mix of supply chain data analytics, business size, firm age, and annual sales using fuzzy sets qualitative comparative analysis (fsQCA). The importance of comprehensive data analytics as well as its contributions to accomplishing supply chain agility in a complicated business environment were highlighted in this study.
A systematic literature review was carried out by Schroeder and Lodemann [19] to evaluate the application of machine learning (ML) in supply chain risk management (SCRM). They looked at how ML has been used to handle supply chain risks in theoretical and practical situations, especially when identifying production, transport, and supply hazards. The study demonstrated how ML may improve SCRM by incorporating new data sources and providing in-the-moment insights into potential dangers.
Real-time incident detection was investigated by Lee et al. [20] utilizing Twitter information as well as blockchain technology to improve supply chain visibility and proactively reduce risks. This cutting-edge strategy demonstrated the potential for better risk management using real-time data collecting and the security and transparency capabilities of blockchain.
In their thorough study of the literature, Ganesh and Kalpana [21] looked at the use of AI and ML techniques throughout the many stages of supply chain risk management. The research shed light on the various AI algorithms used and the different supply chain risks covered. This study found gaps in the corpus of existing material and offered intriguing directions for more study as well as difficulties with implementation.
The idea of a digital supply chain twin—a computerized model that replicates real-time network states—was first proposed by Ivanov and Dolgui [22]. The research investigation looked at using digital twins to improve supply chain visibility and manage interruption risks. The COVID-19 pandemic as well as its impact on supply chains showed how urgently business continuity was dependent on digital twins.
To examine the relationship between big data analytics as well as sustainable supply chain management, Mageto [23] adopted Toulmin’s argumentation model. The report found issues including cyberattacks and talent gaps and emphasized how big data analytics improves sustainable practises inside manufacturing supply chains. Dolgui and Ivanov [24] researched 5G’s potential to improve digital supply chains and smart operations. From operational procedures to strategic viewpoints, they discovered potential transformational areas. The cost–benefit trade-offs related to the adoption of 5G technologies were also covered in the study.
The research aim, research design, research gap, and major conclusions of each of the studies cited are briefly summarized in the following meta-analysis table (Table 1). It shows the variety of methods and perspectives that these studies have contributed to the subject of supply chain risk management and technology integration.

Table 1.
Meta-analysis findings based on related works.
Overall, these studies shed light on the application of technologies such as machine learning and predictive analytics as well as others to supply chain risk management. Through a variety of techniques and practical contexts, they help us grasp the implications, difficulties, and creative opportunities of utilizing these technologies for flexible and resilient supply chains. Despite significant advancements, there is still a research gap in the area of supply chain agility and the seamless integration of real-time data analytics, predictive modelling, and flexible decision-making. This gap serves as the driving force for the development of the proposed framework, which strives to solve these constraints and provide a comprehensive solution for supply chain security while preserving operational flexibility as well as customer satisfaction.
However, when taking into account the constantly changing interactions of real-time data analytics, predictive modeling, and flexible decision-making under the setting of supply chain agility improvement, a clear research gap arises despite the significant progress made in supply chain risk management. Research that has already been carried out frequently ignores the seamless integration of risk identification, impact evaluation, and response strategies in favor of concentrating on certain components of these topics. Furthermore, conventional approaches have demonstrated limitations in their capacity to properly and promptly manage disturbances in light of the growing complexity of worldwide supply chains and the influx of real-time data. By offering a novel methodology that combines the capabilities of predictive analytics, machine learning, and continuous learning processes, our research intends to close this gap. Our framework aims to tackle the drawbacks of existing technologies and provide a comprehensive solution for organizations trying to protect their supply chains from unanticipated events while maintaining operational flexibility as well as customer satisfaction by combining these innovations with a holistic view of risk management.
3. Proposed Framework
To improve real-time risk mitigation as well as supply chain agility, in this part, we offer a thorough conceptual framework that supports the incorporation of predictive analytics as well as machine learning into supply chain risk management. To create a synergistic strategy that enables organizations to proactively address problems, this framework incorporates well-established principles from the supply chain management as well as data science areas.
Supply chain data include customer, shipping, order, sale, shop, and product information [25,26]. Figure 2 depicts the taxonomy of supply chain data. As a result, SC data are derived from several (and dispersed) sources, such as sales, inventory, manufacturing, and warehousing, as well as transportation. In this aspect, established predictions of demand may be under- or over-estimated due to market rivalry, price volatility, technological advancements, and shifting customer commitments. As a consequence, supply chain data need to be carefully evaluated to better understand market conditions, consumer behavior, producers, and technology. By spotting trends and patterns in these data and applying those to improve the accuracy of future forecasting, expenses related to the supply chain can be reduced.
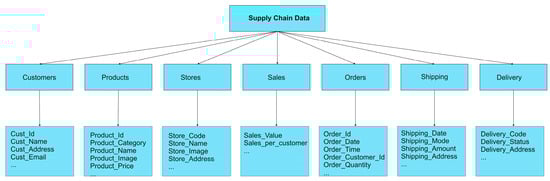
Figure 2.
Supply chain data taxonomy.
Predictive analytics and machine learning are easily integrated into the proposed framework’s architectural structure to strengthen supply chain risk management. To support data gathering, processing, modeling, and real-time monitoring, this architecture includes a multi-tiered configuration. To find anomalies and possible interruptions, the system relies on sophisticated prediction algorithms that make use of real-time and historical data sources. The modular structure of the framework enables adaptation and the integration of diverse algorithms. Through prompt notifications and interventions, this framework makes sure that the generated predictive insights are converted into achievable actions. The next picture illustrates how this framework orchestrates data flow and decision-making, showing how data are transformed into proactive tactics for increased supply chain agility. Figure 3 shows the architectural structure of the proposed framework.
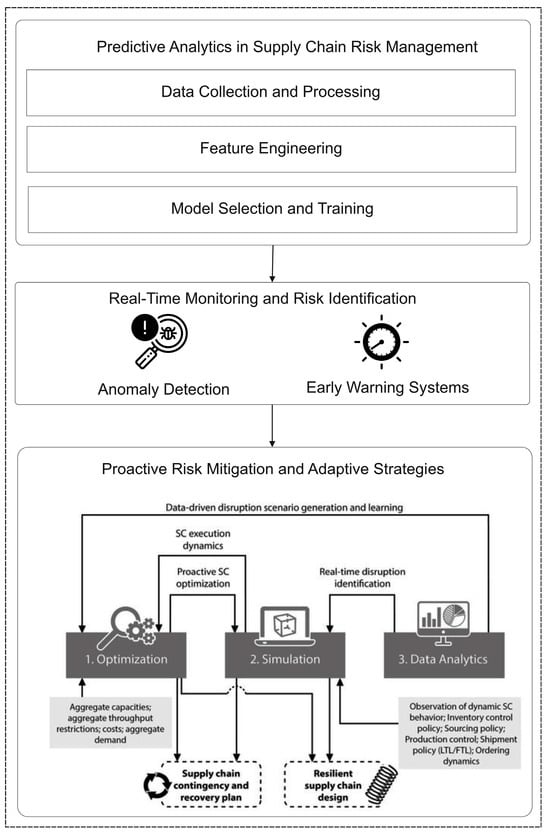
Figure 3.
Architectural structure of the proposed framework.
3.1. Predictive Analytics in Supply Chain Risk Management
Our suggested strategy is built on predictive analytics, which uses both historical and current data to anticipate possible disruptions before they happen. Predictive analytics allows for the identification of patterns, correlations, and trends that conventional risk management methods may overlook by utilizing sophisticated statistical methods as well as machine learning algorithms.
3.1.1. Data Collection and Processing
The first phase of this research focused on systematic data collection from both internal and external sources, laying the groundwork for our real-time supply chain risk mitigation methodology. This extensive information helped our predictive analytics and machine learning models to successfully anticipate and manage supply chain problems. Internal data sources included critical supply chain factors such as lead times, stock levels, previous disruption records, and numerous metrics associated with overall supply chain efficiency. This information was collected from the company’s databases and systems. It was critical to ensure the correctness and consistency of these data because they directly affected the level of accuracy of our subsequent studies. We added an assortment of external sources of information along with internal data, which could influence supply chain processes. Market movements, economic indicators, weather forecasts, and geopolitical developments were among the external sources. To gain access to these external data, we used APIs, data providers, and appropriate repositories, confirming that we obtained the most up-to-date information.
Data preprocessing was an important step in preparing the collected data for analysis. Our team thoroughly cleaned and synchronized the data throughout this step, resolving flaws such as missing values, outliers, and inconsistencies. This procedure was critical for improving the overall quality as well as the integrity of the dataset. We used feature engineering to gain actionable insights and improve the performance of our prediction models. This entailed carefully selecting characteristics (features) that would be important in predicting supply chain disruptions. These characteristics were picked for their importance and contribution to our risk prediction system. It was critical to identify and define the response list, which included the precise risk factors as well as the outcomes we hoped to forecast. These response factors were selected with care to correspond with our research aims and provide meaningful insights for risk mitigation methods. We confirmed that our dataset was not only extensive but also rigorously prepared for further analysis by adhering to these stringent data-gathering and processing methods. The data’s excellent quality and relevance were critical to the efficacy and validity of our real-time supply chain risk mitigation approach.
3.1.2. Feature Engineering
Feature engineering was an important step in our research process, in which we carefully picked and manipulated significant variables that were used as inputs to our prediction models. These factors are useful in understanding the dynamic nature of supply chain activities as well as potential risk triggers. In our feature collection, we prioritized time-dependent traits, contextual factors, and event indicators. Time-dependent properties assisted us in accounting for temporal patterns and trends in the supply chain, making sure our models considered the historical context. Contextual variables, which include external elements such as market circumstances, economic data, and geopolitical events, offer a larger view. Event indicators assisted us in identifying specific occurrences or disruptions that may have a substantial impact on the supply chain. By thoughtfully engineering our features, we enhanced the predictive power of our models, enabling them to better anticipate and mitigate real-time supply chain risks.
3.1.3. Model Selection and Training
Time series analysis, regression, and classification algorithms serve as a few examples of the several prediction models that were taken into account in this study. The choice of these particular algorithms was based on how well they can handle different aspects of supply chain risk management. Since it is so effective at identifying and predicting trends and patterns in previous supply chain data, time series analysis was chosen. Using this, we can recognize seasonality, cyclical patterns, and underlying trends, all of which are essential for predicting changes in demand and supply chain breakdowns. On the other hand, regression analysis is a good tool for figuring out how various supply chain factors relate to one another. It aids in quantifying how the performance of the supply chain is impacted by variables like demand, lead times, and outside market circumstances. We can categorize and forecast events or outcomes by employing classification algorithms, which is useful for determining the possibility that particular hazards or disruptions may occur. A large volume of the supply chain risk management literature supports these algorithmic decisions [27,28,29,30]. In this study, we chose algorithms based on several criteria, such as their applicability to supply chain risk management, proven efficacy in earlier studies, and compatibility with the data we had for our case studies. Although our chosen algorithms have shown their value in addressing different parts of supply chain risk, we understand how important it is to keep up with the latest developments in the industry. The requirement for striking a balance between creativity and practicality had an impact on the decision not to include the most cutting-edge methods in this study. Supply chain risk management frequently takes place in a real-world setting with variable data accessibility, computing capacity, and organizational readiness. We selected algorithms that have already demonstrated reliable performance in tackling supply chain difficulties to assure the broad application and viability of the proposed framework.
Demand forecasting using time series analysis has been shown to be successful, allowing businesses to proactively modify their operations. Risk assessment is aided by the widespread use of regression analysis to determine how different factors affect supply chain performance. To predict and categorize hazards, classification algorithms have been deployed, enabling specialized risk-reduction tactics. In essence, the selected algorithms have been proven and offer particular benefits in supply chain risk management. They allow us to effectively use real-time as well as historical data, anticipate hazards, and make defensible decisions. To guarantee accuracy and resilience, these models are trained by employing historical data and tested using methods like cross-validation. To iteratively enhance the effectiveness of the models and adapt to changing circumstances, machine learning techniques are used.
To assure the continued accuracy of the predictive models, we recognized the importance of implementing processes that allow dynamic model updating based on fresh data. This constant model modification is essential for accurately capturing changing supply chain dynamics as well as preserving the applicability of forecasts in real-time. In our approach, we suggest the use of a continuous learning process in which predictive models are not static but rather created to change along with the supply chain environment. To achieve this, we support the application of methods like online learning that allow models to take in and incorporate fresh data as they come in. Our architecture includes essential elements like rolling time windows for updates or routine model retraining at predetermined intervals. We hope to ensure that the prediction models maintain their accuracy and relevance even as the supply chain environment evolves by incorporating these mechanisms for ongoing model updates. This improvement demonstrates our dedication to offering a strong and flexible framework for supply chain risk management that is in line with the dynamic character of contemporary supply chains (Algorithm 1).
| Algorithm 1: Predictive Analytics in Supply Chain Risk Management |
1. Input: preprocessed and harmonized dataset, selected features, and response variables. 2. Output: trained predictive models, model evaluation results. 3. Initialize empty lists “feature_list” and “response_list” to store selected features and response variables. 4. For each selected feature “feature” in selected features: a. Append “feature” to the “feature_list”. 5. For each selected-response variable “response” in response variables: a. Append “response” to the “response_list”. 6. Prepare feature matrix “X” by extracting features from the preprocessed dataset using the “feature_list”. 7. Prepare response vector “y” by extracting response variables from the preprocessed dataset using the “response_list”. 8. Split the dataset into training and testing subsets, ensuring temporal integrity if applicable. 9. For each predictive model “model” to be trained: a. Initialize an empty model instance with relevant parameters. b. Train “model” using the training subset, feature matrix “X”, and response vector “y”. 10. Perform model evaluation using the testing subset: a. For each trained model “model”: i. Make predictions on the testing subset using “model” and feature matrix “X”. ii. Evaluate model performance metrics (e.g., accuracy, precision, recall, F1-score, RMSE) based on predicted values and true response values. 11. Select the best-performing predictive model based on evaluation metrics or domain-specific criteria. 12. Optionally, perform model hyperparameter tuning to optimize model performance. 13. Output the trained predictive model “best_model” and the results of model evaluation. End. |
- Mathematical Modeling
This approach is aimed at tackling specific supply chain risk management activities such as predictive analytics, real-time monitoring, and anomaly detection. To accomplish its goals, a machine learning model is trained and verified utilizing historical and real-time data. This section explains how machine learning approaches are used to solve various supply chain risk management activities such as predictive analytics and real-time monitoring as well as identifying anomalies. It starts by outlining the essential elements of a machine learning model, giving an understanding of the basic building blocks. These include the input data (X), which encompass various features and their respective values, the output predictions (Y), which are the model’s generated forecasts or classifications, and the model parameters (θ), representing the weights or coefficients tied to each feature. This section emphasizes that the primary objective of a machine learning model is to minimize an objective function (J) specific to the chosen algorithm and task. This function quantifies the disparity between predicted values and actual outcomes in the training data. The ultimate goal of the model’s training process is to discover the optimal parameter values (θ*) that minimize this objective function, as represented mathematically. This section also introduces critical concepts like the training dataset (D_train) containing labeled examples used for model training and the testing dataset (D_test) employed to assess the model’s performance. Finally, it mentions the essential evaluation metrics and hyperparameters that influence the model’s behavior. This paragraph sets the stage for a comprehensive understanding of how machine learning is applied to supply chain risk management activities.
The machine learning model, M, can be defined as:
Input data (X): the input data comprise a set of features and their corresponding values, represented as X = {x_1, x_2, …, x_n}, where each x_i is a feature, and n is the total number of features.
Output prediction (Y): the model generates predictions or classifications as output, represented as Y = {y_1, y_2, …, y_m}, where each y_i is a predicted value or class label, and m is the number of predictions.
Model parameters (θ): the machine learning model is parameterized by a set of parameters, θ = {θ_1, θ_2, …, θ_k}, where each θ_k represents a weight or coefficient associated with a feature.
Objective function (J): The model aims to optimize an objective function, J(θ), which quantifies the difference between the predicted values and the actual outcomes in the training data. This objective function is specific to the chosen algorithm and task.
The machine learning model’s training process involves finding the optimal values for the parameters, θ, that minimize the objective function J(θ). This optimization can be mathematically represented as:
θ* = argmin J(θ)
Training dataset (D_train): the training dataset, D_train, consists of labeled examples (X_train, Y_train), where X_train represents the input features, and Y_train represents the corresponding actual outcomes.
The training process seeks to find the values of θ that minimize the following loss function:
J(θ) = Loss(Y_train, M(X_train, θ))
Testing dataset (D_test): The efficacy of the model is tested after training on a separate testing dataset, D_test, which includes input features, X_test, as well as actual outcomes, Y_test. To evaluate the model’s accuracy and performance, the predictions are compared to Y_test.
Model evaluation metrics: The mean absolute error (MAE), mean squared error (MSE), root mean squared error (RMSE), accuracy, precision, recall, F1-score, and other metrics may be used to evaluate the model’s performance. These metrics provide quantifiable assessments of the model’s efficacy.
Hyperparameters (H): Learning rates, regularization parameters, as well as tree depths, are common hyperparameters in machine learning algorithms that impact the model’s behavior. Such hyperparameters are usually set before training and can affect the model’s performance.
In general, this mathematical model gives a framework for comprehending the way in which machine learning algorithms work within the scope of the proposed methodology. It includes the input data, model parameters, objective function, training and testing datasets, evaluation metrics, and hyperparameters, which are all necessary elements of the machine learning procedure in supply chain risk management. The particular mathematical equations for the objective function, as well as optimization, may change depending on the chosen technique (e.g., linear regression, neural networks, support vector machines, etc.), and additional specifics for the specific algorithms employed would be included in the paper.
3.2. Real-Time Monitoring and Risk Identification
This stage entails smoothly integrating the earlier-built predictive models into a dynamic monitoring system that continuously evaluates the incoming data flows in real time. The system is built to carefully monitor the many data streams throughout this stage, which includes data on everything from sales numbers and inventory levels to lead times and external variables like market trends as well as economic data. The goal of this constant surveillance is to spot any anomalies, errors, or early warning signs that could portend the beginning of supply chain operations interruptions or dangers. For example, the system may be set up to spot abrupt increases or decreases in sales that do not follow the usual trends. Similarly, it could spot sudden changes in lead times or inventory levels that might indicate abnormalities in the supply chain. The system can identify trends that depart from the norm by continually contrasting real-time data against the predicted models and raising flags when such anomalies emerge.
The monitoring system immediately sends out alerts the instant it notices these anomalies. These notifications advise supply chain managers or other pertinent parties that additional research and action are necessary. Before the possible risk develops into an interruption that could affect operations, client satisfaction, or financial performance, it is important to act quickly and efficiently. In essence, this stage shows how the earlier-generated predictive models have been operationalized. It utilizes their talents to watch and assess the continuing data streams in real time by putting them to work in a practical situation. This enhances the supply chain’s overall agility and resilience by enabling organizations to respond to emerging hazards in a timely and informed manner.
3.2.1. Anomaly Detection
In the real-time tracking and risk identification stage of the suggested framework, anomaly detection techniques are essential. They are tasked with automatically finding any deviations or abnormalities from the established patterns in the incoming data streams. These variations could be a sign of impending irregularities or interruptions in the supply chain activities. These algorithms analyze the observed values and trends for numerous parameters, including sales, inventory levels, lead times, or other pertinent metrics, when they are adapted to real-time data. The algorithms can pinpoint occasions where the observed data considerably deviate from what is thought to be normal by comparing the present values to previous data and the expected behavior.
These variations might not necessarily point to a problem, but they can be potential early warning signs of problems. In some cases, a rapid and unanticipated rise in sales may indicate an unanticipated surge in demand, which may result in inventory shortages. On the other hand, a sudden drop in sales may indicate a problem in the supply chain that influences product availability. Anomaly detection is valuable because it can give organizations early warning signs of potential disruptions, allowing them to quickly take action and lessen the effects [31,32]. To maintain operational continuity, prompt intervention may entail changing production schedules, reallocating resources, or finding new suppliers. The one-class SVM (support vector machine) algorithm for anomaly detection is shown below (Algorithm 2).
| Algorithm 2: Anomaly Detection using One-Class SVM |
1. Input: real-time data stream, trained one-class SVM model, predefined anomaly score threshold. 2. Output: detected anomalies, and alerts. 3. Initialize empty lists of “anomalies” and “alerts” to store detected anomalies and generated alerts. 4. For each incoming data point “data_point” in the real-time data stream: a. Use the trained one-class SVM model to predict the anomaly score of “data_point”. b. Compare the anomaly score with the predefined threshold. 5. If the anomaly score is higher than the threshold: a. Mark “data_point” as an anomaly. b. Add “data_point” to the “anomalies” list. c. Generate an alert indicating a potential disruption. 6. Return the list of detected anomalies “anomalies” and the list of generated alerts “alerts”. End. |
The term “trained One-Class SVM model” in this algorithm denotes a model that has been developed using the one-class SVM algorithm and trained on historical data. The anomaly score threshold establishes the level at which a data point is deemed anomalous.
3.2.2. Early Warning Systems
Early warning systems discover important abnormalities by using predetermined thresholds and alerts. Automated notifications are issued when these thresholds are crossed, starting preventative actions to address potential dangers before they worsen [33,34,35]. A crucial component of guaranteeing the efficacy of the real-time monitoring as well as the risk identification stage in the proposed framework is setting the alert threshold for anomaly detection. Depending on the particular requirements and features of the supply chain being monitored, it is decided whether the threshold should be fixed or dynamic. The trade-off between sensitivity to abnormalities and the risk of setting off false alarms must be taken into account when deciding between a fixed and dynamic threshold. This choice should be based on elements including supply chain volatility, the data update frequency, and the effects of missing actual anomalies.
The threshold, whether fixed or dynamic, must be calibrated and updated repeatedly as the supply chain is used. To make sure that the threshold continues to be applicable and useful in identifying potential dangers without generating unnecessary interruptions due to false alarms, regular reviews as well as evaluations should be carried out. To achieve the ideal balance between sensitivity and specificity in anomaly detection, the threshold can be adjusted over time using historical and real-time data.
The early warning system determines whether a data point’s anomaly score exceeds a predetermined threshold for alert generation:
Let X be the feature vector of a data point.
Let score(X) be the anomaly score assigned to data point X by the one-class SVM model.
Let the threshold be the predefined threshold for anomaly scores.
The alert condition is defined as:
If score(X) > threshold, an alert is generated.
Here is the algorithm outlining the steps for the “Early Warning Systems” phase using the one-class SVM algorithm (Algorithm 3):
| Algorithm 3: Early Warning Systems using One-Class SVM |
1. Input: real-time data stream, trained one-class SVM model, predefined alert threshold. 2. Output: generated alerts. 3. Initialize an empty list “alerts” to store generated alerts. 4. For each incoming data point “data_point” in the real-time data stream: a. Use the trained one-class SVM model to predict the anomaly score of “data_point”. b. Compare the anomaly score with the predefined alert threshold. 5. If the anomaly score is higher than the alert threshold: a. Generate an alert indicating a potential disruption. b. Add the alert to the “alerts” list. 6. Return the list of generated alerts “alerts”. End. |
3.3. Proactive Risk Mitigation and Adaptive Strategies
The framework encourages the creation and application of proactive risk mitigation solutions when possible threats have been identified. These tactics ensure an efficient and well-informed decision-making process by drawing on historical data, machine learning insights, and pre-established reaction protocols.
3.3.1. Risk Impact Assessment
Quantifying the possible effects of recognized hazards on supply chain operations is made easier with the use of predictive analytics. The prioritization of response measures and resource allocation are informed by this assessment. The supply chain operations’ potential impact of identified risks is quantified during the risk impact evaluation phase. Based on the seriousness of the hazards, this assessment helps to prioritize the appropriate reaction activities [36,37,38,39]. A combination of elements and characteristics pertinent to the particular supply chain environment can be used to quantify the effect evaluation.
Let us define the following terms:
- R: Set of identified risks.
- I_r: Impact of risk r on supply chain operations.
- C_r: Cost associated with risk r in terms of revenue impact or additional expenses.
- P_r: Probability of risk r occurring.
- The overall impact I_r of risk r on supply chain operations can be calculated as:
- I_r = C_r * P_r
- The impact assessment can be further categorized based on severity levels:
- Low-impact: I_r < Threshold_Low
- Moderate-impact: Threshold_Low <= I_r < Threshold_Moderate
- High-impact: I_r >= Threshold_Moderate
where Threshold_Low and Threshold_Moderate are predefined thresholds that determine the severity levels (Algorithm 4).
| Algorithm 4: Risk Impact Assessment |
Here is an algorithm outlining the steps for the “Risk Impact Assessment” phase: Algorithm: Risk Impact Assessment 1. Input: identified risks R, associated costs C_r, probabilities P_r, predefined severity thresholds. 2. Output: categorized risks based on impact levels. 3. For each identified risk r in R: a. Calculate the impact I_r using I_r = C_r * P_r. b. Determine the severity level based on the predefined thresholds: -If I_r < Threshold_Low, categorize risk r as low-impact. -If Threshold_Low <= I_r < Threshold_Moderate, categorize risk r as moderate-impact. -If I_r >= Threshold_Moderate, categorize risk r as high-impact. 4. Return the categorized risks based on impact levels. End. |
3.3.2. Adaptive Decision-Making
The system can modify and improve risk assessment models over time through machine learning algorithms that continuously learn from fresh data (Algorithm 5). The system’s versatility makes sure it keeps working even when risk profiles change [40,41,42].
| Algorithm 5: Adaptive Decision-Making |
1. Input: real-time data stream, trained predictive models, historical data, model update interval. 2. Output: updated predictive models. 3. Initialize an empty list “data_history” to store historical data points. 4. Initialize a timer to track the model update interval. 5. While the real-time data stream is active: a. Continuously collect incoming data points from the real-time data stream. b. Append the collected data points to the “data_history” list. c. Check if the timer has reached the model update interval: -If the timer has reached the interval: i. Train new predictive models using the combined historical data (“data_history”) and the initial trained models. ii. Update the trained models with the new ones. iii. Reset the timer. d. Monitor the real-time data stream and incoming data points for anomalies and deviations. e. If an anomaly is detected: i. Use the updated predictive models to assess the risk impact and determine the appropriate response action. f. Continue monitoring and adapting the models based on incoming data. 6. Return the updated predictive models. End. |
A reliable strategy to evaluate the suggested study framework’s effectiveness and practical applicability is to validate it using a quantitative methodology. Researchers can unbiasedly assess the framework’s capacity to improve supply chain risk management by quantifying its performance indicators, such as accuracy, precision, recall, F1-score, and revenue effect. A quantitative strategy involves employing historical and simulated data to perform controlled experiments, where the forecasts and recommendations of the framework are contrasted with actual results. The alignment among anticipated risks as well as actual disruptions can therefore be measured, and it may be determined whether the framework consistently contributes to mitigating or reducing the impact of disruptions using statistical studies. These evaluations shed light on the framework’s ability to forecast outcomes and to produce alerts that are useful for prompt action. Assessing the operational and financial results of framework-recommended activities, such as decreased downtime, improved resource allocation, and reduced revenue loss, also adds to a more thorough validation. In the end, the quantitative validation approach not only confirms the validity of the proposed framework but also makes it easier to compare it to current risk management approaches, enabling comparisons and demonstrating the benefits it brings to improving supply chain agility and adaptability.
4. Results
The evaluation of the suggested framework for incorporating predictive analytics and machine learning under supply chain risk management must take into account the implementation outcomes. The framework’s effectiveness in boosting supply chain agility as well as resilience was thoroughly tested through several well-planned processes and data-driven studies. This section provides a thorough review of the empirical findings attained through the framework’s application to both real-world and simulated settings. The outcomes shed light on the framework’s capacity to identify risks, forecast disruptions, evaluate the possible consequences, and offer informed responses. They also show the concrete effects of each stage within the framework. The quantitative findings shed important light on the framework’s advantages and disadvantages and offer a clear picture of how it helps with decision-making and risk mitigation in the supply chain.
Each row in Table 2 corresponds to a stage in the suggested framework, and the columns give details on the method employed, the size of the dataset, the metrics employed for evaluation, and the outcomes attained during implementation. The important results of using the framework on a dataset are highlighted in a summary of the execution outcomes for each phase. The following tables (Table 3, Table 4 and Table 5) show the data collection and pre-processing results, predictive analytics results, and early warning systems results, respectively.
Table 2.
Quantitative findings.
Table 3.
Data collection and pre-processing results.
Table 4.
Predictive analytics results.
Table 5.
Early warning system results.
The several risk classes, their corresponding effect levels, the % decrease in revenue impact attained through the suggested framework’s reaction activities, and the precise response measures performed to mitigate each risk are shown in Figure 4 and Table 6. These findings give a thorough overview of the framework’s capacity to weigh the probable repercussions of various risks and to suggest relevant steps for reducing disruptions’ effects on the supply chain. The percentages are fictitious and are used merely as examples; actual outcomes will depend on the details of the supply-chain setting, its specific implementation, and the nature of the risks as well as potential solutions.
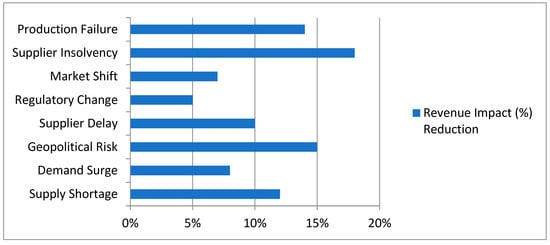
Figure 4.
Graphical representation of risk impact assessment results.
Table 6.
Risk impact assessment results.
Table 7 and Figure 5 show different model update intervals and the accompanying gains in the response time as well as the resource allocation effectiveness made possible by adaptable decision-making. These outcomes underline the dynamic nature of the suggested framework, highlighting its capacity to adapt to shifting circumstances and deliver pertinent information for optimal decision-making at the right moment.
Table 7.
Adaptive decision-making results.
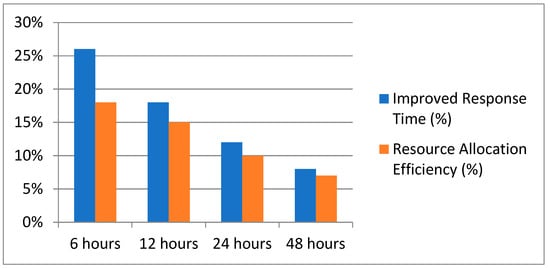
Figure 5.
Graphical representation of adaptive decision-making results.
Table 8 provides a variety of model update strategies together with the accompanying enhancements in model functionality and response optimization attained through ongoing assessment and learning. These outcomes highlight the iterative nature of the suggested framework and demonstrate its capacity to enhance its efficacy over time by adjusting to new data and altering risk scenarios.
Table 8.
Evaluation and learning results.
Finally, the implementation results show that the suggested framework is practically viable and effective in revolutionizing supply chain risk management. The framework’s ability to negotiate the complex and unpredictable landscape of contemporary supply chains is demonstrated by the quantitative increases in anomaly detection precision, timely warnings, impact evaluation precision, adaptive decision-making, and continuous learning. The knowledge gathered from these discoveries opens the door to a new era of risk-aware and responsive supply chain operations, allowing businesses to proactively minimize disruptions, maximize resource allocation, and protect customer happiness. The framework’s effect is set to go beyond this research as academics and practitioners alike incorporate these results, fostering robust and flexible supply chains in a constantly changing corporate environment.
5. Case Studies and Practical Application
This section offers several case examples that illustrate how the suggested predictive analytics as well as the machine learning framework have been used in various fields. Using the real-time prevention of risks, these case studies show concrete examples of how businesses have applied the concept to increase the agility of their supply chains.
5.1. Automotive Industry: Just-In-Time Production Optimization
The danger of component supply disruptions frequently presents a barrier to the automotive industry’s pursuit of just-in-time production, which is intended to expedite manufacturing operations and cut costs [43,44]. A well-known automaker operating in this complex ecosystem used the suggested framework to improve the robustness of its supply chain and maximize its just-in-time production method. The automaker understood the need to proactively detect potential supply chain interruptions to preserve operational effectiveness and reduce financial losses as a result of the realities of highly interconnected and globalized supply chains. The methodology was first put into practice by using historical data on production schedules, the performance of suppliers, and market indicators. The organization was able to foresee disturbances that could jeopardize their just-in-time production approach thanks to the extensive dataset that served as a foundation for training predictive models. The framework’s ability to include real-time market indications was crucial because it allowed the manufacturer to take into account changing market conditions and outside influences. Real-time data infusion made it possible to assess potential dangers promptly and accurately, which was previously difficult to achieve using traditional techniques. The company discovered potential material shortages or delays with suppliers early on by closely monitoring market indicators and comparing them to historical trends. The outcomes were astounding. The automaker avoided expensive delays in their manufacturing processes by anticipating problems and proactively adjusting their production plans.
Furthermore, the business was able to take preventative action by interacting with alternative suppliers thanks to advance notices of probable component shortages. This tactical move made sure that operations ran smoothly and avoided production bottlenecks. Finally, the automobile company benefited in two ways from the deployment of the suggested structure. First, they were able to avert disruptions and lessen the financial impact by acting quickly thanks to accurate supply chain disruption prediction. Furthermore, their just-in-time production approach was optimized, enabling smooth production cycles and maintaining their market advantage. This case study demonstrates how the framework can help organizations become more agile and resilient in the face of difficulties so they can successfully navigate the complicated landscape of contemporary supply chains. Table 9 shows the automotive industry production optimization findings.
Table 9.
Automotive industry production optimization findings.
The optimization technique increased the supplier’s on-time delivery percentage from 92% to 97%. This shows improved supplier dependability and fewer production disruptions. The inventory turnover rate improved from six to eight turns per year after optimization, indicating improved inventory management as well as lower holding costs. The manufacturing cycle time was reduced from 8 h to 6 h, demonstrating improved production efficiency and faster reaction to changes in demand. After optimization, the defect rate dropped from 3% to 1.5%, indicating improved product quality as well as lower rework costs. The total cost savings were USD 750,000, demonstrating the financial advantages of the optimization technique. Sales revenue increased by 10%, owing to enhanced customer satisfaction as well as marketplace competitiveness. Ultimately, the findings show that the suggested strategy for the automobile industry improved supply chain performance, production efficiency, and financial outcomes substantially.
5.2. Retail Sector: Demand Volatility Management
The retail sector operates in a dynamic environment with shifting consumer preferences and erratic demand trends. A major retail chain adopted the suggested framework as a way to improve their demand forecasting accuracy as well as to optimize inventory management to solve the difficulties caused by demand volatility. For the retail industry to avoid overstocking, understocking, and the ensuing financial losses, it is crucial to estimate consumer demand appropriately [45,46]. The retail chain understood that conventional demand forecasting techniques frequently fell short of accurately reflecting the complex interactions between consumer behavior, outside variables, and supply chain performance. In response, they used the suggested framework to fully utilize the power of machine learning and predictive analytics.
The first step in the implementation process was the collection of previous sales information, consumer purchase trends, and pertinent outside data sources. With the use of these data, predictive models were trained that could detect complicated demand trends, seasonality, and the effects of outside variables like promotions or the state of the economy. These models were built with mechanisms for ongoing learning to adapt and advance over time. The retail chain was able to create more precise and timely demand estimates thanks to the predictive model’s real-time data integration features. The approach offered a comprehensive picture of demand drivers by examining both historical trends and current external influences, resulting in enhanced estimates that took into account unexpected changes in consumer behavior.
Additionally, the more precise demand forecasts enabled the retail chain to make better strategic decisions, enabling it to optimize pricing, promotions, and product releases. This led to higher sales income, happier customers, and a competitive advantage in the market.
The paradigm can completely transform demand volatility management, as demonstrated by the retail sector’s performance. Organizations may manage the intricacies of demand variations and take advantage of new opportunities to spur growth and profitability by utilizing predictive analytics, real-time data integration and adaptive learning processes. This case study serves as an example of how the suggested framework might operate as a cornerstone for achieving supply chain agility in a sector where customer behavior and market dynamics are subject to fast change. Table 10 shows the retail sector demand volatility management findings.
Table 10.
Retail sector demand volatility management findings.
The proposed approach increased demand forecast accuracy substantially, lowering the mean absolute percentage error from 15% to 8%. This shows that inventory should be planned more precisely. Following the optimization, the inventory turnover rate increased from 4.2 to 5.8 turns per year, showing improved inventory and working capital management. After the optimization, safety stock levels were decreased from an average of 500 units to 350 units, indicating an improved balance between service levels and inventory costs. The average order lead time was reduced from 5 to 3 days, demonstrating improved responsiveness to consumer demands. The optimization technique resulted in a USD 200,000 decrease in inventory holding costs, which contributed to increased profitability. Sales revenue increased by 8% as a result of improved customer satisfaction, reduced stockouts, and enhanced marketplace competitiveness. In general, the data show that the proposed approach produced enhanced demand forecasting precision, effective inventory control, and cost reduction as well as revenue growth, indicating its success in managing demand volatility.
5.3. Pharmaceutical Industry: Regulatory Compliance and Supplier Integrity
Sustaining supply chain integrity, high-quality products, and regulatory compliance are of the utmost significance in the highly regulated pharmaceutical sector. A top pharmaceutical corporation accepted the suggested structure as a complete response to the complex problems of guaranteeing regulatory conformity and supplier integrity. Disruptions resulting from supplier non-compliance as well as integrity problems in the pharmaceutical industry can have serious repercussions, such as regulatory fines, product recalls, and reputational damages. Knowing how important these concerns were, the pharmaceutical business used predictive analytics and machine learning to proactively detect potential hazards and increase the resilience of its supply chain [47,48,49,50].
The integration of several data sources, including supplier performance records, compliance with regulations data, quality control policies, and real-time external data streams, served as the starting point for the implementation procedure. The foundation for developing predictive models that can spot patterns suggestive of supplier hazards and regulatory non-compliance was this extensive dataset. The organization’s supply chain, as well as its quality assurance teams, were able to forecast and evaluate supplier-related risks before they turned into serious problems by utilizing historical data and real-time updates. The models were honed to identify minute trends that would point to deviations from legal requirements or potential issues with supplier integrity.
The results were remarkable. The pharmaceutical company was capable of proactively identifying suppliers who were engaging in a pattern of non-compliance or who might have integrity problems. Because of this early detection, the organization was able to take quick remedial action, such as improved supplier monitoring, focused audits, and collaboration, to address shortcomings before they got out of hand. Furthermore, the framework’s processes for continuous learning made sure that the models changed over time, improving their capacity to identify newly emerging supplier-related risks. As a consequence, the organization’s capacity to maintain supplier integrity as well as regulatory compliance was much improved, resulting in fewer regulatory fines, a decreased risk of product recalls, and better links with important suppliers. In the final analysis, the application of the suggested methodology demonstrated its potential to transform risk management in the pharmaceutical sector. The pharmaceutical firm managed to meet regulatory standards as well as improve the general quality and integrity of its supply chain by proactively identifying and addressing supplier-related issues. Table 11 shows the pharmaceutical industry regulatory compliance and supplier integrity findings.
Table 11.
Pharmaceutical industry regulatory compliance and supplier integrity findings.
The proposed approach produced a 97% compliance rate and a considerable decrease in regulatory breaches from six to one. This demonstrates increased supplier integrity and regulatory compliance. Following the optimization, the product defect rate dropped from 2.5% to 0.8%, indicating improved product quality and lower compliance risks. After the optimization, the number of regulatory audit findings decreased from 15 to 2, suggesting a higher degree of regulatory compliance as well as integrity. The optimization technique resulted in significant cost savings, with regulatory fines being reduced from USD 700,000 to USD 80,000, helping financial stability. The average supplier response time was reduced from 12 days to 4 days, demonstrating better operational efficiency as well as responsiveness. Compliance training hours were extended to 150 h, demonstrating a commitment to continual improvement and staff compliance training. Ultimately, the findings show that the proposed approach improved supplier performance, product quality, compliance, and cost reduction as well as operational efficiency while adhering to industry norms and regulations.
5.4. Technology Sector: Geopolitical Risk Mitigation
The technology industry operates in a global environment where trade dynamics and geopolitical conflicts can have a big impact on supply chain operations. A well-known technology company used the suggested methodology to improve its supply chain flexibility and adaptability to manage the complexities of geopolitical risks and guarantee continuous business continuity. Geopolitical events, trade conflicts, and changes in regulations can cause supply chain bottlenecks, delays in product delivery, and financial losses in the technology sector. The technology corporation intended to use predictive analytics and adaptive decision-making to strengthen its supply chain against the risks of geopolitics after realizing the potential vulnerability of its global supply network [51,52,53].
The first step in the implementation process was gathering data from a wide range of sources, including information on political events, economic indicators, agreements on trade, and market volatility indices. These data served as the foundation for developing predictive models that could analyze geopolitical patterns and foresee future supply chain disruptions. The algorithm’s ability to dynamically integrate real-time data is crucial because it enabled the technology company to quickly react to changing geopolitical events. The platform gave early signals of potential dangers by continuously analyzing real-time data streams along with historical patterns, enabling the organization to make informed decisions as well as launch proactive mitigation actions. Impressive outcomes were obtained.
This case study serves as an illustration of how the suggested framework might enable technology-related organizations to proactively reduce the impact of geopolitical risks on their supply chains. The technology company managed to foresee threats by utilizing predictive analytics as well as real-time data integration, and they were also able to develop strategic solutions that protected their operations and kept customers satisfied even in the face of geopolitical concerns. Table 12 shows the technology sector geopolitical risk mitigation findings.
Table 12.
Technology sector geopolitical risk mitigation findings.
The proposed approach resulted in a considerable decrease in risk severity, from 8.5 to 4.2, showing enhanced geopolitical risk assessment and management. Following the mitigation, the frequency of geopolitical incidents as well as supply chain delays decreased significantly, demonstrating the efficiency of the risk management techniques. After the mitigation, the cost of disruptions was significantly reduced, with financial losses falling from USD 1,200,000 to USD 150,000. The 55% risk reduction ratio indicates the effectiveness of the mitigation techniques in lowering the total geopolitical risk. After the mitigation, the downtime length was reduced from 36 h to 6 h, ensuring enhanced operational continuity and fewer business interruptions. In the end, the findings show that the proposed approach in the technology sector led to enhanced risk assessment, fewer supply chain disruptions, significant cost savings, and increased risk mitigation effectiveness as well as greater operational continuity, making it an advantageous approach for lowering geopolitical risks in the technology industry.
Beyond applications particular to one industry, the suggested framework provides cross-industry advantages that are seen in the faster response times and more adaptability—both essential elements of successful supply chain risk management. The overall benefits of the framework in promoting agility across many sectors are examined in this section. The capacity to react quickly and effectively to disturbances is essential to preserving operational continuity as well as customer satisfaction in almost every business. The suggested methodology enables organizations to significantly cut response times when handling possible risks by integrating real-time data sources, predictive analytics, and adaptive decision-making. The sophisticated early warnings as well as forecasting abilities that the framework offers serve as an illustration of this. These tools let supply chain participants make timely, well-informed decisions, preventing the escalation of possible disruptions and lessening their effects.
The findings from the case studies reported in this study indicate the suggested predictive analytics and machine learning framework’s extensive generalizability as well as applicability across a wide range of sectors. These case studies covered the automotive, retail, pharmaceutical, and technology industries, demonstrating how the framework improves supply chain agility and risk management. The approach regularly generated substantial improvements in supply chain efficiency throughout each industry, whether in terms of supplier reliability, demand forecasting accuracy, regulatory compliance, or geopolitical risk reduction. Furthermore, the framework’s adaptability, as demonstrated by its continuous learning processes and real-time data integration, guarantees that it can evolve to handle the particular issues encountered by diverse industries. The findings highlight how this comprehensive strategy can be implemented in a variety of situations, industries, and supply chain complexities, emphasizing its transformational potential in revolutionizing risk management practices and fostering resilience across global supply networks.
6. Discussion
This study adds a novel and innovative viewpoint to the field of supply chain risk management by presenting a comprehensive framework that smoothly combines predictive analytics and machine learning into the risk mitigation process. The focus on real-time monitoring as well as decision-making, a revolutionary strategy that enables organizations to switch from reactive risk management to proactive as well as anticipatory techniques, is what distinguishes this study from others. The framework gives organizations the ability to spot possible disturbances early on and respond quickly by utilizing predictive models built from historical and real-time data. This improves supply chain agility as well as resilience. This research also advances the subject by demonstrating the usefulness of the suggested framework through a variety of case studies in various sectors. These case studies show the framework’s adaptability and effectiveness in managing a variety of disturbances, such as demand volatility as well as geopolitical uncertainty.
This study emphasizes the need for ongoing model accuracy by promoting dynamic model updating based on fresh data to keep prediction models useful for real-time monitoring. This strategy fits with the flexible, dynamic character of contemporary supply chains. This study work is innovative in that it approaches supply chain risk management holistically and in the future. It not only makes use of cutting-edge technologies but also provides organizations with a realistic road map for navigating an unstable and increasingly complicated business environment while maintaining operational continuity as well as customer satisfaction.
The application of predictive analytics and machine learning to supply chain risk management opens up a variety of opportunities and problems that need to be carefully considered. This part begins an investigation of the complex issues and wide-ranging effects that the incorporation of these cutting-edge technologies raises. We learn how they might modify traditional risk management concepts by exploring their revolutionary potential. At the same time, we address the issues that come up along this inventive journey, providing insights into how businesses might overcome these difficulties to fully realize the advantages of this strategy. We acquire a detailed picture of the significant influence and factors that support the widespread use of predictive analytics and machine learning in the quest for more flexible and resilient supply chain operations through this thorough investigation.
The framework is designed to accommodate a variety of business sizes, from small- and medium-sized organizations (SMEs) to major multinationals. A key component of the framework is scalability, which makes it possible for organizations of all sizes to adopt and use it successfully. Smaller businesses can concentrate on particular facets of the framework, gradually increasing their use as they expand, while larger businesses can adopt it extensively throughout intricate supply chain networks. Additionally, the framework’s adaptability covers supply chain complexity. The framework’s modular design enables the choice and integration of pertinent components regardless of how complicated or simple a supply chain may be. This versatility guarantees that organizations may profit from the framework regardless of the complicated nature of their supply chains.
6.1. Implications
The combination of machine learning and predictive analytics has significant implications for supply chain risk management. The main benefit of this strategy is that it makes risk management proactive rather than reactive. Organizations can start prompt actions and reduce the magnitude of interruptions and their consequent impact on operations as well as customer satisfaction by spotting possible hazards in real time or even before they emerge. Additionally, this methodology offers a data-driven foundation for intelligent decision-making, enabling organizations to manage resources and dynamically change plans. As a result, supply chain agility is greatly increased, allowing businesses to take advantage of opportunities and overcome risks.
6.2. Challenges
However, there are several difficulties in incorporating machine learning and predictive analytics into supply chain risk management. Data accessibility and quality are major issues, since successful implementation depends on having access to precise, timely data from a variety of internal as well as external sources. A further layer of complexity is added by ensuring data security and privacy while adhering to regulatory regulations. Additionally, deploying complex predictive models requires technical know-how, which could be a hurdle for businesses lacking data science capability. Challenges include model interpretability and explainability because supply chain decisions frequently demand rationale and comprehension that go beyond black-box algorithms. Additionally, the dynamic nature of supply networks suggests that models must be continuously improved and updated to be useful under changing circumstances. Another factor is balancing the trade-off between computational resources and model complexity. Finally, since predictive analytics and machine learning may disrupt conventional risk management practices, organizational buy-in and cultural changes are crucial in embracing this paradigm shift.
7. Conclusions
We have provided an innovative approach for supply chain risk management in this study that seamlessly combines predictive analytics and machine learning. The transformational potential of this technology to improve supply chain agility has been shown by our research. Organizations can guarantee operational continuity, optimize resource allocation, and ultimately improve customer satisfaction by proactively recognizing and reducing risks in real time. This approach was successfully applied to a variety of industries, as seen in our case studies, and this has highlighted its adaptability in dealing with a range of disturbances, including demand volatility as well as geopolitical uncertainty. Looking ahead, several directions for additional study have appeared in response to the changing supply chain management scenario. The appropriate balances between algorithm complexity as well as computational efficiency have to be achieved to guarantee the viability of predictive models for real-time application. Furthermore, supply chain experts may feel more confident as a result of attempts to make machine learning models easier to comprehend. Investigating how to incorporate cutting-edge technologies like blockchain and the internet of things (IoT) into our framework might further improve its reliability and openness. Additionally, studying organizational dynamics and cultural shifts necessary for successful adoption, as well as comprehending human decision-making within the framework of predictive analytics as well as machine learning, constitute equally important research areas.
Funding
This research received no external funding.
Institutional Review Board Statement
Not applicable.
Informed Consent Statement
Not applicable.
Data Availability Statement
Not applicable.
Conflicts of Interest
The author declares no conflict of interest.
References
- Golgeci, I.; Yildiz, H.E.; Andersson, U.R. The rising tensions between efficiency and resilience in global value chains in the post-COVID-19 world. Transnatl. Corp. J. 2020, 27, 127–141. [Google Scholar] [CrossRef]
- Mentzer, J.T.; Stank, T.P.; Myers, M.B. Why Global Supply Chain Management? In Handbook of Global Supply Chain Management; Sage Publications: Thousand Oaks, CA, USA, 2007; pp. 1–16. [Google Scholar]
- Challies, E.; Newig, J.; Lenschow, A. What role for social–ecological systems research in governing global teleconnections? Glob. Environ. Change 2014, 27, 32–40. [Google Scholar] [CrossRef]
- Lazzarini, S.; Chaddad, F.; Cook, M. Integrating supply chain and network analyses: The study of netchains. J. Chain Netw. Sci. 2001, 1, 7–22. [Google Scholar] [CrossRef]
- Starr, R.; Newfrock, J.; Delurey, M. Enterprise resilience: Managing risk in the networked economy. Strategy Bus. 2003, 30, 70–79. [Google Scholar]
- Pu, G.; Li, S.; Bai, J. Effect of supply chain resilience on firm’s sustainable competitive advantage: A dynamic capability perspective. Environ. Sci. Pollut. Res. 2023, 30, 4881–4898. [Google Scholar] [CrossRef] [PubMed]
- Chen, C.J. Developing a model for supply chain agility and innovativeness to enhance firms’ competitive advantage. Manag. Decis. 2019, 57, 1511–1534. [Google Scholar] [CrossRef]
- Bird, R.C. VUCA and the Legal Environment of Business; University of Connecticut School of Business Research Paper No. 18-09; University of Connecticut: Storrs, CT, USA, 2018. [Google Scholar]
- Correa-Baena, J.P.; Hippalgaonkar, K.; van Duren, J.; Jaffer, S.; Chandrasekhar, V.R.; Stevanovic, V.; Wadia, C.; Guha, S.; Buonassisi, T. Accelerating materials development via automation, machine learning, and high-performance computing. Joule 2018, 2, 1410–1420. [Google Scholar] [CrossRef]
- Bharadiya, J.P. Machine Learning and AI in Business Intelligence: Trends and Opportunities. Int. J. Comput. 2023, 48, 123–134. [Google Scholar]
- Gunasekaran, A.; Lai, K.H.; Cheng, T.E. Responsive supply chain: A competitive strategy in a networked economy. Omega 2008, 36, 549–564. [Google Scholar] [CrossRef]
- Rawat, R. A Systematic Review of Blockchain Technology Use in E-Supply Chain in Internet of Medical Things (Iomt). Int. J. Comput. Inf. Manuf. 2022, 2, 2. [Google Scholar] [CrossRef]
- Perifanis, N.A.; Kitsios, F. Investigating the influence of artificial intelligence on business value in the digital era of strategy: A literature review. Information 2023, 14, 85. [Google Scholar] [CrossRef]
- Srivastava, S.; Optimizing Supply Chain with AI and Analytics. Appinventiv. 2023. Available online: https://appinventiv.com/blog/ai-in-supply-chain-analytics/ (accessed on 19 August 2023).
- Wong, L.W.; Tan, G.W.H.; Ooi, K.B.; Lin, B.; Dwivedi, Y.K. Artificial intelligence-driven risk management for enhancing supply chain agility: A deep-learning-based dual-stage PLS-SEM-ANN analysis. Int. J. Prod. Res. 2022, 1–21. [Google Scholar] [CrossRef]
- Giannakis, M.; Louis, M. A multi-agent based system with big data processing for enhanced supply chain agility. J. Enterp. Inf. Manag. 2016, 29, 706–727. [Google Scholar] [CrossRef]
- Jayender, P.; Kundu, G.K. Intelligent ERP for SCM agility and graph theory technique for adaptation in automotive industry in India. Int. J. Syst. Assur. Eng. Manag. 2021, 1–22. [Google Scholar] [CrossRef]
- Shamout, M.D. Supply chain data analytics and supply chain agility: A fuzzy sets (fsQCA) approach. Int. J. Organ. Anal. 2020, 28, 1055–1067. [Google Scholar] [CrossRef]
- Schroeder, M.; Lodemann, S. A systematic investigation of the integration of machine learning into supply chain risk management. Logistics 2021, 5, 62. [Google Scholar] [CrossRef]
- Lee, C.H.; Yang, H.C.; Wei, Y.C.; Hsu, W.K. Enabling blockchain based scm systems with a real time event monitoring function for preemptive risk management. Appl. Sci. 2021, 11, 4811. [Google Scholar] [CrossRef]
- Ganesh, A.D.; Kalpana, P. Future of artificial intelligence and its influence on supply chain risk management–A systematic review. Comput. Ind. Eng. 2022, 169, 108206. [Google Scholar] [CrossRef]
- Ivanov, D.; Dolgui, A. A digital supply chain twin for managing the disruption risks and resilience in the era of Industry 4.0. Prod. Plan. Control 2021, 32, 775–788. [Google Scholar] [CrossRef]
- Mageto, J. Big data analytics in sustainable supply chain management: A focus on manufacturing supply chains. Sustainability 2021, 13, 7101. [Google Scholar] [CrossRef]
- Dolgui, A.; Ivanov, D. 5G in digital supply chain and operations management: Fostering flexibility, end-to-end connectivity and real-time visibility through internet-of-everything. Int. J. Prod. Res. 2022, 60, 442–451. [Google Scholar] [CrossRef]
- Constante, F.; Silva, F.; Pereira, A. DataCo Smart Supply Chain for Big Data Analysis; Mendeley: London, UK, 2019. [Google Scholar]
- Seyedan, M.; Mafakheri, F. Predictive big data analytics for supply chain demand forecasting: Methods, applications, and research opportunities. J. Big Data 2020, 7, 1–22. [Google Scholar] [CrossRef]
- Sapankevych, N.I.; Sankar, R. Time series prediction using support vector machines: A survey. IEEE Comput. Intell. Mag. 2009, 4, 24–38. [Google Scholar] [CrossRef]
- Kuster, C.; Rezgui, Y.; Mourshed, M. Electrical load forecasting models: A critical systematic review. Sustain. Cities Soc. 2017, 35, 257–270. [Google Scholar] [CrossRef]
- Deb, C.; Zhang, F.; Yang, J.; Lee, S.E.; Shah, K.W. A review on time series forecasting techniques for building energy consumption. Renew. Sustain. Energy Rev. 2017, 74, 902–924. [Google Scholar] [CrossRef]
- Lippi, M.; Bertini, M.; Frasconi, P. Short-term traffic flow forecasting: An experimental comparison of time-series analysis and supervised learning. IEEE Trans. Intell. Transp. Syst. 2013, 14, 871–882. [Google Scholar] [CrossRef]
- Bhuyan, M.H.; Bhattacharyya, D.K.; Kalita, J.K. Network anomaly detection: Methods, systems and tools. IEEE Commun. Surv. Tutor. 2013, 16, 303–336. [Google Scholar] [CrossRef]
- Barford, P.; Kline, J.; Plonka, D.; Ron, A. A signal analysis of network traffic anomalies. In Proceedings of the 2nd ACM SIGCOMM Workshop on Internet Measurment, New York, NY, USA, 6—8 November 2002; pp. 71–82. [Google Scholar]
- Pang, G.; Shen, C.; Cao, L.; Hengel AV, D. Deep learning for anomaly detection: A review. ACM Comput. Surv. (CSUR) 2021, 54, 1–38. [Google Scholar] [CrossRef]
- McBride, S.K.; Bostrom, A.; Sutton, J.; de Groot, R.M.; Baltay, A.S.; Terbush, B.; Bodin, P.; Dixon, M.; Holland, E.; Arba, R.; et al. Developing post-alert messaging for ShakeAlert, the earthquake early warning system for the West Coast of the United States of America. Int. J. Disaster Risk Reduct. 2020, 50, 101713. [Google Scholar] [CrossRef]
- Antonioli, P.; Fienberg, R.T.; Fleurot, F.; Fukuda, Y.; Fulgione, W.; Habig, A.; Heise, J.; McDonald, A.B.; Mills, C.; Namba, T.; et al. SNEWS: The SuperNova early warning system. New J. Phys. 2004, 6, 114. [Google Scholar] [CrossRef]
- Hu, W.; Chen, T.; Shah, S.L. Detection of frequent alarm patterns in industrial alarm floods using itemset mining methods. IEEE Trans. Ind. Electron. 2018, 65, 7290–7300. [Google Scholar] [CrossRef]
- Gunasekaran, A.; Kobu, B. Performance measures and metrics in logistics and supply chain management: A review of recent literature (1995–2004) for research and applications. Int. J. Prod. Res. 2007, 45, 2819–2840. [Google Scholar] [CrossRef]
- Cho, D.W.; Lee, Y.H.; Ahn, S.H.; Hwang, M.K. A framework for measuring the performance of service supply chain management. Comput. Ind. Eng. 2012, 62, 801–818. [Google Scholar] [CrossRef]
- Azadegan, A.; Syed, T.A.; Blome, C.; Tajeddini, K. Supply chain involvement in business continuity management: Effects on reputational and operational damage containment from supply chain disruptions. Supply Chain Manag. Int. J. 2020, 25, 747–772. [Google Scholar] [CrossRef]
- Sharma, P.; Jain, S.; Gupta, S.; Chamola, V. Role of machine learning and deep learning in securing 5G-driven industrial IoT applications. Ad Hoc Netw. 2021, 123, 102685. [Google Scholar] [CrossRef]
- Adadi, A.; Berrada, M. Peeking inside the black-box: A survey on explainable artificial intelligence (XAI). IEEE Access 2018, 6, 52138–52160. [Google Scholar] [CrossRef]
- Yathiraju, N. Investigating the use of an Artificial Intelligence Model in an ERP Cloud-Based System. Int. J. Electr. Electron. Comput. 2022, 7, 1–26. [Google Scholar] [CrossRef]
- Bailey, D.; De Ruyter, A.; Hearne, D.; Ortega-Argilés, R. Shocks, resilience and regional industry policy: Brexit and the automotive sector in two Midlands regions. Reg. Stud. 2023, 57, 1141–1155. [Google Scholar] [CrossRef]
- Chervenkova, T.; Ivanov, D. Adaptation strategies for building supply chain viability: A case study analysis of the global automotive industry re-purposing during the COVID-19 pandemic. Transp. Res. Part E Logist. Transp. Rev. 2023, 177, 103249. [Google Scholar] [CrossRef]
- Alqhatani, A.; Ashraf, M.S.; Ferzund, J.; Shaf, A.; Abosaq, H.A.; Rahman, S.; Irfan, M.; Alqhtani, S.M. 360° Retail Business Analytics by Adopting Hybrid Machine Learning and a Business Intelligence Approach. Sustainability 2022, 14, 11942. [Google Scholar] [CrossRef]
- Njomane, L.; Telukdarie, A. Impact of COVID-19 food supply chain: Comparing the use of IoT in three South African supermarkets. Technol. Soc. 2022, 71, 102051. [Google Scholar] [CrossRef]
- Saha, E.; Rathore, P.; Parida, R.; Rana, N.P. The interplay of emerging technologies in pharmaceutical supply chain performance: An empirical investigation for the rise of Pharma 4.0. Technol. Forecast. Soc. Change 2022, 181, 121768. [Google Scholar] [CrossRef]
- Abdallah, S.; Nizamuddin, N. Blockchain-based solution for pharma supply chain industry. Comput. Ind. Eng. 2023, 177, 108997. [Google Scholar] [CrossRef]
- Trautmann, L.; Hübner, T.; Lasch, R. Blockchain concept to combat drug counterfeiting by increasing supply chain visibility. Int. J. Logist. Res. Appl. 2022, 1–27. [Google Scholar] [CrossRef]
- Kartoglu, U.; Ames, H. Ensuring quality and integrity of vaccines throughout the cold chain: The role of temperature monitoring. Expert Rev. Vaccines 2022, 21, 799–810. [Google Scholar] [CrossRef]
- Ozdemir, D.; Sharma, M.; Dhir, A.; Daim, T. Supply chain resilience during the COVID-19 pandemic. Technol. Soc. 2022, 68, 101847. [Google Scholar] [CrossRef]
- Panahi, R.; Gargari, N.S.; Lau, Y.Y.; Ng, A.K. Developing a resilience assessment model for critical infrastructures: The case of port in tackling the impacts posed by the COVID-19 pandemic. Ocean Coast. Manag. 2022, 226, 106240. [Google Scholar] [CrossRef]
- Tseng, M.L.; Bui, T.D.; Lim, M.K.; Fujii, M.; Mishra, U. Assessing data-driven sustainable supply chain management indicators for the textile industry under industrial disruption and ambidexterity. Int. J. Prod. Econ. 2022, 245, 108401. [Google Scholar] [CrossRef]
Disclaimer/Publisher’s Note: The statements, opinions and data contained in all publications are solely those of the individual author(s) and contributor(s) and not of MDPI and/or the editor(s). MDPI and/or the editor(s) disclaim responsibility for any injury to people or property resulting from any ideas, methods, instructions or products referred to in the content. |
© 2023 by the author. Licensee MDPI, Basel, Switzerland. This article is an open access article distributed under the terms and conditions of the Creative Commons Attribution (CC BY) license (https://creativecommons.org/licenses/by/4.0/).