Abstract
The objective of this study was to discern the spatial and temporal patterns of areas in Nanning that are susceptible to waterlogging, particularly during various phases of urban expansion. Furthermore, this study presents a proposal outlining strategies aimed at preventing and controlling waterlogging. These strategies are based on the integration of the concepts of sponge city and resilient city construction. This study employed remote sensing (RS) and geographic information system (GIS) techniques to provide technical support. The supervised classification method and normalized difference index method were utilized to compare and extract impervious surfaces in Nanning from 2013 to 2020. The present investigation utilized the acquired impervious surfaces to compute the fractal dimension as a weighting factor, incorporating a digital elevation model (DEM) for the purpose of conducting a hydrological analysis in ArcGIS. Based on the findings of the study, several conclusions can be derived. The following conclusions can be drawn from the study: (1) The fractal dimension of Nanning varied over the study period, with values of 1.32, 1.41, and 1.58 in 2013, 2017, and 2020, respectively. The distribution of impervious surfaces showed a decreasing trend from the city center to the periphery. Urban planning and construction activities have significantly influenced the distribution of impervious surfaces, resulting in a progressively more complex and unstable structure. (2) From 2013 to 2020, the urban expansion fractal dimension increased from 1.32 to 1.58, indicating a decrease in the stability of impervious surfaces. The areas with higher concentrations of impervious surfaces coincided with frequent waterlogging-prone areas. Furthermore, the distribution of waterlogging-prone points transformed from a concentrated pattern to a scattered one. (3) In terms of waterlogging prevention and control strategies, the old urban areas are recommended to be transformed into sponge city projects, and the new development areas are planned, designed and implemented with the concept of “resilience”.
1. Introduction
The Fifth United Nations (UN) Special Thematic Session on Water and Disasters highlighted the global effects of natural disasters, including floods, storms, droughts and tsunamis. These extreme weather events have lasting and irreversible impacts on both nations and individuals. The World Meteorological Organization (WMO) has documented 11,000 global natural disasters over the last 50 years, with floods being particularly widespread. The 2020 Global Natural Disaster Assessment Report states that floods in China affected 56.8% of the population affect by natural disasters and were responsible for 72.1% of the total economic loss [1].
China’s urbanization has contributed to an increase in urban storms and floods, evidenced by notable incidents like Guangzhou’s “5∙22”, Beijing’s “8∙12”, and Zhengzhou’s “7∙20”. According to the UN’s 2018 Revision of World Urbanization Prospects, China’s urban construction land area has increased from 6.72 × 10³ km2 to 5.61 × 10⁴ km2 between 1981 and 2018, with an average annual growth rate of 5.90% [2]. Moreover, the urbanization rate has increased from 13.26% in 1953 to 63.89% in 2020, exceeding the global average rate of 55.3%. China also faces the challenge of accommodating the future inflow of 200 million people into cities. Consequently, cities are inevitably being constructed with impact-resistant, recoverable, and sustainable features, coupled with scientific control and governance systems.
Nanning, located in the intersection of China’s southeast coast and southwest hinterland, had an urbanization rate of 68.91% in 2020. The city’s urban population was 6.02 million, and the floating population stood at 2.44 million. The city’s population concentration has transitioned from the core area to the new developed suburban areas. In recent years, the urban center’s area has grown from 300 km2 in 2020 and continues to expand by 10 km2 annually. This expansion has led to the replacement of natural pervious surfaces with impervious surfaces, like roads, factories and residential buildings. Consequently, the ground has become hardened, leading to the loss of the “sponge effect” [3]. The low-lying morphology of urban river basins contribute to the clustering of short-lived productive catchments and the widespread occurrence of river pools in the urban areas, further contributing to waterlogging disasters in Nanning [4,5]. Understanding urbanization and identifying waterlogging-prone areas in cities like Naning can provide valuable insights for addressing waterlogging issues associated with China’s urbanization.
Urbanization leads to waterlogging issues [6,7], which can be attributed to various factors, including urban expansion [8], urban topography and hydrological effects, drainage pipe networks [9,10,11,12] and flood control management [13,14,15,16,17]. Urban expansion is mostly commonly assessed using the impervious surface correlation index [18,19]. Existing studies primarily focus on the distribution of impervious surfaces and waterlogging points [10,20,21,22], the spatial and temporal characteristics and correlation between impervious surfaces and surface runoff [23,24], as well as the density of impervious surfaces to simulate storm waterlogging and effects [25,26]. The primary focus is to understand the effect of impervious surfaces on surface-produced catchment flows. Some commonly used methods in hydrological modeling and simulation include mathematical modeling and multi-scenario simulation, like the SCS-CN hydrological model [24,27], coupling degree model [28,29,30], and Logistic regression machine learning method [27]. These methods mainly involve extracting information on production and catchment flows, simulating the spatial patterns of urban disasters during heavy rainfall, and utilizing data sources such as Landsat remote sensing imagery and DEM digital elevation models [31]. Impervious surfaces can be identified through various methods, such as the LSMA-IBAI index [32], supervised classification, and normalized interpolation index [27,33] methods. Current studies focus on assessing catchment flows generated by impervious surfaces, while waterlogging is simulated based on storm intensity, waterlogged point data and subsurface characteristics. However, the phases involving urban expansion have not been adequately explored, resulting in research conclusions that only describe the current state of urban waterlogging, with limited consideration of the construction and strategic aspects of urban planning. Furthermore, these studies were diverse in their choice of starting point for modeling the extent of waterlogging and rely on a relatively single methodology, leading to a cursory assessment. Therefore, this study aims to introduce the fractal dimension to explore the urban expansion stage. The ArcGIS hydrological analysis employs impervious surface as a weighting factor and incorporates the standard parameter of heavy rainfall in China (≥50 mm). This study derives the spatial and temporal patterns of waterlogging-prone areas in Nanning, and proposes waterlogging prevention strategies by combining the concepts of sponge city and resilient city construction.
2. Materials and Methods
2.1. Study Area and Data Sources
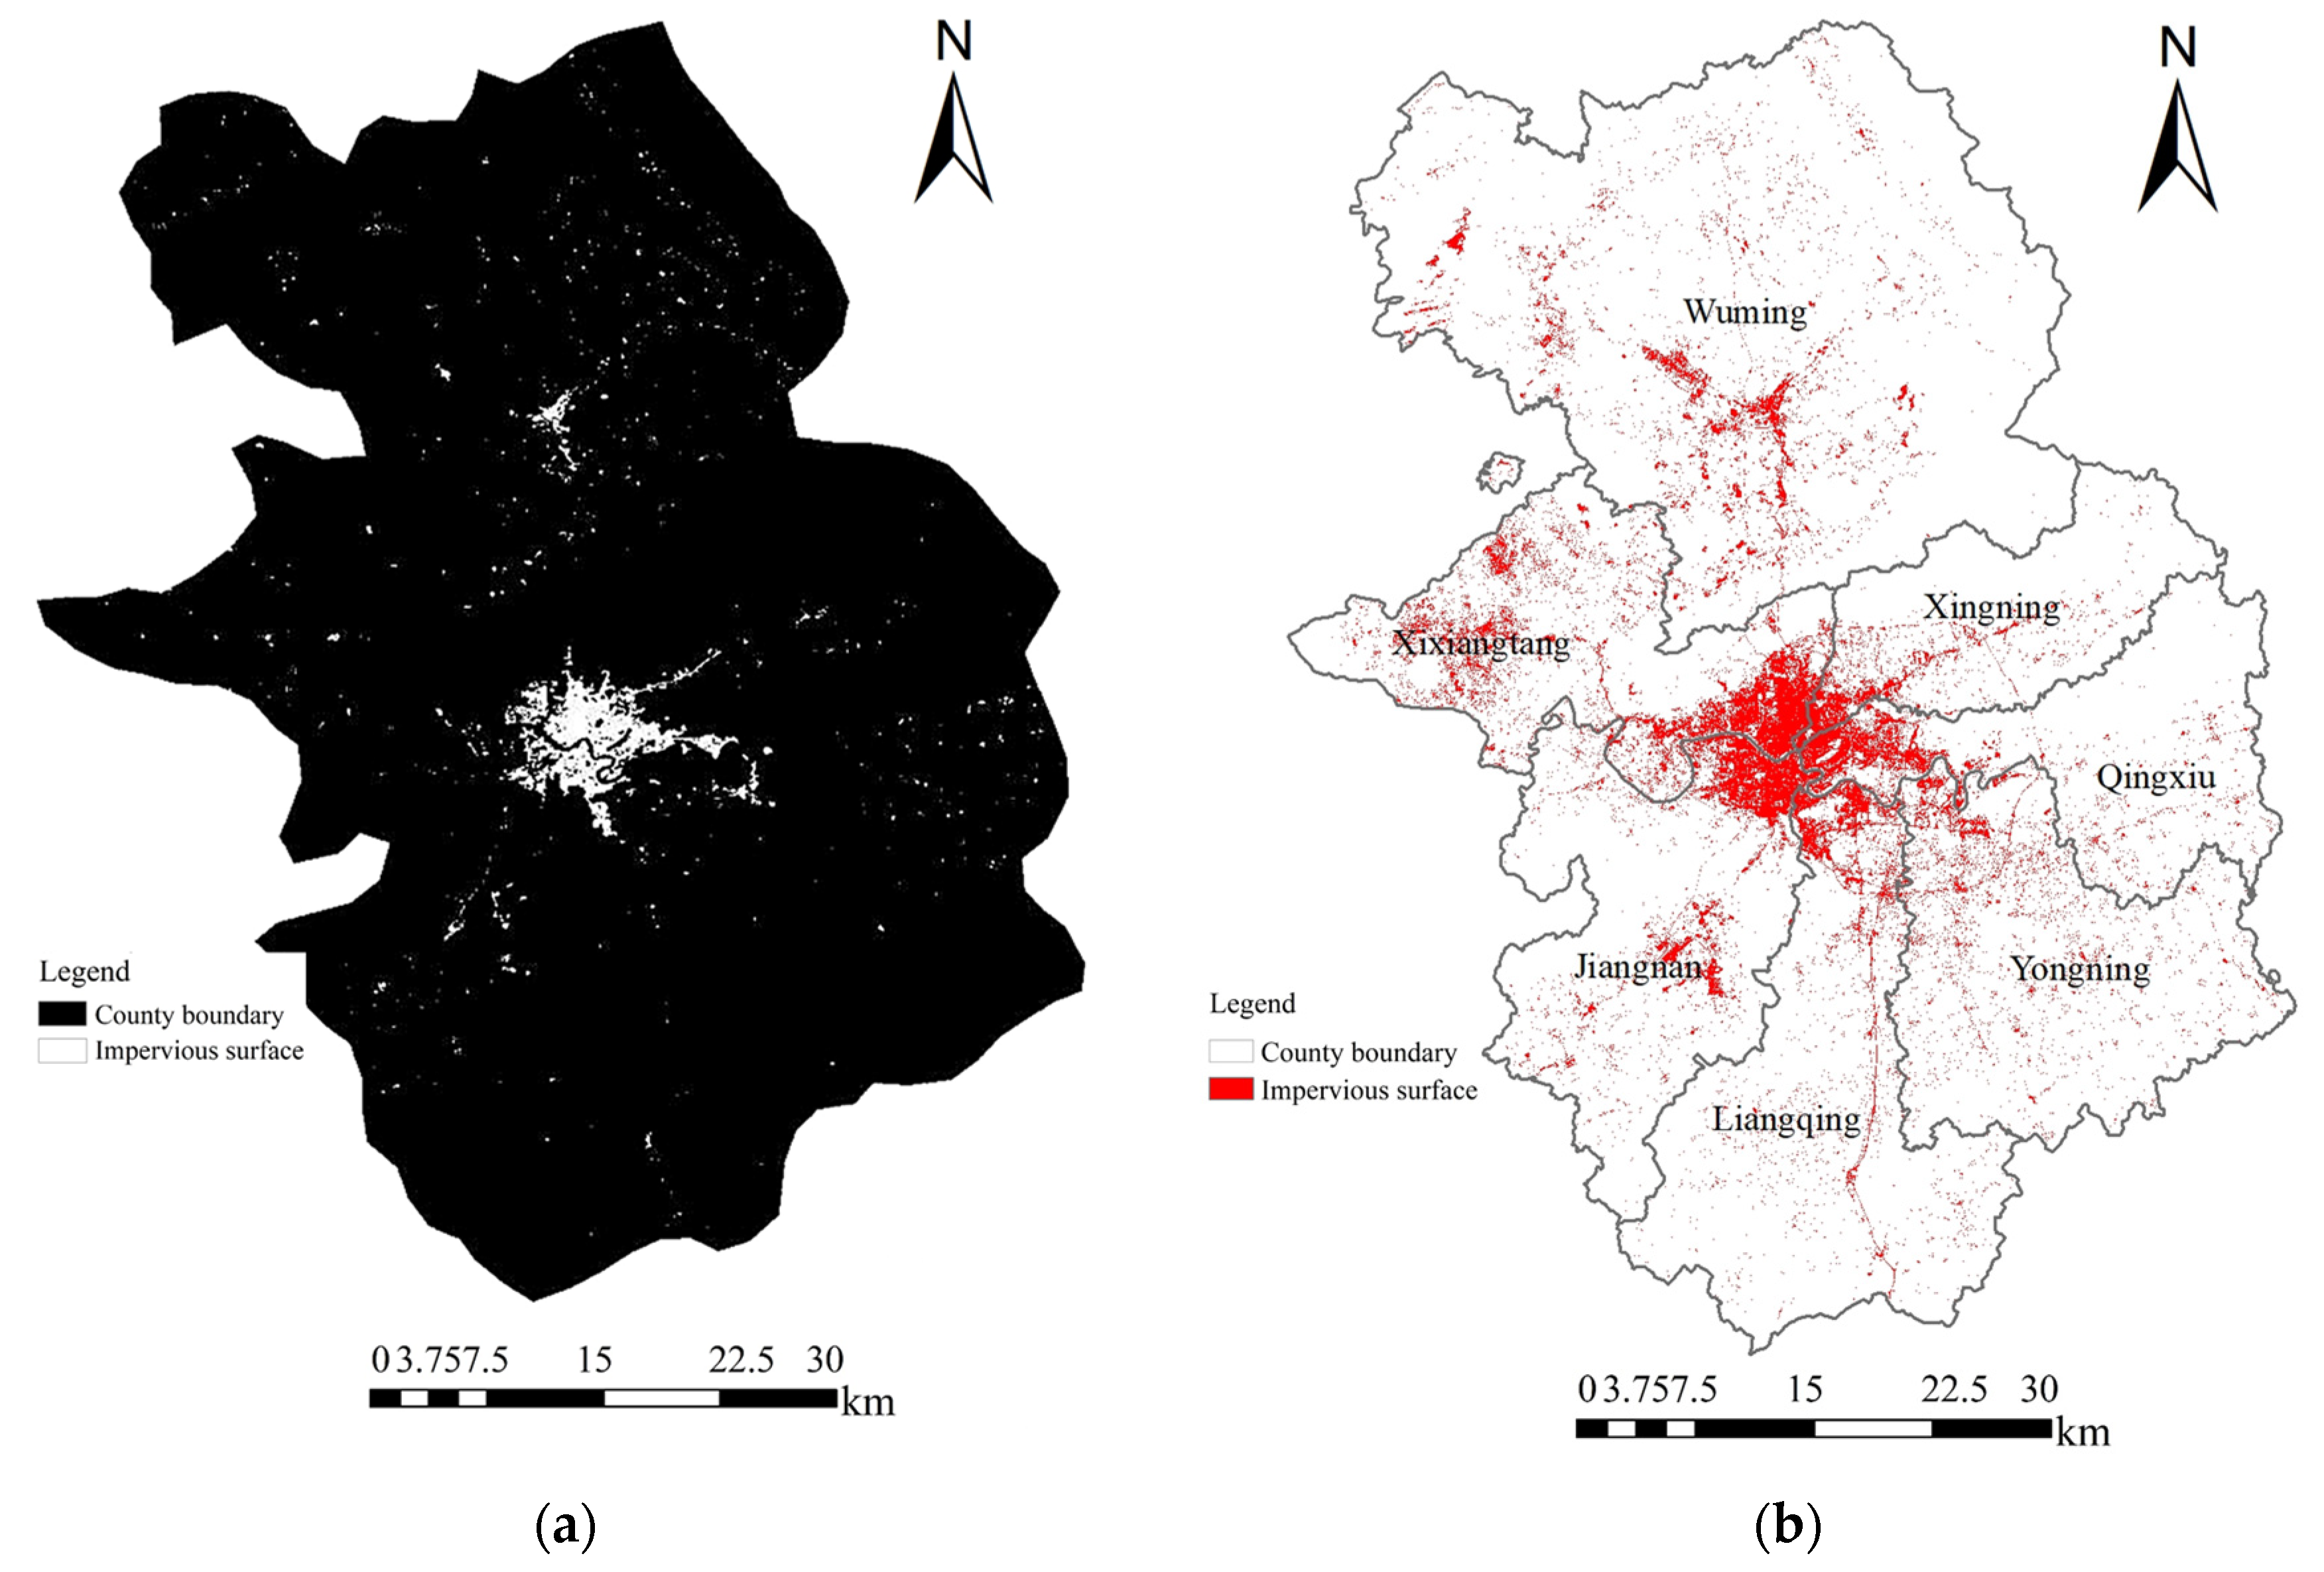
Nanning, the capital of the Guangxi Zhuang Autonomous Region, is commonly known as the “Green City” of China (Figure 1). The region is situated in Southeast Asia, adjacent to the Great Southwest. It shares borders with Guangdong, Hong Kong and Macao to the east, and is located along the Beibu Gulf to the south. Nanning is strategically positioned, being situated at the convergence of three major economic circles: the South China Economic Circle, Southwest Economic Circle and China-Association of South East Asian Nations (ASEAN) Economic Circle [34]. The topography of Nanning reveals an unfolded basin centered on the Yongjiang River valley.
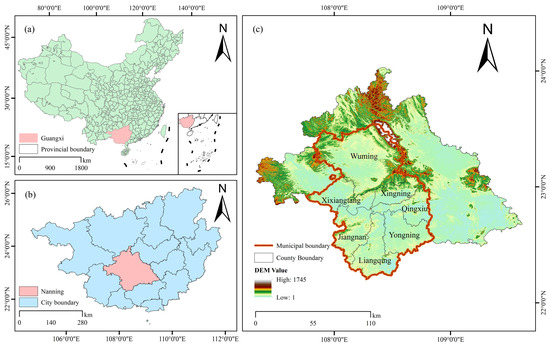
Figure 1.
Location map of Nanning in China. (a) Guangxi Zhuang Autonomous Region, (b) Nanning, (c) DEM and Nanning Municipal District.
The basin’s center contains a concentrated confluence of rivers, with an average annual runoff of 41.8 billion m3 and a watershed area of 73,728 km2. There are 39 rivers with catchment areas larger than 200 km2 [35]. The city is situated in the subtropical zone characterized by a humid climate and abundant rainfall. The urban area receives an average annual precipitation of 1310 mm., Liangqing District had the highest average annual precipitation of 1416 mm from 2013 to 2020, Yongning District followed with 1370 mm, and Jiangnan District had 1313 mm. The precipitation in Qingxiu District, Xingning District, Xixiangtang District and Wuming District ranged from 1250 to 1300 mm. The basin contains a significant amount of surface water resources. Precipitation displays spatial and temporal variations. Nanning provides advantages related to its proximity to the sea, border, river and line. Nanning serves as a crucial entry point to ASEAN countries and holds an important position in the one belt one road initiative, thus possessing a notable international standing.
The data involved in this study can be mainly divided into Landsat Thematic Mapper (TM) data, digital elevation model (DEM) data, administrative district and traffic road shapefile data, Google high-definition (HD) maps, and Nanning Government Gazette. According to Zheng et al. [36], Sun et al. [37], Xu et al. [38] and Huang et al. [39], this paper refers to the experience of the previous authors, and both the data used for impermeable surface extraction and the DEM adopt a resolution of 30 m. Details are provided in Table 1.

Table 1.
Summary table of the data types, sources and uses.
2.2. Research Methods
2.2.1. Image Preprocessing
Three images (TM125044, TM125045 and TM126044) were downloaded from the Geospatial Data Cloud website. These images cover the administrative area of Nanning. To eliminate errors caused by RS image distortion, ENVI 5.3 was used for the band combination and geometric correction of TM8 data, and image mosaic and clipping operations were conducted to the administrative area of Nanning.
2.2.2. Normalized Difference Impervious Surface Index (NDISI) Method
The principle of the NDISI is similar to the normalized difference vegetation index (NDVI) [40]. The study compared features in multiple spectral bands and found that the strong band was placed in the numerator, and the weak band, in the denominator. Normalization was used to enlarge the gap between these bands, which helped to enhance feature characteristics and reduce background elements [41]. Since the visible light reflectance of water bodies is lower than that of impervious surfaces, the modified normalized difference water index (MNDWI) was added to the weak reflection band of the NDISI [42], as follows:
where , and are the reflected radiation values in the near-infrared, mid-infrared and thermal infrared image bands, respectively.
The MNDWI can be calculated as follows:
where is the reflection value in the green light band. The NDISI value varies between −1 and 1, which can be characterized as a normalized index. A value of 0 is chosen as a threshold; a value greater than 0 indicates enhanced impervious information, while a value less than or equal to 0 indicates suppressed feature information.
2.2.3. Supervised Classification Method
Supervised classification is a feature relevance classification method via similarity recognition based on training samples. The maximum likelihood method is usually applied in land class extraction, and the standard accuracy measure of the kappa coefficient based on the confusion matrix is typically considered. According to the mean and variance in the training samples, the attribution probability can be determined. The discriminant function can be expressed as follows [43]:
where x is the spectral feature vector, is the category, is the prior probability of class , and ∑ is the covariance matrix, which can be obtained as follows:
with
where denotes the kth eigenvalue of the -th feature, N is the total number of eigenvalues of the -th feature, is the covariance matrix of the -th class, and is the mean vector of the -th class.
2.2.4. Fractal Dimensional Box Method
The concept of fractal was introduced by Mandelbrot in the 1980s [43,44]. Mandal, Frankhauser and other scholars [45,46] applied it in related studies of urban expansion. The fractal dimension is a key parameter reflecting the fractal characteristics, and the commonly used methods are the scalar law method, the area radius method and the counting box method [47]. Among them, the principle of the box counting method is to apply different scales of boxes to cover the study area, calculate the number of non-empty boxes at each scale, and obtain the number of subdimensions by constructing a double logarithmic coordinate graph of the edge lengths versus the number of non-empty boxes [48]. This operation is closer to the idea of fractal geometry measurement, which is used in this study. The fractal dimension formula is expressed as follows:
where D is the fractal dimension, N((r)) is the number of meshes, and r is the mesh edge length.
The study examined the fractal dimension of urban expansion using spatial and temporal data on impervious surface. The study area is gridded using ArcGIS. The number of grids covered by impervious surface (N((r))) was determined by adjusting the grid scale. A double logarithmic scatter plot was created to show the relationship between the number of grids (N(r)) and the length of the grid sides (r) [49]. The trend line and goodness-of-fit of the scatter plot were utilized to calculate the fractal dimensions of urban expansion. Chen Yanguang’s [48] study concludes that selecting the grid side length (r) based on a geometric series yields more realistic results. The impervious surfaces for 2013, 2017 and 2020 were gridded by dividing them into 1 × 1; 2 × 2; 4 × 4; …; and 64 × 64 grid side lengths (r). The number of non-space grids accounted for by the impervious surface (N(r)) was counted by attributes, and a double log scatter plot was obtained for the three periods of 2013, 2017 and 2020, which was synthesized by fitting to obtain the fractal dimension of urban expansion.
2.2.5. Hydrological Analysis
In this study, DEM data were used to develop a GIS-based model for the surface water flow model [50]. The simulation of a city being affected by heavy rainfall disaster is conducted by considering the characteristics of the underlying surface, slope and slope direction, and modeling it as a river water state. This study further calculated the confluence and river network [51], and considered impervious surface extraction data as weight factors in urban catchment simulations in accordance with the parameters of the national standard for heavy rainfall greater than or equal to 50 mm. In relation to obtaining the urban waterlogging area pattern, the delineation of this waterlogging area is more constructive and strategic for urban planning.
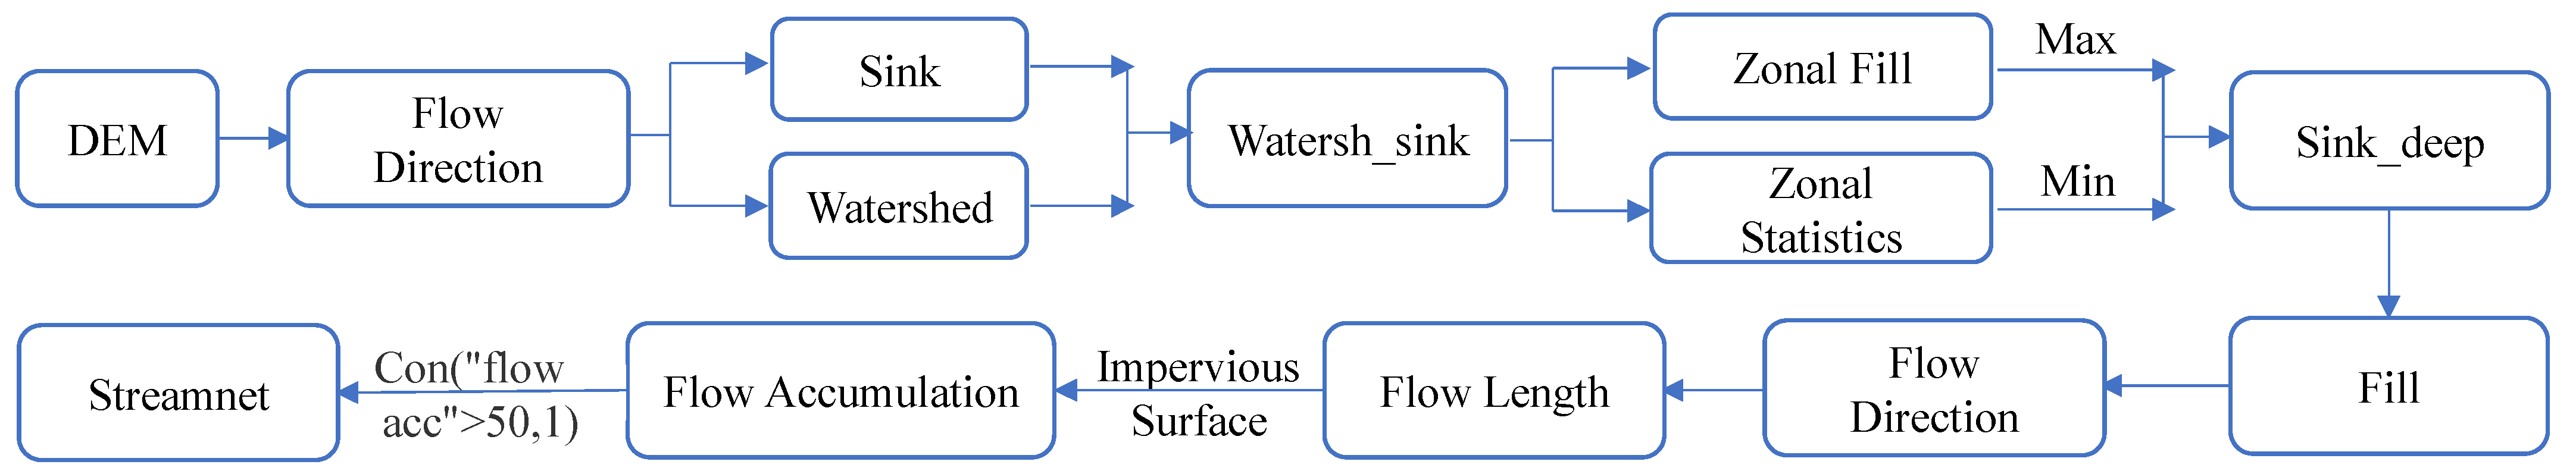
The study will utilize the Spatial Analyst module of the ArcGIS toolbox for hydrological analysis, specifically for surface catchment extraction through flow direction–catchment–river network analysis. In accordance with the principle of “water flows downhill”, the unidirectional flow method is used to calculate the amount of water flowing through each point of the Nanning DEM grid. Impervious surfaces in Nanning were used as weights for the factors affecting the imbalance of runoff distribution to calculate the cumulative amount of catchment in the region. When the accumulation of sinks exceeds the limit value “Con (“flow_acc” > 50,1)”, the resulting pooled volume is the potential waterlogging-prone areas of Nanning. The research method refers to [52] the urban waterlogging-prone area identification study of Zhou et al., with the specific operation process shown in Figure 2.
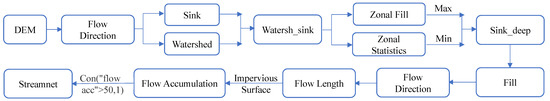
Figure 2.
Waterlogging-prone area extraction flow chart.
As distinguished from flooding-prone areas, the text refers to waterlogging-prone areas of the city that are at risk of waterlogging, not areas where waterlogging occurs. This paper is only conducting a study of an area where it is likely to occur. It is not specific to areas that have already produced flooding. Since urban planning should be more future-oriented, it is more applicable to waterlogging-prone areas. In terms of scope, the waterlogging-prone areas are larger than the flooded areas. Therefore, instead of delving into the necessity of the flooded areas, areas that are more likely to produce waterlogging should be used as the object of planning rather than areas that have already produced flooding. This is because planning is a more visionary endeavor rather than focusing on matters that happened in the past.
3. Results
3.1. Impervious Surface Extraction and Accuracy Evaluation
Impervious surfaces in urban areas consist of various construction materials that prevent the infiltration of water. This study focused on impervious surfaces found within the construction land area, specifically buildings, hardened ground surfaces, roads and squares. Impervious surfaces in Nanning in 2017 were identified using the normalized difference index method and supervised classification method. The obtained results were then compared to Google Maps. It could be found that the supervised classification method was more effective. Among these methods, the normalized difference index method defined a threshold value of 0.65 through multiple repeated tests. After enhancing the band, impervious surface information greater than 0.65 was indicated in white, while spectral information of other suppressed features, such as water bodies and vegetation less than or equal to 0.65, was indicated in black. The results are shown in Figure 3a. The supervised classification method was used to identify image features according to the samples by establishing sample templates. The results are shown in Figure 3b. Therefore, this study applied the supervised classification method in impervious surface extraction.

Figure 3.
(a) Normalized difference index method-based extraction; (b) supervised taxonomy extraction.
With the use of ENVI 5.3 in supervised image classification, a pseudo color band combination of RGB = 7, 4, 2 was selected to identify features based on TM image characteristics. This combination facilitated the characterization of buildings and green spaces, resulting in enhancing the classification accuracy. Simultaneously, Google Maps was used to assist in identifying features, resulting in the division of the surfaces in the study area into three major categories: impervious surfaces, green paces and other surfaces. The sample selection should cover the entire image area as much as possible, while also ensuring that a diverse range of land features is represented. The distribution of each category should be evenly distributed among the different image areas. Templates of known samples were used to define the training area (region of interest, ROI). Following the completion of sample selection, the automatic recognition module was initiated to calculate all the surface regions of the image and obtain land class recognition data pertaining to the research area.
To ensure more reliable classification results, an accuracy evaluation was performed based on the obtained data. The extracted impervious surface results were evaluated for overall accuracy and the kappa coefficient using a confusion matrix. The confusion matrix was employed to quantify the ratio between the number of ground pixels and the number of classified pixels for a certain class of custom categories. This calculation was performed using the corresponding positions of the classified training samples in the considered image [53]. The evaluation results (Table 2) revealed that the overall accuracy in the study area reached higher than 90%, the mean kappa coefficient exceeded 0.90, and the accuracy was higher than 85%. These findings demonstrate that the extraction results are highly reliable.
Table 2.
Confusion matrix accuracy evaluation table.
3.2. Characteristics of Urban Expansion in Nanning
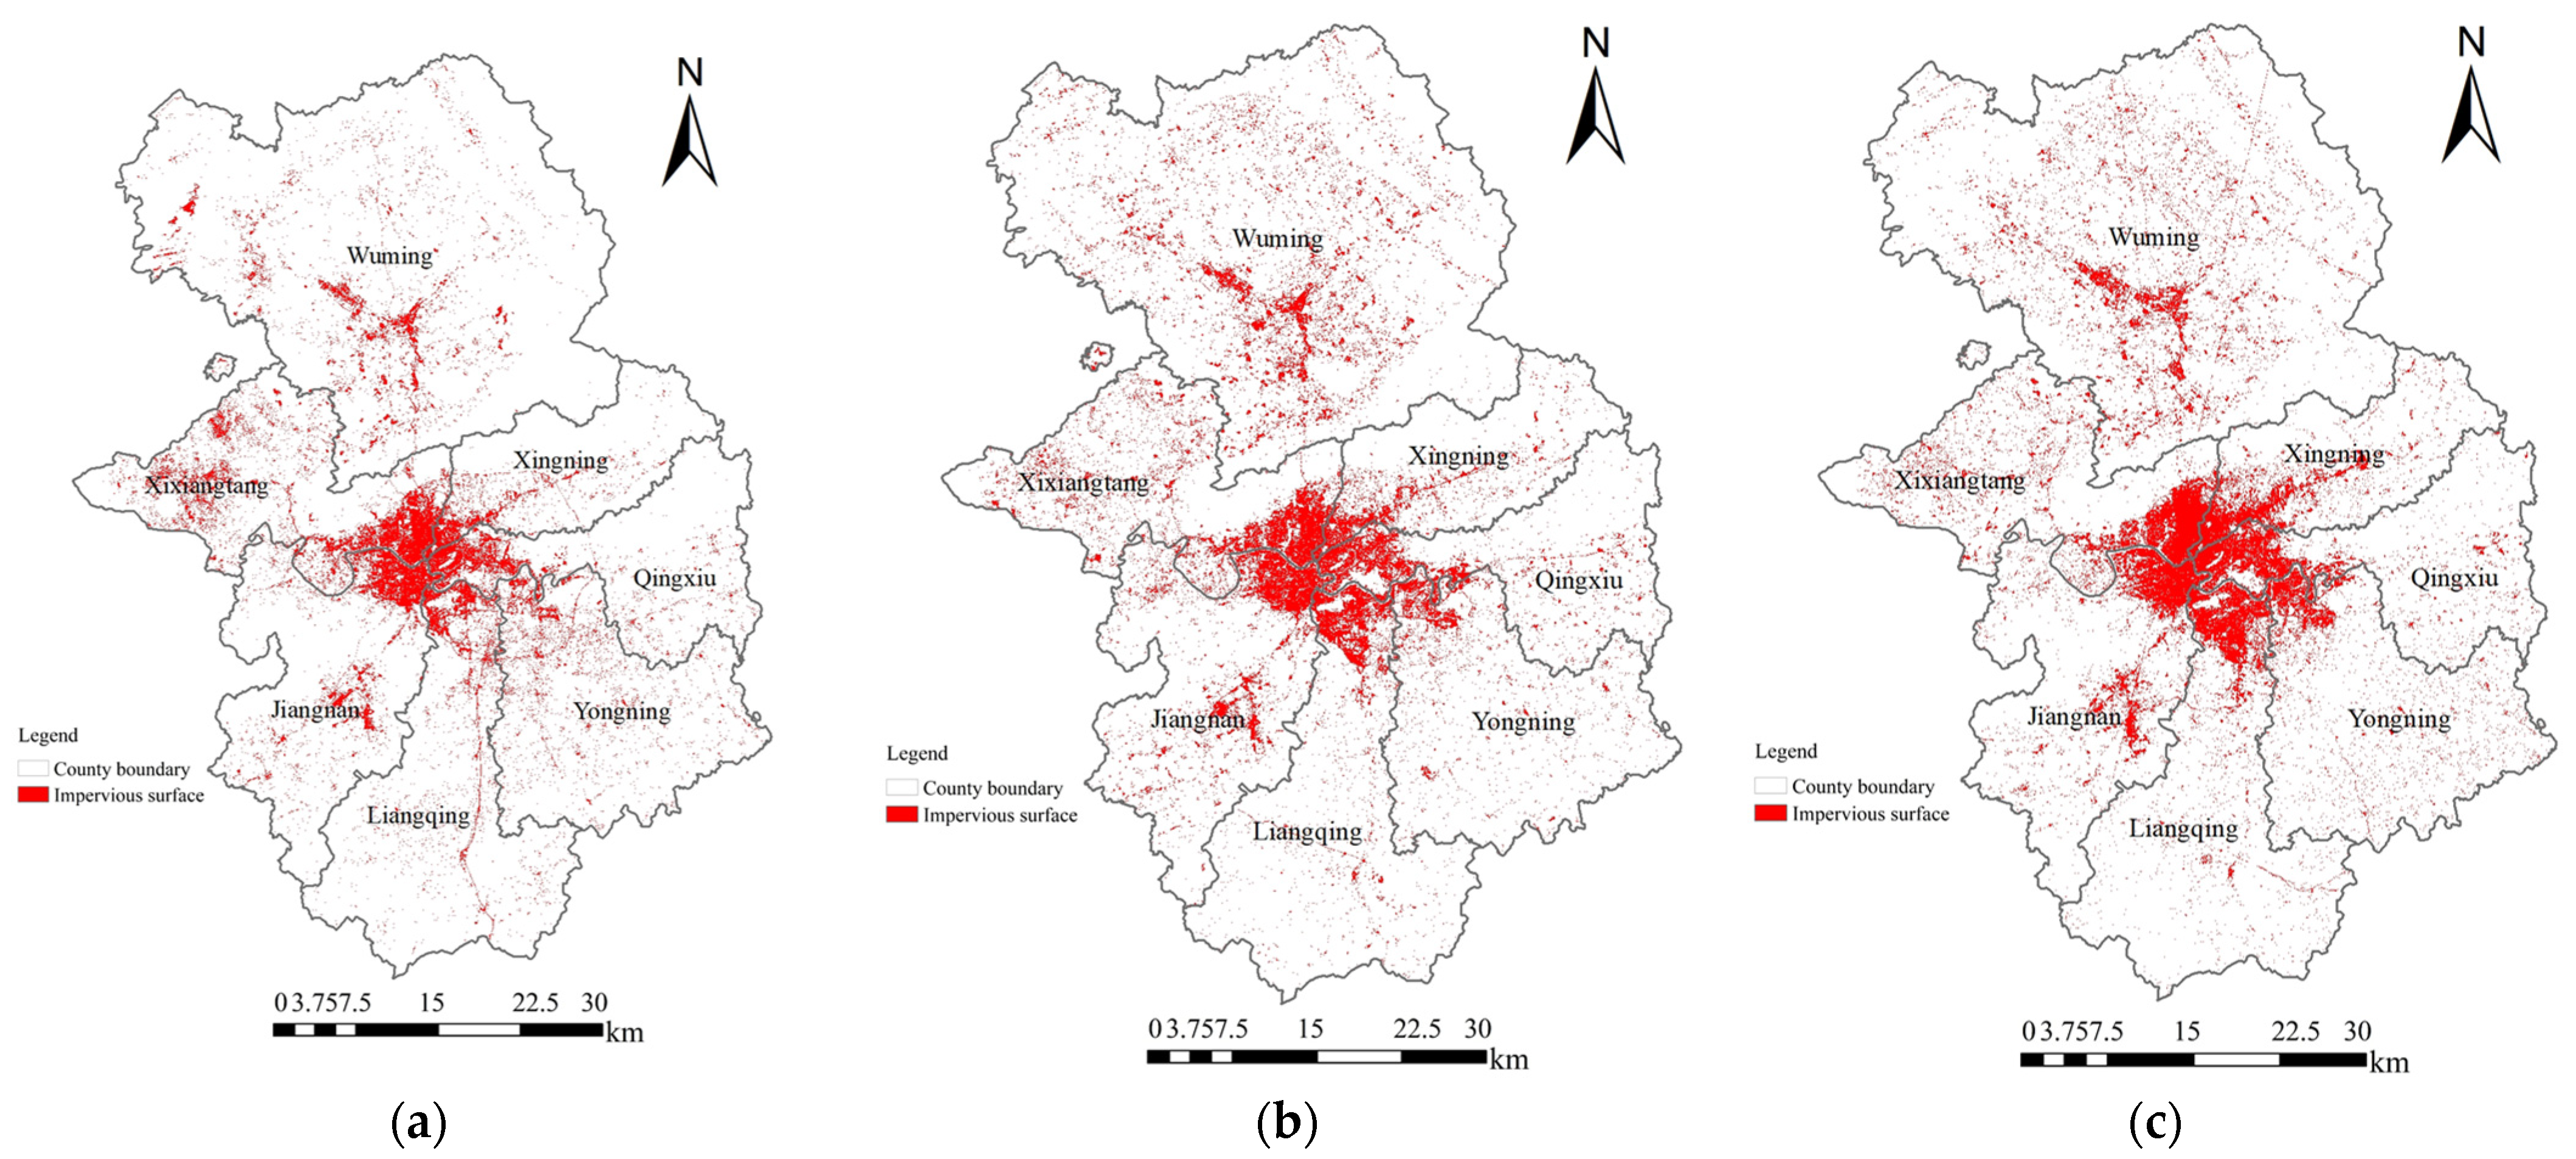
Based on the analysis of urban expansion fractal dimension and impervious surface data (Figure 4), it is evident that the fractal dimension of Nanning increased from 1.32 to 1.58 from 2013 to 2020. A fractal dimension less than 2 indicates that urban impervious surfaces decreases from the center to the periphery [54]. The urban expansion of Nanning is characterized by the trend of gradually extending outward from the center with continuous filling. The concentrated areas of impervious surfaces are in the center of Nanning and the center of Wuming District, expanding continuously to the east and south after filling the sparse areas of the center. The fractal dimension is increasing year by year as a result of urban planning and construction activities. The complexity and stability of impervious surface are diminishing. Its expanded morphology is more irregular, leading to an increase in impervious surface connectivity. From 2005 to 2018, there was a significant increase in urban construction land, particularly in residential land, which has expanded to 318.6 km2. Its growth rate has experienced an increase since 2013. This was followed by a total increase of 14.46 km2 in roads and transportation, 14.17 km2 in green spaces and squares, 13.17 km2 in industrial land, 10.98 km2 in commercial service facilities, 8.69 km2 in public administration and public services land, 5.17 km2 in logistics and warehousing land and 5.12 km2 in public facilities land. In terms of urban planning, from 2005 to 2020, the administrative district underwent changes in urban planning. Specifically, the former Yongning County and former Wuming County, and the county removal were divided, resulting in the establishment of districts. This restructuring led to an increase in the impervious surface area in the Nanning municipal district. A large number of express circuits and infrastructure, and a high-speed train transportation network have resulted in an overall clustering of spatial areas. Urban development follows a circular expansion pattern, characterized by a single core and multiple axis. By building two main development axes to the east and south, the aim is to overcome the urban location barriers in Beibu Gulf and to promote connectivity to increase the proportion of impervious surface in the city.
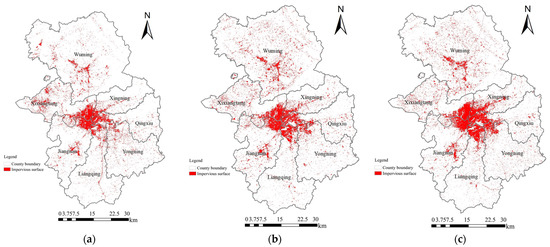
Figure 4.
Spatial pattern of the impervious surfaces in Nanning: (a) 2013; (b) 2017; (c) 2020.
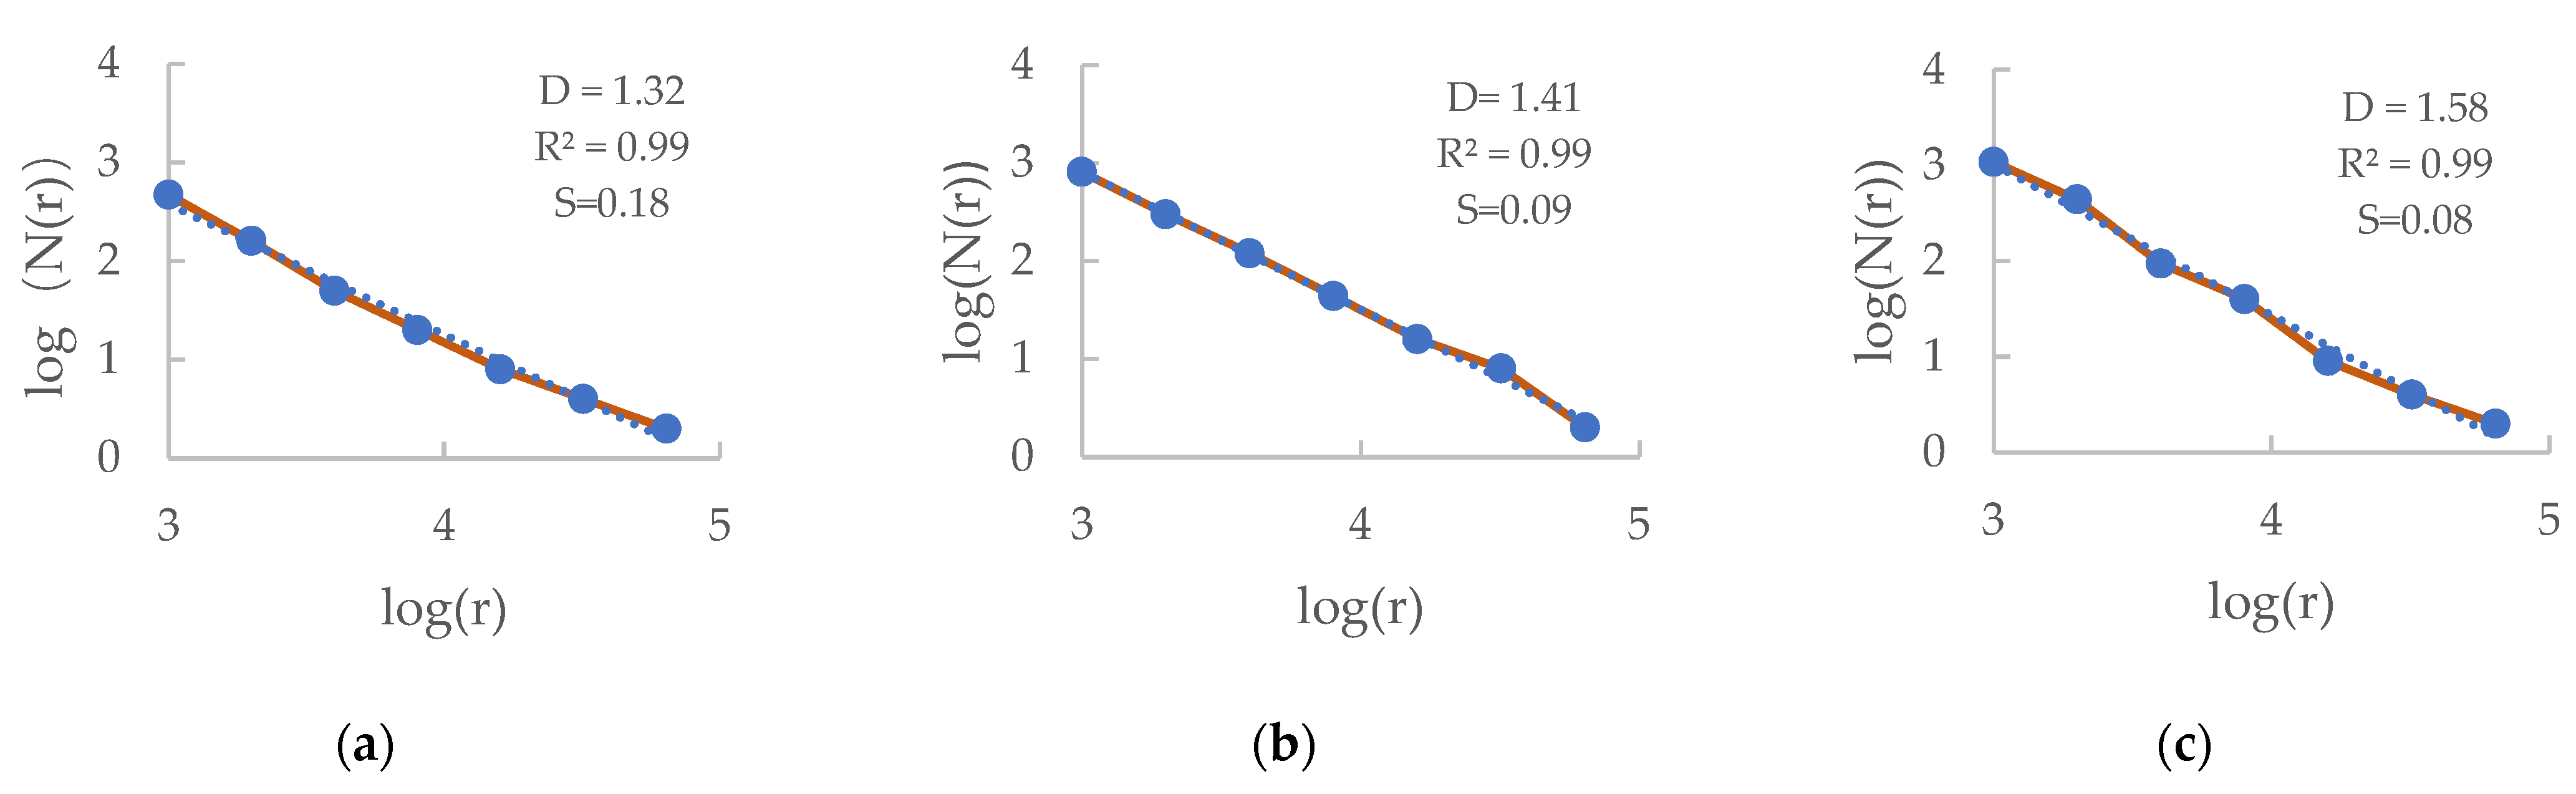
According to the number of non-space grids (N(r)) calculated for the years 2013, 2017 and 2020, the grid side lengths (r) are substituted into the formula log(N(r)) = a + blog(r), where a and b are the linear fit values, and is the correlation coefficient. In the urban sprawl fractal dimension D = |b|, a larger D value represents a stronger trend of urban sprawl, and when D < 2, it represents a decrease in urban land use from the center to the periphery [54]. The stability coefficient S is calculated from the fractal dimension D, S = |1.50 − D|, with the theoretical value of S ranging from 0 to 0.50, with a smaller S value representing greater instability [55]. The study utilized Microsoft Excel 2019 to produce a double logarithmic scatter plot following the trend line obtained for > 0.90. The fractal dimension of urban expansion was found to be 1.32, 1.41 and 1.58 for the years 2013, 2017 and 2020, respectively (Figure 5). The greater the intensity of urban expansion in Nanning, the more significant the decreasing trend of impervious surface from the center to the periphery. The stability coefficient is 0.18, 0.09 and 0.08 in 2013, 2017 and 2020, respectively, showing a gradually decreasing trend, characterizing the complex and unstable distribution structure of impervious surfaces in Nanning.
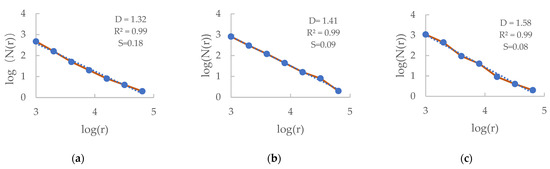
Figure 5.
Urban expansion fractal dimension: (a) 2013; (b) 2017; (c) 2020. Solid line is a double logarithmic scattering line, and dotted line represented the trend.
3.3. Spatial Distribution Pattern of Waterlogging-Prone Areas
The hydrological analysis results were used to overlay spatial pattern data of the urban traffic road network and impervious surfaces. This allowed for the creation of spatial and temporal distribution maps of waterlogging-prone areas in Nanning for 2013, 2017 and 2020. Since the confluence determination process incorporated impervious surface data as weight, factors and the action process of influencing factors was considered from the root, the spatial pattern of waterlogging-prone areas during these three periods accordingly exhibited significant spatial variability. The reliability in this study was verified according to the distribution results of the waterlogging-prone areas, as shown Figure 6a–c.
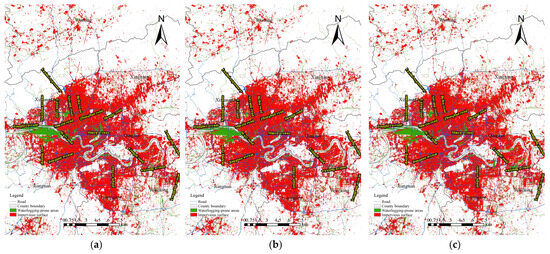
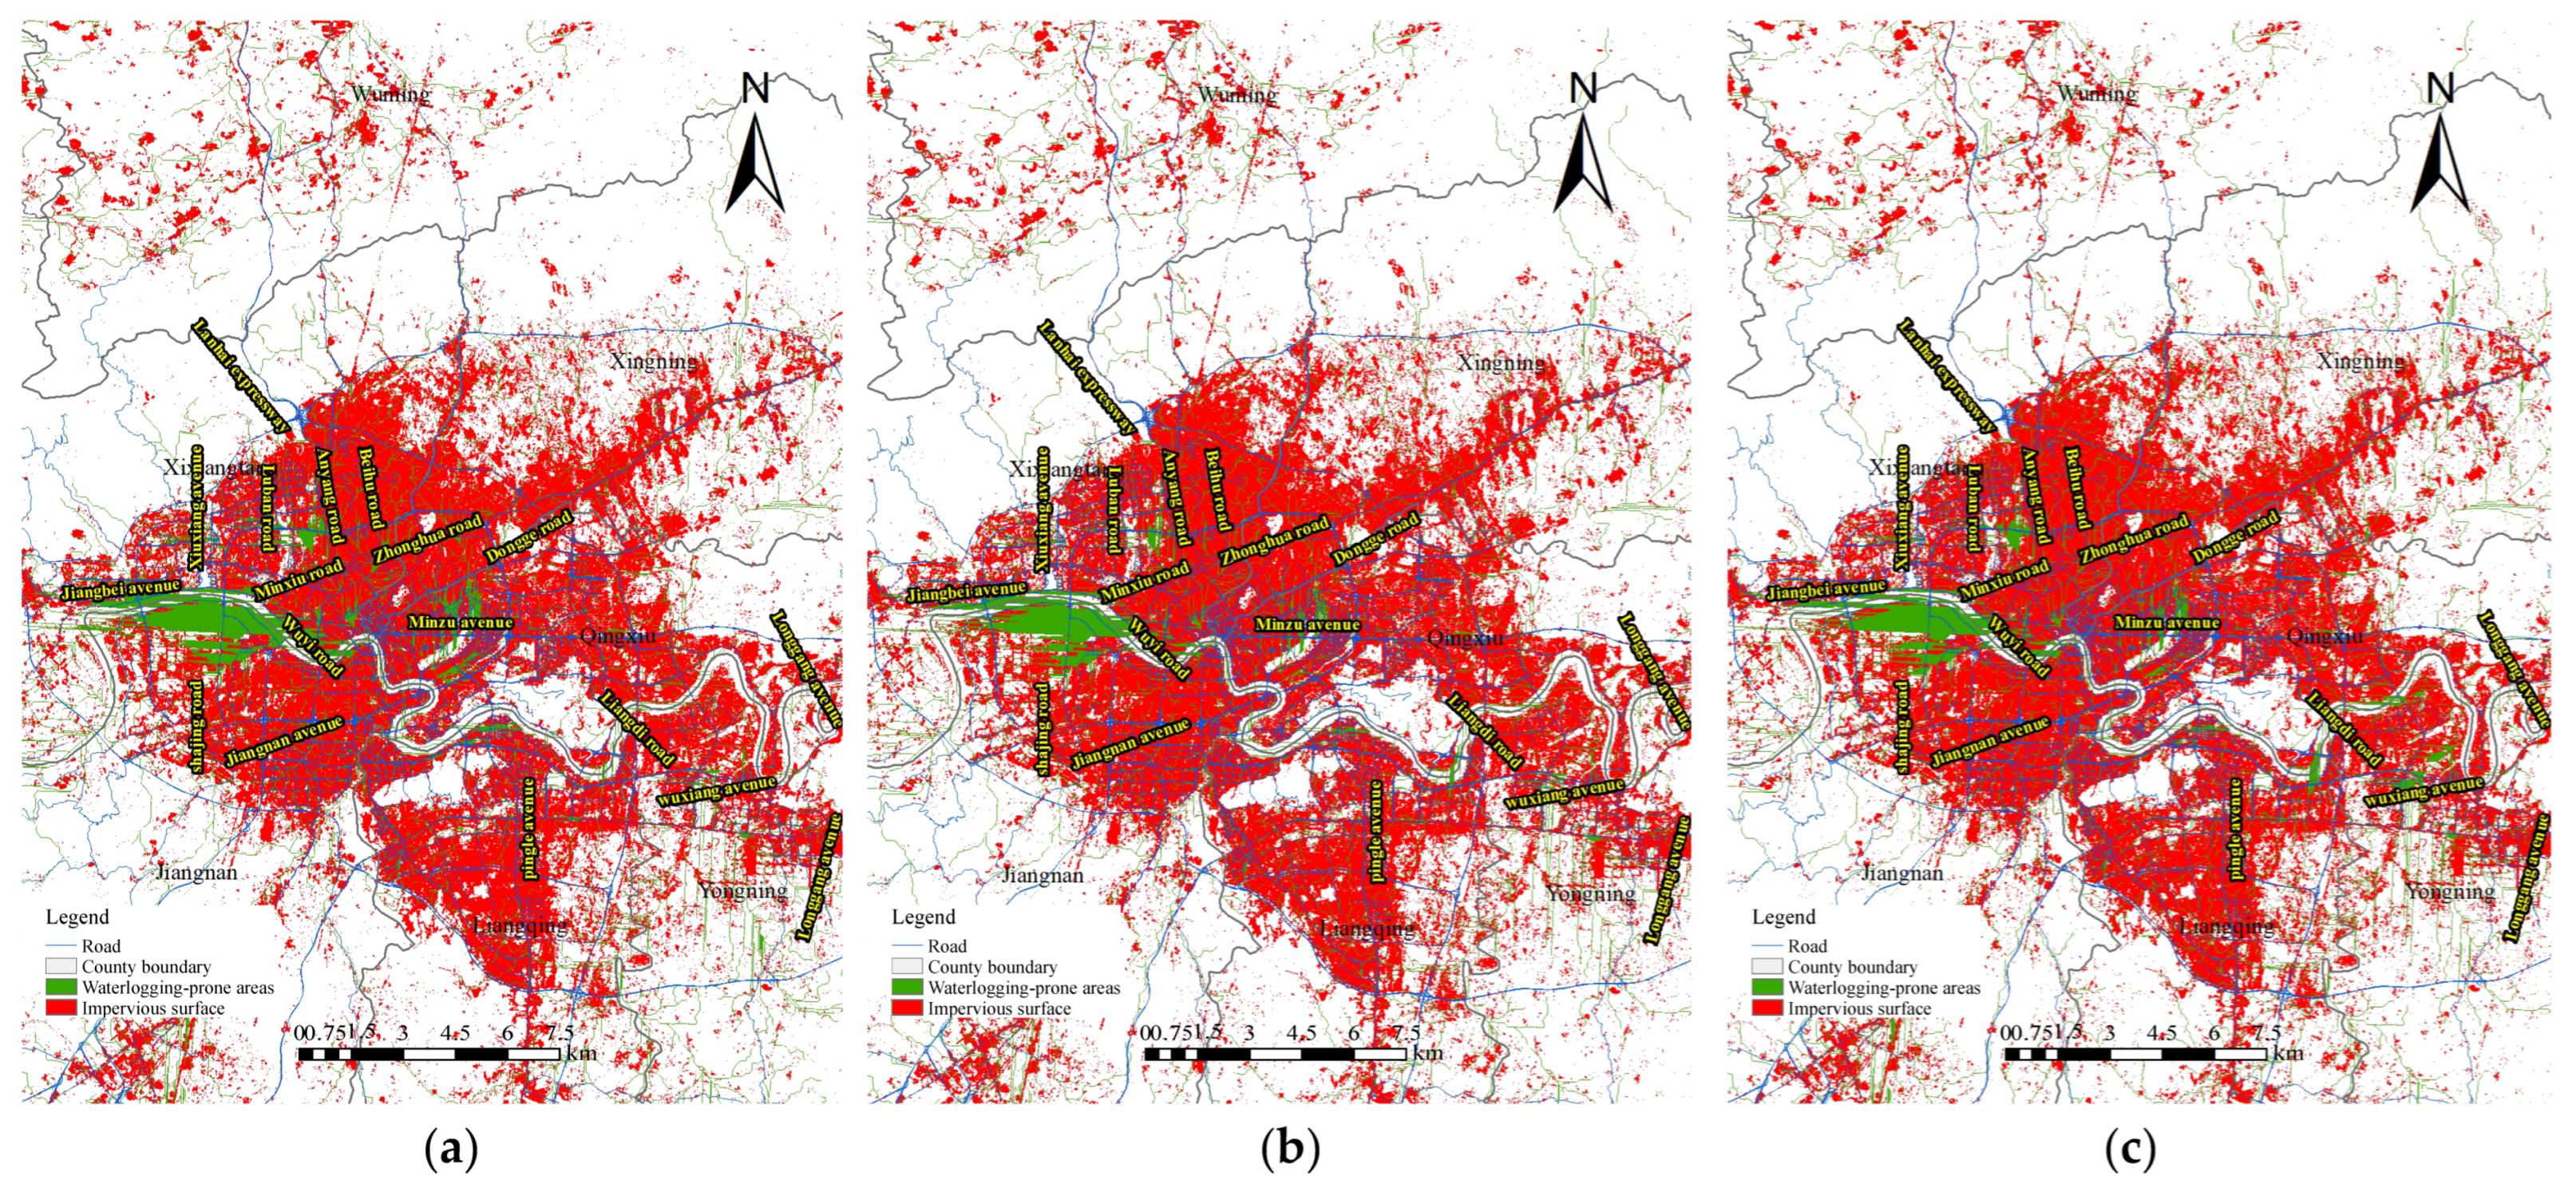
Figure 6.
Distribution of the waterlogging-prone areas in Nanning in (a) 2013, (b) 2017, and (c) 2020.
The impervious surface decreases from the center to the edges, which is consistent with the distribution pattern of waterlogging-prone areas. The waterlogging-prone areas are gradually shrinking. During 2013–2020, the fractal dimension of urban expansion increases from 1.32 to 1.58. Additionally, the stability of impervious surfaces decreased, while susceptibility to waterlogging shifted from a centralized to a fragmented distribution trend. Nanning is strategically planning to expand towards the east and south following the removal of counties and the reorganization of its infrastructure. The urban fractal dimension increases year by year, and the complexity of impervious surface structures persists. There is an increase in the number of waterlogging points in Wuming and Yongning districts, and the administrative spatial connectivity with the surrounding area is increasing. Waterlogging-prone areas show a tendency of continuous distribution in a fine-grained manner. Temporally, in 2013, the urban expansion has a general fractal dimension and a simpler structure of impervious surfaces. Impervious surfaces in the center of the city waterlogging points cover a large area, involving a wide range of areas. It is mainly concentrated in Xixiangtang District, Qingxiu District and Jiangnan District. In 2017, there is a tendency for the fractal dimension of urban expansion to increase and the structure of impervious surfaces to become a complex state with decreasing stability. The range of waterlogging-prone sites was reduced and characterized by a scattered distribution, with expansion continuing along the direction of Wuming and Yongning. In 2020, the urban expansion fractal dimension increases to 1.58, and the impervious surface structure is more complex and less stable. This trend was further expanded to Yongning District in the east and Liangqing District in the south. Based on the city road division results, Nanning waterlogging-prone areas were mainly concentrated in the Xixiangtang Xiuxiang Avenue and Mingxiu Road areas, Qingxiu District Gecun Road, Binhu Road, Zhuxi Interchange, Jiangnan District Wuyi Road and Jiangnan Avenue areas. Few waterlogging-prone points occurred in Liangqing District and Xingning District. The waterlogging-prone points in Yongning District increased year by year. These points were sporadically distributed in Wuming District. The specific distribution is summarized in Table 3.
Table 3.
Concentrated waterlogging-prone sections from 2013 to 2020 in Nanning.
4. Discussion
4.1. Compared with Previous Studies
The study concluded that the distribution of waterlogging-prone areas were consistent with the historical waterlogging outbreaks in Nanning City, as analyzed by Xu [56] and Chen [57]. Huang [3] assessed the risk of inundation in Nanning city using Doppler radar products, numerical forecast products, and data from dense automatic rainfall observation stations. This assessment was conducted by employing an inundation accumulation model. The results also indicated that Qingxiu, Xixiangtang, and Jiangnan districts were waterlogging-prone urban areas. The road with the highest was Wuyi Road at 12.5%, followed by Beihu Xiuxiang Avenue at 10.5%, and Dongge Road and Mingxiu West Road tied for third place with a frequency of 6.7% [3,57]. Its distribution of roads in waterlogging-prone areas coincided with this study. Internationally, Jinping [58] suggested that the primary influence of flooding is elevation (DEM), with secondary influences being roads and water bodies. Bhaumik Kaushik et al. [59] used DEM to calculate slope and the D8 algorithm to accurately derive the waterlogging range, and identified key areas affected by runoff, flow accumulation and waterlogging. Rejouanul [60] used Landsat imagery to calculate the area of waterlogged in Sadekira County using a supervised classification method. Alternatively, the DEM topographic index was utilized to delineate waterlogging-prone areas in the Mohanadi Basin, India [61]. A multifaceted fusion of topographic, subsurface, transportation and meteorological elements was used to derive waterlogging-prone areas using hydrologic analysis [62]. The study attributes waterlogging to a combination of topography, slope, water accumulation and land use [61,63,64]. Waterlogging management and resolution strategies focus on sponge cities, natural solutions, resilience concepts, and more [65,66,67]. The study recognizes difficulties in modelling methods and data acquisition, high cartographic costs [68], and insufficient hydrological monitoring stations. These limitations and opportunities increase the reliance on satellite products and present a simple and effective DEM-based method for calculating floodplains [69]. Previous researchers have established a correlation between waterlogging areas and variations in the distance from the center of mass and the size of lakes [16]. Waterlogging-prone areas have also been extracted by ArcGIS hydrologic analysis using DEM data [52]. This analysis took into account the correlation analysis of human activity, topographic conditions and urban subsurface elements [70,71,72].
Previous research has examined important factors related to flooding, including hydrology, precipitation, drainage networks, topography and impervious surfaces. The analysis can be conducted using either a single element or a combination of multiple elements. The introduction of impervious surface element weights was not aligned with the urban expansion perspective. Storm parameters lack quantitative measurement. This paper quantitatively analyzes the road distribution pattern in waterlogging-prone areas based on waterlogging factors. It also examines the degree of waterlogging, and the evolution direction and trend of road distribution in these areas.
4.2. Policy Applications
4.2.1. Prevention and Control Strategies for Waterlogging-Prone Areas in the Development Areas
Waterlogging-prone areas in development zones are primarily found in Liangqing District, Yongning District and Wuming New District. This trend aligns with the pattern of urban growth and population distribution in Nanning. Waterlogging-prone areas exhibit an escalating fragmentation of land division over time. The comprehensive evaluation of population structure, economic level and social security is necessary for waterlogging-prone areas in development zones. The concept of resilience, as discussed by Pickett [73], pertains to resilient cities, which encompass three key domains: infrastructure, community and social construction [74,75]. It is employed to justify the process of urban planning and construction. It is necessary to establish community-based guidelines for waterlogging prevention, and control awareness and action. This includes the development of plans and organizational systems for managing waterlogging risks, as well as the implementation of programs to effectively manage these risks and enhance disaster recovery capacity. To achieve sustainable demographic, economic and social development, the city has prepared immediate, medium-term and long-term plans. These plans aim to coordinate future developments and enhance the city’s management functions. One approach to address this issue is through urban drainage engineering planning and design [76]. This involves revising the storm intensity formula, optimizing the urban land use layout and drainage system, accurately predicting population size, and establishing a prevention and control mechanism based on monitoring, early warning, and simulation. This approach enhances the intelligent, technological and smart urban operation system, fostering a sustainable and harmonious urban development trajectory that prioritizes environmental preservation and safety.
4.2.2. Prevention and Control Strategies for Waterlogging-Prone Areas in the Old Urban Areas
The primary areas of focus in Nanning’s old urban regions are Xixiangtang, Jiangnan, and Qingxiu districts. These districts are characterized by high population density, outdated infrastructure, and susceptibility to flooding. The renovation of this area entails significant economic expenses and engineering challenges. Simultaneously, it is essential for planning design and institutional policies to integrate public participation extensively [77]. This integration serves to promote the engagement of residents and the general public, safeguard their rights and interests, and foster their enthusiasm [78]. To effectively mitigate and manage flood disasters, it is recommended to adopt the concept of “systematic construction and zonal management”. This can be achieved through various measures, such as sponge city source emission reduction, process control, and end storage [79]. Additionally, it is crucial to enhance the urban management monitoring system and early warning mechanism [80]. The sponge project encompasses various facilities for the purposes of rainfall interception, infiltration, containment and utilization. These facilities include purification, infiltration, storage and transfer systems. The following urban transformation measures can be implemented: Roof rainwater disconnection involves redirecting precipitation into rain gardens or artificial gardens [81]. Permeable paving and leaching wells, such as permeable bricks, grass tiles, and precipitation devices, are commonly used methods [82]. Rainwater tanks and cisterns, including surface vertical and buried rainwater irrigation systems, are commonly used for water storage. These systems can be made from various materials, such as plastic, silica sand, concrete and others [83]. Seepage pipes, also known as canals, and planted grass ditches, such as pipe trenches and buffer strips, have the ability to facilitate precipitation infiltration [84]. Sponge city construction aims to achieve the reasonable coordination of economic and social benefits. It has the potential to significantly reduce disaster risk and enhance social, economic and ecological benefits. Additionally, it offers effective strategies and methods for preventing and controlling waterlogging in older urban areas.
The aforementioned strategy serves as a recommendation for the city’s medium- and long-term development. In light of the increasing frequency of severe urban rainstorms, such as the Zhengzhou, Beijing and Guangzhou rainstorms, it is imperative to undertake policy reflection. These events occur sporadically in terms of timing and location, and frequently result in severe urban crises within a short span of time. Primarily, these events assess the city’s level of preparedness and its capacity to respond to emergencies. The alignment between ex ante monitoring–forecasting–warning devices and disaster prevention–avoidance–emergency response devices has been enhanced. An emergency dispatch and disposal program and response linkage system were established in response to the incident. Next, we provide a summary of the post-disaster construction experience and disaster response. These aspects merit ongoing enhancement and a proactive approach. High-precision remote sensing (RS) and geographic information system (GIS) technologies have been utilized to enhance the effectiveness of managing, locating, searching for and obtaining transient data. The real-time monitoring system is connected to the drainage network system and includes built-in mechanisms for level warning and simulation. In emergency dispatch and departmental response, the judicious utilization of big data enables the making of informed and precise decisions. Extreme events pose a challenge to a city’s comprehensive response due to their suddenness and unpredictable consequences. By fostering collaboration among individuals, technology, organizations and systems, the capacity for disaster management can be significantly enhanced, thereby promoting a positive cycle of urban development.
4.3. Limitations and Future Research
This paper examines the relationship between urban expansion and the identification of waterlogging-prone areas in urban environments. The formation of urban areas prone to waterlogging is a multifaceted and dynamic process influenced by various factors, including hydrology, drainage network and flood control management.
In the hydrological study, the methodology employed involved the integration of national rainfall parameters exceeding a threshold of 50 mm with digital elevation model (DEM) data. In order to simulate the extraction of waterlogging-prone locations, we utilized the impermeable surface as a weighting factor. Various factors are considered to a certain extent, including the topography, substrate and precipitation components. The treatment of hydrological components will be insufficient in terms of addressing their intricacy. The extensive components resulting from waterlogging are the subject of study in this article. The objective is to distinguish the primary elements that are affected by urban growth, as these hold greater significance for urban planning and the implementation of construction countermeasures.
The modeling process exhibits a greater susceptibility towards various facets of urban growth, while the concept of fractal dimension primarily focuses on the progression and evolution of urban development. The scope of this research is limited to the examination of waterlogging regions during the process of urban development, without delving into the characteristics of urban growth. While it is true that modeling is a scientific approach, it is important to note that the primary focus of the study does not lie in addressing the features of urban expansion. Utilizing fractal dimension as a means of evaluating the stage of urban growth proves advantageous in the context of implementing urban planning strategies.
The study encountered limitations in spatial data overlay and the overall analysis due to challenges in obtaining urban drainage network data. The follow-up study could involve collecting and processing regional spatial and temporal precipitation data to be used in the analysis of waterlogging-prone areas. In future research, it is imperative to consider various factors when studying the combined impacts of urban areas prone to waterlogging. Additionally, there is a need to enhance existing research models. The formation of urban waterlogging-prone areas varies due to differences in the geographical characteristics of urban development. Empirical research on identifying waterlogging-prone areas in cities with varying characteristics can effectively categorize these areas and develop appropriate prevention and control strategies.
5. Conclusions
This study examines the formation of urban waterlogging by considering impervious surfaces and topography elements, specifically the Digital Elevation Model (DEM). The fractal dimension of urban expansion is calculated using impervious surface data. The study combines the normalized difference index method, supervised classification, and hydrological analysis methods to identify areas prone to waterlogging in Nanning, a sponge city. A simulation study based on an impervious surface scenario was conducted to comprehensively derive the pattern of waterlogging-prone areas and propose prevention and control strategies. The conclusions are as follows:
- (1)
- Impervious surface expansion is consistent with the urban planning goals of Nanning. This method focuses on the central city as the core and vigorously extends the impervious surface area along the main urban development axis toward the east and south. There has been a notable increase in impervious surface agglomeration from 2013 to 2020.
- (2)
- The frequent waterlogging-prone points are closely related to the development trend of impervious surface expansion and the distribution of old areas in Nanning. These points are located on the main roads in historical districts, such as Xiuxiang Avenue and Mingxiu Road areas in Xixiangtang District and Wuyi Road areas in Jiangnan District. The frequent waterlogging-prone points in the urban development zone are relatively scattered, such as near the Gecun Road and Zhuxi Interchange in Qingxiu District, with enhancement along the direction of Yongning District and sporadic distribution trend in Wuming District.
- (3)
- In terms of waterlogging prevention and control strategies, old areas should employ sponge city engineering transformation, while new development areas should focus on the urban resilience concept during planning design and implementation management.
Author Contributions
Conceptualization, J.H. and J.L.; methodology, J.H., J.L. and Z.H.; software, J.H.; validation, J.H.; formal analysis, J.H. and Z.H.; investigation, J.H.; resources, J.H.; data curation, Z.H.; writing—original draft preparation, J.H.; writing—review and editing, J.H., J.L. and Z.H.; visualization, J.H.; supervision, J.L.; project administration, J.L.; funding acquisition, J.L. All authors have read and agreed to the published version of the manuscript.
Funding
This research received no external funding.
Institutional Review Board Statement
Not applicable.
Informed Consent Statement
Not applicable.
Data Availability Statement
Urban land data are obtained from the Statistical Classification of the Second National Land Survey, Guangxi Construction Yearbook, Statistical Yearbook and Nanning Land Use Master Plan (2006–2020).
Conflicts of Interest
The authors declare no conflict of interest.
References
- Global Natural Hazards Assessment Report 2020. Available online: http://www.zaihai.cn/archive/616fb6c8770aaf399d0f4e82 (accessed on 1 October 2023).
- World Urbanization Prospects (2018 Revised Edition). Available online: https://www.un.org/development/desa/pd/sites/www.un.org.development.desa.pd/files/files/documents/2020/Jan/un_2018_wup_report.pdf (accessed on 1 October 2023).
- Huang, D.; Bai, L. Distribution Characteristics of Urban Waterlogging in Nanning and Application of its Monitoring and Early Warning System. J. Inst. Disaster Prev. 2019, 21, 84–89. [Google Scholar]
- Huang, Q.; Liu, T.; Zhou, T. Causes of waterlogging in Nanning District and countermeasures for prevention and control. Soil Water Conserv. China 2012, 45–46. [Google Scholar] [CrossRef]
- Pan, C. Discussion on urban hydrological effects and countermeasures of urban hydrology in Nanning. Guangxi Water Resour. Ce Hydropower Eng. 2014, 64–68. [Google Scholar] [CrossRef]
- Ye, C.; Zhang, Y.; Cheng, W.; Qin, J.; Jiang, Y. Analysis on urban pluvial floods and causes during rapid development in Beijing. China Flood Drought Manag. 2018, 28, 19–25. [Google Scholar] [CrossRef]
- Zhang, J.; Wang, X.; Hou, Y.; Cai, L. Study on the Impact of Urbanization on Waterlogging in Fuzhou. J. Catastrophol. 2018, 33, 146–151. [Google Scholar]
- Zhao, C.; Wan, J.; Zhang, Y.; Zhang, B. Review of the Characteristics, Causes and Governance of Urban Flood in China. J. Catastrophol. 2023, 38, 220–228. [Google Scholar]
- Chen, T.; Zhao, C.; Zhao, D.; Wang, Q.; Qiu, N. Research on the Prediction of Urban Waterlogging Risk Area Based on Binary Logistic. China Rural Water Hydropower 2022, 57–61. [Google Scholar]
- Chou, B. Connotation, Approach and Prospect of Sponge City (LID). Water Wastewater Eng. 2015, 51, 1–7. [Google Scholar] [CrossRef]
- Xin, R.; Zeng, J.; Li, K.; Wang, Q.; Ding, S. Identify key areas and priority levels of urban waterlogging regulation service supply and demand. Aata Ecol. Sin. 2022, 42, 500–512. [Google Scholar] [CrossRef]
- Yang, F.; Xu, J.; Lin, W. Cellular Automaton Simulation of the Effect of Low Impact Development on Urban Water-logging Reduction. J. Nat. Resour. 2017, 32, 1158–1169. [Google Scholar] [CrossRef]
- Liu, Y.; Liu, Y.; Zhen, J.; Cai, F.; Li, M.; Mu, J. Intelligent rapid prediction method of urban flooding based on BP neural network and numerical simulation model. J. Hydraul. Eng. 2022, 53, 284–295. [Google Scholar] [CrossRef]
- Wang, H.; Zhang, W.; Li, J.; Hou, J.; Cao, T.; Zhang, X. Research on evaluation method for pipeline network installation in sponge city. J. Xi’an Univ. Technol. 2020, 36, 182–187. [Google Scholar] [CrossRef]
- Xiang, G. A Strategic Study of Urban Drainage Planning and Management after Heavy Rainfall and Flooding—A Review of Introduction to Hydraulic Engineering. J. Irrig. Drain. 2022, 41, 153. [Google Scholar]
- Zang, J.; Guo, Q.; Sang, X.; Xie, T.; He, C. Coupling relationship between spatial-temporal variation of lakes and waterlogging in the coastal city Tianjin. J. Remote Sens. (Chin.) 2020, 24, 199–213. [Google Scholar] [CrossRef]
- Zhang, L.; Tang, Z.; Yu, L.; Sun, J.; Li, Y. Thoughts on the compilation of urban waterlogging prevention and control planning under high- quality development. Water Wastewater Eng. 2021, 57, 43–49. [Google Scholar] [CrossRef]
- Li, B.; Zhao, Y.; Fu, Y. Spatio-temporal Characteristics of Urban Storm Waterlogging in Guangzhou and the Impact of Urban Growth. J. Geo-Inf. Sci. 2015, 17, 445–450. [Google Scholar]
- Yu, Q. Influence of Impervious Surface Expansion on Surface Runoff in Guangzhou. Ph.D. Thesis, GuangZhou University, Guangzhou, China, 2018. [Google Scholar]
- Tong, J.; Zhang, H.; Liu, H.; Huang, J.; Hao, Y. XGBoost model-based risk assessment and influencing factors analysis of waterlogging in core cities of Yangtze River Delta. Water Resour. Hydropower Eng. 2021, 52, 1–11. [Google Scholar] [CrossRef]
- Xu, M.; Liu, S.; Sun, Y.; Yao, Y. Rapid Identification and Early Warning of Urban Waterlogging Risk Using Flooding Model. Geomat. Inf. Sci. Wuhan Univ. 2020, 45, 1185–1194. [Google Scholar] [CrossRef]
- Xu, T.; Wang, C.; Hong, M. Evaluation of the resilience of urban flooding in China based on gray box modeling. Urban Probl. 2015, 10, 2–11. [Google Scholar] [CrossRef]
- Liu, R. Remote Sensing Estimation and Spatiotemporal Evolution Analysis of Urban Surface Runoff in Xuzhou Based on Impervious Surface. Master’s Thesis, China University of Mining and Technology, Beijing, China, 2022. [Google Scholar]
- Yao, Z.; Meng, Q.; Sun, Z.; Liu, S.; Zhang, L. Temporal and spatial correlation between impervious surface and surfacerunoff: A case study of the main urban area of Hangzhou city. J. Remote Sens. 2020, 24, 182–198. [Google Scholar]
- Hao, J. Study on the Influence Actors of Runoff Reduction for Urban Mpermeable Underlying Surface under Simulated Rainfall Condition. Master’s Thesis, Chongqing University, Chongqing, China, 2012. [Google Scholar]
- Long, H. Research on the Mechanism and Measures for Prevention and Control of Heavy Rainfall and Flooding in Guangzhou Based on the Geographic Simulation Technique of Impervious Surface Density; Guangzhou Jiantong Surveying and Mapping Geographic Information Technology Co., Ltd.: Guangdong, China, 2020. [Google Scholar]
- Xu, Y.; Li, K.; Xie, Y.; Ling, H.; Qian, M.; Wang, X.; Lu, Y. Studies on the Influencing Factors and Multiple Regression Model of Urban Waterlogging Based on GIS—A Case of Shanghai, China. J. Fudan Univ. (Nat. Sci.) 2018, 57, 182–198. [Google Scholar] [CrossRef]
- Ding, S.; Wang, N.; Ni, L.; Zeng, J. Study on the Inundation Risk of Disaster Space in the Min Delta Urban Agglomeration based on sCS -CN and GIS Coupling Model. J. Catastrophology 2022, 37, 171–177. [Google Scholar]
- Liang, Z.; Zhao, Y.; Fu, Y. Optimization of spatial pattern of urban imperviousness based on the integration of SCS-CN hydrological model and the ant colony algorithm. J. Geo-Inf. Sci. 2017, 19, 1315–1326. [Google Scholar]
- Song, R.; Ren, M.; Liu, Q.; Li, Z.; Zhao, Y. Study on Seepage Characteristics and Excavation Stability of Loose Cohesive Slope ofEarth Rock Cofferdam under Different Dewatering Speed of Foundation Pit. Water Resour. Power 2021, 39, 5–8+73. [Google Scholar]
- Xu, N. Extraction of Impermeable Water Surface and Analysis of Surface Runoff Expansion in xiong’an New Area. Master’s Thesis, Liaoning Technical University, Fuxin, China, 2022. [Google Scholar]
- Sun, Y.; Xu, Y.; Gao, B.; Wang, Q.; Li, S. Influence of impervious surface expansion on flood peak under urbanization—Acase study of Qinhuai River in Nanjing. J. Lake Sci. 2021, 33, 1574–1583. [Google Scholar]
- Xu, H.; Du, L. Fast Extraction of Built-up Land Infommation from Remote Sensing Imagery. J. Geo-Inf. Sci. 2010, 12, 574–579. [Google Scholar]
- Freeze, R.A.; Harlan, R.L. Blueprint for a physically-based digital simulated hydrologic response mode. Hydro. Sci. Bull 1969, 9, 237–258. [Google Scholar] [CrossRef]
- Chen, Z.; Li, L.; Bakir, M. Application of improved TOPMODEL in rainstorm region. In Proceedings of the 2011 International Conference on Electrical and Control Engineering, ICECE 2011, Yichang, China, 16–18 September 2011. [Google Scholar] [CrossRef]
- Zheng, Z.P.B.; Li, Y.; Chen, H.; Zhou, S. Study on the impact of directly connected impervious area distribution on urban stormwater runoff process. J. Hydroelectr. Eng. 2022, 1–12. [Google Scholar]
- Sun, G.; Wang, X.; An, N.; Zhang, A. A method for large-scale and high-resolution impervious surface extraction based on multi-source remote sensing and deep learning. Acta Geod. Cartogr. Sin. 2023, 52, 272–282. [Google Scholar]
- Xu, C.; Bai, Y.; Tian, Y.; Liu, Y. Spatio-temporal Evolution Analysis of Impervious Surface in Putian City from 1988 to 2021 Based on UCI Index. Areal Res. Dev. 2023, 42, 174–180. [Google Scholar]
- Huang, X.; Liu, W.; Cao, R.; Han, Y. Effects of impervious surface expansion on precipitation characteristics in main urban area of Zhengzhou City. Water Resour. Prot. 2022, 38, 22–30. [Google Scholar]
- Shi, X.F.; Zhao, M.J.; Yang, Q.; Zhang, F.; Wu, Y.; Gao, C. Study on rainstorm waterlogging on urban community scale based on rainstorm scenario simulation. Hydro-Sci. Eng. 2021, 1, 26–35. [Google Scholar] [CrossRef]
- Zhang, Z.; Wen, J. Hazard Assessment of Rainstorm Waterloggingin Urban Communities Based on Scenario Simulation. China Popul. Resour. Environ. 2014, 24, 478–482. [Google Scholar]
- Rouse, J.W.; Haas, R.H.; Schell, J.A. Monito-ring Vegetation Systems in the Great Plains with ERTS. In Proceedings of the 3rd ERTS Symposium, Washington, DC, USA, 10–14 December 1973. [Google Scholar]
- Batty, M.; Longley, P.A. The fractal simulation of urban structure. Environ. Plan. A Econ. Space 1986, 18, 1143–1179. [Google Scholar] [CrossRef]
- Hou, Y.; Kuang, W.; Dou, Y. Analysis of urban expansion and fractal features in global 33 megacities from 2000–2020. Acta Geogr. Sin. 2022, 77, 2687–2702. [Google Scholar] [CrossRef]
- Frankhauser, P. The fractal approach:A new tool for the spatial analysis of urban agglomerations. Population 1998, 10, 205–240. [Google Scholar]
- Mandal, J.; Ghosh, N.; Mukhopadhyay, A. Urban Growth Dynamics and Changing Land-Use Land-Cover of Megacity Kolkata and Its Environs. J. Indian Soc. Remote Sens. 2019, 47, 1707–1725. [Google Scholar] [CrossRef]
- Li, Y.; Zhang, L.; Ye, S.; Qi, X. Improvement and application of two-dimensional fractal model of urban growth and morphology. J. Geo-Inf. Sci. 2020, 22, 2140–2151. [Google Scholar] [CrossRef]
- Chen, Y. Approaches to estimating fractal dimension and identifying fractals of urban form. Prog. Geogr. 2017, 36, 529–539. [Google Scholar] [CrossRef]
- Zhen, W.; Du, N.; Yang, Y.; Wang, X.; Xiong, Z. Multi-fractal characteristics of spatial structure of urban agglomeration in the middle reaches of the Yangtze River. Acta Geogr. Sin. 2022, 77, 947–959. [Google Scholar] [CrossRef]
- Xu, H. A New Remote Sensing Index for Fastly Extracting Impervious Surface Information. Geomat. Inf. Sci. Wuhan Univ. 2008, 33, 1150–1153+1211. [Google Scholar] [CrossRef]
- Jin, X.; Hao, Z.; Zhang, J. Research Evolution and Development Direction of Hydrological Models. Res. Soil Water Conserv. 2006, 13, 197–199+202. [Google Scholar]
- Zhou, Q.; Xu, X.; Su, J. Application of GIS Geometric Analysis for Identification of Flood-prone Areas and Construction of Surface Structure. China Water Wastewater 2018, 34, 114–117+123. [Google Scholar] [CrossRef]
- Wan, H.; Zhou, C.; Wan, Q.; Liu, S. Integration of Geographical Information System Technology and Hydrological Model. Adv. Water Sci. 2001, 12, 560–568. [Google Scholar]
- Chen, Y.; Huang, K. The fractal dimension of urban form: Theoretical approach and practical significance. J. Xinyang Teach. Coll. (Nat. Sci. Ed.) 2002, 15, 62–67. [Google Scholar]
- Liu, Y.; Chen, C. The Land Use Type in Fractal Theory for Yongchuan District of Chongqing. Sci. Technol. Eng. 2020, 20, 14004–14010. [Google Scholar]
- Xu, G.; Teng, P.; Lu, X. Analysis of causes and countermeasures of waterlogging in urban areas of Nanning. Hydrology 2009, 29, 53–55. [Google Scholar]
- Chen, R.; Chen, Q. Nanning urban waterlogging origin study. J. Guangxi Water Conserv. Hydropower 2009, 26–29. [Google Scholar] [CrossRef]
- Tong, J.; Gao, F.; Liu, H.; Huang, J.; Liu, G.; Zhang, H.; Duan, Q. A Study on Identification of Urban Waterlogging Risk Factors Based on Satellite Image Semantic Segmentation and XGBoost. Sustainability 2023, 15, 6434. [Google Scholar] [CrossRef]
- Kaushik, B.; Subhasish, D. Computational hydrodynamics based flow accumulation models to identify urban waterlogging at deltaic plain using GIS. Environ. Earth Sci. 2022, 81, 201. [Google Scholar] [CrossRef]
- Islam, M.R.; Abdullah, H.M.; Ahmed, Z.U.; Islam, I.; Ferdush, J.; Miah, M.G.; Miah, M.M.U. Monitoring the spatiotemporal dynamics of waterlogged area in southwestern Bangladesh using time series Landsat imagery. Remote Sens. Appl. Soc. Environ. 2018, 9, 52–59. [Google Scholar] [CrossRef]
- Kumar, D.N.; Shastry, A.; Raju, K. Delineation of flood-prone areas using modified topographic index for a river basin. H2Open J. 2020, 3, 58–68. [Google Scholar] [CrossRef]
- Zhang, Z.; Zeng, P.; Huang, Z.; Liu, J.; Yang, L. Multi-Source Data Fusion and Hydrodynamics for Urban Waterlogging Risk Identification. Int. J. Environ. Res. Public Health 2023, 20, 2528. [Google Scholar] [CrossRef] [PubMed]
- Huang, H.; Lei, X.; Liao, W.; Zuo, X.; Wang, H. A novel multi-strategy hydrological feature extraction (MHFE) method to improve urban waterlogging risk prediction, a case study of Fuzhou City in China. Sci. Total Environ. 2023, 904, 165834. [Google Scholar] [CrossRef]
- Ismail, A.-E.; Alban, K.; Lorenzo, P.; Martina, Z.; Abdelaziz, E.S. Mitigation of urban waterlogging from flash floods hazards in vulnerable watersheds. J. Hydrol. Reg. Stud. 2023, 47, 101429. [Google Scholar] [CrossRef]
- Xi, C.; Sakai, N. Urban waterlogging mitigation based on the concept of sponge city. IOP Conf. Ser. Earth Environ. Sci. 2023, 1144, 012010. [Google Scholar] [CrossRef]
- Li, J.; Zhang, H.; Zhang, X.; Wang, W. Establishment and Application of a Specialized Physical Examination Indicator System for Urban Waterlogging Risk in China. Sustainability 2023, 15, 4998. [Google Scholar] [CrossRef]
- Zhao, S.; Yue, B. Nature-based solutions: Establishing a comprehensive framework for addressing urban waterlogging management. Integr. Environ. Assess. Manag. 2023. [Google Scholar] [CrossRef]
- Clubb, F.J.; Mudd, S.M.; Milodowski, D.T.; Valters, D.A.; Slater, L.J.; Hurst, M.D.; Limaye, A.B. Geomorphometric delineation of floodplains and terraces from objectively defined topographic thresholds. Earth Surf. Dynam. 2017, 5, 369–385. [Google Scholar] [CrossRef]
- Sharma, S.K.; Kwak, Y.-J.; Kumar, R.; Sarma, B. Analysis of Hydrological Sensitivity for Flood Risk Assessment. ISPRS Int. J. Geo-Inf. 2018, 7, 51. [Google Scholar] [CrossRef]
- Li, Q.L.X.; Gong, Z.; Qin, Y.; Zhang, B. Spatial and Temporal Pattern and Cause of Waterlogging in the Central Urban Area of Lanzhou. Remote Sens. Technol. Appl. 2023, 38, 935–944. [Google Scholar]
- Naren, M.; Gong, L.; Zhang, H.; Chun, F.; Guo, E. Spatial and Temporal Distribution of Urban Waterlogging and its Case: A Case Study of Hohhot. J. Catastrophology 2022, 37, 107–111. [Google Scholar]
- Zhao, L.; Wei, J. Impact of urban development on the risk of flooding: A case study of Wuhan City, China. Prog. Geogr. 2020, 39, 1898–1908. [Google Scholar] [CrossRef]
- Pickett, S.T.A.; Cadenasso, M.L.; Grove, J.M. Resilient cities:meaning.models, and metaphor for integrating the ecological, socioeconomic, and planning realms. Landsc. Urban Plan. 2003, 69, 369–384. [Google Scholar] [CrossRef]
- Gong, Y.; Fu, H.; Zhang, S.; Li, J.; Zhang, A.; Chen, Y.; Yin, D.; Liu, H. Research on Public Participation in Sponge City Construction. China Water Wastewater 2018, 34, 1–5. [Google Scholar] [CrossRef]
- IAP2 Public Participation Spectrum. 14 January 2018. Available online: https://www.iap2.org/news/ (accessed on 6 October 2023).
- Liu, D. Study on strategy of sponge city construction in Fuzhou city. J. Ningde Norm. Univ. (Nat. Sci.) 2017, 29, 41–46. [Google Scholar]
- Ngo, T.T.; Jung, D.; Kim, J.H. Robust urban drainage system:development of a novel multiscenario-based design approach. J. Water Resour. Plan. Manag. 2019, 145, 04019027. [Google Scholar] [CrossRef]
- Gao, Y.; Yang, G.; Zhang, J. Study of Public Participation in Sponge Reconstruction of Old Residences Based on Social Network Analysis. China Water Wastewater 2021, 37, 17–24. [Google Scholar] [CrossRef]
- Greenlee, D.D. Raster and Vector Processing for Scanned Linework. Photogramm. Eng. Remote Sens. 1987, 53, 1383–1387. [Google Scholar]
- Fairchild, J.; Leymarie, P. Drainage networks from grid digital elevation models. Water Resour. Res. 1991, 27, 29–61. [Google Scholar]
- Zhang, L.W. Positioning, concept and strategy of China’s sponge city: Review and interpretation of document No.75 [2105] of State Counci. Water Wastewater Eng. 2021, 57, 1–8. [Google Scholar]
- Zhu, Z.W. Practical Exploration and Resilient Governance of Sponge Cities. People’s Trib. 2021, 57, 74–77. [Google Scholar] [CrossRef]
- Yang, Z.D.; Tang, H.; Qu, W.J. Research on Long-term Operation and Maintenance Management of Sponge City. China Water Wastewater 2021, 37, 23–30. [Google Scholar] [CrossRef]
- Li, S.P.; Liu, S.Q. Urban Drainage Systems; China Construction Industry Press: Beijing, China, 2016. [Google Scholar]

Disclaimer/Publisher’s Note: The statements, opinions and data contained in all publications are solely those of the individual author(s) and contributor(s) and not of MDPI and/or the editor(s). MDPI and/or the editor(s) disclaim responsibility for any injury to people or property resulting from any ideas, methods, instructions or products referred to in the content. |
© 2023 by the authors. Licensee MDPI, Basel, Switzerland. This article is an open access article distributed under the terms and conditions of the Creative Commons Attribution (CC BY) license (https://creativecommons.org/licenses/by/4.0/).