

Impact of Digitalization on Process Optimization and Decision-Making towards Sustainability: The Moderating Role of Environmental Regulation

 , and
, and
Abstract
:1. Introduction
1.1. Problem Statement
1.2. Research Objectives
- This study examines digitalization’s impact on process optimization and decision-making towards sustainable practices.
- This research seeks to clarify how digital solutions may improve process efficiency and decision-making and create an enhanced approach to sustainability and social responsibility.
1.3. Research Significance
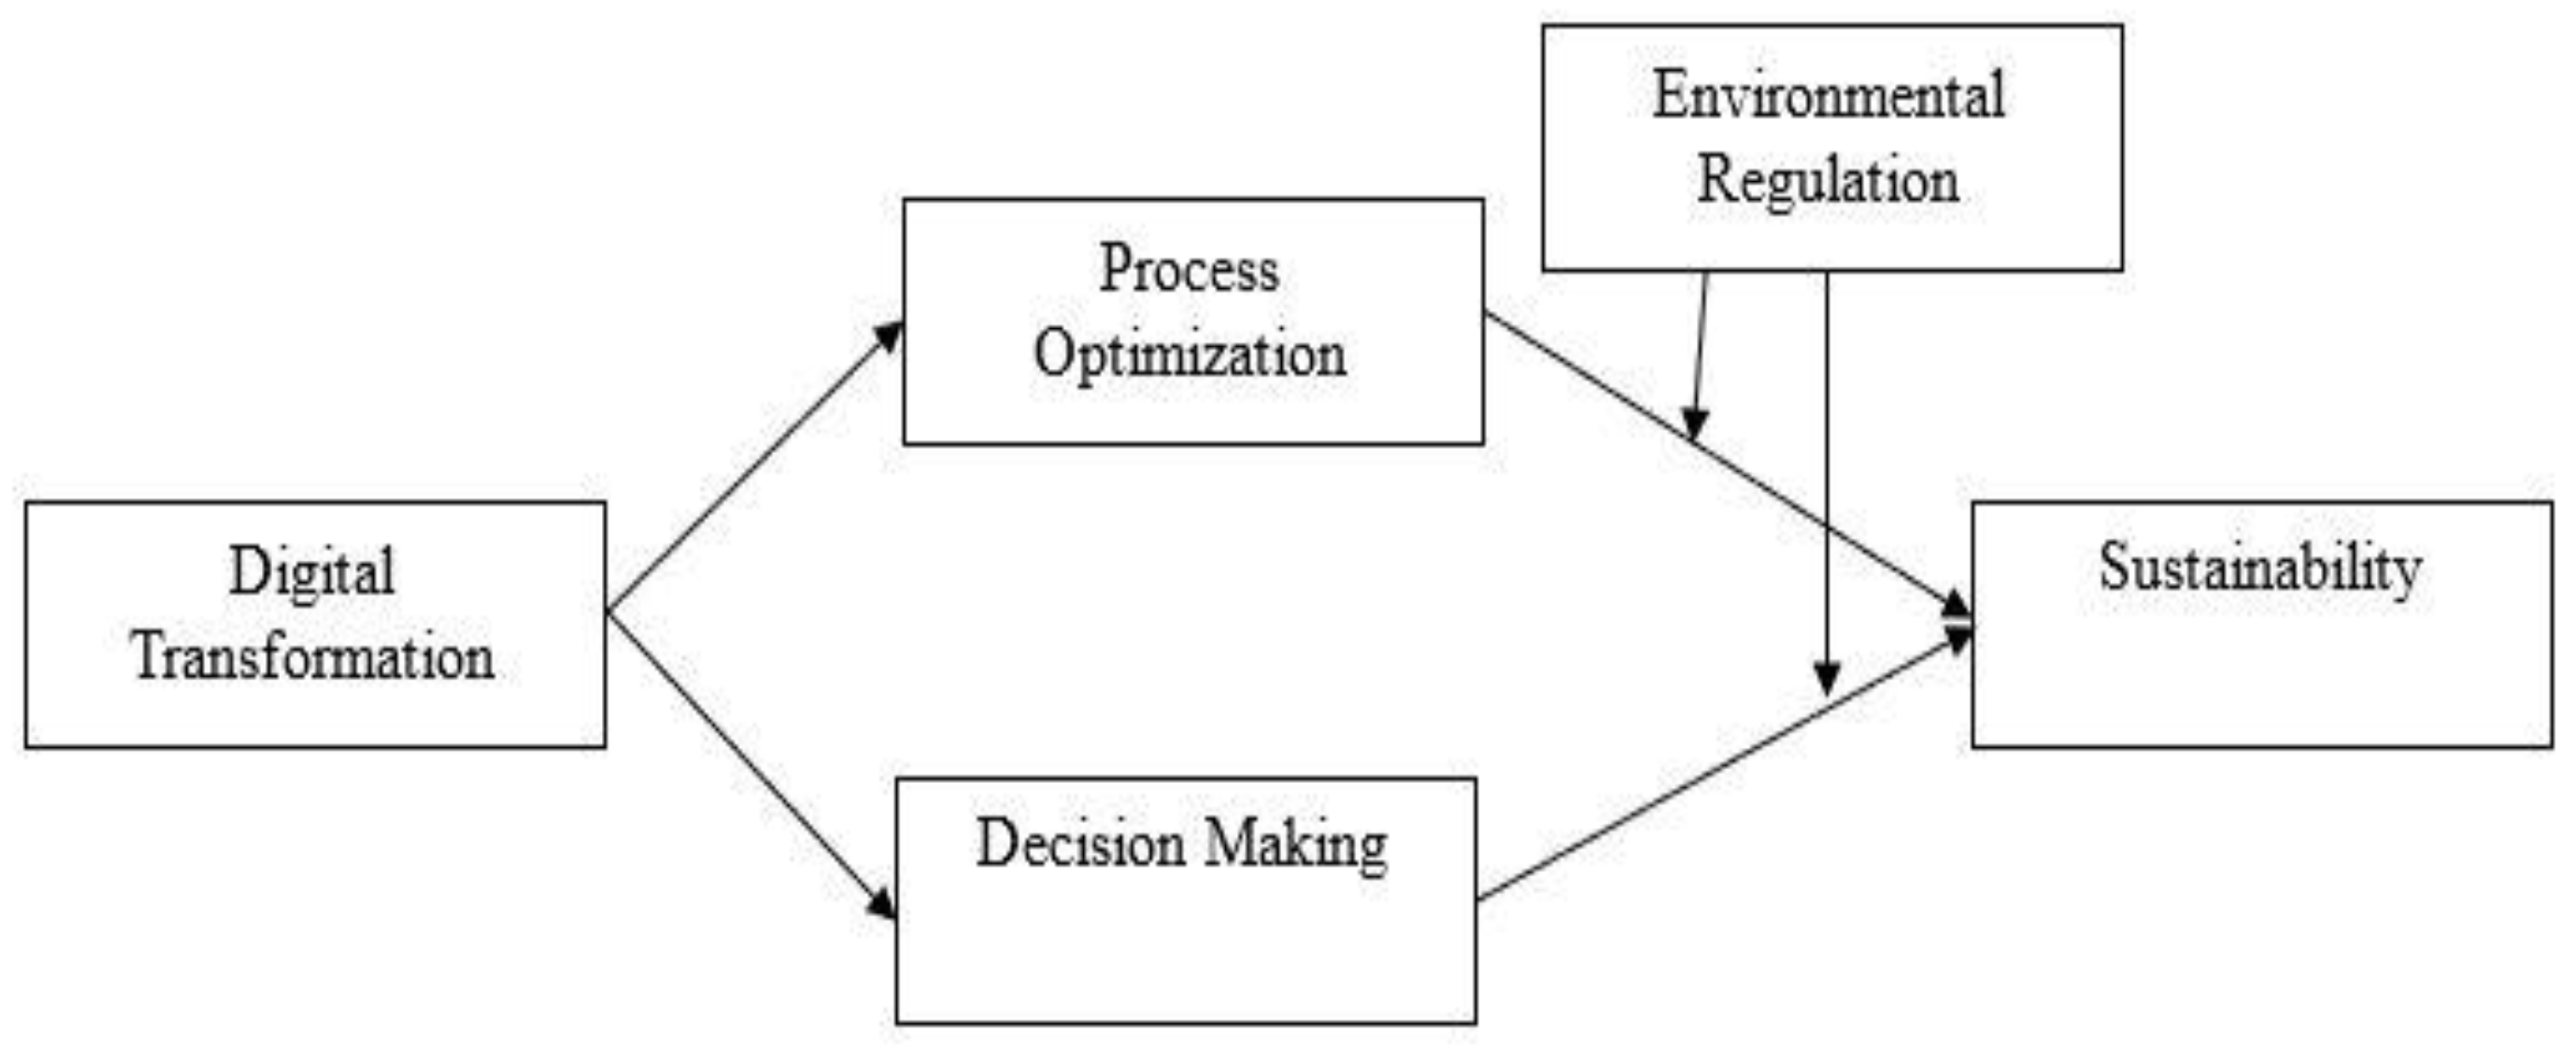
2. Development of Theoretical Framework
2.1. Theories
2.2. Digital Transformation of Manufacturing Industry
2.3. Digital Transformation and Process Optimization
2.4. Digital Transformation and Decision Making
2.5. Moderating the Role of Environmental Regulation on Process Optimization toward Sustainability
2.6. Moderating the Role of Environmental Regulation on Decision-Making towards Sustainability
2.7. Sustainability
2.8. Theoretical Mechanism, Framework
2.8.1. Digital Darwinism (DD)
2.8.2. Lean Manufacturing Theory (LMT)
2.8.3. Rational Choice Theory (RCT)
2.8.4. Sustainability Transition Theory (STT)
2.8.5. Theoretical Mechanism
2.9. Hypotheses
3. Materials and Methods
3.1. Research Design and Philosophy
3.2. Methods
3.3. Instrument
4. Results and Data Analysis
4.1. Demographic Statistics
4.2. Assessment of the Measurement Model
4.2.1. Reliability of the Scales
4.2.2. Convergent Validity of the Scales
4.2.3. Discriminant Validity of the Scales
4.3. Assessment of the Structural Model
4.3.1. Common Method Bias
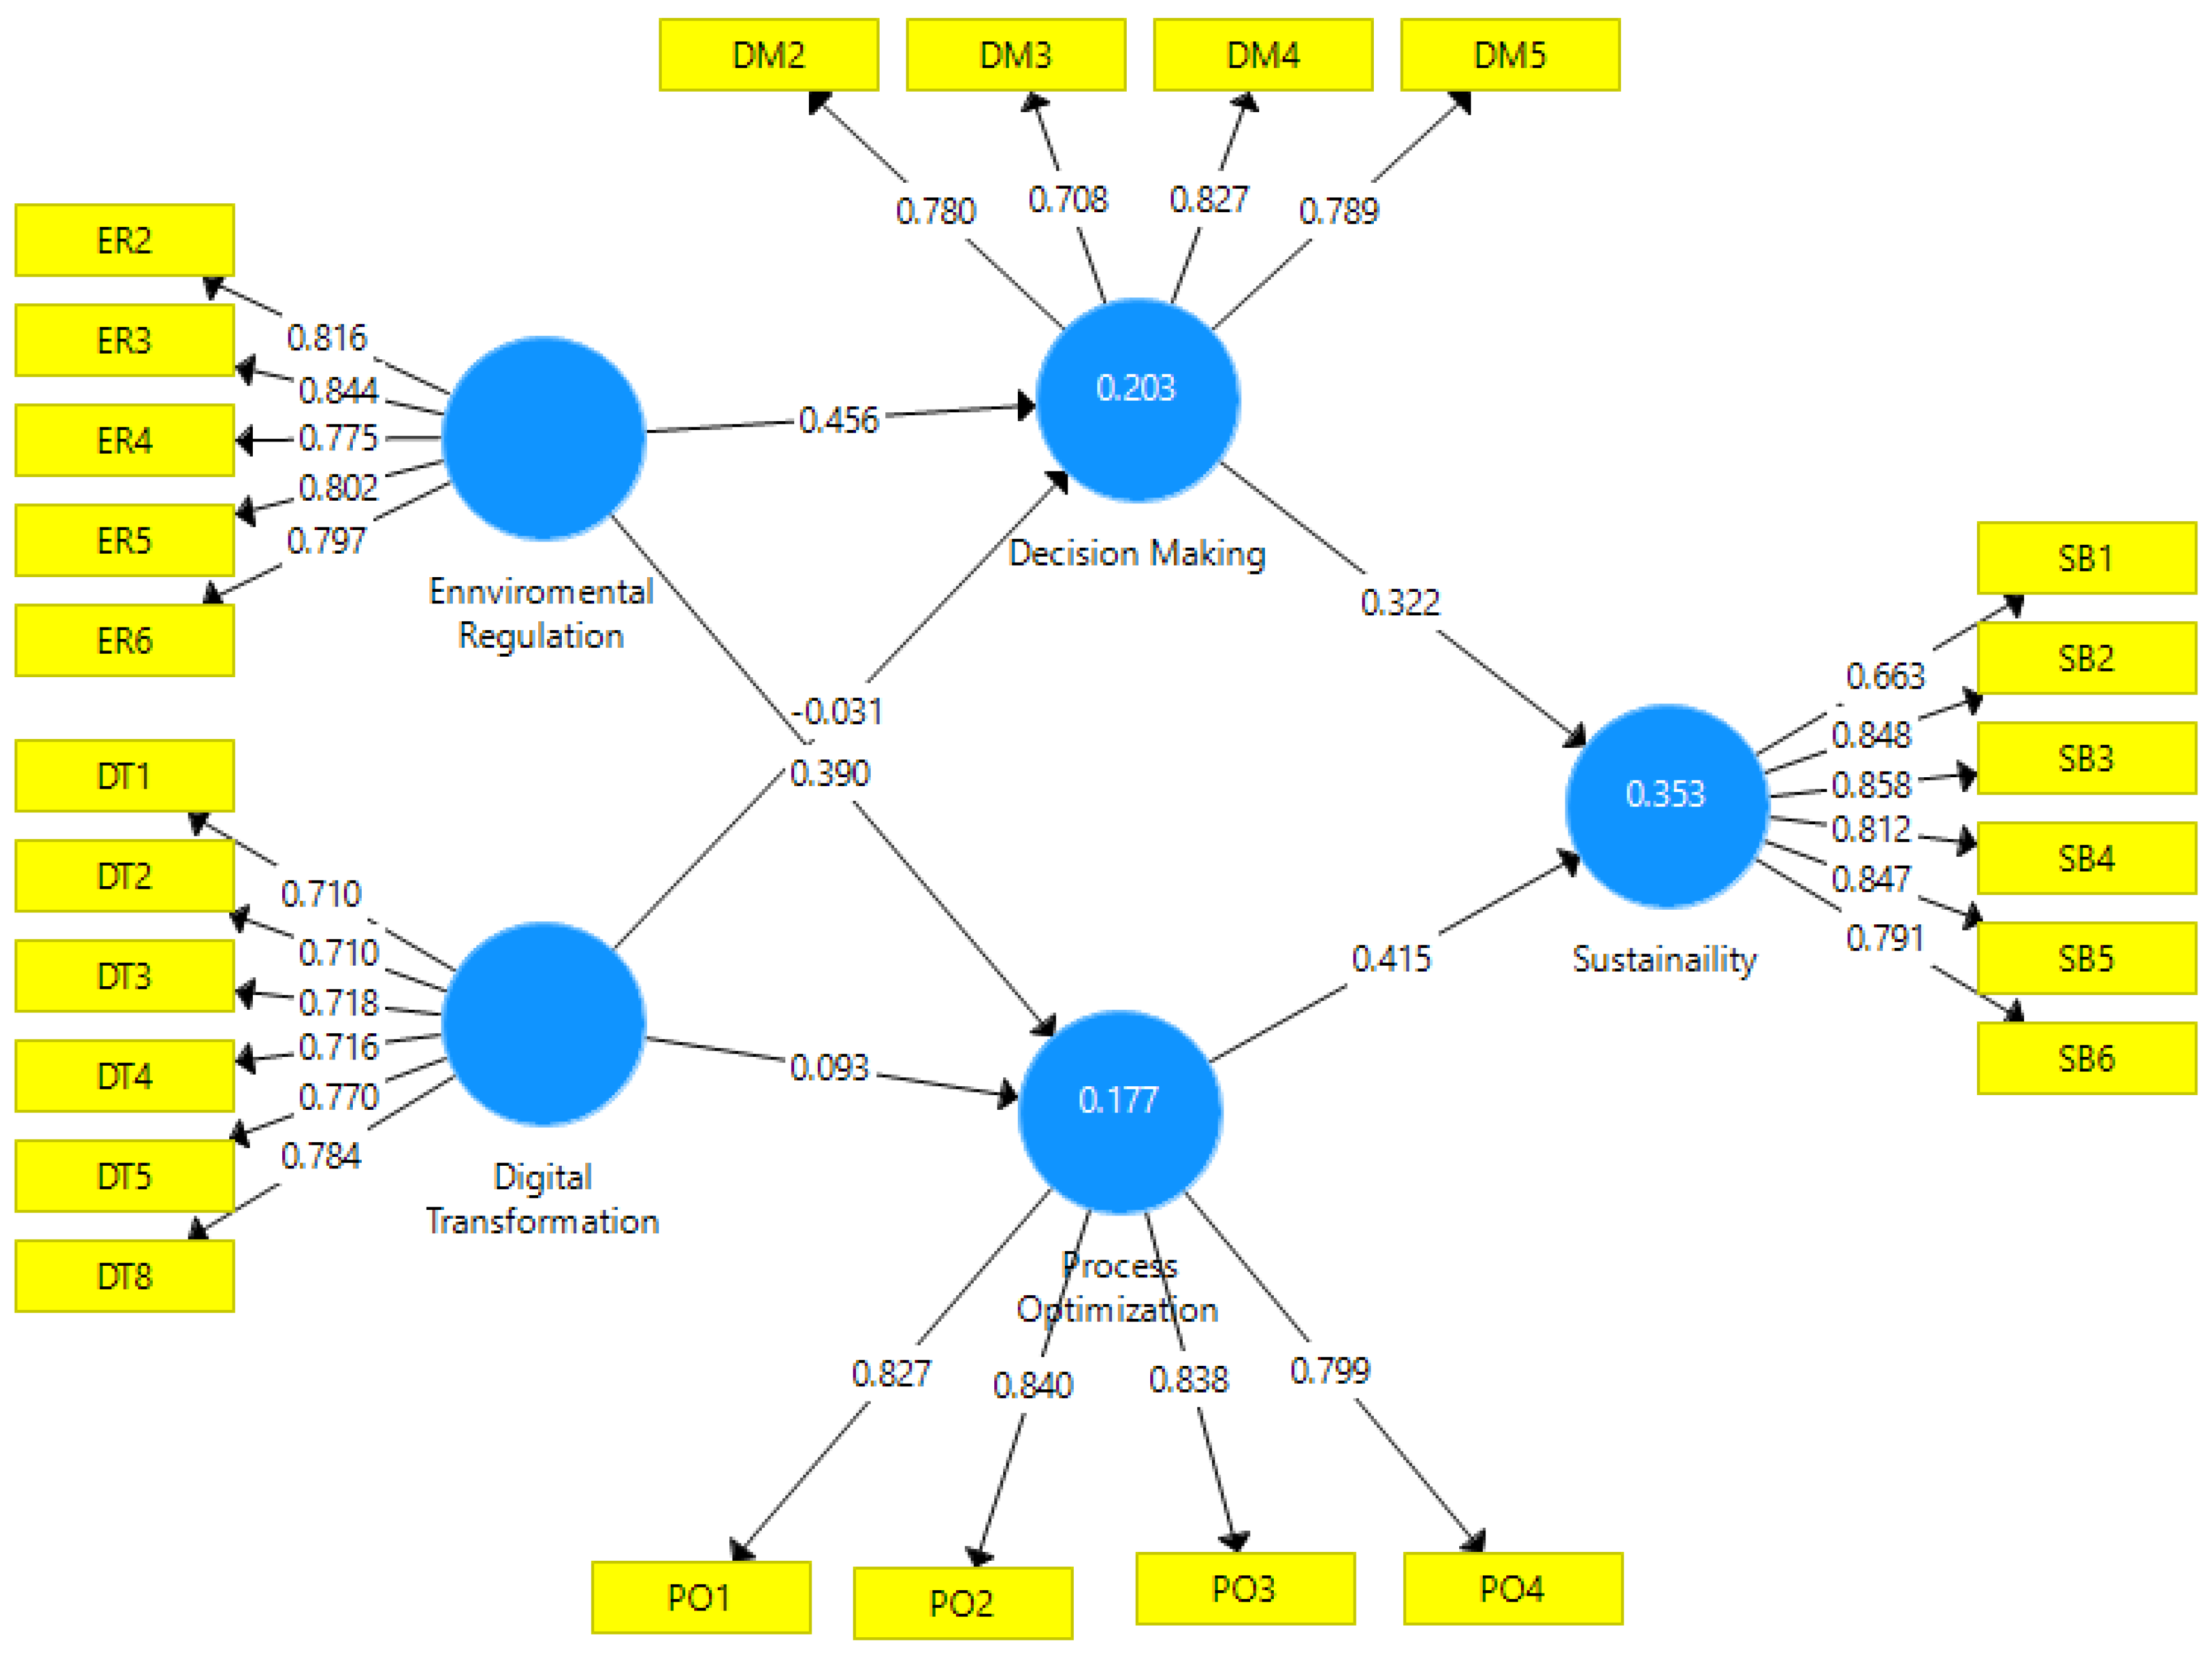
4.3.2. Structural Model
4.3.3. Model Fitness
4.3.4. Hypothesis Testing (Direct Relationships)
4.3.5. Hypothesis Testing (Moderating Relationships)
4.3.6. R Square
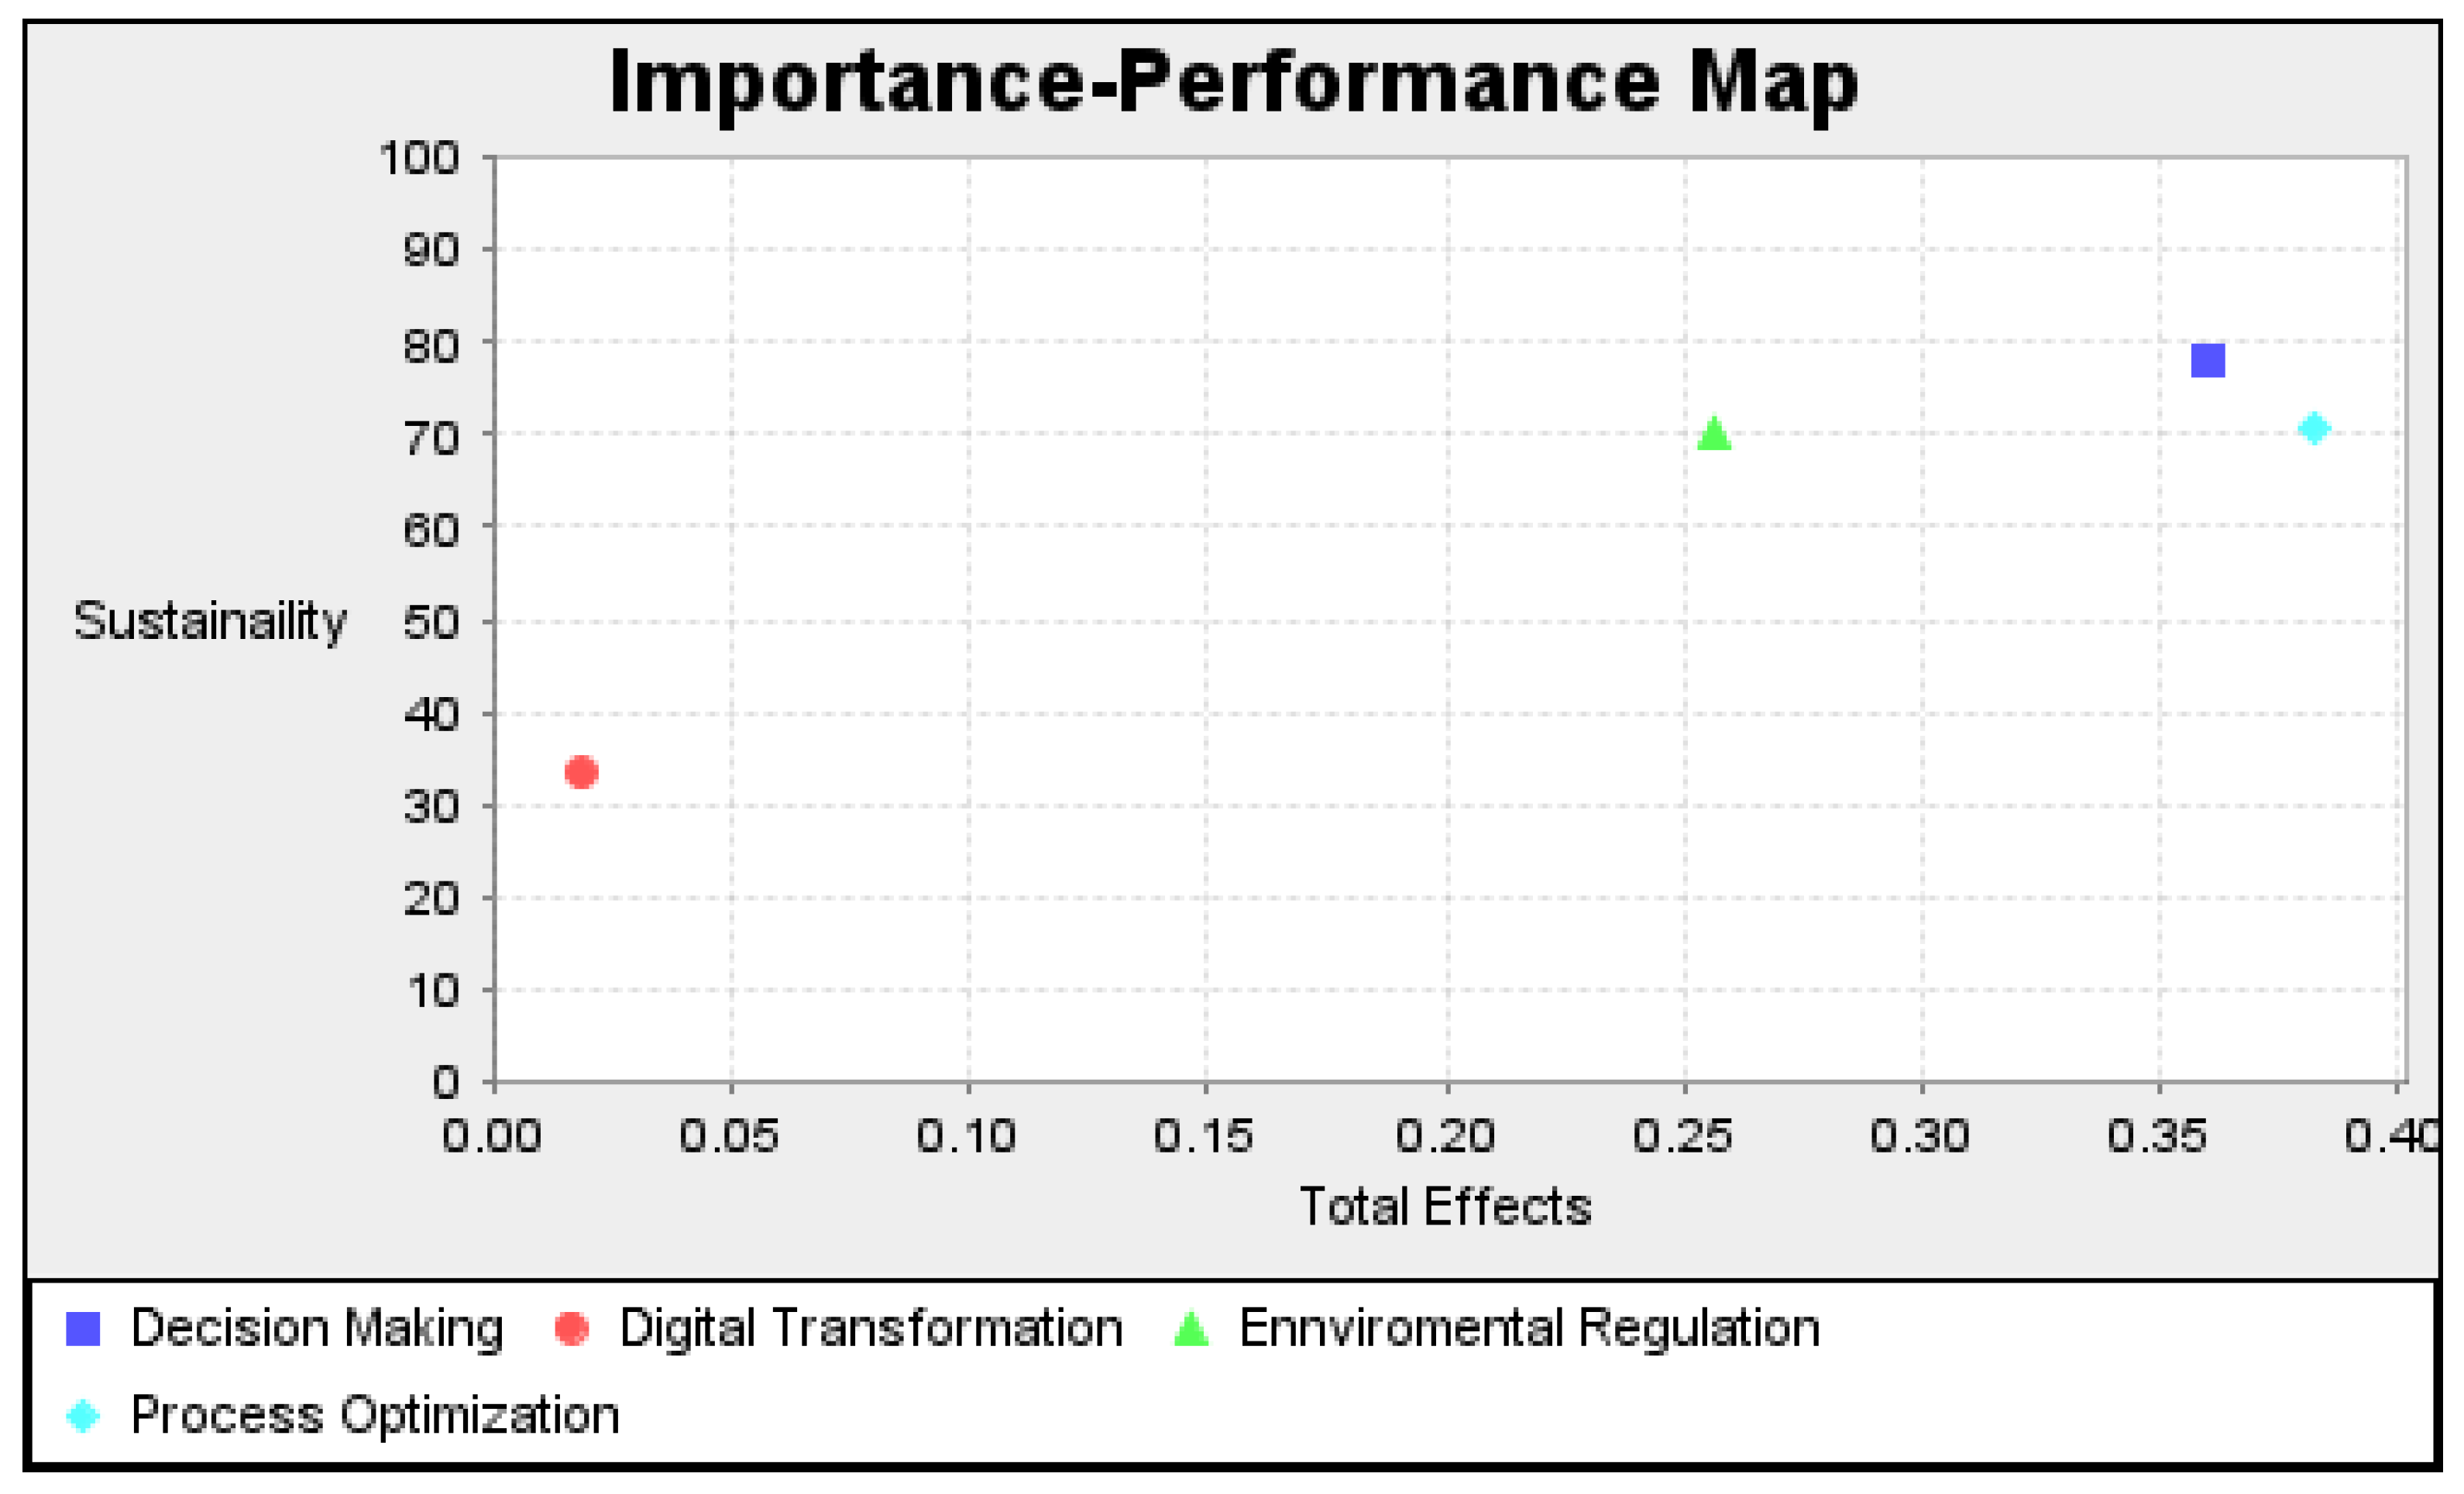
4.4. IPMA Analysis
4.5. Predictive Power of Accuracy
4.6. MGA Analysis
5. Discussion
5.1. Contribution to Sustainable Development Goals (SDGs)
- SDG9 states that investment in the infrastructure of the industry and its innovation is a significant driver to move that industry towards economic growth [138]. This study is based on the industry’s sustainable development and how digitalization will impact it. As we know, for the digital transformation of the industry, it is necessary that the industry be supportive of innovation, and its infrastructure must also be supportive of adopting digital technology. If the industry is going to upgrade into digital transformation, it must ensure its structure and infrastructure.
- SDG11 argues that half of the world’s population currently lives in cities. According to their estimation based on past data and future technology development, in 2050, this ratio will be upgraded, and it is estimated that two-thirds of the world’s population will move to cities and urban areas [139]. As we know, most industries are also located in the main cities of any country. Due to the rapid growth of cities due to mass migrations, cities must develop sustainable communities. So, the upgradation of the industry towards sustainable practices is also a part of developing a sustainable community in the industry, which will indirectly affect the sustainability of the city where the industry is located.
- SDG12 argues that to achieve sustainable development and an economically grown society, we must change how we produce and consume goods and resources [140]. This study will transform the entire industry process to digitalize it, leading the industry to a sustainable organization.
- SDG13 states that the planet’s climate has been drastically affected recently. According to them, since 1990, greenhouse gases, which are the key elements responsible for climate change, have increased by 50 percent [141]. This study will motivate industries to transform their total industry processes into green processes to reduce greenhouse gases and other negative environmental effects and make them sustainable organizations.
5.2. Conclusions
5.3. Implications
5.3.1. Theoretical Implications
5.3.2. Practical Implications
5.3.3. Policy Implications
5.4. Limitations and Potential Areas of Future Studies
Author Contributions
Funding
Institutional Review Board Statement
Informed Consent Statement
Data Availability Statement
Acknowledgments
Conflicts of Interest
References
- Khaskheli, M.B.; Wang, S.; Yan, X.; He, Y. Innovation of the Social Security, Legal Risks, Sustainable Management Practices and Employee Environmental Awareness in The China–Pakistan Economic Corridor. Sustainability 2023, 15, 1021. [Google Scholar] [CrossRef]
- Tseng, M.; Ha, H.M.; Tran, T.P.T.; Bui, T.; Chen, C.; Lin, C. Building a data-driven circular supply chain hierarchical structure: Resource recovery implementation drives circular business strategy. Bus. Strat. Environ. 2022, 31, 2082–2106. [Google Scholar] [CrossRef]
- Marda, V. Artificial intelligence policy in India: A framework for engaging the limits of data-driven decision-making. Philos. Trans. R. Soc. A Math. Phys. Eng. Sci. 2018, 376, 20180087. [Google Scholar] [CrossRef]
- Rogers, D.S.; Duraiappah, A.K.; Antons, D.C.; Munoz, P.; Bai, X.; Fragkias, M.; Gutscher, H. A vision for human well-being: Transition to social sustainability. Curr. Opin. Environ. Sustain. 2012, 4, 61–73. [Google Scholar] [CrossRef]
- Khan, S.A.R.; Yu, Z.; Farooq, K. Green capabilities, green purchasing, and triple bottom line performance: Leading toward environmental sustainability. Bus. Strat. Environ. 2023, 32, 2022–2034. [Google Scholar] [CrossRef]
- Chander, B.; Pal, S.; De, D.; Buyya, R. Artificial Intelligence-Based Internet of Things for Industry 5.0; Springer: Cham, Switzerland, 2022; pp. 3–45. [Google Scholar] [CrossRef]
- Kareska, P.K. Digital Agriculture as a Response to the Challenges in the Modern Agricultural Sector. SSRN Electron. J. 2023, 1–12. [Google Scholar] [CrossRef]
- Tajpour, M.; Hosseini, E.; Mohammadi, M.; Bahman-Zangi, B. The Effect of Knowledge Management on the Sustainability of Technology-Driven Businesses in Emerging Markets: The Mediating Role of Social Media. Sustainability 2022, 14, 8602. [Google Scholar] [CrossRef]
- Ageron, B.; Bentahar, O.; Gunasekaran, A. Digital supply chain: Challenges and future directions. Supply Chain Forum Int. J. 2020, 21, 133–138. [Google Scholar] [CrossRef]
- Amann, J.; Blasimme, A.; Vayena, E.; Frey, D.; Madai, V.I. Explainability for artificial intelligence in healthcare: A multidisciplinary perspective. BMC Med. Inform. Decis. Mak. 2020, 20, 310. [Google Scholar] [CrossRef]
- Alkaraan, F.; Elmarzouky, M.; Hussainey, K.; Venkatesh, V. Sustainable strategic investment decision-making practices in UK companies: The influence of governance mechanisms on synergy between industry 4.0 and circular economy. Technol. Forecast. Soc. Chang. 2023, 187, 122187. [Google Scholar] [CrossRef]
- D’amore, G.; Di Vaio, A.; Balsalobre-Lorente, D.; Boccia, F. Artificial Intelligence in the Water–Energy–Food Model: A Holistic Approach towards Sustainable Development Goals. Sustainability 2022, 14, 867. [Google Scholar] [CrossRef]
- Forradellas, R.F.R.; Gallastegui, L.M.G. Digital Transformation and Artificial Intelligence Applied to Business: Legal Regulations, Economic Impact and Perspective. Laws 2021, 10, 70. [Google Scholar] [CrossRef]
- Kumar, N.; Hasan, S.S.; Srivastava, K.; Akhtar, R.; Yadav, R.K.; Choubey, V.K. Lean manufacturing techniques and its implementation: A review. Mater. Today Proceeding 2022, 64, 1188–1192. [Google Scholar] [CrossRef]
- Askari, G.; Gordji, M.E.; Park, C. The behavioral model and game theory. Palgrave Commun. 2019, 5, 57. [Google Scholar] [CrossRef]
- Moritz, J.; McPartlin, M.; Tuomisto, H.L.; Ryynänen, T. A multi-level perspective of potential transition pathways towards cultured meat: Finnish and German political stakeholder perceptions. Res. Policy 2023, 52, 104866. [Google Scholar] [CrossRef]
- Dalzochio, J.; Kunst, R.; Pignaton, E.; Binotto, A.; Sanyal, S.; Favilla, J.; Barbosa, J. Machine learning and reasoning for predictive maintenance in Industry 4.0: Current status and challenges. Comput. Ind. 2020, 123, 103298. [Google Scholar] [CrossRef]
- Sima, V.; Gheorghe, I.G.; Subić, J.; Nancu, D. Influences of the Industry 4.0 Revolution on the Human Capital Development and Consumer Behavior: A Systematic Review. Sustainability 2020, 12, 4035. [Google Scholar] [CrossRef]
- Nakayama, R.S.; Spínola, M.d.M.; Silva, J.R. Towards I4.0: A comprehensive analysis of evolution from I3.0. Comput. Ind. Eng. 2020, 144, 106453. [Google Scholar] [CrossRef]
- Munirathinam, S. Industry 4.0: Industrial Internet of Things (IIOT). Adv. Comput. 2020, 117, 129–164. [Google Scholar] [CrossRef]
- Ayvaz, S.; Alpay, K. Predictive maintenance system for production lines in manufacturing: A machine learning approach using IoT data in real-time. Expert Syst. Appl. 2021, 173, 114598. [Google Scholar] [CrossRef]
- Brem, A.; Giones, F.; Werle, M. The AI Digital Revolution in Innovation: A Conceptual Framework of Artificial Intelligence Technologies for the Management of Innovation. IEEE Trans. Eng. Manag. 2023, 70, 770–776. [Google Scholar] [CrossRef]
- Javaid, M.; Haleem, A.; Singh, R.P.; Rab, S.; Suman, R. Exploring impact and features of machine vision for progressive industry 4.0 culture. Sens. Int. 2022, 3, 100132. [Google Scholar] [CrossRef]
- Feroz, A.K.; Zo, H.; Chiravuri, A. Digital Transformation and Environmental Sustainability: A Review and Research Agenda. Sustainability 2021, 13, 1530. [Google Scholar] [CrossRef]
- Javaid, M.; Haleem, A.; Singh, R.P.; Suman, R. Significance of Quality 4.0 towards comprehensive enhancement in manufacturing sector. Sens. Int. 2021, 2, 100109. [Google Scholar] [CrossRef]
- Mesa, D.; Renda, G.; Iii, R.G.; Kuys, B.; Cook, S.M. Implementing a Design Thinking Approach to De-Risk the Digitalisation of Manufacturing SMEs. Sustainability 2022, 14, 14358. [Google Scholar] [CrossRef]
- Melesse, T.Y.; Di Pasquale, V.; Riemma, S. Digital Twin models in industrial operations: State-of-the-art and future research directions. IET Collab. Intell. Manuf. 2021, 3, 37–47. [Google Scholar] [CrossRef]
- Bagale, G.S.; Vandadi, V.R.; Singh, D.; Sharma, D.K.; Garlapati, D.V.K.; Bommisetti, R.K.; Gupta, R.K.; Setsiawan, R.; Subramaniyaswamy, V.; Sengan, S. RETRACTED ARTICLE: Small and medium-sized enterprises’ contribution in digital technology. Ann. Oper. Res. 2023, 326, 3–4. [Google Scholar] [CrossRef]
- Choi, D.; R’bigui, H.; Cho, C. Candidate Digital Tasks Selection Methodology for Automation with Robotic Process Automation. Sustainability 2021, 13, 8980. [Google Scholar] [CrossRef]
- Mikalef, P.; Krogstie, J.; Pappas, I.O.; Pavlou, P. Exploring the relationship between big data analytics capability and competitive performance: The mediating roles of dynamic and operational capabilities. Inf. Manag. 2020, 57, 103169. [Google Scholar] [CrossRef]
- Sheng, J.; Amankwah-Amoah, J.; Khan, Z.; Wang, X. COVID-19 Pandemic in the New Era of Big Data Analytics: Methodological Innovations and Future Research Directions. Br. J. Manag. 2021, 32, 1164–1183. [Google Scholar] [CrossRef]
- Pan, Y.; Zhang, L. A BIM-data mining integrated digital twin framework for advanced project management. Autom. Constr. 2021, 124, 103564. [Google Scholar] [CrossRef]
- Jones, M.D.; Hutcheson, S.; Camba, J.D. Past, present, and future barriers to digital transformation in manufacturing: A review. J. Manuf. Syst. 2021, 60, 936–948. [Google Scholar] [CrossRef]
- Anand, G.; Ward, P.T.; Tatikonda, M.V.; Schilling, D.A. Dynamic capabilities through continuous improvement infrastructure. J. Oper. Manag. 2009, 27, 444–461. [Google Scholar] [CrossRef]
- Athaide, G. Seller-buyer interactions during the commercialization of technological process innovations. J. Prod. Innov. Manag. 1996, 13, 406–421. [Google Scholar] [CrossRef]
- Dąbrowska, J.; Almpanopoulou, A.; Brem, A.; Chesbrough, H.; Cucino, V.; Di Minin, A.; Giones, F.; Hakala, H.; Marullo, C.; Mention, A.; et al. Digital transformation, for better or worse: A critical multi-level research agenda. R&D Manag. 2022, 52, 930–954. [Google Scholar] [CrossRef]
- Sharma, A.; Kosasih, E.; Zhang, J.; Brintrup, A.; Calinescu, A. Digital Twins: State of the art theory and practice, challenges, and open research questions. J. Ind. Inf. Integr. 2022, 30, 100383. [Google Scholar] [CrossRef]
- Gupta, S.; Justy, T.; Kamboj, S.; Kumar, A.; Kristoffersen, E. Big data and firm marketing performance: Findings from knowledge-based view. Technol. Forecast. Soc. Chang. 2021, 171, 120986. [Google Scholar] [CrossRef]
- Prohorovs, A. Russia’s War in Ukraine: Consequences for European Countries’ Businesses and Economies. J. Risk Financ. Manag. 2022, 15, 295. [Google Scholar] [CrossRef]
- Li, C.; Chen, Y.; Shang, Y. A review of industrial big data for decision making in intelligent manufacturing. Eng. Sci. Technol. Int. J. 2022, 29, 101021. [Google Scholar] [CrossRef]
- Venkatram, K.; Geetha, M.A. Review on Big Data & Analytics—Concepts, Philosophy, Process and Applications. Cybern. Inf. Technol. 2017, 17, 3–27. [Google Scholar] [CrossRef]
- Power, D.J.; Sharda, R. Model-driven decision support systems: Concepts and research directions. Decis. Support Syst. 2007, 43, 1044–1061. [Google Scholar] [CrossRef]
- Roberson, Q.; Perry, J.L. Inclusive Leadership in Thought and Action: A Thematic Analysis. Group Organ. Manag. 2022, 47, 755–778. [Google Scholar] [CrossRef]
- Peimani, N.; Kamalipour, H. Online Education and the COVID-19 Outbreak: A Case Study of Online Teaching During Lockdown. Educ. Sci. 2021, 11, 72. [Google Scholar] [CrossRef]
- Maheshwari, P.; Kamble, S.; Kumar, S.; Belhadi, A.; Gupta, S. Digital twin-based warehouse management system: A theoretical toolbox for future research and applications. Int. J. Logist. Manag. 2023. ahead-of-print. [Google Scholar] [CrossRef]
- Latifi, M.-A.; Nikou, S.; Bouwman, H. Business model innovation and firm performance: Exploring causal mechanisms in SMEs. Technovation 2021, 107, 102274. [Google Scholar] [CrossRef]
- Hassani, H.; Silva, E.S. The Role of ChatGPT in Data Science: How AI-Assisted Conversational Interfaces Are Revolutionizing the Field. Big Data Cogn. Comput. 2023, 7, 62. [Google Scholar] [CrossRef]
- Modgil, S.; Gupta, S.; Sivarajah, U.; Bhushan, B. Big data-enabled large-scale group decision making for circular economy: An emerging market context. Technol. Forecast. Soc. Chang. 2021, 166, 120607. [Google Scholar] [CrossRef]
- Moslehpour, M.; Chau, K.Y.; Tu, Y.-T.; Nguyen, K.-L.; Barry, M.; Reddy, K.D. Impact of corporate sustainable practices, government initiative, technology usage, and organizational culture on automobile industry sustainable performance. Environ. Sci. Pollut. Res. 2022, 29, 83907–83920. [Google Scholar] [CrossRef] [PubMed]
- Ni, L.; Ahmad, S.F.; Alshammari, T.O.; Liang, H.; Alsanie, G.; Irshad, M.; Alyafi-AlZahri, R.; BinSaeed, R.H.; Al-Abyadh, M.H.A.; Abu Bakir, S.M.M.; et al. The role of environmental regulation and green human capital towards sustainable development: The mediating role of green innovation and industry upgradation. J. Clean. Prod. 2023, 421, 138497. [Google Scholar] [CrossRef]
- Yu, Z.; Khan, S.A.R.; Umar, M. Circular economy practices and industry 4.0 technologies: A strategic move of automobile industry. Bus. Strat. Environ. 2022, 31, 796–809. [Google Scholar] [CrossRef]
- Shankar, A.V.; Quinn, A.K.; Dickinson, K.L.; Williams, K.N.; Masera, O.; Charron, D.; Jack, D.; Hyman, J.; Pillarisetti, A.; Bailis, R.; et al. Everybody stacks: Lessons from household energy case studies to inform design principles for clean energy transitions. Energy Policy 2020, 141, 111468. [Google Scholar] [CrossRef] [PubMed]
- Radhakrishnan, S. Sustainable Development Goal: Sustainable Management and Use of Natural Resources in Textile and Apparel Industry. In Sustainable Approaches in Textiles and Fashion: Circular Economy and Microplastic Pollution; Springer: Singapore, 2022; pp. 165–205. [Google Scholar] [CrossRef]
- Zhou, G.; Gu, Y.; Wu, Y.; Gong, Y.; Mu, X.; Han, H.; Chang, T. A systematic review of the deposit-refund system for beverage packaging: Operating mode, key parameter and development trend. J. Clean. Prod. 2020, 251, 119660. [Google Scholar] [CrossRef]
- Arcia, M.A.D.; Vargas, D. Status of Waste Solid Management Implementation in Three Cities under the Manila Bay Rehabilitation Project. SSRN Electron. J. 2022. [Google Scholar] [CrossRef]
- Saban, M.; Dagan, E.; Drach-Zahavy, A. The Effects of a Novel Mindfulness-based Intervention on Nurses’ State Mindfulness and Patient Satisfaction in the Emergency Department. J. Emerg. Nurs. 2021, 47, 412–425. [Google Scholar] [CrossRef]
- Kouhizadeh, M.; Zhu, Q.; Sarkis, J. Blockchain and the circular economy: Potential tensions and critical reflections from practice. Prod. Plan. Control. 2020, 31, 950–966. [Google Scholar] [CrossRef]
- Almagtome, A.; Khaghaany, M.; Önce, S. Corporate Governance Quality, Stakeholders’ Pressure, and Sustainable Development: An Integrated Approach. Int. J. Math. Eng. Manag. Sci. 2020, 5, 1077–1090. [Google Scholar] [CrossRef]
- Guan, M.; Jennings, F.J.; Villanueva, I.I.; Jackson, D.B. Delineating Antecedents and Outcomes of Information Seeking Upon Exposure to an Environmental Video Opposing Single-Use Plastics. Environ. Commun. 2022, 16, 563–575. [Google Scholar] [CrossRef]
- Udeagha, M.C.; Ngepah, N. The drivers of environmental sustainability in BRICS economies: Do green finance and fintech matter? World Dev. Sustain. 2023, 3, 100096. [Google Scholar] [CrossRef]
- Song, M.; Wang, S.; Zhang, H. Could environmental regulation and R&D tax incentives affect green product innovation? J. Clean. Prod. 2020, 258, 120849. [Google Scholar] [CrossRef]
- Christini, G.; Fetsko, M.; Hendrickson, C. Environmental Management Systems and ISO 14001 Certification for Construction Firms. J. Constr. Eng. Manag. 2004, 130, 330–336. [Google Scholar] [CrossRef]
- Whiteman, G.; Walker, B.; Perego, P. Planetary Boundaries: Ecological Foundations for Corporate Sustainability. J. Manag. Stud. 2013, 50, 307–336. [Google Scholar] [CrossRef]
- Adomokai, R.; Sheate, W.R. Community participation and environmental decision-making in the Niger Delta. Environ. Impact Assess. Rev. 2004, 24, 495–518. [Google Scholar] [CrossRef]
- Norberg-Bohm, V. Stimulating ‘green’ technological innovation: An analysis of alternative policy mechanisms. Policy Sci. 1999, 32, 13–38. [Google Scholar] [CrossRef]
- Sousa-Zomer, T.T.; Magalhães, L.; Zancul, E.; Campos, L.M.; Cauchick-Miguel, P.A. Cleaner production as an antecedent for circular economy paradigm shift at the micro-level: Evidence from a home appliance manufacturer. J. Clean. Prod. 2018, 185, 740–748. [Google Scholar] [CrossRef]
- Bartlett, E.; Howard, N. Informing the decision makers on the cost and value of green building. Build. Res. Inf. 2000, 28, 315–324. [Google Scholar] [CrossRef]
- Brinkerhoff, D.W. Exploring State–Civil Society Collaboration: Policy Partnerships in Developing Countries. Nonprofit Volunt. Sect. Q. 1999, 28, 59–86. [Google Scholar] [CrossRef]
- Hobson, K. Competing Discourses of Sustainable Consumption: Does the ’Rationalisation of Lifestyles’ Make Sense? Environ. Politics 2002, 11, 95–120. [Google Scholar] [CrossRef]
- Kovač, A.; Paranos, M.; Marciuš, D. Hydrogen in energy transition: A review. Int. J. Hydrog. Energy 2021, 46, 10016–10035. [Google Scholar] [CrossRef]
- Pezzey, J.C.; Toman, M.A. The Economics of Sustainability; Taylor & Francis Ltd.: London, UK, 2017; ISBN 9781315240084. [Google Scholar]
- Dincer, I. Environmental impacts of energy. Energy Policy 1999, 27, 845–854. [Google Scholar] [CrossRef]
- Darnall, N.; Henriques, I.; Sadorsky, P. Adopting Proactive Environmental Strategy: The Influence of Stakeholders and Firm Size. J. Manag. Stud. 2010, 47, 1072–1094. [Google Scholar] [CrossRef]
- Sadiq, M.; Nonthapot, S.; Mohamad, S.; Keong, O.C.; Ehsanullah, S.; Iqbal, N. Does green finance matter for sustainable entrepreneurship and environmental corporate social responsibility during COVID-19? China Finance Rev. Int. 2022, 12, 317–333. [Google Scholar] [CrossRef]
- Fazey, I.; Schäpke, N.; Caniglia, G.; Hodgson, A.; Kendrick, I.; Lyon, C.; Page, G.; Patterson, J.; Riedy, C.; Strasser, T.; et al. Transforming knowledge systems for life on Earth: Visions of future systems and how to get there. Energy Res. Soc. Sci. 2020, 70, 101724. [Google Scholar] [CrossRef]
- Khan, I.; Zakari, A.; Zhang, J.; Dagar, V.; Singh, S. A study of trilemma energy balance, clean energy transitions, and economic expansion in the midst of environmental sustainability: New insights from three trilemma leadership. Energy 2022, 248, 123619. [Google Scholar] [CrossRef]
- Aldianto, L.; Anggadwita, G.; Permatasari, A.; Mirzanti, I.R.; Williamson, I.O. Toward a Business Resilience Framework for Startups. Sustainability 2021, 13, 3132. [Google Scholar] [CrossRef]
- Nikolaou, I.E.; Jones, N.; Stefanakis, A. Circular economy and sustainability: The past, the present and the future directions. Circ. Econ. Sustain. 2021, 1, 1–20. [Google Scholar] [CrossRef]
- Fuerst, S.; Sanchez-Dominguez, O.; Rodriguez-Montes, M.A. The Role of Digital Technology within the Business Model of Sustainable Entrepreneurship. Sustainability 2023, 15, 10923. [Google Scholar] [CrossRef]
- Alzoubi, H.M.; Alshurideh, M.T.; Al Kurdi, B.; Alhyasat, K.M.; Ghazal, T.M. The effect of e-payment and online shopping on sales growth: Evidence from banking industry. Int. J. Data Netw. Sci. 2022, 6, 1369–1380. [Google Scholar] [CrossRef]
- Lima, L.; Trindade, E.; Alencar, L.; Alencar, M.; Silva, L. Sustainability in the construction industry: A systematic review of the literature. J. Clean. Prod. 2021, 289, 125730. [Google Scholar] [CrossRef]
- Feng, Y.; Audy, J.-F. Forestry 4.0: A framework for the forest supply chain toward Industry 4.0. Gestão Produção 2020, 27, e5677. [Google Scholar] [CrossRef]
- Tseng, M.-L.; Bui, T.-D.; Lim, M.K.; Lewi, S. A Cause and Effect Model for Digital Sustainable Supply Chain Competitiveness under Uncertainties: Enhancing Digital Platform. Sustainability 2021, 13, 10150. [Google Scholar] [CrossRef]
- Hofstetter, J.S.; De Marchi, V.; Sarkis, J.; Govindan, K.; Klassen, R.; Ometto, A.R.; Spraul, K.S.; Bocken, N.; Ashton, W.S.; Sharma, S.; et al. From Sustainable Global Value Chains to Circular Economy—Different Silos, Different Perspectives, but Many Opportunities to Build Bridges. Circ. Econ. Sustain. 2021, 1, 21–47. [Google Scholar] [CrossRef] [PubMed]
- ElMaraghy, H.; Monostori, L.; Schuh, G.; ElMaraghy, W. Evolution and future of manufacturing systems. CIRP Ann. 2021, 70, 635–658. [Google Scholar] [CrossRef]
- Kitchin, R. The real-time city? Big data and smart urbanism. GeoJournal 2014, 79, 1–14. [Google Scholar] [CrossRef]
- Deshmukh, M.; Gangele, A.; Gope, D.K.; Dewangan, S. Study and implementation of lean manufacturing strategies: A literature review. Mater. Today Proc. 2022, 62, 1489–1495. [Google Scholar] [CrossRef]
- Majeed, A.; Zhang, Y.; Ren, S.; Lv, J.; Peng, T.; Waqar, S.; Yin, E. A big data-driven framework for sustainable and smart additive manufacturing. Robot. Comput. Manuf. 2021, 67, 102026. [Google Scholar] [CrossRef]
- Herfeld, C. Revisiting the criticisms of rational choice theories. Philos. Compass 2022, 17, e12774. [Google Scholar] [CrossRef]
- Miceli, A.; Hagen, B.; Riccardi, M.P.; Sotti, F.; Settembre-Blundo, D. Thriving, Not Just Surviving in Changing Times: How Sustainability, Agility and Digitalization Intertwine with Organizational Resilience. Sustainability 2021, 13, 2052. [Google Scholar] [CrossRef]
- Kuzemko, C.; Lockwood, M.; Mitchell, C.; Hoggett, R. Governing for sustainable energy system change: Politics, contexts and contingency. Energy Res. Soc. Sci. 2016, 12, 96–105. [Google Scholar] [CrossRef]
- Cardinali, P.G.; De Giovanni, P. Responsible digitalization through digital technologies and green practices. Corp. Soc. Responsib. Environ. Manag. 2022, 29, 984–995. [Google Scholar] [CrossRef]
- Bresciani, S.; Huarng, K.-H.; Malhotra, A.; Ferraris, A. Digital transformation as a springboard for product, process and business model innovation. J. Bus. Res. 2021, 128, 204–210. [Google Scholar] [CrossRef]
- Ghobakhloo, M.; Fathi, M. Corporate survival in Industry 4.0 era: The enabling role of lean-digitized manufacturing. J. Manuf. Technol. Manag. 2019, 31, 1–30. [Google Scholar] [CrossRef]
- Orsini, L.S.; Berger, M.; Crown, W.; Daniel, G.; Eichler, H.-G.; Goettsch, W.; Graff, J.; Guerino, J.; Jonsson, P.; Lederer, N.M.; et al. Improving Transparency to Build Trust in Real-World Secondary Data Studies for Hypothesis Testing—Why, What, and How: Recommendations and a Road Map from the Real-World Evidence Transparency Initiative. Value Health 2020, 23, 1128–1136. [Google Scholar] [CrossRef]
- Makri, C.; Neely, A. Grounded Theory: A Guide for Exploratory Studies in Management Research. Int. J. Qual. Methods 2021, 20, 1–14. [Google Scholar] [CrossRef]
- Oboh, C. Determinants of Fraud Tendency Among Future Accountants Using a Scenario-Based Questionnaire to Collect Sensitivity Data; SAGE Publications: Thousand Oaks, CA, USA, 2023. [Google Scholar]
- Tavakol, M.; Sandars, J. Quantitative and qualitative methods in medical education research: AMEE Guide No 90: Part I. Med. Teach. 2014, 36, 746–756. [Google Scholar] [CrossRef] [PubMed]
- Feng, H.; Wang, F.; Song, G.; Liu, L. Digital Transformation on Enterprise Green Innovation: Effect and Transmission Mechanism. Int. J. Environ. Res. Public Health 2022, 19, 10614. [Google Scholar] [CrossRef] [PubMed]
- Chen, Y.-S.; Lai, S.-B.; Wen, C.-T. The Influence of Green Innovation Performance on Corporate Advantage in Taiwan. J. Bus. Ethics 2006, 67, 331–339. [Google Scholar] [CrossRef]
- McRae, B.M. Technology and Organizational Decision-Making: A Qualitative Case Study Approach. Ph.D. Thesis, Walden University, Minneapolis, MN, USA, 2019. [Google Scholar]
- Kasim, A. Managerial attitudes towards environmental management among small and medium hotels in Kuala Lumpur. J. Sustain. Tour. 2009, 17, 709–725. [Google Scholar] [CrossRef]
- Sardana, D.; Gupta, N.; Kumar, V.; Terziovski, M. CSR ‘sustainability’ practices and firm performance in an emerging economy. J. Clean. Prod. 2020, 258, 120766. [Google Scholar] [CrossRef]
- Heale, R.; Twycross, A. Validity and reliability in quantitative studies. Evid. Based Nurs. 2015, 18, 66–67. [Google Scholar] [CrossRef] [PubMed]
- Koufteros, X.A. Testing a model of pull production: A paradigm for manufacturing research using structural equation modeling. J. Oper. Manag. 1999, 17, 467–488. [Google Scholar] [CrossRef]
- Taber, K.S. The Use of Cronbach’s Alpha When Developing and Reporting Research Instruments in Science Education. Res. Sci. Educ. 2018, 48, 1273–1296. [Google Scholar] [CrossRef]
- Lewis, B.R.; Templeton, G.F.; Byrd, T.A. A methodology for construct development in MIS research. Eur. J. Inf. Syst. 2005, 14, 388–400. [Google Scholar] [CrossRef]
- Yusoff, A.S.M.; Peng, F.S.; Razak, F.Z.A.; Mustafa, W.A. Discriminant Validity Assessment of Religious Teacher Acceptance: The Use of HTMT Criterion. J. Phys. Conf. Ser. 2020, 1529. [Google Scholar] [CrossRef]
- Henseler, J.; Ringle, C.M.; Sarstedt, M. A new criterion for assessing discriminant validity in variance-based structural equation modeling. J. Acad. Mark. Sci. 2015, 43, 115–135. [Google Scholar] [CrossRef]
- Voorhees, C.M.; Brady, M.K.; Calantone, R.; Ramirez, E. Discriminant validity testing in marketing: An analysis, causes for concern, and proposed remedies. J. Acad. Mark. Sci. 2016, 44, 119–134. [Google Scholar] [CrossRef]
- Henseler, J. Partial Least Squares Path Modeling. In Advanced Methods for Modeling Markets; Springer: Cham, Switzerland, 2017; pp. 361–381. [Google Scholar] [CrossRef]
- Franke, G.; Sarstedt, M. Heuristics versus statistics in discriminant validity testing: A comparison of four procedures. Internet Res. 2019, 29, 430–447. [Google Scholar] [CrossRef]
- Ab Hamid, M.; Sami, W.; Sidek, M.M. Discriminant validity assessment: Use of Fornell & Larcker criterion versus HTMT criterion. J. Phys. Conf. Ser. 2017, 890, 012163. [Google Scholar]
- Al Shbail, M.O.; Alshurafat, H.; Ananzeh, H.; O Bani-Khalid, T. The moderating effect of job satisfaction on the relationship between human capital dimensions and internal audit effectiveness. Cogent Bus. Manag. 2022, 9, 2115731. [Google Scholar] [CrossRef]
- Chang, S.-J.; van Witteloostuijn, A.; Eden, L. Common Method Variance in International Business Research. In Research Methods in International Business; Palgrave Macmillan: Cham, Switzerland, 2020; pp. 385–398. [Google Scholar] [CrossRef]
- Vo-Thanh, T.; Vu, T.-V.; Nguyen, N.P.; Van Nguyen, D.; Zaman, M.; Chi, H. COVID-19, frontline hotel employees’ perceived job insecurity and emotional exhaustion: Does trade union support matter? J. Sustain. Tour. 2022, 30, 1159–1176. [Google Scholar] [CrossRef]
- Schreiber, J.B. Key processes and popular analyses in the SEM family of techniques. In Contemporary Research Methods in Pharmacy and Health Services; Elsevier: Amsterdam, The Netherlands, 2022; pp. 601–616. [Google Scholar] [CrossRef]
- Parab, N.; Reddy, Y.V. A cause and effect relationship between FIIs, DIIs and stock market returns in India: Pre- and post-demonetization analysis. Futur. Bus. J. 2020, 6, 1–10. [Google Scholar] [CrossRef]
- Hirschauer, N.; Grüner, S.; Mußhoff, O. The p-Value and Statistical Significance Testing. In Fundamentals of Statistical Inference: What is the Meaning of Random Error? Springer: Cham, Switzerland, 2022; pp. 63–96. [Google Scholar] [CrossRef]
- Burton, A.L. OLS (Linear) Regression. In The Encyclopedia of Research Methods in Criminology and Criminal Justice; Wiley: Hoboken, NJ, USA, 2021; pp. 509–514. [Google Scholar] [CrossRef]
- Yapp, E.H.; Yeap, J.A. Assessing the determinants of customer-perceived value and customer satisfaction in e-hailing services: An Importance-Performance Matrix Analysis (IPMA) Approach. Cogent Bus. Manag. 2023, 10, 2191808. [Google Scholar] [CrossRef]
- Chin, W.; Cheah, J.-H.; Liu, Y.; Ting, H.; Lim, X.-J.; Cham, T.H. Demystifying the role of causal-predictive modeling using partial least squares structural equation modeling in information systems research. Ind. Manag. Data Syst. 2020, 120, 2161–2209. [Google Scholar] [CrossRef]
- Sürücü, L.; Maslakçi, A. Validity and reliability in quantitative research. Bus. Manag. Stud. Int. J. 2020, 8, 2694–2726. [Google Scholar] [CrossRef]
- Winton, B.G.; Sabol, M.A. A multi-group analysis of convenience samples: Free, cheap, friendly, and fancy sources. Int. J. Soc. Res. Methodol. 2022, 25, 861–876. [Google Scholar] [CrossRef]
- Karnik, N.; Bora, U.; Bhadri, K.; Kadambi, P.; Dhatrak, P. A comprehensive study on current and future trends towards the characteristics and enablers of industry 4.0. J. Ind. Inf. Integr. 2022, 27, 100294. [Google Scholar] [CrossRef]
- Arey, D.; Le, C.H.; Gao, J. Lean industry 4.0: A digital value stream approach to process improvement. Procedia Manuf. 2021, 54, 19–24. [Google Scholar] [CrossRef]
- Stahl, G.K.; Maznevski, M.L. Unraveling the effects of cultural diversity in teams: A retrospective of research on multicultural work groups and an agenda for future research. J. Int. Bus. Stud. 2021, 52, 4–22. [Google Scholar] [CrossRef]
- Kou, L.; Tao, Y.; Kwan, M.-P.; Chai, Y. Understanding the relationships among individual-based momentary measured noise, perceived noise, and psychological stress: A geographic ecological momentary assessment (GEMA) approach. Health Place 2020, 64, 102285. [Google Scholar] [CrossRef]
- Javaid, M.; Haleem, A.; Singh, R.P.; Suman, R.; Gonzalez, E.S. Understanding the adoption of Industry 4.0 technologies in improving environmental sustainability. Sustain. Oper. Comput. 2022, 3, 203–217. [Google Scholar] [CrossRef]
- Amjad, M.S.; Rafique, M.Z.; Khan, M.A. Leveraging Optimized and Cleaner Production through Industry 4.0. Sustain. Prod. Consum. 2021, 26, 859–871. [Google Scholar] [CrossRef]
- Mergel, I.; Edelmann, N.; Haug, N. Defining digital transformation: Results from expert interviews. Gov. Inf. Q. 2019, 36, 101385. [Google Scholar] [CrossRef]
- Kunkel, S.; Matthess, M. Digital transformation and environmental sustainability in industry: Putting expectations in Asian and African policies into perspective. Environ. Sci. Policy 2020, 112, 318–329. [Google Scholar] [CrossRef]
- Miller, D. The structural and environmental correlates of business strategy. Strat. Manag. J. 1987, 8, 55–76. [Google Scholar] [CrossRef]
- Barr-Pulliam, D.; Brown-Liburd, H.L.; Munoko, I. The effects of person-specific, task, and environmental factors on digital transformation and innovation in auditing: A review of the literature. J. Int. Financ. Manag. Account. 2022, 33, 337–374. [Google Scholar] [CrossRef]
- Cheng, C.; Ahmad, S.F.; Irshad, M.; Alsanie, G.; Khan, Y.; Ahmad, A.Y.A.B.; Aleemi, A.R. Impact of Green Process Innovation and Productivity on Sustainability: The Moderating Role of Environmental Awareness. Sustainability 2023, 15, 12945. [Google Scholar] [CrossRef]
- Li, Z.; Huang, Z.; Su, Y. New media environment, environmental regulation and corporate green technology innovation: Evidence from China. Energy Econ. 2023, 119, 106545. [Google Scholar] [CrossRef]
- Yusuf, N.; Lytras, M.D. Competitive Sustainability of Saudi Companies through Digitalization and the Circular Carbon Economy Model: A Bold Contribution to the Vision 2030 Agenda in Saudi Arabia. Sustainability 2023, 15, 2616. [Google Scholar] [CrossRef]
- Nag, A. Industrial infrastructure development of cottage industries for inclusive economic growth in a sustainable manner: Case study of the urban growth centre in Bishnupur, West Bengal, India. Int. J. Indian Cult. Bus. Manag. 2022, 26, 204. [Google Scholar] [CrossRef]
- Derdouri, A.; Wang, R.; Murayama, Y.; Osaragi, T. Understanding the Links between LULC Changes and SUHI in Cities: Insights from Two-Decadal Studies (2001–2020). Remote Sens. 2021, 13, 3654. [Google Scholar] [CrossRef]
- Bengtsson, M.; Alfredsson, E.; Cohen, M.; Lorek, S.; Schroeder, P. Transforming systems of consumption and production for achieving the sustainable development goals: Moving beyond efficiency. Sustain. Sci. 2018, 13, 1533–1547. [Google Scholar] [CrossRef]
- Thapa, P.; Mainali, B.; Dhakal, S. Focus on Climate Action: What Level of Synergy and Trade-Off Is There between SDG 13; Climate Action and Other SDGs in Nepal? Energies 2023, 16, 566. [Google Scholar] [CrossRef]

| Construct | Items |
|---|---|
| Digital Transformation [99] | The Internet service is available all the time. |
| The cost of the internet connection is reasonable for my household. | |
| The Internet enables me to accomplish my tasks more quickly. | |
| The Internet helps me find new opportunities (e.g., employment, education, and business). | |
| The Internet helps me learn and develop new skills and knowledge. | |
| The Internet has had a positive impact on my work performance. | |
| Internet use has become an everyday part of my life. | |
| The Internet helps me connect with community, social, or sporting groups. | |
| Process Optimization [100] | The company’s manufacturing process effectively reduces the emission of hazardous substances or waste. |
| The manufacturing process of the company recycles waste and emissions that allow them to be treated and re-used. | |
| The manufacturing process of the company reduces the consumption of water, electricity, coal, or oil. | |
| The manufacturing process of the company reduces the use of raw materials. | |
| Decision Making [101] | How easy or difficult was the process of trying to find an answer? |
| I believe there is a good match between my decision and the decision to support technology. | |
| I believe the decision support technology is not well suited for my decision. | |
| I believe there is an excellent fit between my decision and the decision support technology. | |
| I believe there is a mismatch between my decision and the decision to support technology. | |
| Environmental Regulation [102] | The government provides easy-to-understand information on environmental issues. |
| The government provides information on environmental issues in languages spoken by significant population segments. | |
| Regulations on environmental issues are published on time. | |
| Local environmental issues and regulations are published on time. | |
| Environmental administrative proceedings at the local level are conducted without unreasonable delay. | |
| Environmental regulations are sufficiently stable to permit the public to ascertain what conducts are permitted and prohibited. | |
| Sustainability [103] | We actively monitor water usage in our facilities. |
| We actively monitor energy usage in our facilities. | |
| We implement a systematic approach to setting environmental targets. | |
| We implement a systematic approach to achieving environmental targets. | |
| We actively monitor water usage in our facilities. | |
| We actively monitor energy usage in our facilities. |
| Gender | Frequency | Percentage |
| Male | 392 | 70.8% |
| Female | 162 | 29.2% |
| Total | 554 | 100.0% |
| Age Group | Frequency | Percentage |
| 20 to 30 Years | 233 | 42% |
| 31 to 40 Years | 134 | 24% |
| 41 to 50 Years | 120 | 22% |
| 51 and Above Years | 67 | 12% |
| Total | 554 | 100% |
| Industry Experience | Frequency | Percentage |
| Less than 1 Year | 68 | 12% |
| 1 Year to 5 Years | 255 | 46% |
| 5 to 10 Years | 123 | 22% |
| More than 10 Years | 108 | 19% |
| Total | 554 | 100% |
| Construct | Items | Outer Loadings | Cronbach Alpha | Composite Reliability |
|---|---|---|---|---|
| Decision Making | DM2 | 0.780 | 0.781 | 0.859 |
| DM3 | 0.708 | |||
| DM4 | 0.827 | |||
| DM5 | 0.789 | |||
| Digital Transformation | DT1 | 0.710 | 0.833 | 0.876 |
| DT2 | 0.710 | |||
| DT3 | 0.718 | |||
| DT4 | 0.716 | |||
| DT5 | 0.770 | |||
| DT8 | 0.784 | |||
| Environmental Regulation | ER2 | 0.816 | 0.866 | 0.903 |
| ER3 | 0.844 | |||
| ER4 | 0.775 | |||
| ER5 | 0.802 | |||
| ER6 | 0.797 | |||
| Process Optimization | PO1 | 0.827 | 0.845 | 0.896 |
| PO2 | 0.840 | |||
| PO3 | 0.838 | |||
| PO4 | 0.799 | |||
| Sustainability | SB1 | 0.663 | 0.891 | 0.917 |
| SB2 | 0.848 | |||
| SB3 | 0.858 | |||
| SB4 | 0.812 | |||
| SB5 | 0.847 | |||
| SB6 | 0.791 |
| Construct | AVE |
|---|---|
| Decision Making | 0.604 |
| Digital Transformation | 0.540 |
| Environmental Regulation | 0.651 |
| Process Optimization | 0.683 |
| Sustainability | 0.650 |
| DM | DT | ER | PO | SB | |
|---|---|---|---|---|---|
| Decision Making | 0.777 | ||||
| Digital Transformation | 0.075 | 0.735 | |||
| Environmental Regulation | 0.449 | 0.232 | 0.807 | ||
| Process Optimization | 0.286 | 0.183 | 0.411 | 0.826 | |
| Sustainability | 0.441 | 0.301 | 0.464 | 0.508 | 0.806 |
| DM | DT | ER | PO | |
|---|---|---|---|---|
| Digital Transformation | 0.127 | |||
| Environmental Regulation | 0.535 | 0.263 | ||
| Process Optimization | 0.349 | 0.204 | 0.477 | |
| Sustainability | 0.522 | 0.341 | 0.516 | 0.574 |
| Items | VIF |
|---|---|
| DM2 | 1.569 |
| DM3 | 1.387 |
| DM4 | 1.848 |
| DM5 | 1.811 |
| DT1 | 1.490 |
| DT2 | 1.593 |
| DT3 | 1.703 |
| DT4 | 1.740 |
| DT5 | 1.776 |
| DT8 | 1.583 |
| ER2 | 2.305 |
| ER3 | 2.607 |
| ER4 | 1.690 |
| ER5 | 1.983 |
| ER6 | 1.792 |
| PO1 | 1.928 |
| PO2 | 2.053 |
| PO3 | 1.961 |
| PO4 | 1.742 |
| SB1 | 1.465 |
| SB2 | 2.573 |
| SB3 | 2.848 |
| SB4 | 2.406 |
| SB5 | 2.836 |
| SB6 | 2.124 |
| Saturated Model | Estimated Model | |
|---|---|---|
| SRMR | 0.064 | 0.081 |
| d_ULS | 1.337 | 2.115 |
| d_G | 0.454 | 0.479 |
| Chi-Square | 1705.312 | 1737.511 |
| NFI | 0.796 | 0.792 |
| Hypothesis | β | T Statistics | p Values | Results |
|---|---|---|---|---|
| H1. Digital Transformation → Process Optimization | 0.093 | 2.621 | 0.005 | Supported |
| H2. Digital Transformation → Decision Making | 0.150 | 7.174 | 0.000 | Supported |
| H3. Process Optimization → Sustainability | 0.415 | 9.803 | 0.000 | Supported |
| H4. Decision Making → Sustainability | 0.322 | 10.252 | 0.000 | Supported |
| Hypothesis | β | T Statistics | p Values | Results |
|---|---|---|---|---|
| H5. ER x PO → Sustainability | 0.183 | 6.112 | 0.000 | Supported |
| H6. ER x DM → Suatainability | 0.130 | 2.778 | 0.003 | Supported |
| R Square | R Square Adjusted | |
|---|---|---|
| Sustainability | 0.353 | 0.351 |
| Sustainability | Importance | Performances |
|---|---|---|
| Decision Making | 0.360 | 78.152 |
| Digital Transformation | 0.018 | 33.399 |
| Environmental Regulation | 0.256 | 70.442 |
| Process Optimization | 0.382 | 70.838 |
| SSO | SSE | Q2 (=1 − SSE/SSO) | |
|---|---|---|---|
| Decision Making | 2600 | 2264.67 | 0.129 |
| Digital Transformation | 3900 | 3900 | |
| ER/DT/DM | 650 | 650 | |
| ER/DT/PO | 650 | 650 | |
| Environmental Regulation | 3250 | 3250 | |
| Process Optimization | 2600 | 2292.24 | 0.118 |
| Sustainability | 3900 | 3040.86 | 0.22 |
| Relationships | β-Diff (Male-Female) | p-Value |
|---|---|---|
| Decision Making → Sustainability | −0.111 | 0.06 |
| Digital Transformation → Decision Making | −0.044 | 0.354 |
| Digital Transformation → Process Optimization | 0.081 | 0.173 |
| ER/DT/DM → Decision Making | −0.16 | 0.093 |
| ER/DT/PO → Process Optimization | 0.058 | 0.281 |
| Process Optimization → Sustainability | 0.064 | 0.242 |
Disclaimer/Publisher’s Note: The statements, opinions and data contained in all publications are solely those of the individual author(s) and contributor(s) and not of MDPI and/or the editor(s). MDPI and/or the editor(s) disclaim responsibility for any injury to people or property resulting from any ideas, methods, instructions or products referred to in the content. |
© 2023 by the authors. Licensee MDPI, Basel, Switzerland. This article is an open access article distributed under the terms and conditions of the Creative Commons Attribution (CC BY) license (https://creativecommons.org/licenses/by/4.0/).
Share and Cite
Peng, Y.; Ahmad, S.F.; Irshad, M.; Al-Razgan, M.; Ali, Y.A.; Awwad, E.M. Impact of Digitalization on Process Optimization and Decision-Making towards Sustainability: The Moderating Role of Environmental Regulation. Sustainability 2023, 15, 15156. https://doi.org/10.3390/su152015156
Peng Y, Ahmad SF, Irshad M, Al-Razgan M, Ali YA, Awwad EM. Impact of Digitalization on Process Optimization and Decision-Making towards Sustainability: The Moderating Role of Environmental Regulation. Sustainability. 2023; 15(20):15156. https://doi.org/10.3390/su152015156
Chicago/Turabian StylePeng, Yixuan, Sayed Fayaz Ahmad, Muhammad Irshad, Muna Al-Razgan, Yasser A. Ali, and Emad Marous Awwad. 2023. "Impact of Digitalization on Process Optimization and Decision-Making towards Sustainability: The Moderating Role of Environmental Regulation" Sustainability 15, no. 20: 15156. https://doi.org/10.3390/su152015156
APA StylePeng, Y., Ahmad, S. F., Irshad, M., Al-Razgan, M., Ali, Y. A., & Awwad, E. M. (2023). Impact of Digitalization on Process Optimization and Decision-Making towards Sustainability: The Moderating Role of Environmental Regulation. Sustainability, 15(20), 15156. https://doi.org/10.3390/su152015156