Article

Load-Bearing Capacity of an Oxisol under Burned and Mechanized Harvest Sugarcane Crops

by
Fernando Silva Araújo
1,†,
Zigomar Menezes de Souza
2,
Gustavo Soares Souza
3,
Reginaldo Barboza da Silva
4,
Diego Alexander Aguilera Esteban
2,* and
Rose Luiza Moraes Tavares
5
1
Campus Prof. Alexandre Alves de Oliveira, State University of Piauí (UESPI), Parnaiba 64202-262, Brazil
2
School of Agricultural Engineering, University of Campinas (UNICAMP), Campinas 13083-875, Brazil
3
Espírito Santo Federal Institute of Education, Science and Technology (IFES), Campus Itapina, Itapina 29717-000, Brazil
4
Faculty of Agricultural Sciences of Vale do Ribeira, State University of São Paulo (UNESP), Campus Registro, Registro 11900-000, Brazil
5
Campus Rio Verde, University of Rio Verde (UNIRV), Rio Verde 75901-970, Brazil
*
Author to whom correspondence should be addressed.
Part of a Doctoral thesis presented by the first author to the Postgraduate Program in Agricultural Engineering at the State University of Campinas.
Sustainability 2023, 15(21), 15185; https://doi.org/10.3390/su152115185
Submission received: 6 June 2023 / Revised: 23 August 2023 / Accepted: 31 August 2023 / Published: 24 October 2023
(This article belongs to the Special Issue Sustainable Agriculture for Crop Cultivation)

Abstract

:
The change in land use and the expansion of mechanized sugarcane production systems have led to an increase in soil compaction levels. Preconsolidation pressure may be used as a useful measure for soil mechanical state, management, and planning of mechanization systems. This study aimed to assess the soil compressive behavior, soil physical properties, and spatial variability of preconsolidation pressure of an Oxisol in sugarcane fields under burned harvest and mechanized harvest and the effects of land use change. The physical soil attributes (granulometry, soil water content, bulk density, total porosity, and macro and microporosity) and preconsolidation pressure were evaluated at 0.00–0.10-m, 0.10–0.20-m, and 0.20–0.30-m layers. The soil load-bearing capacity models were constructed from σp values for soil water contents. We mapped the assessed soil attributes from crossing points in a sampling mesh with regular 10 m intervals in each area and evaluated them via geostatistics. Land-use change towards sugarcane production systems promoted soil compaction. The mechanized harvesting system increased the soil load-bearing capacity in the water range corresponding to the friability region in subsurface layers. The preconsolidation pressure and soil water content exhibited spatial dependence in the sugarcane areas, regardless of the management system employed in the harvesting operations.

1. Introduction

Brazil’s sugarcane sector is witnessing a substantial expansion of cultivated areas [1] resulting in land-use change [2,3]. In Brazil, the sugarcane harvesting process is mainly characterized by two distinct methods: the raw-mechanized harvest system that involves the use of mechanized equipment and eliminates the need for pre-harvest burning of sugarcane fields, and the manual-burned harvest system characterized by the initial burning of the sugarcane, manually cut, and later collected using conventional loaders. The national index of mechanized harvesting is estimated at 89.7%, whereas manual-burned harvesting accounts for 10.3% [1].
The use of machinery, implements, management, and transportation in sugarcane production has evolved to include vehicles with greater load capacity, consequently resulting in adverse soil impacts, particularly compaction [4,5,6]. The literature demonstrates significant concern regarding the escalating prevalence of agricultural regions affected by compaction issues due to the conversion of native forest areas into sugarcane fields [2,3]. This is attributed to the intensity of mechanized operations from soil preparation to harvesting, the utilization of heavy machines, and the execution of these operations, which often neglect the consideration of soil water content, as heightened moisture conditions render the soil increasingly susceptible to compaction [7,8,9,10].
Compaction alters the physical quality of the soil, changing its structure and creating a less conducive environment for the development of the sugarcane root system, which negatively impacts its productivity [5,11]. One of the major current concerns regarding the mechanically harvested sugarcane relates to additional soil compaction [2,5]. However, unlike burned sugarcane, mechanized raw sugarcane harvesting systems leave residues on the soil surface [6,12]. This effect decreases soil compaction, reducing its effects by increasing the friability region in which the soil can be trudged and increasing its resistance to deformation [11,13].
Changes in the physical quality of the soil attributed to compaction have conventionally been assessed through quantitative physical attributes associated with soil structure, including soil density, soil porosity, soil penetration resistance, and aggregate size distribution [2,3,6,14]. Reference [2] demonstrated that the land use conversion from native forest to sugarcane leads to a decline in soil physical quality, attributed to reduced soil porosity, aeration, and saturated hydraulic conductivity, along with an increase in soil penetration resistance.
On the other hand, the preconsolidation pressure can be employed to measure soil structural sustainability, estimate the history of the stress on the soil, and assess its load-bearing capacity [5,10,15,16]. Lower loads than the preconsolidation pressure produces elastic or recoverable deformations, while higher pressures generate plastic or nonrecoverable deformations and reflect their susceptibility to compaction [17]. Furthermore, estimating the load-bearing capacity enables the identification of the most appropriate period for machine traffic based on soil water content [5] since it defines the capacity of the soil to withstand machine traffic-induced stresses without changing the three-dimensional arrangement of soil particles in a given range of soil moisture or matric potential [18].
Studies on soil compaction modeling, the knowledge of the load-bearing capacity of different soil classes [19], and assessments of traffic effects [5,11,20] may become the necessary basis for minimizing impacts on the soil structure [4]. For sugarcane to develop, the soil must contain favorable conditions for its root to grow, thus enabling a greater exploration of soil volume and greater access to water, which would reduce the risks of water deficiency. However, studies evaluating the compressive behavior of the soil and changes in the soil physical quality resulting from the conversion of native vegetation to sugarcane production systems with burned and raw mechanized sugarcane harvesting are scarce.
Technological advances in agriculture show the importance of measuring the spatial variation of soil attributes to improve the use of natural and financial resources since this spatial variability of the chemical, physical, and biological attributes of the soil influence the efficiency and development of crop management [21]. The literature shows few recent studies seeking to model the spatial variability of soil load-bearing capacity in sugarcane crops [21,22].
This study aimed to assess the soil compressive behavior, soil physical properties, and spatial variability of preconsolidation pressure of an Oxisol in sugarcane fields under burned harvest and mechanized harvest, as well as the effects of land use change.

2. Materials and Methods

2.1. Location of the Study and Treatments

The study was conducted in 2009/2010, in a commercial crop located at 21°18′67″ S and 48°11′38″ W, in the municipality of Pradópolis, São Paulo State, Brazil, at an elevation of 630 m from the sea level. According to classification of Köppen and Geinge, the climate of the region is mesothermal (Cwa) with dry winter [23], annual average precipitation of 1400 mm and concentrated rainfall between November and February. The soil was classified as a Rhodic Hapludox (Oxisol), according to Soil Taxonomy [24], and an “Latossolo Vermelho distrófico típico álico”, according to the Brazilian Soil Classification System [25], with a clayey texture, moderate A horizon, and a smooth-grooved relief.
The experimental site was consecutively used for sugarcane cultivation for over three decades. In August 2007, the sugarcane field was reformed by eliminating the ratoon from the previous crop and plowing the planting row up to 0.45 m beneath the surface. Subsequently, the soil was grooved, fertilized, and the RB3715 sugarcane variety was planted. Dolomitic limestone with 32% of CaCO2 (2.5 Mg ha−1) was applied for liming. Furthermore, mineral fertilization was administered to the area with ammonium nitrate (0.31 Mg ha−1) and, after planting (single-row spacing of 1.50 m between planting rows), organically via vinasse (100 m3 ha−1). During the planting phase, 20 Mg ha−1 of filter cake was applied via a PCP planter weighing 8.0 Mg and distributed in four high-flotation tires.
Two sugarcane harvesting systems were evaluated: the burned harvest (burn and manually cut sugarcane system, begun in 1973) and mechanized harvest (without burning, begun in 1996). In the assessed crop cycle, the first sugarcane harvest occurred in August 2008, and the second, in August 2009.
For the mechanized sugarcane operations (e.g., plowing and harrowing, fertilization), a Case MX-270 tractor (CNH Industrial America LLC, Sorocaba, Brazil) was used with a 270 hp maximum power (198 kW), 11.7 Mg mass, 4 × 4 traction, 600-70 R30 (front) and 650-85 R38 (rear) tires with 150 and 110 kPa inflation pressure, respectively. In the mechanized harvest sugarcane, the sugarcane were mechanically harvested by an Case IH A-7700 combine harvester (CNH Industrial America LLC, Sorocaba, Brazil) with a 335 hp maximum power (246 kW), a 1.88 m gauge width, a 0.46 m wide crawler wheel, and an 18.5 Mg mass. Sugarcane was transshipped via that MX-270 Case tractor and three trailers. Each trailer has a mass of 40 Mg (when completely full) distributed on two axles with 600/50 R22.5 Trelleborg Twin404 tires with an inflation pressure of 20 PSI (110 kPa).
The mechanization of the burning and manually harvested area followed the same stages as the mechanically harvested area, with the exception of the harvesting operation in which the procedures followed the following sequence: prior to harvesting, the sugarcane underwent controlled burning to remove dry leaves and facilitate manual cutting; after burning, a group of approximately 20 workers manually cut the sugarcane using machetes; following the cutting, the sugarcane was then gathered and tied into bundles for its removal from the area by manual labor, and subsequently transported to the sugarcane-mill.

2.2. Soil Sampling and Analyses

Soil samples were collected in August 2009, after the second sugarcane harvest. A native forest area (adjacent to the experimental site, with sampling points located approximately 500 m away from the sugarcane field) was also sampled to study the effects of land use changes on the soil’s physico-mechanical properties. In the sugarcane fields, soil samples were collected at 0.00–0.10, 0.10–0.20, and 0.20–0.30 m layers, with sampling taking place at a distance of 0.20 m from the crop planting row. A total of 120 sampling points were collected in the burned harvested area (1.20 ha), 121 sampling points were collected in the mechanized harvested area (1.21 ha) (Figure 1), and 60 soil samples were collected in the native forest area. A sampling grid with regular 10 m intervals was used in all areas. At each georeferenced point within this grid, its elevation was surveyed utilizing a total station instrument.
Disturbed soil samples were collected to determine the granulometric fractions by the pipette method [26]; water content by gravimetric analysis [26]; organic matter content via the Walkley–Black method [26]; and soil consistency based on Atterberg limits [27]. The shrinkage limit (SL) was determined according to [28], while the plastic limit (PL) and liquid limit (LL) were quantified according to [29]. Four replicates were used in the determination of Atterberg limits. Soil consistency states were established based on the water contents corresponding to the Atterberg limits, with the tenacity range corresponding to water content < SL, the friability range spanning water content between SL and PL, and the plastic range covering water content between PL and LL.
Soil samples with a preserved structure were collected using volumetric cylinders measuring 0.0635 m in diameter and 0.0254 m in height to determine soil bulk density, porosity, and preconsolidation pressure. The distribution of soil porosity was determined by a tension table, in which microporosity (MiP) corresponds to the water content in the sample after applying a water column with a height of 0.60 m (−6.0 kPa) to saturated samples. Subsequently, soil samples were oven-dried at 105 °C for 24 h and weighed. Total porosity (TP) corresponds to the mass of water that occupied all porous spaces (saturation), and macroporosity (MaP) was obtained by the difference between PT and MiP [27]. Bulk density (Bd) was calculated as the ratio between the dry soil mass in the oven and the sample volume [26].
Soil Load-Bearing Capacity (SLBC) models were developed for each layer in the three areas based on the quantification of the soil preconsolidation pressure (σp). To obtain each model, 20 additional undisturbed soil samples were collected within each soil layer, randomly distributed across each area. The undisturbed soil samples were initially saturated and then laboratory-equilibrated at room temperature under different water contents to cover a moisture range varying from dry to saturated soil [30], enabling the determination of the variation in σp as a function of soil water content (U).
The σp was estimated by the uniaxial compression test, performed in a CNTA/HMI/BR/001/07 automated consolidometer with interactions between man and machine, coupled with the CA Linker program it [31]. Soil samples were prior equilibrated in specific water contents, i.e., U < SL, SL < U < PL, PL < U < LL and LL < U < saturation, and were subjected to pressures of 25, 50, 100, 200, 400, 800, and 1600 kPa. Each level pressure was sequentially and automatically applied by the equipment, pre-configured for time, pressure levels, and maximum deformation for the specimens until 90% of the maximum deformation was reached, following the assumption by [32].
By using CA Linker via routines and assumptions of soil mechanics, the deformation values for each time were converted into bulk density and plotted according to their respective pressures, enabling the real-time plotting of the soil compression curve. The compression curve (applied normal pressure logarithm vs. bulk density) was used to estimate σp, according to Method 1 and Method 3, as described by [33]. Method 1 was used when the soil water content corresponded to a matric potential equal to or greater than −100 kPa, and the σp is determined at the abscissa of the intersection point between the equation of the line passing through the first two points of the secondary compression curve and the extension of the virgin compression line. On the other hand, Method 3 was used when the soil water content corresponded to a matric potential below −100 kPa, and the σp is determined at the abscissa of the intersection point between the line fitted to the first four points of the secondary compression curve and the extension of the virgin compression line. After the uniaxial compression tests, samples were oven-dried at 105 °C until a constant mass was achieved so bulk density could be determined. From σp, load-bearing capacity models were obtained as a function of the soil water content, according to [33] (Equation (1)):
σp = 10(a+b×U)
where σp refers to the soil preconsolidation pressure, “a” and “b”, to adjustment parameters (“a” is the intercept or linear coefficient, and “b” is the slope angle or angular coefficient), and U is the gravimetric soil water content.
Regression analyses of the compressibility tests were performed in Sigma Plot® 8.0 (San Jose, CA, USA). For comparisons between models, adjusted equations were linearized and compared via the homogeneity test of linear models, according to [34]. The homogeneity tests for linear models first compare the residual variances of the two models. If the F-test found these variances to be homogeneous, the linear (a) and angular coefficients (b) were compared. For this, linear models were obtained from the exponential model by a logarithm applied to preconsolidation pressure values (log σp = a + b × U). If the load-bearing capacity models were homogeneous and/or if the “a” and/or “b” coefficients do not differ significantly, these models were grouped to generate a new model. Finally, from the generated models, soil load-bearing capacity values were estimated in the shrinkage, liquid, and plastic limits.
The impact of soil management on load-bearing capacity was also analyzed via the area under the curve (Auc) of the models obtained as [5,35]. The Auc was computed through the integration of Equation (1), with soil water contents at the friable consistency state, delimited by the shrinkage and plasticity limits of each soil management.

2.3. Spatial Dependence of Preconsolidation Pressure

The spatial dependence of the attributes was analyzed by variogram adjustments [36] based on the seasonality assumption of the intrinsic hypothesis, estimated by Equation (2):
γ ^ h = 1 2 N ( h ) i = 1 N ( h ) Z x i Z x i + h 2
in which N(h) refers to the number of experimental observation pairs Z(xi) and Z (xi + h) are separated by a distance h. The variogram is represented by the graph ŷ(h) versus h. By adjusting this mathematical model to the calculated ŷ(h) values, the coefficients of the theoretical model for the variogram (i.e., its effect) are estimated (the nugget effect, C0; spatial semivariance, C1; threshold, C0 + C1; and range, a). To analyze the degree of spatial dependence of the studied attributes, the classification in [37] was used.
In determining the existence of spatial dependence, the variogram test was used via GS+ [38]. In case of doubt among more than one model for the same variogram, the highest coefficient of determination, the lowest residual sum of squares, and validation of the models were considered via “jack knifing”. The geostatiscal interpolator via kriging was used to interpolate data and Surfer to map spatial distribution [39].

3. Results and Discussion

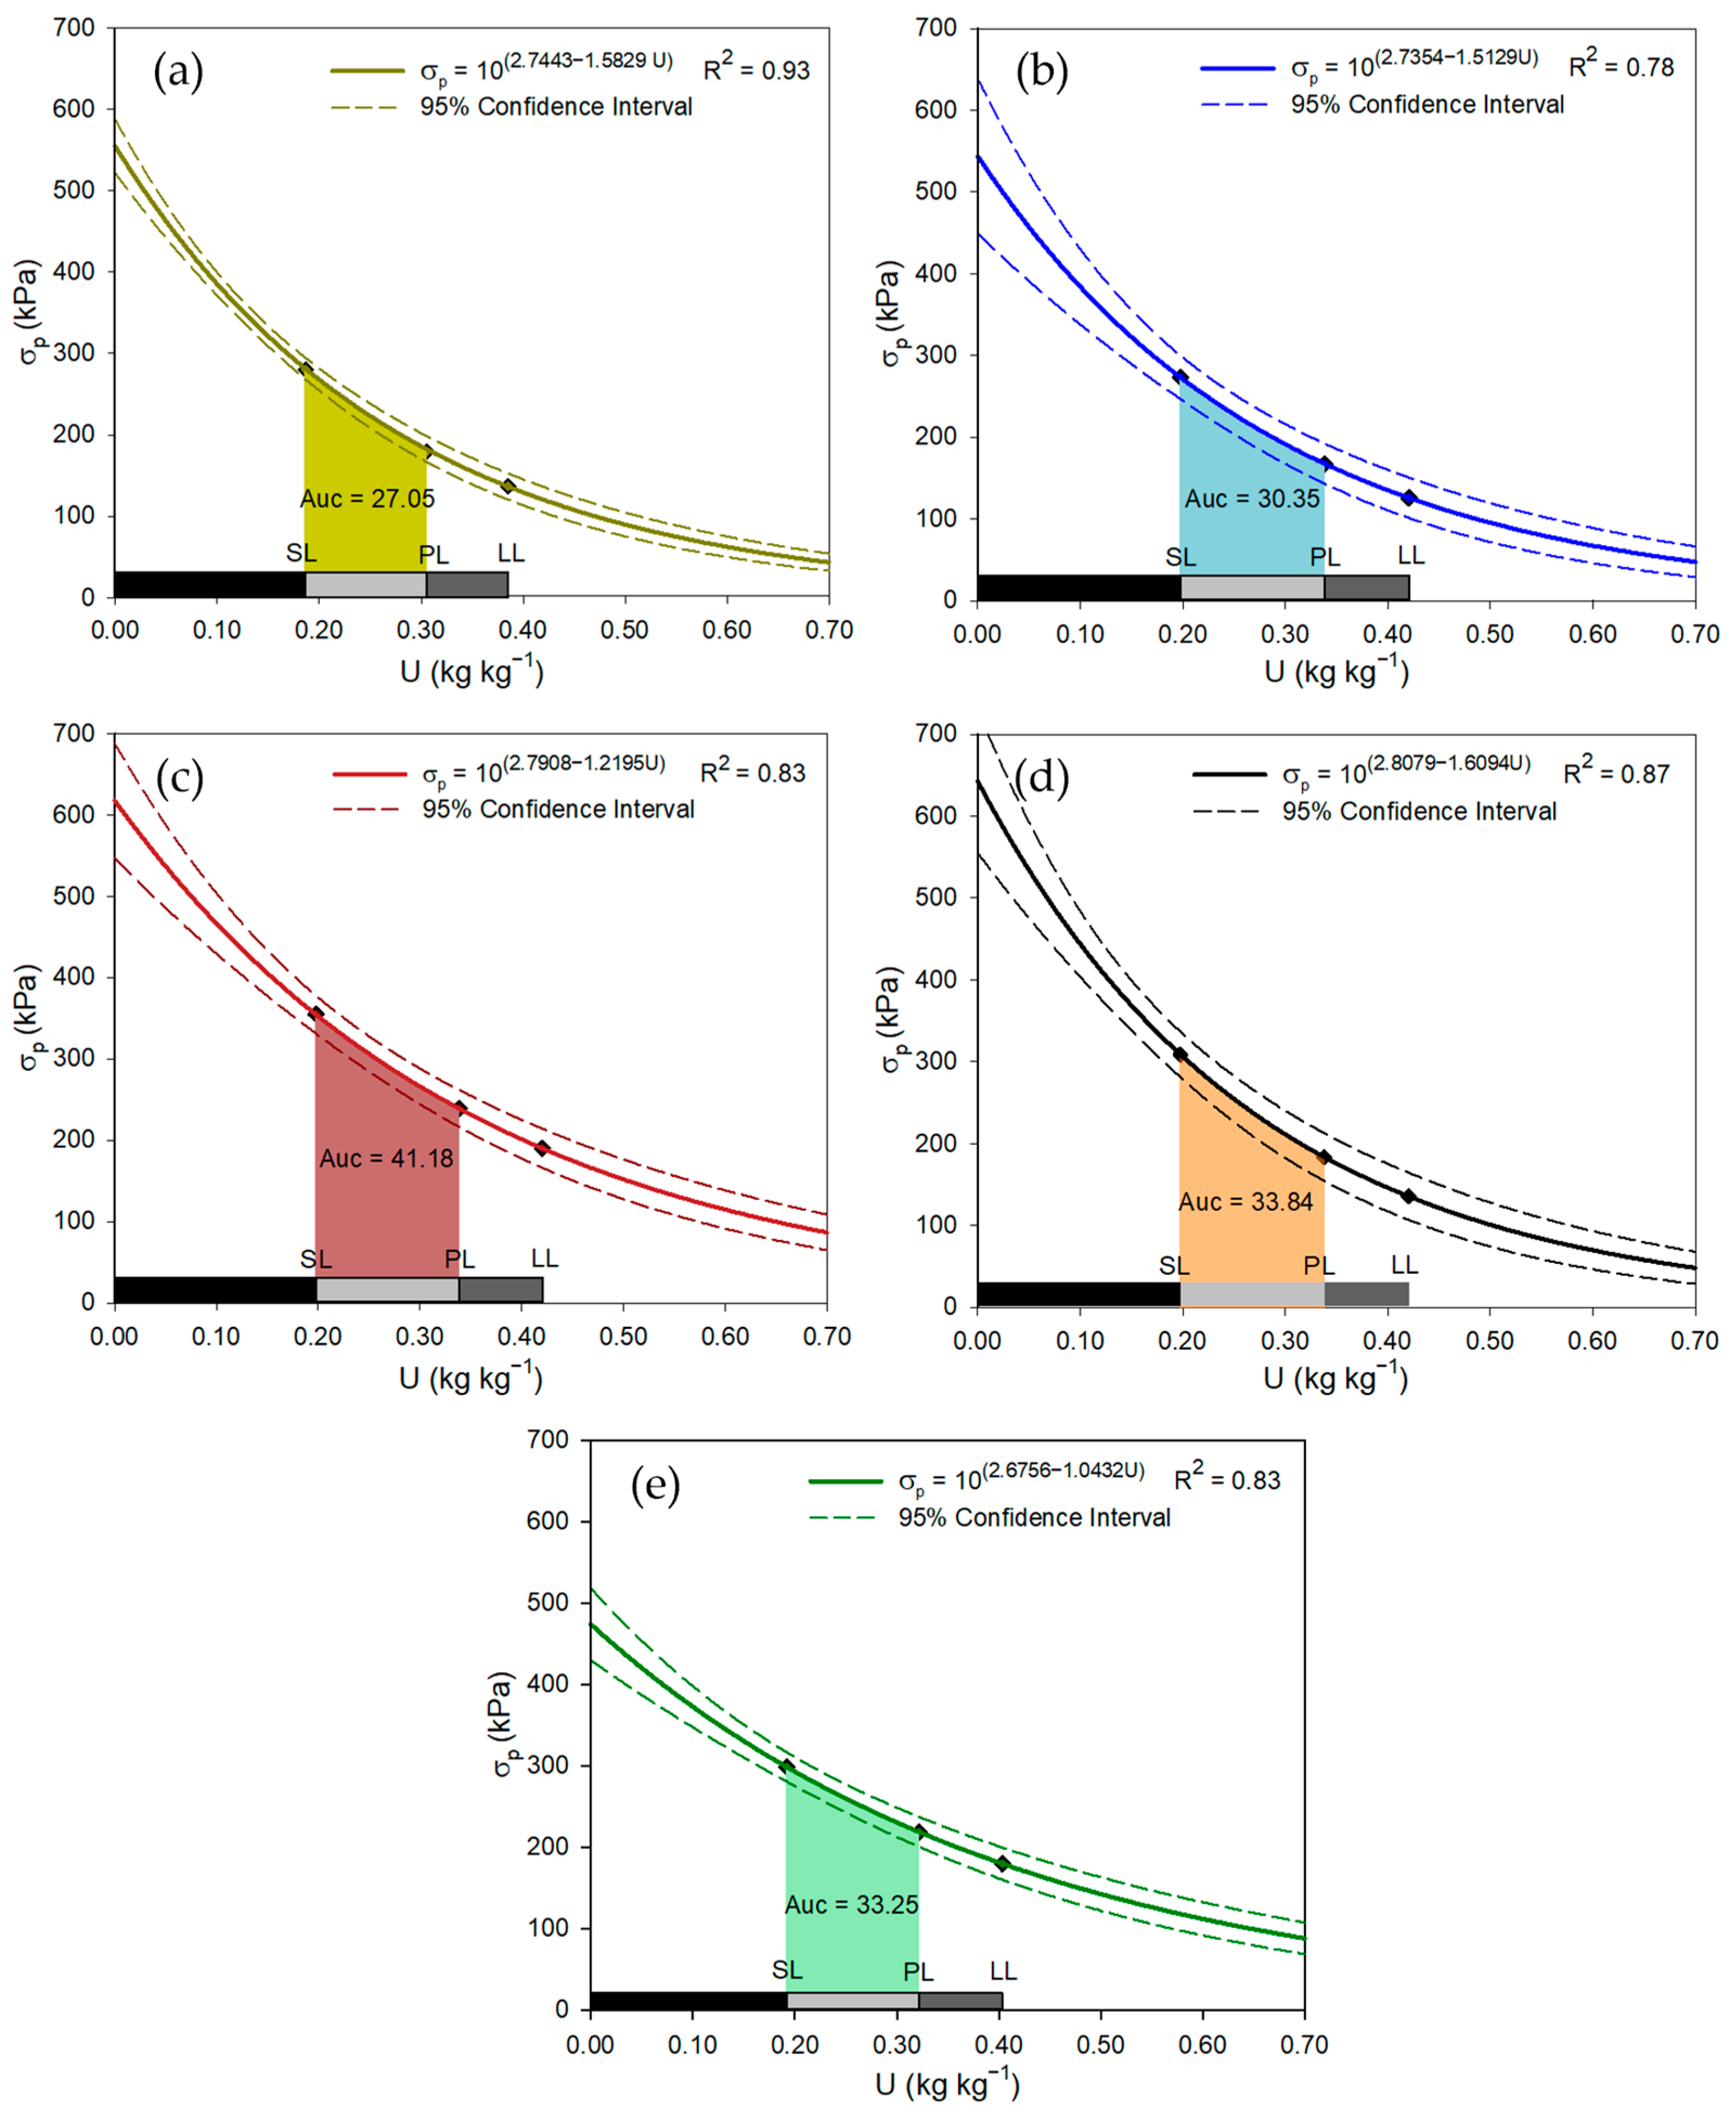
3.1. Soil Load-Bearing Capacity

The equation parameters adjusted to the compressibility model (preconsolidation pressure—σp—as a function of the soil water content—U) as per [33] are shown in Table 1. The F-test showed that all models were significant at 1% probability. The generated models for the three soil layers explained between 78% (mechanized harvested sugarcane at the 0.00–0.10 m layer) and 97% (burned harvest sugarcane at the 0.20–0.30 m layer) of σp variability. High-determination coefficients indicate that the [33] model was efficient to determine σp from the soil water content regardless of soil management.
The equations that adjusted to the load-bearing capacity model obtained for the soil layers in each management system statistically differed only for mechanized harvest sugarcane (Table 2). Thus, the models for each soil layer indicate different load-bearing capacities. In the burned harvest area and native forest, the [35] test resulted in homogeneous models between soil layers without significant differences between linear and angular coefficients (Table 2), indicating that the soil in different layers within each management system has the same load-bearing capacity. So, a new model was performed for the 0.00–0.30 m layer in these two areas (Table 1).
We found statistical differences between the models adjusted for burned harvest (0.00–0.30 m) vs. mechanized harvest sugarcane crops in the three layers (0.00–0.10, 0.10–0.20, and 0.20–0.30 m) vs. native forest (0.00–0.30 m) (Table 2 and Figure A1), indicating different load-bearing capacities. Thus, these models cannot be grouped, indicating changes in σp values and the influence of management systems on soil compressibility.
The water contents for the Atterberg limits that define the soil consistency states showed no significant differences among the studied areas. For the burned harvest sugarcane, the water contents corresponding to the shrinkage limit (SL), plastic limit (PL), and liquid limit (LL) were 0.19 kg kg−1, 0.31 kg kg−1, and 0.39 kg kg−1, respectively. Regarding the mechanized harvest sugarcane, the water contents were SL = 0.20 kg kg−1, PL = 0.34 kg kg−1, and LL = 0.42 kg−1. As for the native forest, the water contents within the Atterberg limits were SL = 0.19 kg kg−1, PL = 0.32 kg kg−1, and LL = 0.40 kg kg−1 (Figure 2).
In the burned harvest area, at the 0.00–0.30 m layer, the σp values for soil consistency limits (SL, PL, and LL) were 275, 172, and 128 kPa, respectively (Figure 2a). In the mechanized harvested area, the highest obtained σp values at soil consistency limits were in the 0.10–0.20 m layer (355, 239, and 190 kPa, in SL, PL, and LL, respectively) (Figure 2c) and the lowest ones in the 0.00–0.10 m layer (273, 167, and 126 kPa, in SL, PL, and LL, respectively) (Figure 2b). The σp values of the native forest showed an intermediate behavior between the two sugarcane areas with 299, 219, and 180 kPa SL, PL, and LL values, respectively (Figure 2b).
The change in soil consistency from SL to LL reduced the load-bearing capacity of the soil by 53% in the burned harvest area in 54, 46, and 56% for soil in the mechanized sugarcane harvest area at layers 0.00–0.10, 0.10–0.20, and 0.20–0.30 m; and 40% in the native forest area (Figure 2). This indicates that anthropic soil use has led to a greater loss of load-bearing capacity in the semi-solid and plastic state of the soil, raising concerns about precautions to be taken in soil operations to minimize compaction. Precautions, such as limiting undesirable loads to avoid greater damage to soil structure, adhering to opportune moments for conducting operations when soil moisture allows for increased load-bearing capacity [5,20,30], as well as the utilization of controlled traffic management systems [5,11,14], should be taken into consideration.
We assessed differences in soil load-bearing capacity models and the effect of soil water on its friable region by the area under the curve (Auc) between shrinkage and plastic limits (Figure 2). Auc was higher in the sugarcane area with mechanized harvesting in the 0.10–0.20 and 0.20–0.30 m layers (41.18 and 33.84, respectively), followed by the native forest area (33.25) and the sugarcane burn harvest area (27.05).
The lower load-support capacity of the soil under burned harvest sugarcane (layer 0.00–0.30-m) is due to soil tillage (disrupting the structure the soil and erasing its stress history) and the absence of traffic from the harvester-tractor-transshipment set in the harvesting operation when compared to the area with mechanized harvesting. The use of machinery in harvesting impacts the soil, increasing its load-bearing capacity at depth. Similarly, some authors also found higher soil tensile strength [40] and load-bearing capacity in more subsurface soil layers at depths greater than 0.20 m [5,11,41].
In clayey soils, the stresses from machine traffic can change the structure of the soil in depth [13]. However, in an area of mechanically harvested sugarcane without burning, the straw covering the soil tends to decrease some of the mechanical stress due to moto-mechanized sets, generating greater load-bearing capacity if sugarcane management dispenses with burning and preserves the straw on the surface.
In the native forest area, we observed intermediate soil load-bearing capacity values between areas of burned and mechanized harvest and above the water content at the shrinkage limit (Figure 2). Reference [42] reported lower soil preconsolidation pressure in the native forest than in several sugarcane managements, suggesting that the load-bearing capacity of the soil in native forest stems from the stability of its natural structure due to the absence of anthropic action.
This result presupposes an impact due to intensive soil cultivation, arousing concerns for this soil if machine traffic in sugarcane fields occurs with the soil under a consistency above its friability region. Moreover, it shows the importance of the mechanized system in maintaining straw on the surface and thus preserving soil moisture, preferably in its friability range (between SL-PL). Maintaining straw is one of the key prerequisites for the no-tillage system. Reference [35] found the importance of refraining from tilling sugarcane fields, which showed higher soil load-bearing capacity in soil layers ranging from 0 to 0.30 m, attesting its greater resistance to additional compaction than its conventional management (sugarcane burning) and scarification with minimal revolving.
Soils with a higher friability better resist compression from surface pressures [43], but above this limit (in the plastic range) they offer favorable conditions for compaction [44]. Thus, it was observed that the mechanized harvesting sugarcane area presented a range of friability with water content between 0.20–0.34 kg kg−1, whereas the burned harvest soil showed a friability ranging from 0.19–0.31 kg kg−1, and the forest area, between 0.19–0.32 kg kg−1 (Figure 2).
In the driest region of the load-bearing capacity curve (U < 0.12 kg kg−1, within the soil tenacity region), mechanized sugarcane harvesting and the burned harvest (in the 0.00–0.10 m layer and 0.00–0.30-m, respectively) subjected Oxisol to a state of consolidation above that of native forest. From this U value, soil load-bearing capacity in these management systems decreases, rendering it, regardless of its management history, more susceptible to compaction than the soil in native forest if mechanized operations apply contact pressures above the preconsolidation pressure value.
The mechanized harvest area at 0.20–0.30 m shows a lower load-bearing capacity than the native forest area above U = 0.24 kg kg−1 (water content in the friable region). The 0.10–0.20 m layer has a higher load-bearing capacity than that in the native forest throughout the analyzed water range. This indicates that the soil stress history from the soil preparation, until the evaluation moment resulting from mechanized harvest operations, led to greater compaction in the 0.10–0.20 m layer.
A sugarcane harvester can apply a static contact pressure of up to 54 kPa [4] or 100 kPa and 77 kPa in areas with and without sugarcane residue, respectively [13]. In addition to pressures ranging from 90–106 kPa for front and 75–98 kPa for rear tires, and 157–169 kPa for a loaded wagon with approximately 14.0 Mg of sugarcane in transit left sugarcane residues on the ground [4,13]. Thus, the load-bearing capacity models for the mechanized harvesting area showed that the best strategy involves agricultural machines in which the tire/soil contact pressures stays within 273 and 127 kPa in the soil water limits of the friable region (0.20–0.34 kg kg−1), respectively, to avoid compaction at the 0.00–0.30 m layer of the studied soil type. Although the burned harvest area dispenses with machines for cutting, workers use machines in transport operations and cultural tracts. So, these machines must apply pressures to the soil between 275 and 172 kPa in the friability region (0.19–0.31 kg kg−1), respectively, to avoid soil compaction. Reference [15], evaluating preconsolidation pressure in Acrisol under sugarcane cultivation, concluded that the load limit machines apply, aiming to remain within the soil support capacity, 126.28 kPa for a moisture content of 0.10 kg kg−1 or >75.70 kPa for moisture of 0.19 kg kg−1.

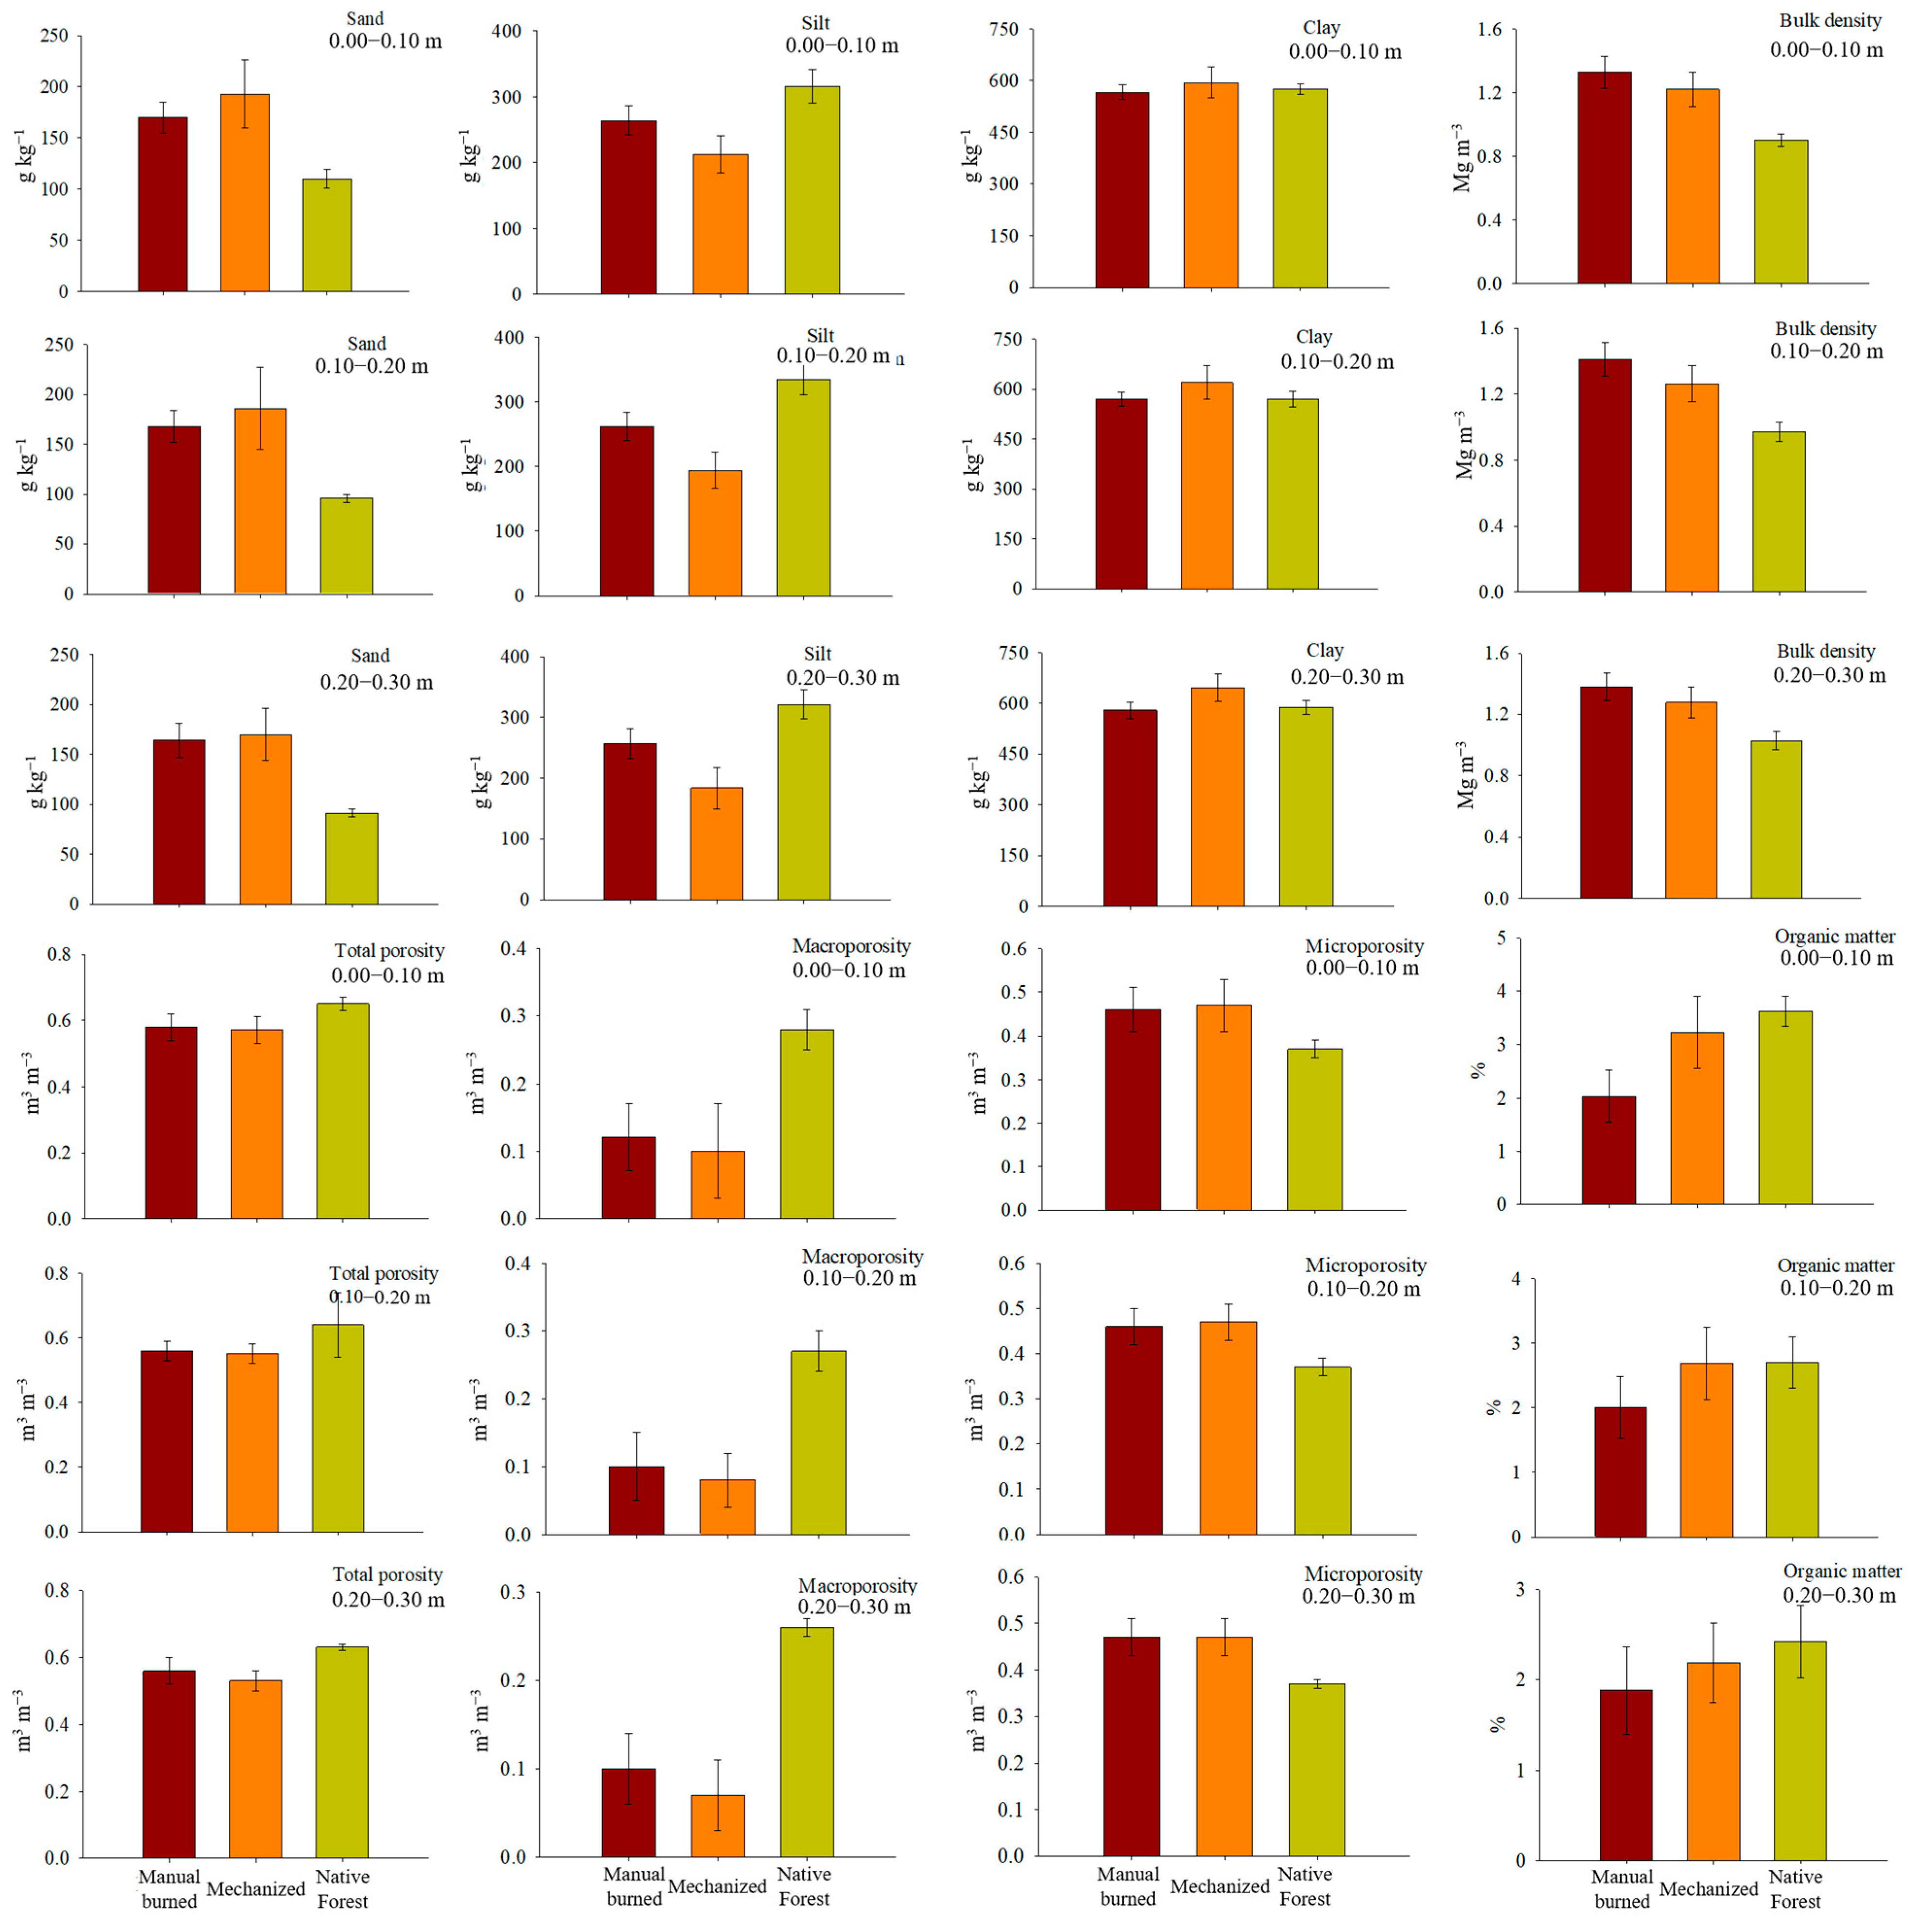
3.2. Physical Attributes and Preconsolidation Pressure

The particle size distribution of soil in the sugarcane areas, when compared to the native forest area, showed a relative difference in sand content, ranging between 75% and 94% in the mechanized harvest area, and between 55% and 80% in the burned harvest area. Conversely, the relative differences in silt content ranged from −33% to −43%, and −5% to −7% for the mechanized and burned harvest areas, respectively (Figure 3). For the clay content, the relative differences did not exceed 10% in both sugarcane areas when compared to the native forest, despite indicating soils of a distinct textural class. The higher sand content in both these areas with anthropic uses may have also influenced the greater load-bearing capacity of the soil when compared to the native forest area. Findings by [33] demonstrated that the sandier Oxisols exhibited an increased load-bearing capacity under specific soil water tension.
Sand content showed a positive correlation with σp in the burned harvesting sugarcane area at 0.10–0.20- and 0.20–0.30 m layers (Table 3). Reference [45] found a higher σp ratio in sandy soils than in clayey ones. The higher resistance of soils with predominantly coarser fractions may be due to points of contact between quartz grains increasing the friction between the particles and dissipating the mechanical energy applied to the soil [46].
After two sugarcane crop cycles, soil bulk density (Bd) remained the same between sugarcane areas with a 1.41 maximum value at 0.20–0.30 m and a 1.28 Mg m−3 in burned and mechanized harvest areas, respectively (Figure 3). However, Bd values in both sugarcane areas were higher than in native forest soil (1.03 Mg m−3). This result signals changes in soil structure due to agriculture converting an area of native forest for use. However, we found that more conservationist agricultural management, such as cultivation without burning and mechanized harvesting, showed a lower Bd (1.28 Mg m−3) with a value considered non-restrictive for sugarcane. In experiments with edaphoclimatic conditions similar to those in this study, reference [47] reported Bd values of 1.39 Mg m−3 in the 0.40–0.60 m layer as normal for areas with preserved soil structure (native forest), and therefore not limiting for sugarcane root growth. On the other hand, the burned harvest sugarcane area showed Bd values above the mentioned limits (1.41 Mg m−3) at the 0.10–0.20 m layer, thus emphasizing the importance of changing sugarcane management from burned to mechanized harvest.
Despite the influence of Bd on load-bearing capacity outcome, as detected in [10], this study found that Bd variation between areas and soil depth showed no significant correlation with the soil load-bearing capacity (Table 3). However, changes in bulk density did not reflect on the soil pore space and its aeration capacity, i.e., our results generally showed significant and negative correlations among Bd, Pt, and MaP and positive correlations with MiP, suggesting that macropores are the most affected by the soil compaction process.
Thus, soil porosity in sugarcane areas showed a predominance of micropores (MiP), with similar values ranging from 0.46–0.47 m3 m−3 at the three depths (Figure 3). If compared with the values for native forest (0.37 m3 m−3), the areas with sugarcane showed negative changes in their structure due to agriculture. Increased MiP resulted from a decrease in macroporosity (MaP) in which the areas with sugarcane showed values between 0.07–0.12 m3 m−3, whereas the soil of the native forest was from 0.26 to 0.28 m3 m−3 (Figure 3). According to [48], MaP values lower than 0.10 m3 m−3 may restrict the movement of air and water in the soil, potentially impairing air and water transport in the soil, thereby compromising water absorption by the root system.
We found that 0.00–0.10 m layers showed higher soil organic matter (SOM) for both the mechanized harvest area and native forest and lower in the burned harvest one, a 14–37% reduction in relation to the SOM contents observed in the mechanized harvesting area and of 43–22% regarding SOM contents in native forest (Figure 3). The elimination of straw with fire before manual harvesting sugarcane decrease the content of organic matter in the soil [12,40]. In the mechanized harvest area, SOM values ranged from 2.19–3.23 g kg−1, showing it to be a more sustainable sugarcane management since straw, besides increasing organic matter in the soil, covers and protects the soil against erosion. Moreover, straw absorbs the pressures applied to the soil surface, potentially mitigating the compaction process [16,49].
Soil organic matter content showed a negative correlation with σp at the 0.20–0.30 m layer in the burned harvest area (Table 3). Some authors also found a significant and negative correlation between SOM and σp in sugarcane fields, whose carbon content increased compressibility with lower σp values and a higher compression index in response to soil carbon increases [41,50].

3.3. Spatial Variability of Preconsolidation Pressure

We found a spatial dependence of soil water content (U) and preconsolidation pressure (σp) in the both sugarcane studied areas. The spherical model best fit our experimental semivariograms (Table 4), indicating a great spatial continuity of these variables [51] and suggesting that the distance between sampling sites can be expanded to a larger area (above the range the semivariogram generated), thus reducing soil monitoring costs. Thus, we find similar spatial continuity patterns of σp in burned and mechanized harvest areas, whose values range from 17.60–19.40 m and 17.20–18.20 m, respectively, suggesting distances between sampling points greater than 18 m to evaluate σp.
Water content influenced these results, i.e., the range of spatial dependence of σp was higher in less humid regions, with values in burned and mechanized harvested areas ranging from 17.10–18.90 m and 15.30–17.20 m, respectively (Table 3). This indicates that specific management regions of σp may be monitored by soil water content and σp mapping enables the identification of management limits. Reference [15] also found spatial variability structure in sugarcane soil and highlighted that preconsolidation stress maps may indicate areas that support heavier equipment and areas that can tolerate only lighter vehicles before further compaction occurs. Soil compaction susceptibility becomes critical under excess water in the soil, reducing its load-bearing capacity [7,10,15,20].
The percentage of the nugget effect on the threshold of soil water content and preconsolidation pressure in all studied layers was below 25%, indicating a strong degree of spatial dependence, according to the criterion in [37]. Thus, the spatial distribution of water content and σp in the three soil layers is not entirely random, and semivariograms explain most of the data variance.

4. Conclusions

Land use change towards sugarcane production systems promoted soil compaction. The mechanized harvesting system increased the soil load-bearing capacity in the water range corresponding to the friability region in subsurface layers.
The preconsolidation pressure and soil water content exhibited spatial dependence in the sugarcane areas, regardless of the management system employed in the harvesting operations. Hence, the spatial distribution of these variables can be utilized for the development of management strategies aimed at minimizing the risks of additional soil compaction.

Author Contributions

Conceptualization, F.S.A. and Z.M.d.S.; methodology, F.S.A., Z.M.d.S., G.S.S. and R.B.d.S.; software, F.S.A. and D.A.A.E.; formal analysis, F.S.A., D.A.A.E. and R.L.M.T.; investigation, F.S.A., G.S.S. and Z.M.d.S.; data curation, F.S.A. and D.A.A.E.; writing—original draft preparation, F.S.A.; writing—review and editing, F.S.A., Z.M.d.S., G.S.S., R.B.d.S., D.A.A.E. and R.L.M.T.; visualization, D.A.A.E. and R.L.M.T.; supervision, Z.M.d.S. and R.B.d.S.; project administration, Z.M.d.S.; funding acquisition, Z.M.d.S. and F.S.A. All authors have read and agreed to the published version of the manuscript.

Funding

This research was funded by São Paulo Research Foundation (FAPESP), grant number 2007/04706-4.

Institutional Review Board Statement

Not applicable.

Informed Consent Statement

Not applicable.

Data Availability Statement

Study data can be obtained by request to the corresponding author or the first author via e-mail.

Conflicts of Interest

The authors declare no conflict of interest.

Appendix A

Figure A1. Comparison of load-bearing capacity models of an Oxisol after the application of the statistical procedure in [34] for burned and mechanized harvest sugarcane crops and native forest at 0.00–0.010, 0.10–0.20, and 0.20–0.30 m layers and native forest areas at the 0.00–0.30 m layer.
Sustainability 15 15185 g0a1

References

  1. Conab—Companhia Nacional De Abastecimento. Acompanhamento De Safra Brasileira: Cana-De-Açúcar, Safra 2022/23, v.9—Terceiro levantamento, n.3, Brasília. 2022; pp. 1–58. Available online: https://www.conab.gov.br/info-agro/safras/cana?view=default (accessed on 22 February 2023).
  2. Cherubin, M.R.; Karlen, D.L.; Franco, A.L.C.; Tormena, C.A.; Cerri, C.E.P.; Davies, C.A.; Cerri, C.C. Soil physical quality response to sugarcane expansion in Brazil. Geoderma 2016, 267, 156–168. [Google Scholar] [CrossRef]
  3. Cavalcanti, R.Q.; Rolim, M.M.; Lima, R.P.; Tavares, U.E.; Pedrosa, E.M.R.; Cherubin, M.R. Soil physical changes induced by sugarcane cultivation in the Atlantic Forest biome, northeastern Brazil. Geoderma 2020, 370, e114353. [Google Scholar] [CrossRef]
  4. Guimarães Júnnyor, W.S.; Diserens, E.; De Maria, I.C.; Araujo-Junior, C.F.; Farhate, C.V.V.; Souza, Z.M. Prediction of soil stresses and compaction due to agricultural machines in sugarcane cultivation systems with and without crop rotation. Sci. Total Environ. 2019, 681, 424–434. [Google Scholar] [CrossRef]
  5. Esteban, D.A.; Souza, Z.M.; Silva, R.B.; Lim, E.S.; Lovera, L.H.; Oliveira, I.N. Impact of permanent traffic lanes on the soil physical and mechanical properties in mechanized sugarcane fields with the use of automatic steering. Geoderma 2020, 363, E114097. [Google Scholar] [CrossRef]
  6. Castioni, G.A.F.; Lima, R.P.; Cherubin, M.R.; Bordonal, R.O.; Rolim, M.R.; Carvalho, J.L.N. Machinery traffic in sugarcane straw removal operation: Stress transmitted and soil compaction. Soil Tillage Res. 2021, 213, E105122. [Google Scholar] [CrossRef]
  7. An, J.; Zhang, Y.; Yu, N. Quantifying the effect of soil physical properties on the compressive characteristics of two arable soils using uniaxial compression tests. Soil Tillage Res. 2015, 145, 216–223. [Google Scholar] [CrossRef]
  8. Peixoto, D.S.; Silva, B.M.; Oliveira, G.S.; Moreira, S.G.; Silva, F.; Curi, N.A. Soil compaction diagnosis method for occasional tillage recommendation under continuous no tillage system in Brazil. Soil Tillage Res. 2019, 194, E104307. [Google Scholar] [CrossRef]
  9. Shaheb, M.R.; Venkatesh, R.; Shearer, S.A. A review on the effect of soil compaction and its management for sustainable crop production. Biosyst. Eng. 2021, 46, 417–439. [Google Scholar] [CrossRef]
  10. Lima, R.P.; Rolim, M.M.; Oliveira, V.S.; Silva, A.R.; Pedrosa, E.M.R.; Ferreira, R.L.C. Load-bearing capacity and its relationships with the physical and mechanical attributes of cohesive soil. J. Terramech. 2015, 58, 51–58. [Google Scholar] [CrossRef]
  11. Souza, G.S.; Souza, Z.M.; Silva, R.B.; Araujo, F.S.; Barbosa, R.S. Compressibilidade do solo e sistema radicular da cana-de-açúcar em manejo com e sem controle de tráfego. Pesqui. Agropecu. Bras. 2012, 47, 603–612. [Google Scholar] [CrossRef]
  12. Luca, E.F.; Chaplotb, V.; Mutemac, M.; Ferreirae, M.L.; Cerri, C.C.; Cout, H.T.Z. Effect of conversion from sugarcane preharvest burning to residues green-trashing on soc stocks and soil fertility status: Results from different soil conditions in Brazil. Geoderma 2018, 310, 238–248. [Google Scholar] [CrossRef]
  13. Silva, R.B.; Iori, P.; Souza, Z.M.; Pereira, D.M.G.; Vischi Filho, O.J.; Silva, F.A.M. Contact pressures and the impact of farm equipment on Latosol with the presence and absence of sugarcane straw. Ciênc. Agrotec. 2016, 40, 265–278. [Google Scholar] [CrossRef]
  14. Luz, F.B.; Castioni, G.A.F.; Tormena, C.A.; Freitas, R.S.; Carvalho, J.L.N.; Cherubin, M.R. Soil tillage and machinery traffic influence soil water availability and air fluxes in sugarcane fields. Soil Tillage Res. 2022, 223, E105459. [Google Scholar] [CrossRef]
  15. Tavares, U.E.; Rolim, M.M.; Oliveira, S.; Pedrosa, E.M.R.; Siqueira, G.M.; Magalhães, A.G. Spatial dependence of physical attributes and mechanical properties of Ultisol in a sugarcane field. Sci. World J. 2015, 2015, 531231. [Google Scholar] [CrossRef] [PubMed]
  16. Cherubin, M.R.; Franchi, M.R.A.; Lima, R.P.; Moraes, M.T.; Luz, F.B. Sugarcane straw effects on soil compaction susceptibility. Soil Tillage Res. 2021, 212, E105066. [Google Scholar] [CrossRef]
  17. Holtz, R.D.; Kovacs, W.D. An Introduction to Geotechnical Engineering; Englewood Cliffs: Prentice-Hall, NJ, USA, 1981; pp. 1–746. [Google Scholar]
  18. Araujo-Junior, C.F.; Dias Junior, M.S.; Guimarães, P.T.G.; Alcântara, E.N. Load bearing capacity and critical water content of a Latossol induced by different managements. Rev. Bras. Cienc. Solo 2011, 35, 15–31. [Google Scholar]
  19. Tassinari, D.; Andrade, C.; Junior, S.D.; Martins, R.P.; Rocha, W.W.; Pais, A.M. Soil compaction caused by harvesting, skidding and wood processing in eucalyptus forests on coarse-textured tropical soils. Soil Use Manag. 2019, 35, 400–411. [Google Scholar] [CrossRef]
  20. Severiano, E.C.; Oliveira, G.C.; Dias Junior, M.S.; Castro, M.B.; Oliveira, L.F.C.; Costa, K.P. Compactação de solos cultivados com cana-de-de-açúcar: Ii—quantificação das restrições às funções edáficas do solo em decorrência da compactação prejudicial. Eng. Agrícola 2010, 30, 414–423. [Google Scholar] [CrossRef]
  21. Mulla, D.J. Spatial variability in precision agriculture. In Encyclopedia of Gis; Shekhar, S., Xiong, H., Zhou, X., Eds.; Springer: Berlin/Heidelberg, Germany, 2017; pp. 1–8. [Google Scholar]
  22. Barik, K.; Aksakal, E.L.; Islam, K.R.; Sari, S.; Angin, I. Spatial variability in soil compaction properties associated with field traffic operations. Catena 2014, 120, 122–133. [Google Scholar] [CrossRef]
  23. Alvares, C.A.; Stape, J.L.; Sentelhas, P.S.; Gonçalves, J.L.M.; Sparovek, G. Köppen’s Climate Classification map for Brazil. Meteorol. Z. 2014, 22, 711–728. [Google Scholar] [CrossRef]
  24. Soil Survey Staff. Keys to Soil Taxonomy, 12th ed.; United States Department of Agriculture, Natural Resources Conservation Service: Washington, DC, USA, 2014.
  25. Santos, H.G.; Jacomine, P.K.T.; Anjos, L.H.C.; Oliveira, V.A.; Lumbreras, J.F.; Coelho, M.R.; Almeida, J.A.; Araujo Filho, J.C.; Oliveira, J.B.; Cunha, T.J.F. Sistema Brasileiro de Classificação de Solos, 5th ed.; Revista e Ampliada; Embrapa: Brasília, Brazil, 2018. [Google Scholar]
  26. Teixeira, C.; Donagemma, G.K.; Fontana, A.; Teixeira, W.G. Manual de Métodos de Análise de Solo, 3rd ed.; Revisada e Ampliada; Embrapa: Brasília, Brazil, 2017. [Google Scholar]
  27. Lambe, T.W.; Whitman, R.V. Soil Mechanics; John Wile & Sons: New York, NY, USA, 1969. [Google Scholar]
  28. Bowles, J.A. Engineering Properties of Soils and Their Measurements, 3rd ed.; Mcgraw-Hill: New York, NY, USA, 1986. [Google Scholar]
  29. Sowers, C.F. Consistency. Methods of Soil Analysis, Part 1; Black, C.A., Ed.; Asa: Madison, WI, USA, 1965. [Google Scholar]
  30. Silva, R.B.; Lanças, K.; Miranda, E.E.; Silva, F.A.M.; Baio, F.H.R. Estimation and evaluation of dynamic properties as indicators of changes on soil structure in sugarcane fields of Sao Paulo StateBrazil. Soil Tillage Res. 2009, 103, 265–270. [Google Scholar] [CrossRef]
  31. Silva, R.B.; Masqueto, B.J.; Lanças, K.; Silva, F.A.M. Desenvolvimento, automação e desempenho de um consolidômetro com interface homem-máquina. Rev. Bras. Cien. Solo 2015, 39, 416–427. [Google Scholar] [CrossRef]
  32. Taylor, H.M. Effects of soil strength on seedling mergence, root growth and crop yield. In Compaction of Agricultural Soils; Barnes, K.K., Carleton, W.M., Throckmorton, R.I., Van Den Berg, G.E., Eds.; Asae: St. Joseph, MI, USA, 1971. [Google Scholar]
  33. Dias Junior, M.S.; Pierce, F.J. A simple procedure for estimating preconsolidation pressure from soil compression curves. Soil Technol. 1995, 8, 139–151. [Google Scholar] [CrossRef]
  34. Snedecor, G.W.; Cochran, W.G. Statistical Methods, 8th ed.; Iowa State University Press: Ames, IA, USA, 1989. [Google Scholar]
  35. Moraes, M.T.; Luz, F.B.; Debiasi, H.; Franchini, J.C.; Silva, V.R. Soil load support capacity increases with time without soil mobilization as a result of age-hardening phenomenon. Soil Tillage Res. 2019, 186, 128–134. [Google Scholar] [CrossRef]
  36. Vieira, S.R. Geoestatistica em estudos de variabilidade espacial do solo. In Tópicos em Ciência do Solo; Novais, F., Alvarez, H., Schaefer, C.E.G.R., Eds.; SBCS: Viçosa, Brazil, 2000. [Google Scholar]
  37. Cambardella, C.A.; Moorman, T.B.; Novak, J.M.; Parkin, T.B.; Karlen, D.L.; Turco, R.F.; Konopka, A.E. Field scale variability of soil properties in central Iowa soils. Soil Sci. Soc. Am. J. 1994, 58, 1501–1511. [Google Scholar] [CrossRef]
  38. Robertson, G.P. Gs+: Geostatistics for the Environmental Sciences (Version 5.1 For Windows); Gamma Design Software: Plainwell, MI, USA, 1998. [Google Scholar]
  39. Golden Software Inc. (Golden, Estates Unidos). Surfer For Windows: Release 7.0, Contouring and 3d Surface Mapping for Scientist’s Engineers User’s Guide, New York; Golden Software, Inc.: Golden, CO, USA, 1999. [Google Scholar]
  40. Kunde, R.J.; Lima, C.L.R.; Silva, S.D.A.; Pilon, C.N. Tensile strength, friability, aggregation, and soil organic matter physical fractions of an Oxisol cultivated with sugarcane. Pesqui. Agropecu. Bras. 2018, 53, 487–494. [Google Scholar] [CrossRef]
  41. Toledo, M.S.; Rolim, M.M.; Lima, R.P.; Cavalcanti, R.Q.; Ortiz, F.S.; Cherubin, M.R. Strength, swelling and compressibility of unsaturated sugarcane soils. Soil Tillage Res. 2021, 212, E105072. [Google Scholar] [CrossRef]
  42. Vasconcelos, R.F.B.; Cantalice, J.R.B.; Moura, G.B.A.; Rolim, M.M.; Montenegro, C.E. Compressibilidade de um Latossolo Amarelo distrocoeso não saturado sob diferentes sistemas de manejo da cana-de-açúcar. Rev. Bras. Cien. Solo 2012, 36, 525–536. [Google Scholar] [CrossRef]
  43. Hillel, D. Fundamentals of Soil Physics; Academic Press: New York, NY, USA, 1980. [Google Scholar]
  44. Rossetti, K.V.; Centurion, J.F.; Oliveira, P.R.; Andrioli, I. Atributos físicos no tempo de adoção de manejos em Latossolos cultivado com soja. Ver. Bras. Cien. Solo 2012, 36, 367–376. [Google Scholar] [CrossRef]
  45. Severiano, E.C.; Oliveira, G.C.; Dias Junior, M.S.; Curi, N.; Costa, K.A.P.; Carducci, C.E. Preconsolidation pressure, soil water retention characteristics, and texture of Latosols in the Brazilian Cerrado. Soil Res. 2013, 51, 193–202. [Google Scholar] [CrossRef]
  46. Silva, V.R.; Reinert, D.J.; Reichert, J.M.; Soares, J.M. Fatores controladores da compressibilidade de um Argissolo Vermelho amarelo distrófico arênico e de um Latossolo Vermelho distrófico típico. I—estado inicial de compactação. Ver. Bras. Cien. Solo 2002, 26, 1–8. [Google Scholar] [CrossRef]
  47. Otto, R.; Silva, A.P.; Franco, H.J.C.; Oliveira, E.C.A.; Trivelin, P.C.O. High soil penetration resistance reduces sugarcane root system development. Soil Tillage Res. 2011, 117, 201–210. [Google Scholar] [CrossRef]
  48. Reichert, J.M.; Susuki, L.E.A.; Reinert, D.J. Compactação do solo em sistemas agropecuários e florestais: Identificação, efeitos, limites críticos e mitigação. Top. Ciên. Solo 2007, 5, 49–134. [Google Scholar]
  49. Mendonça, V.Z.; Mello, L.M.; Andreotti, L.; Pereira, R.C.; Lima, F.C.B.L.; Valério Filho, W.V.V.; Yano, E.H. Avaliação dos atributos físicos do solo em consórcio com forrageiras e milho em sucessão com soja em região do cerrado. Ver. Bras. Cien. Solo 2013, 37, 251–259. [Google Scholar] [CrossRef]
  50. Reichert, J.M.; Mentges, M.I.; Rodrigues, M.F.; Cavalli, J.P.; Awe, G.O.; Mentges, L.R. Compressibility and elasticity of subtropical no-till soils varying in granulometry organic matter, bulk density and moisture. Catena 2018, 165, 345–357. [Google Scholar] [CrossRef]
  51. Isaaks, E.H.; Srivastava, R.M. An Introduction to Applied Geostatistics; Oxford University: New York, NY, USA, 1989. [Google Scholar]
Figure 1. Sampling grid of an Oxisol under sugarcane crops: (A) burned harvest area (n = 120); (B) mechanized harvest area (n = 121).
Sustainability 15 15185 g001
Figure 2. Load-bearing capacity models (σp = 10(a+bU)) of an Oxisol after the application of the statistical procedure by [34]. (a) Burned harvest sugarcane at the 0.00–0.30 m layer; (bd) mechanized harvest sugarcane at 0.00–0.10-, 0.10–0.20-, and 0.20–0.30 m layers, respectively; (e) native forest at 0.00–0.30 m layer. Points within each chart correspond to the σp for the respective soil consistency limits: SL = shrinkage limit, PL = plastic limit, LL = liquid limit. Auc: area under the load-bearing capacity curve in the soil friability region.
Sustainability 15 15185 g002
Figure 3. Average values for physical attributes of an Oxisol under burned and mechanized harvest sugarcane crops and native forest. Bars indicate the standard deviation.
Sustainability 15 15185 g003
Table 1. Parameters of the load-bearing capacity models of an Oxisol under burned and mechanized harvest sugarcane crops and native forest.
Management SystemSoil LayerModel Parameters
Linear Coefficient,
a
Angular Coefficient,
b
R2
Burned harvest sugarcane0.00–0.10 m2.7095 *−1.5567 *0.90 *
0.10–0.20 m2.7892 *−1.7969 *0.96 *
0.20–0.30 m2.7437 *−1.4356 *0.97 *
0.00–0.30 m2.7443 *−1.5829 *0.93 *
Mechanized harvest sugarcane0.00–0.10 m2.7354 *−1.5129 *0.78 *
0.10–0.20 m2.7908 *−1.2195 *0.93 *
0.20–0.30 m2.8079 *−1.6094 *0.87 *
Native forest0.00–0.10 m2.6654 *−0.9691 *0.80 *
0.10–0.20 m2.6820 *−0.9823 *0.88 *
0.20–0.30 m2.6678 *−1.1414 *0.81 *
0.00–0.30 m2.6756 *−1.0432 *0.83 *
R2 = coefficient of determination; * = significant at p < 0.01.
Table 2. Comparison of load-bearing capacity models for an Oxisol under burned and mechanized harvest sugarcane crops and native forest via a procedure described by [34].
Comparison of Models between Layers within the
Management System
Data
Homogeneity
F-Test
Linear
Coefficient, a
Angular
Coefficient, b
0.00–0.10 vs. 0.10–0.20Hnsns
Burned harvest0.00–0.10 vs. 0.20–0.30Hnsns
0.10–0.20 vs. 0.20–0.30Hnsns
0.00–0.10 vs. 0.10–0.20NHns**
Mechanized harvest0.00–0.10 vs. 0.20–0.30NHnsns
0.10–0.20 vs. 0.20–0.30NHnsns
0.00–0.10 vs. 0.10–0.20Hnsns
Native forest0.00–0.10 vs. 0.20–0.30Hnsns
0.10–0.20 vs. 0.20–0.30Hnsns
Comparison of the resulting models between management systems
Burned harvest (0.00–0.30 m) vs. Native Forest (0.00–0.30 m)NH****
Mechanized harvest (0.00–0.10 m) vs. Burned harvest (0.00–0.30 m)NHnsns
Mechanized harvest (0.10–0.20 m) vs. Burned harvest (0.00–0.30 m)H**ns
Mechanized harvest (0.20–0.30 m) vs. Burned harvest (0.00–0.30 m)H*ns
Mechanized harvest (0.00–0.10 m) vs. Native Forest (0.00–0.30 m)H*ns
Mechanized harvest (0.10–0.20 m) vs. Native Forest (0.00–0.30 m)Hns*
Mechanized harvest (0.20–0.30 m) vs. Native Forest (0.00–0.30 m)Hns**
H = homogeneous; NH = non-homogeneous; ns = not significant; * = significant at 5%; ** = significant at 1%.
Table 3. Pearson’s correlation analysis of preconsolidation pressure (σp) and the physical attributes of an Oxisol under burned and mechanized harvesting sugarcane crops and native forest at the 0.00–0.010, 0.10–0.20, and 0.20–0.30 m layers.
Soil Physical Attributesσp (Burned Harvesting Sugarcane Area)σp (Mechanized Harvesting Sugarcane Area)
0.00–0.10 m0.10–0.20 m0.20–0.30 m0.00–0.10 m0.10–0.20 m0.20–0.30 m
Tp−0.13−0.09−0.010.06−0.06−0.05
MaP−0.02−0.11−0.100.070.09−0.008
MiP−0.080.060.09−0.05−0.14−0.02
Bd0.14−0.020.14−0.050.08−0.07
Snd0.010.21 *0.22 *0.11−0.10−0.004
Cly−0.00090.0050.10−0.090.08−0.04
Sil−0.01−0.16−0.26 *0.01−0.00010.05
U−0.99 **−0.68 **−0.99 **−0.96 **−0.99 **−0.98 *
SOM−0.080.10−0.24 *0.06−0.080.06
Tp = total porosity; MaP = macroporosity; MiP = microporosity; Bd = bulk density; Snd = sand; Cly = clay; Sil = silt; U = soil moisture; SOM = soil organic matter. * = significant at 5%; ** = significant at 1%.
Table 4. Estimated models and parameters of experimental semivariograms for preconsolidation pressure (σp) and water content in an Oxisol under burned and mechanized harvesting sugarcane at 0.00–0.010, 0.10–0.20, and 0.20–0.30 m layers.
ParameterPreconsolidation Pressure—σp (kPa)Soil Water Content—U (kg kg−1)
0.00–0.10 m0.10–0.20 m0.20–0.30 m0.00–0.10 m0.10–0.20 m0.20–0.30 m
Burned harvest
ModelSphericalSphericalSphericalSphericalSphericalSpherical
C00.1024.5000.100.470.370.44
C0 + C1143.70108.00115.202.481.702.01
a (m)19.3017.6019.4017.7018.9017.10
DSD (%)0.0722.290.0919.2121.8422.24
R2 (%)84.9080.7088.2074.3082.0090.10
SSR443.00114.00336.000.080.030.024
Mechanized harvest
ModelSphericalSphericalSphericalSphericalSphericalSpherical
C0920.00127.010.01.151.371.38
C0 + C112,300.00543.006357.012,410.005.955.83
a (m)18.2017.2017.3017.1017.2015.30
DSD (%)7.4823.390.029.2723.0123.66
R2 (%)94.5093.3991.1093.1092.3094.10
SSR619,015713.00299,371.00.630.110.09
C0 = nugget effect; C0 + C1 = threshold; a = range; DSD = degree of spatial dependence; R2 = model coefficient of determination; SSR = residual sum of squares.
Disclaimer/Publisher’s Note: The statements, opinions and data contained in all publications are solely those of the individual author(s) and contributor(s) and not of MDPI and/or the editor(s). MDPI and/or the editor(s) disclaim responsibility for any injury to people or property resulting from any ideas, methods, instructions or products referred to in the content.

