


Offshore Wind Power Resource Assessment in the Gulf of North Suez

 ,
,  , and
, and
Abstract
:1. Introduction
2. Important Aspects of Offshore Wind Power Development
3. Literature Review
4. Materials and Methods
4.1. Site Desrciption
4.2. Data Description
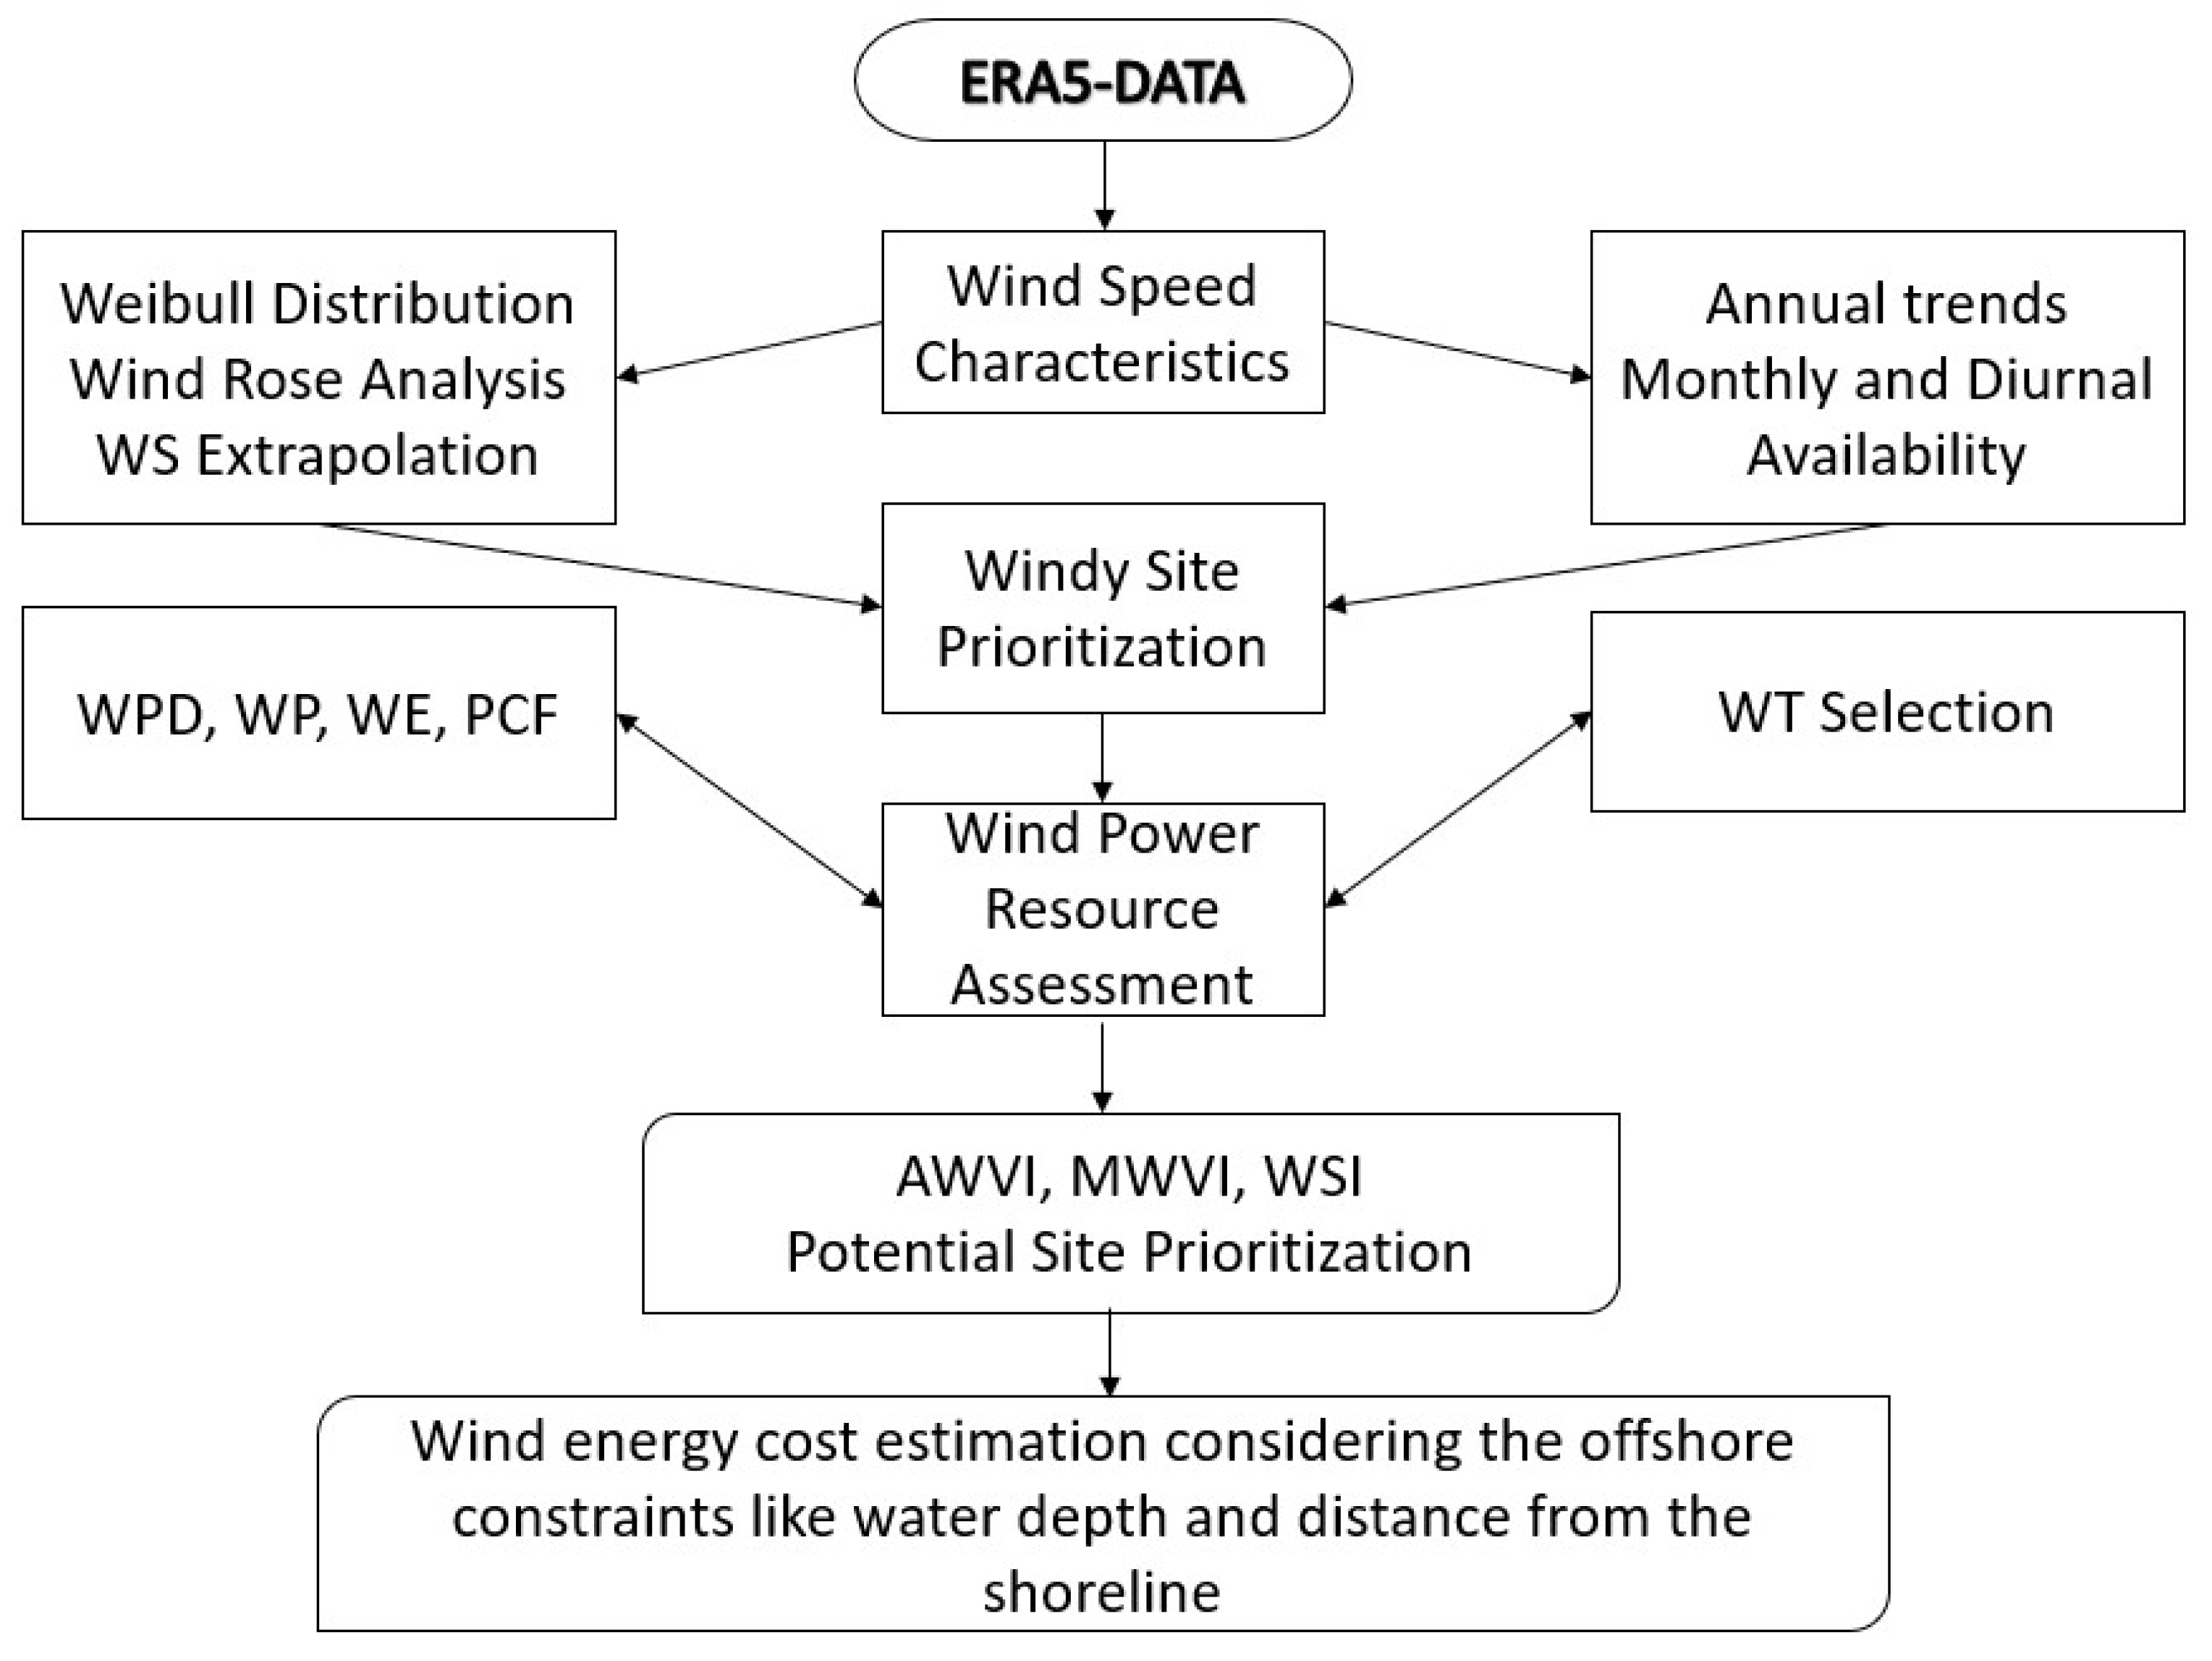
4.3. Methodology
4.3.1. Wind Speed Characteristics
4.3.2. Wind Power and Energy Estimation
4.3.3. Wind Energy Cost Estimation
5. Results and Discussion
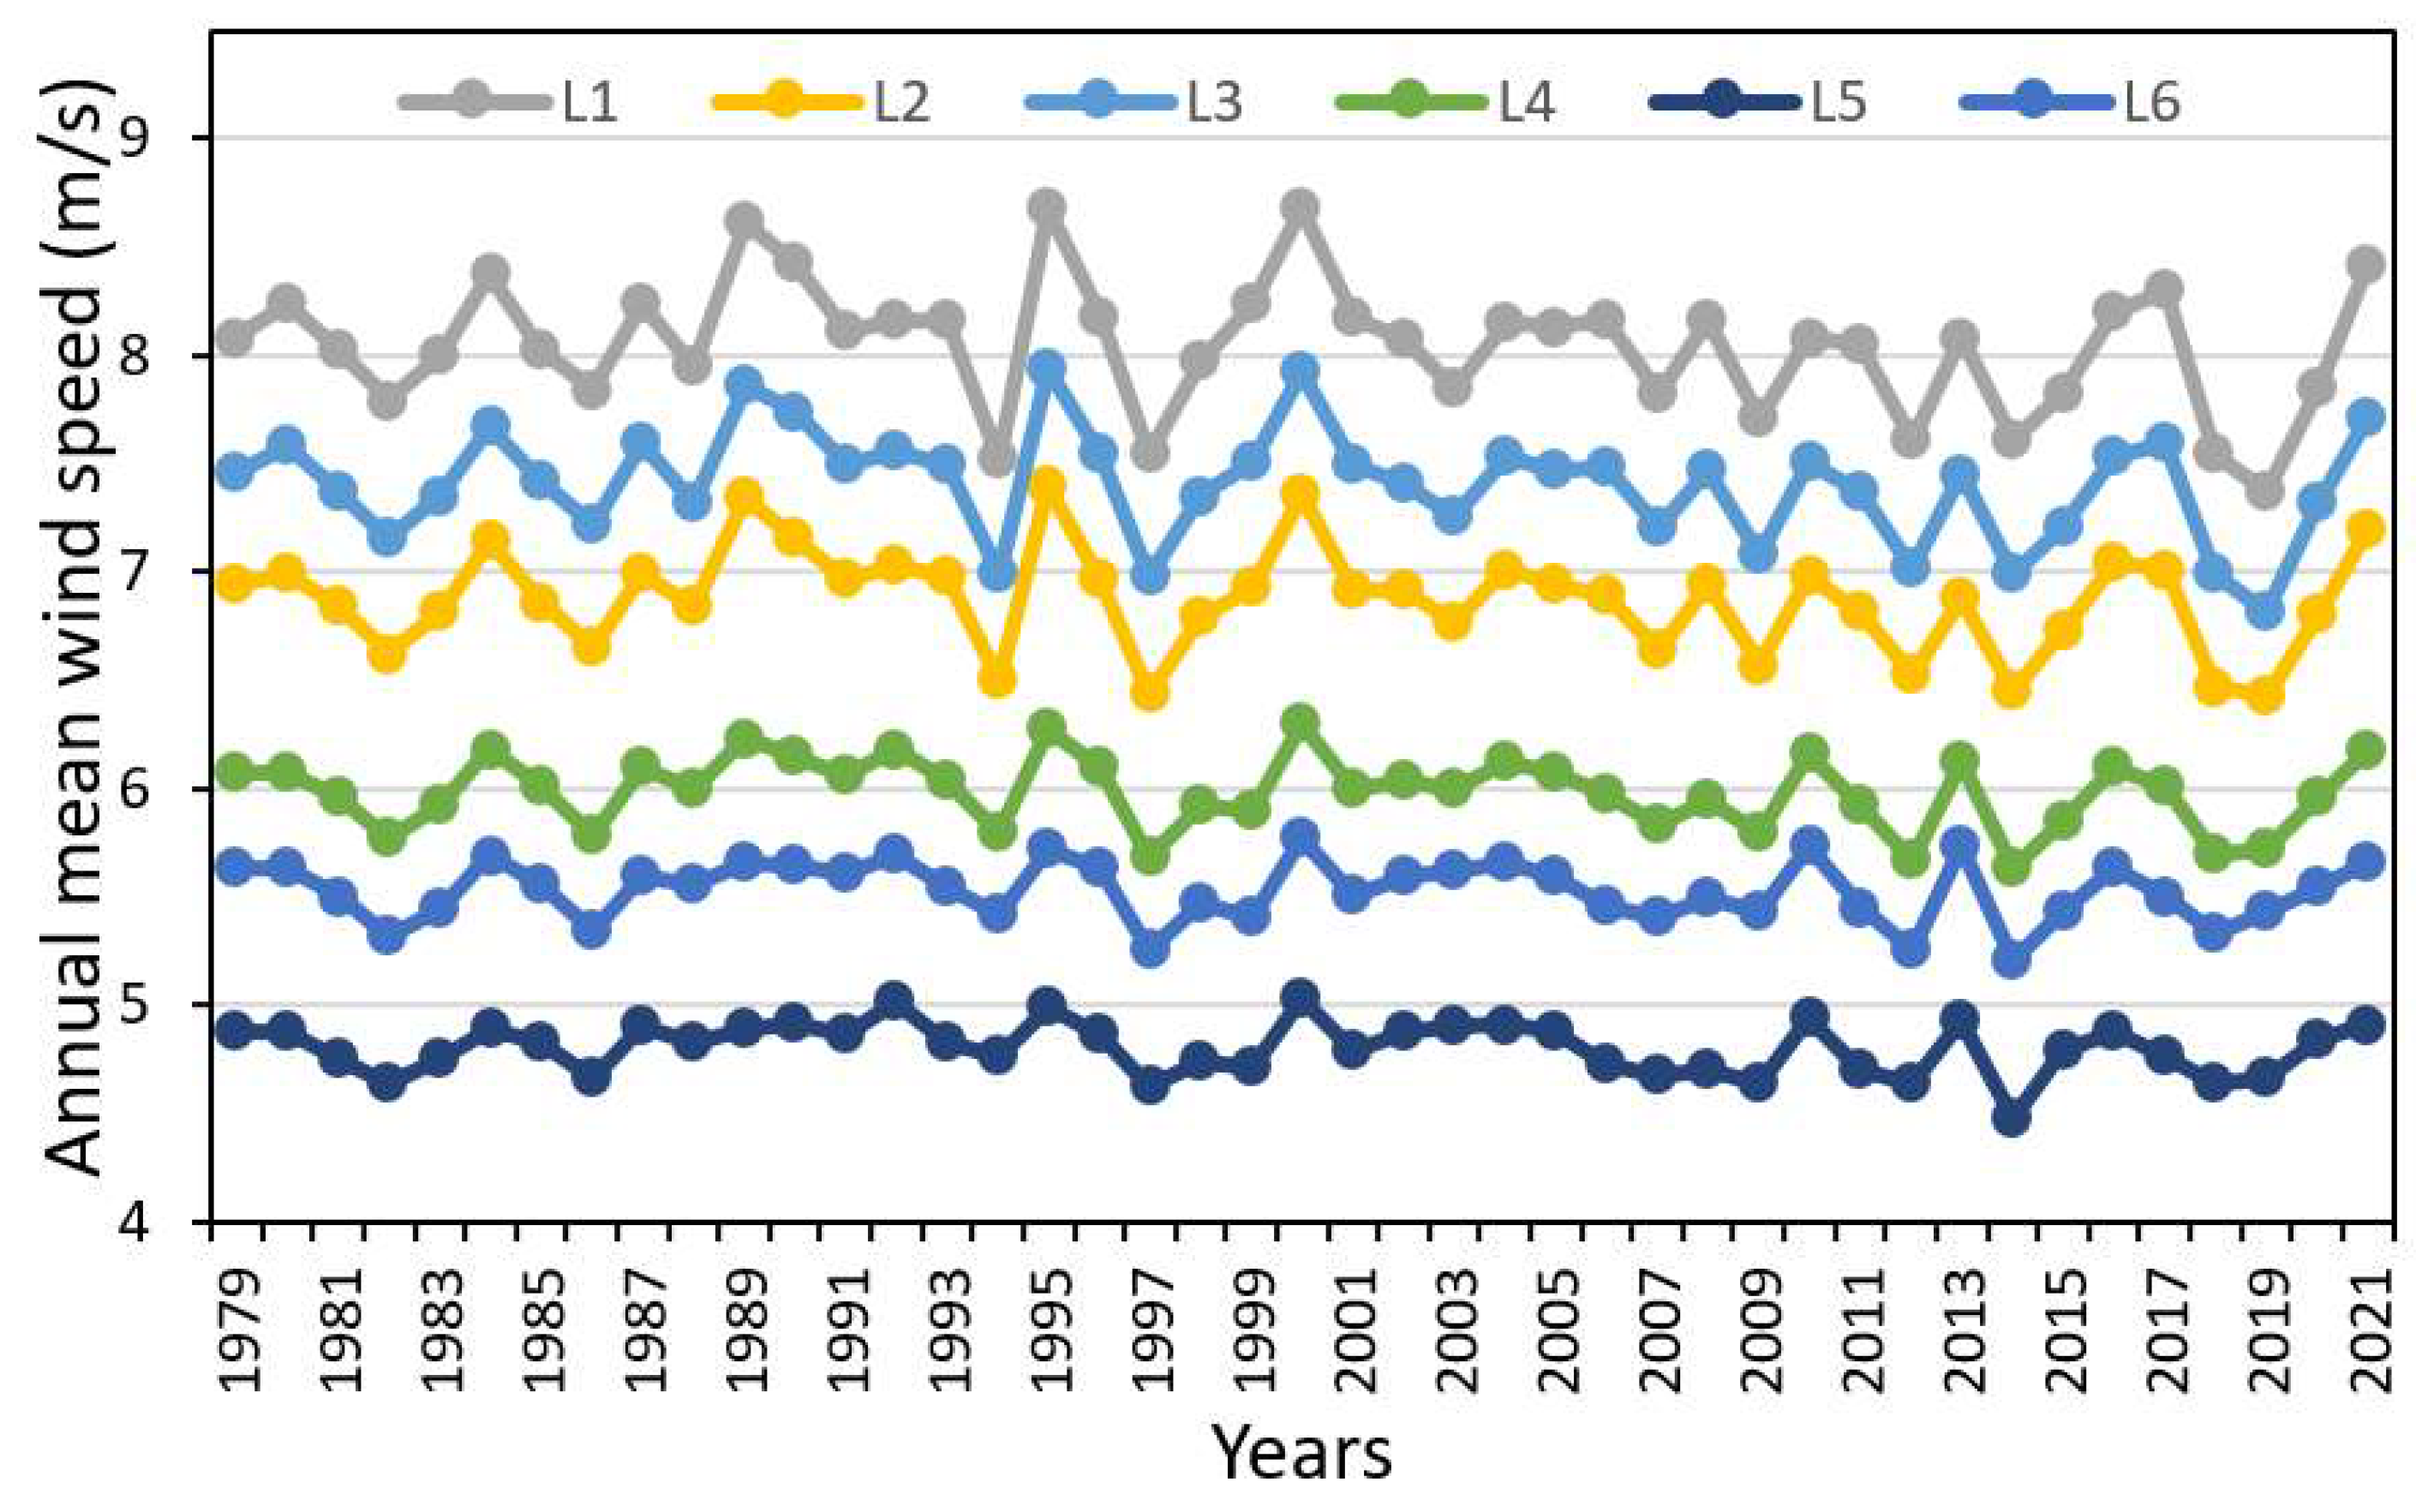
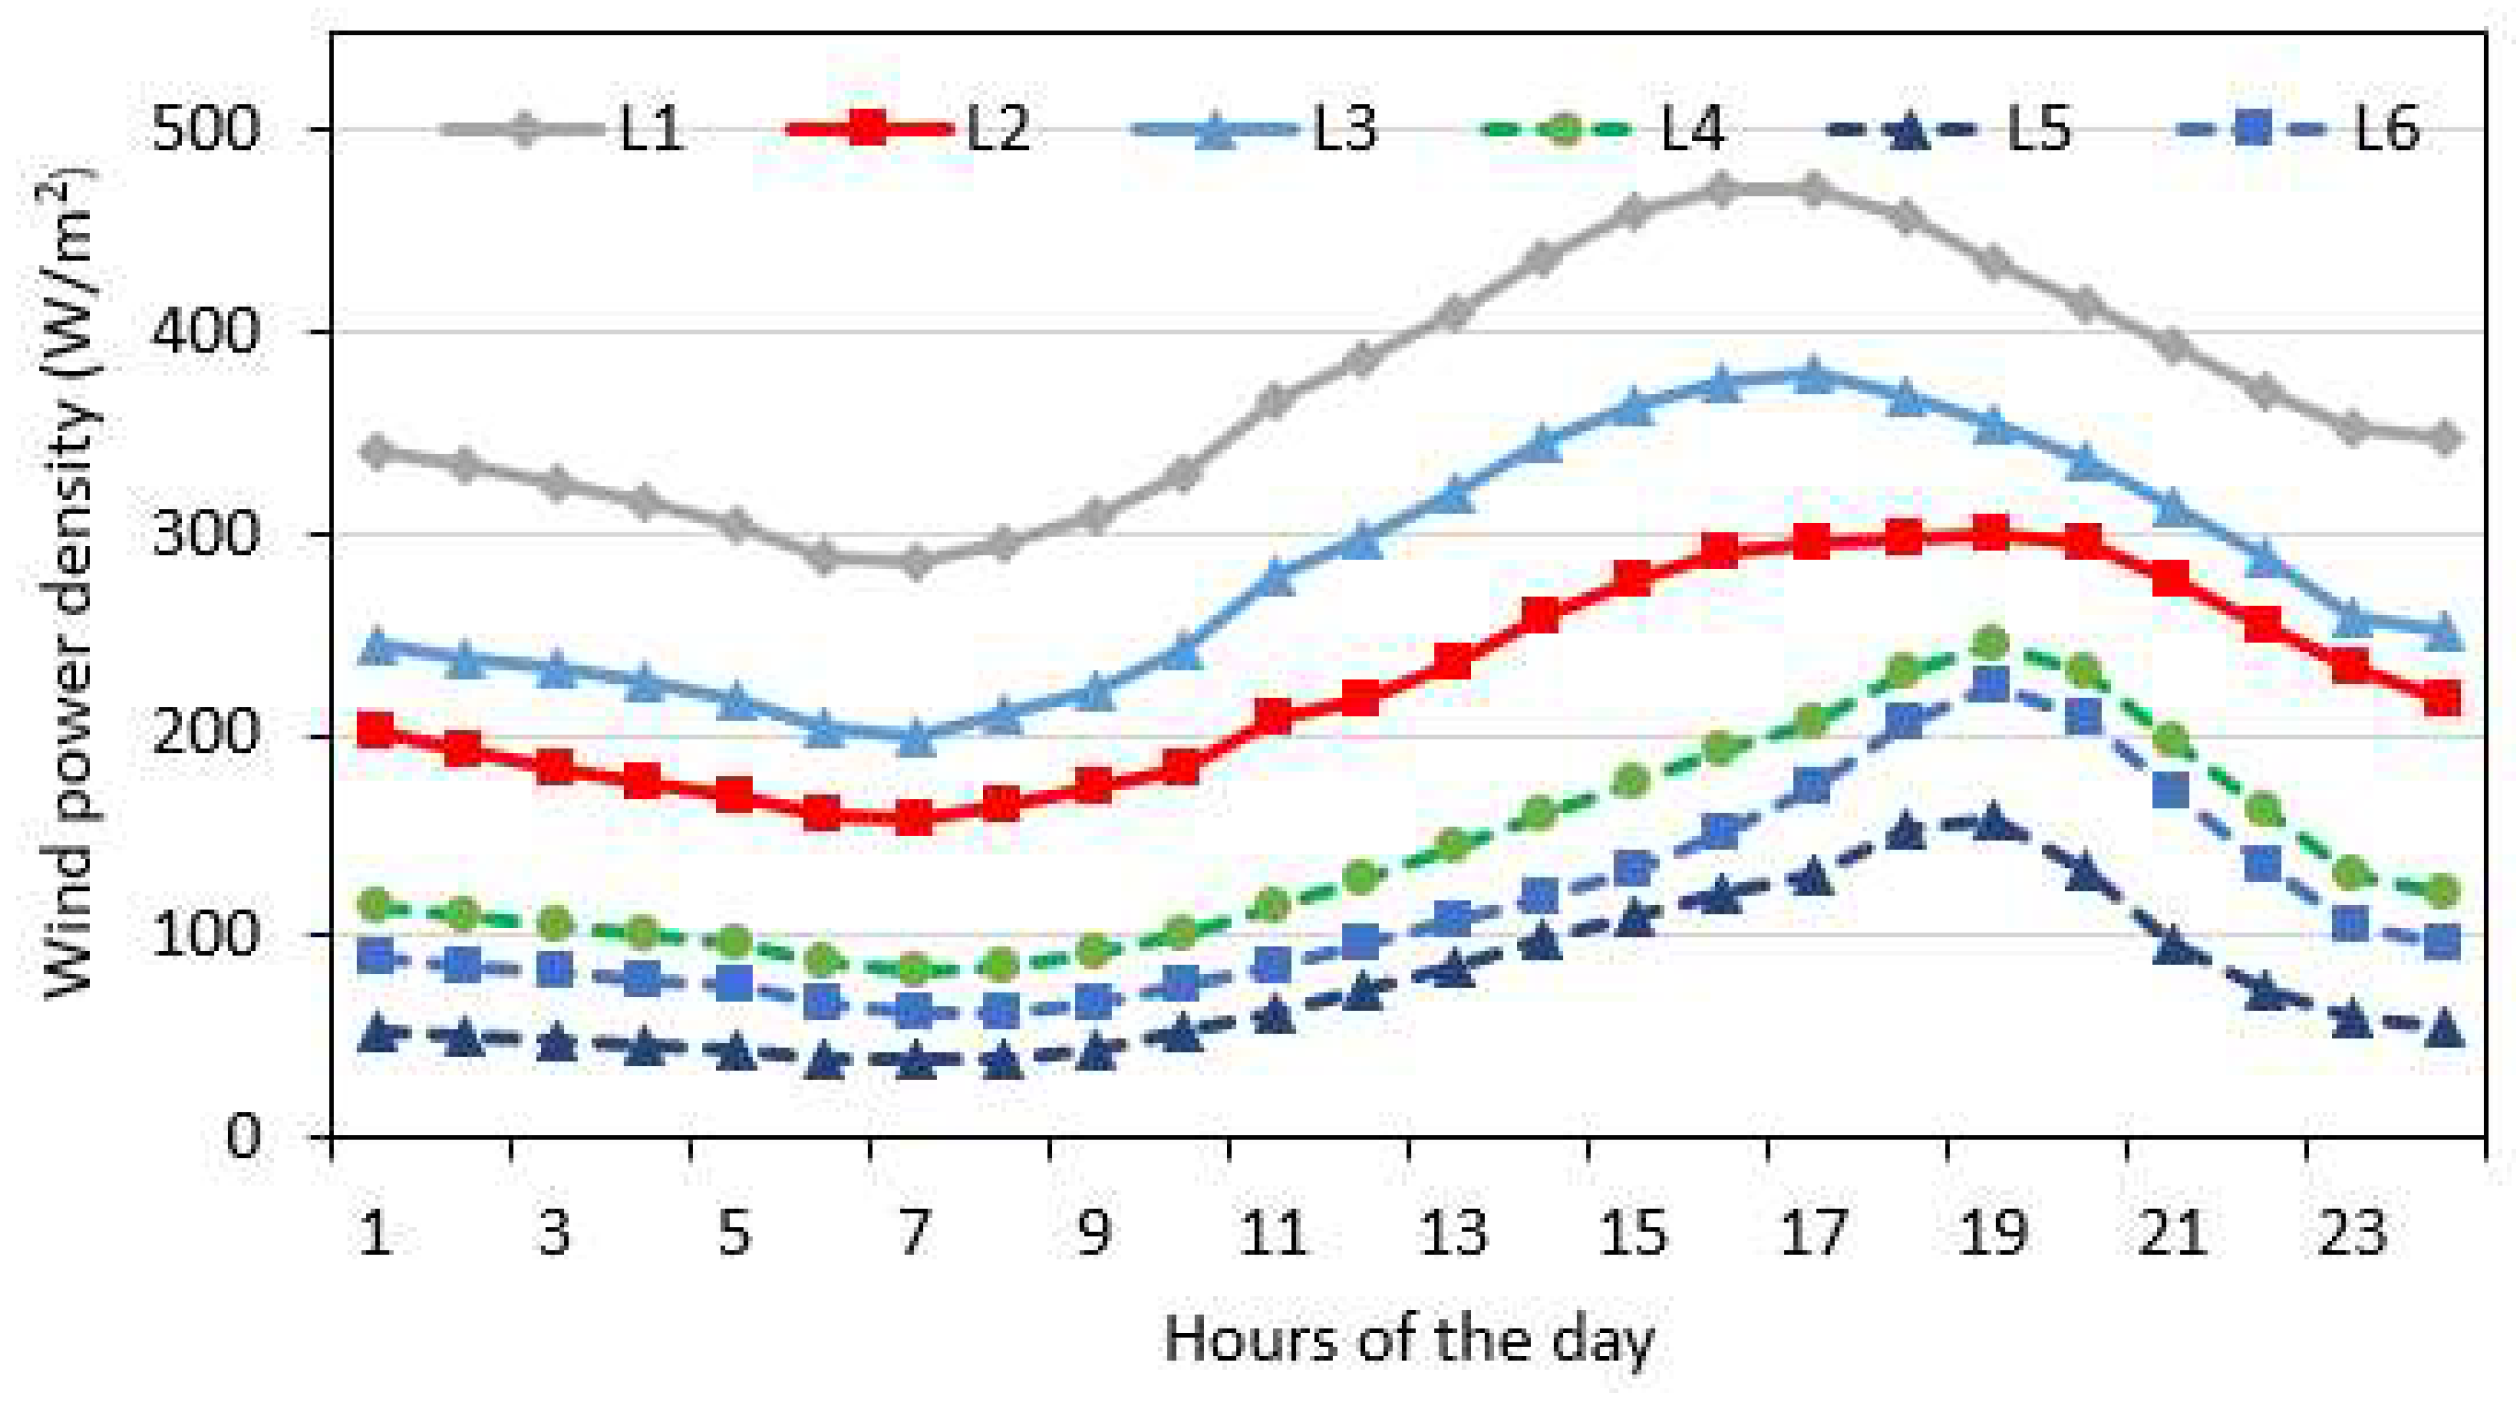
5.1. Variability of Wind Speed and Wind Power Density
5.2. Wind Variability Indices and Windy Site Identifier
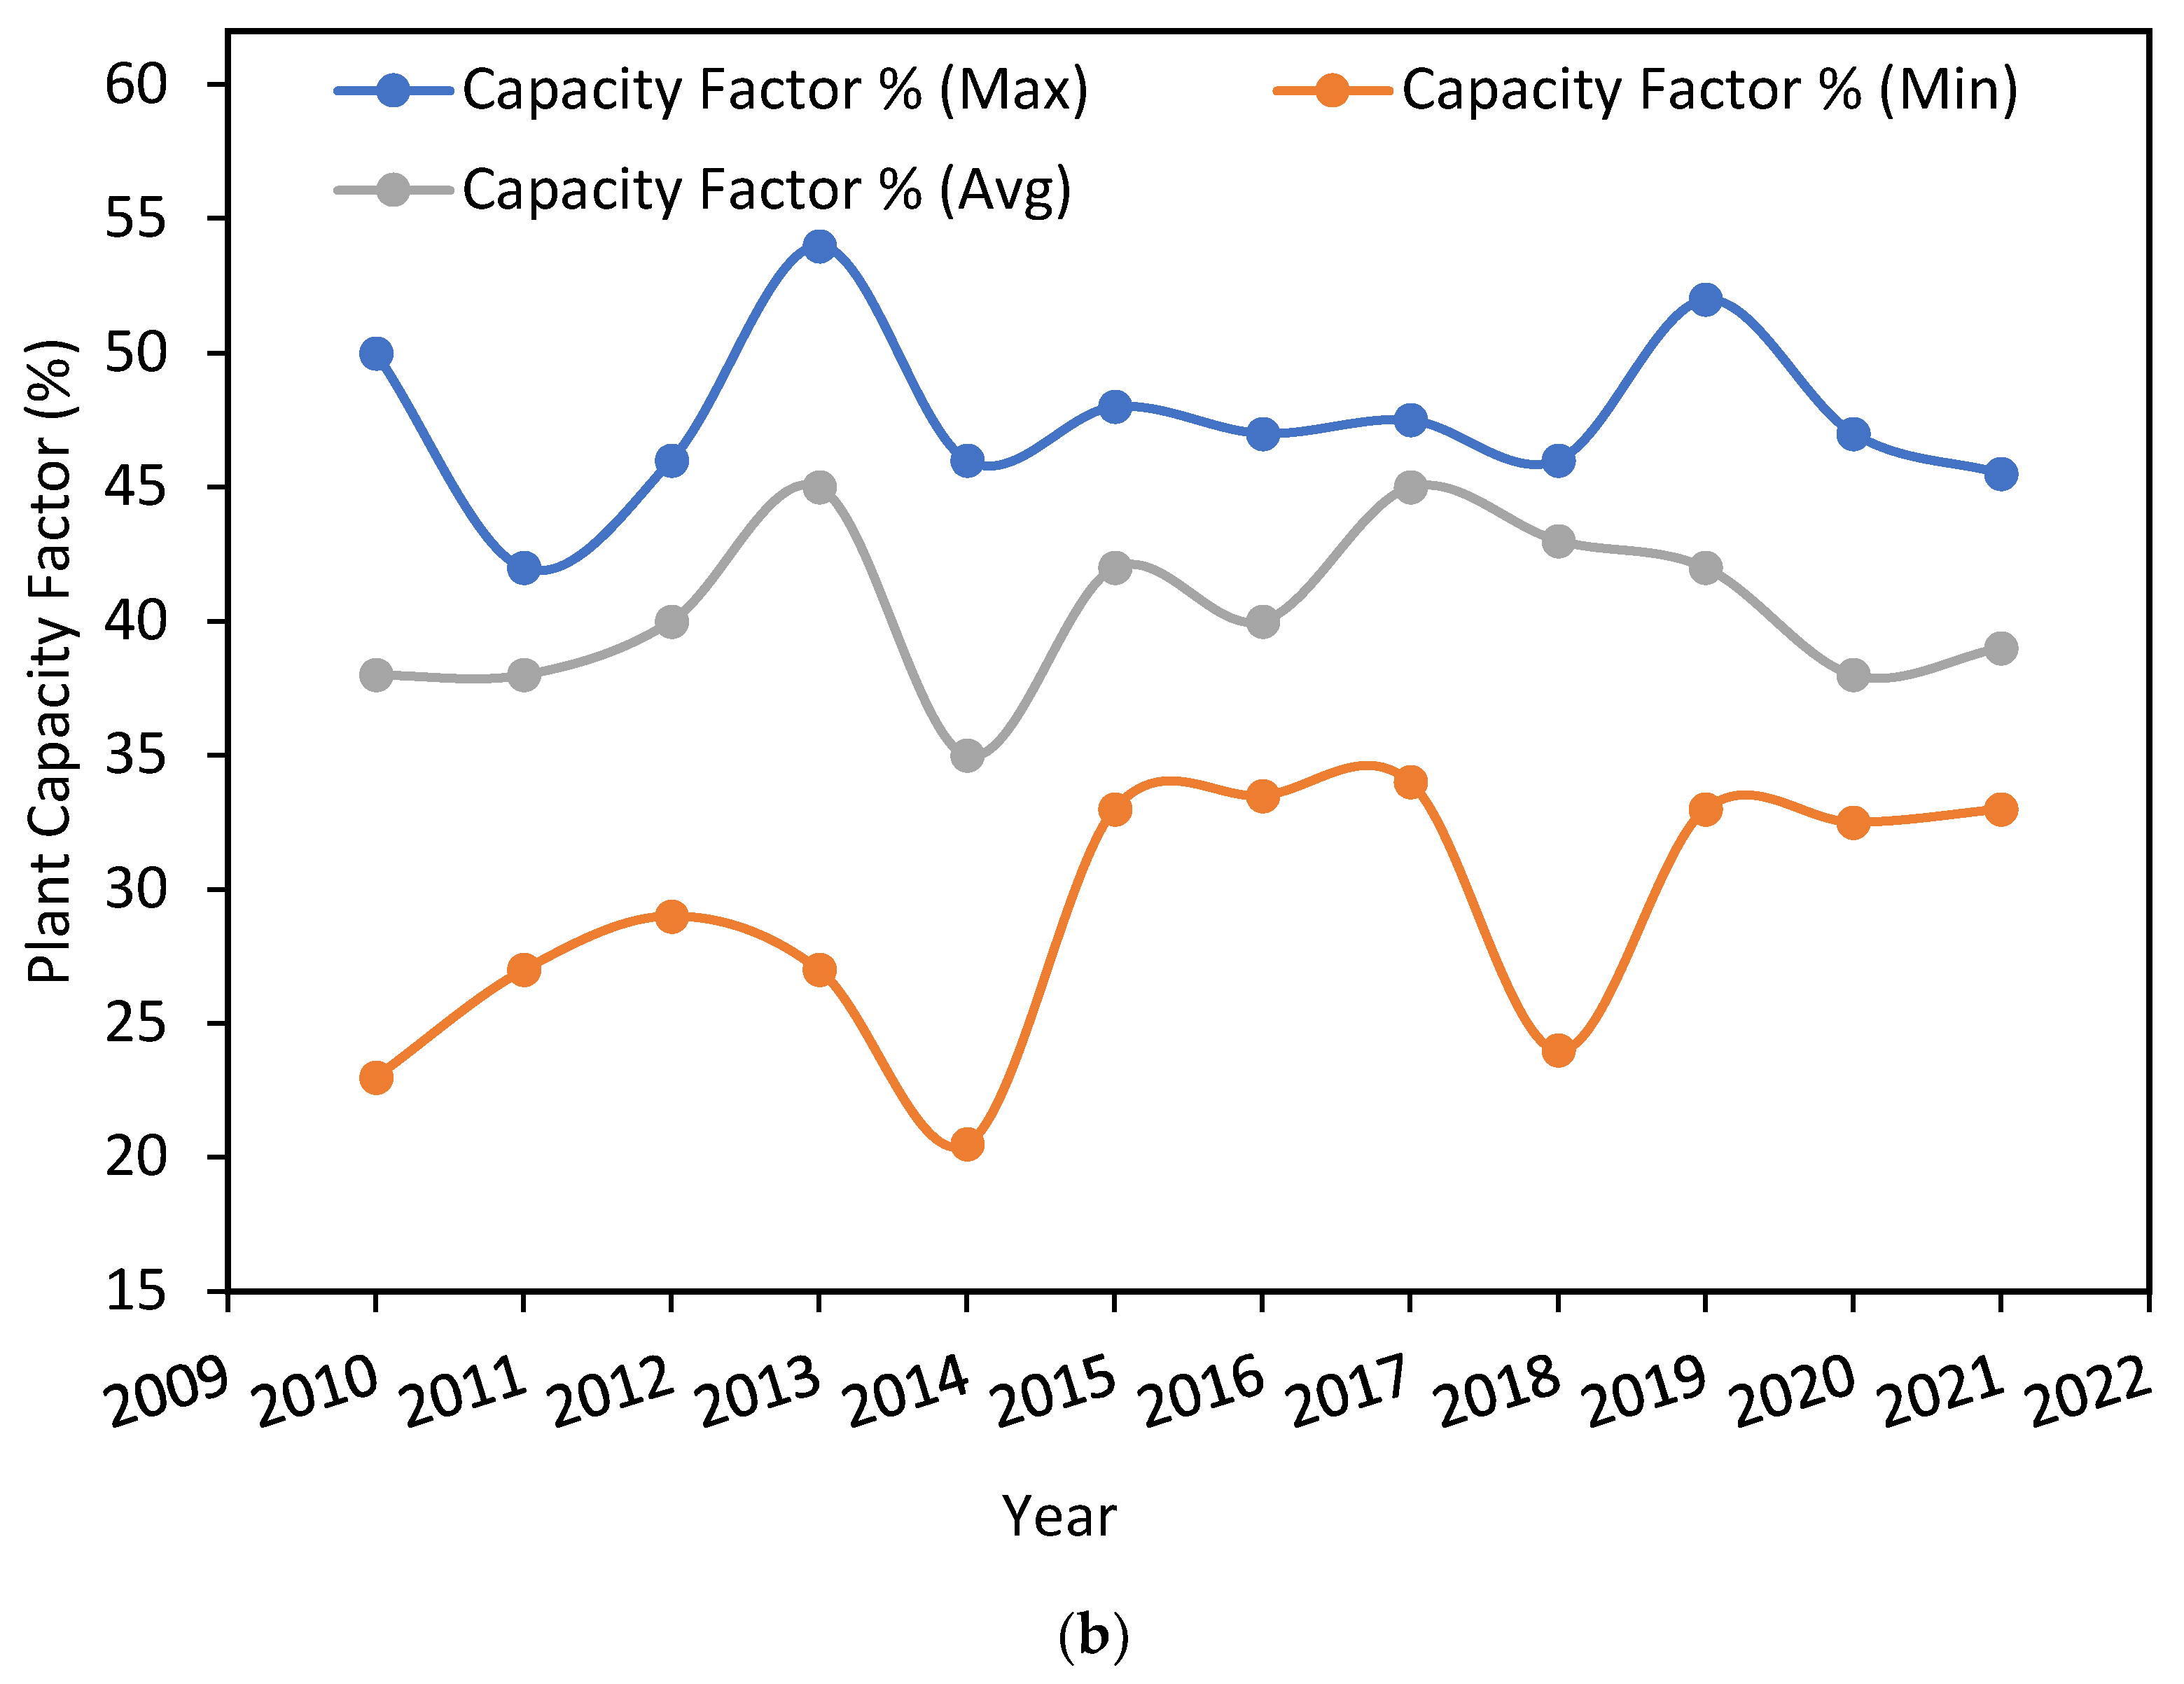
5.3. Wind Power Generation and Plant Capacity Factor Analysis
5.4. Effect of Hub Height on Annual Power Yield and PCF
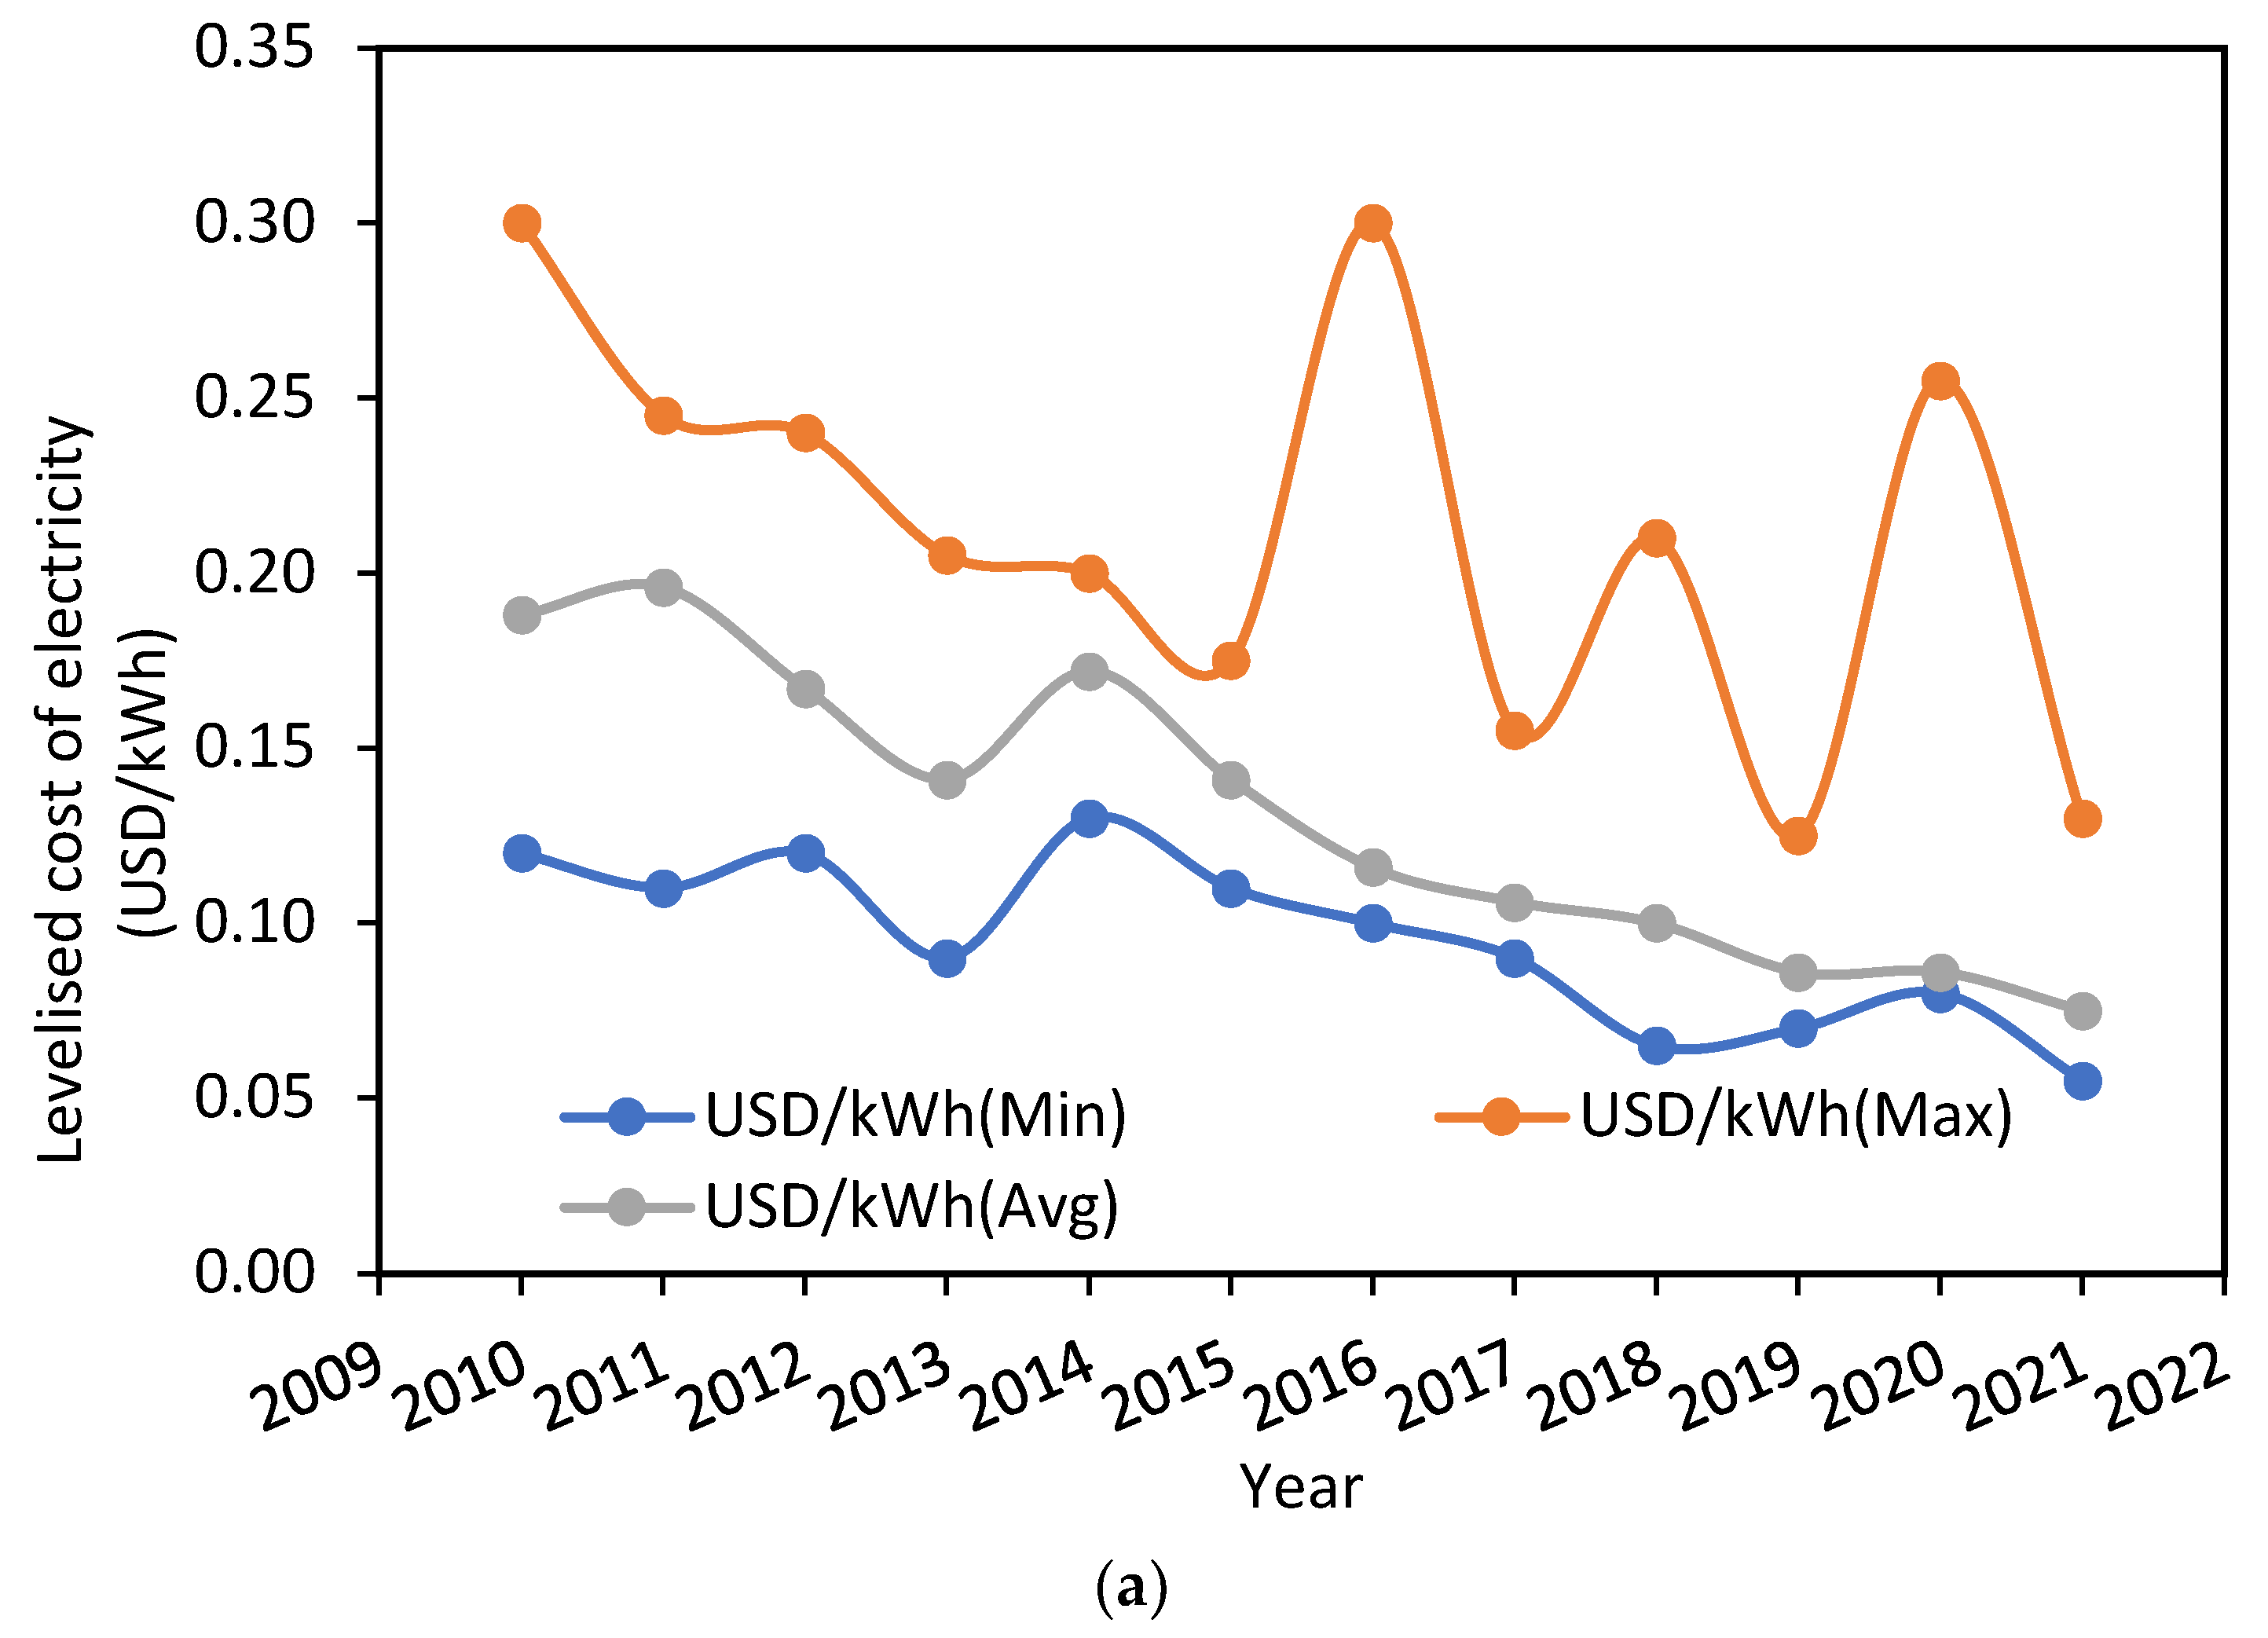
5.5. Levelized Cost of Energy (LCOE—USD/kWh)
6. Conclusions
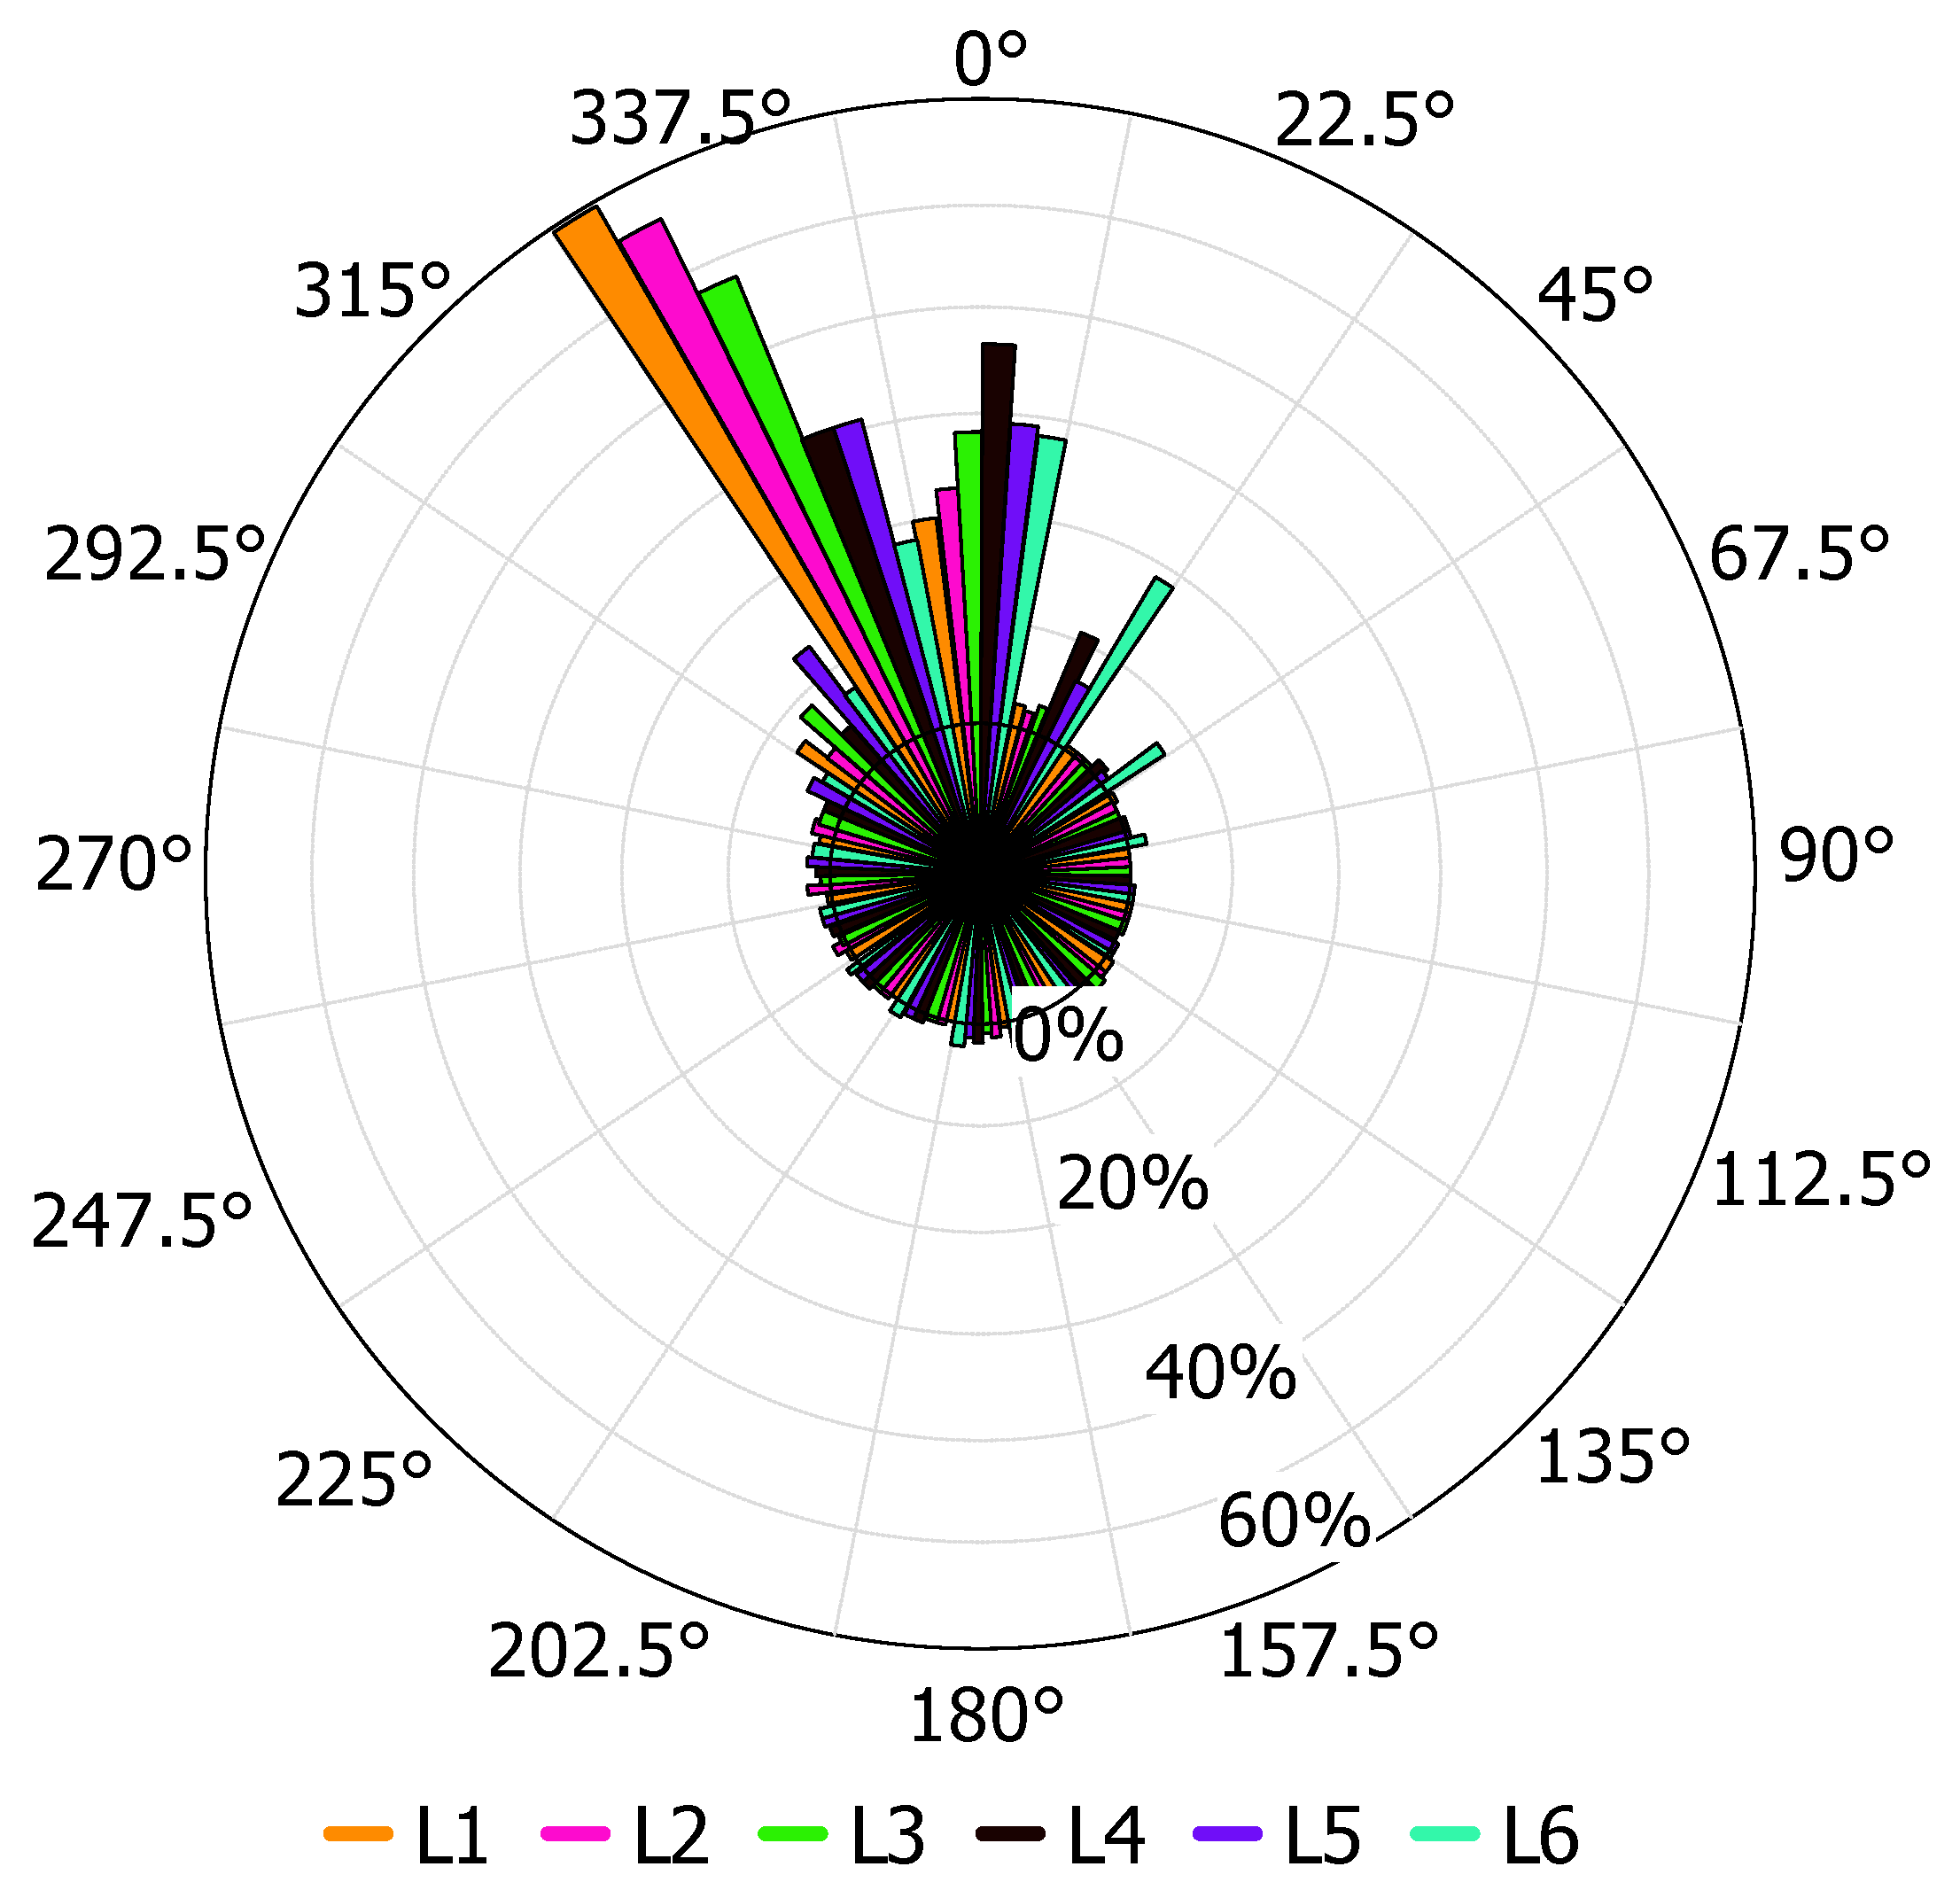
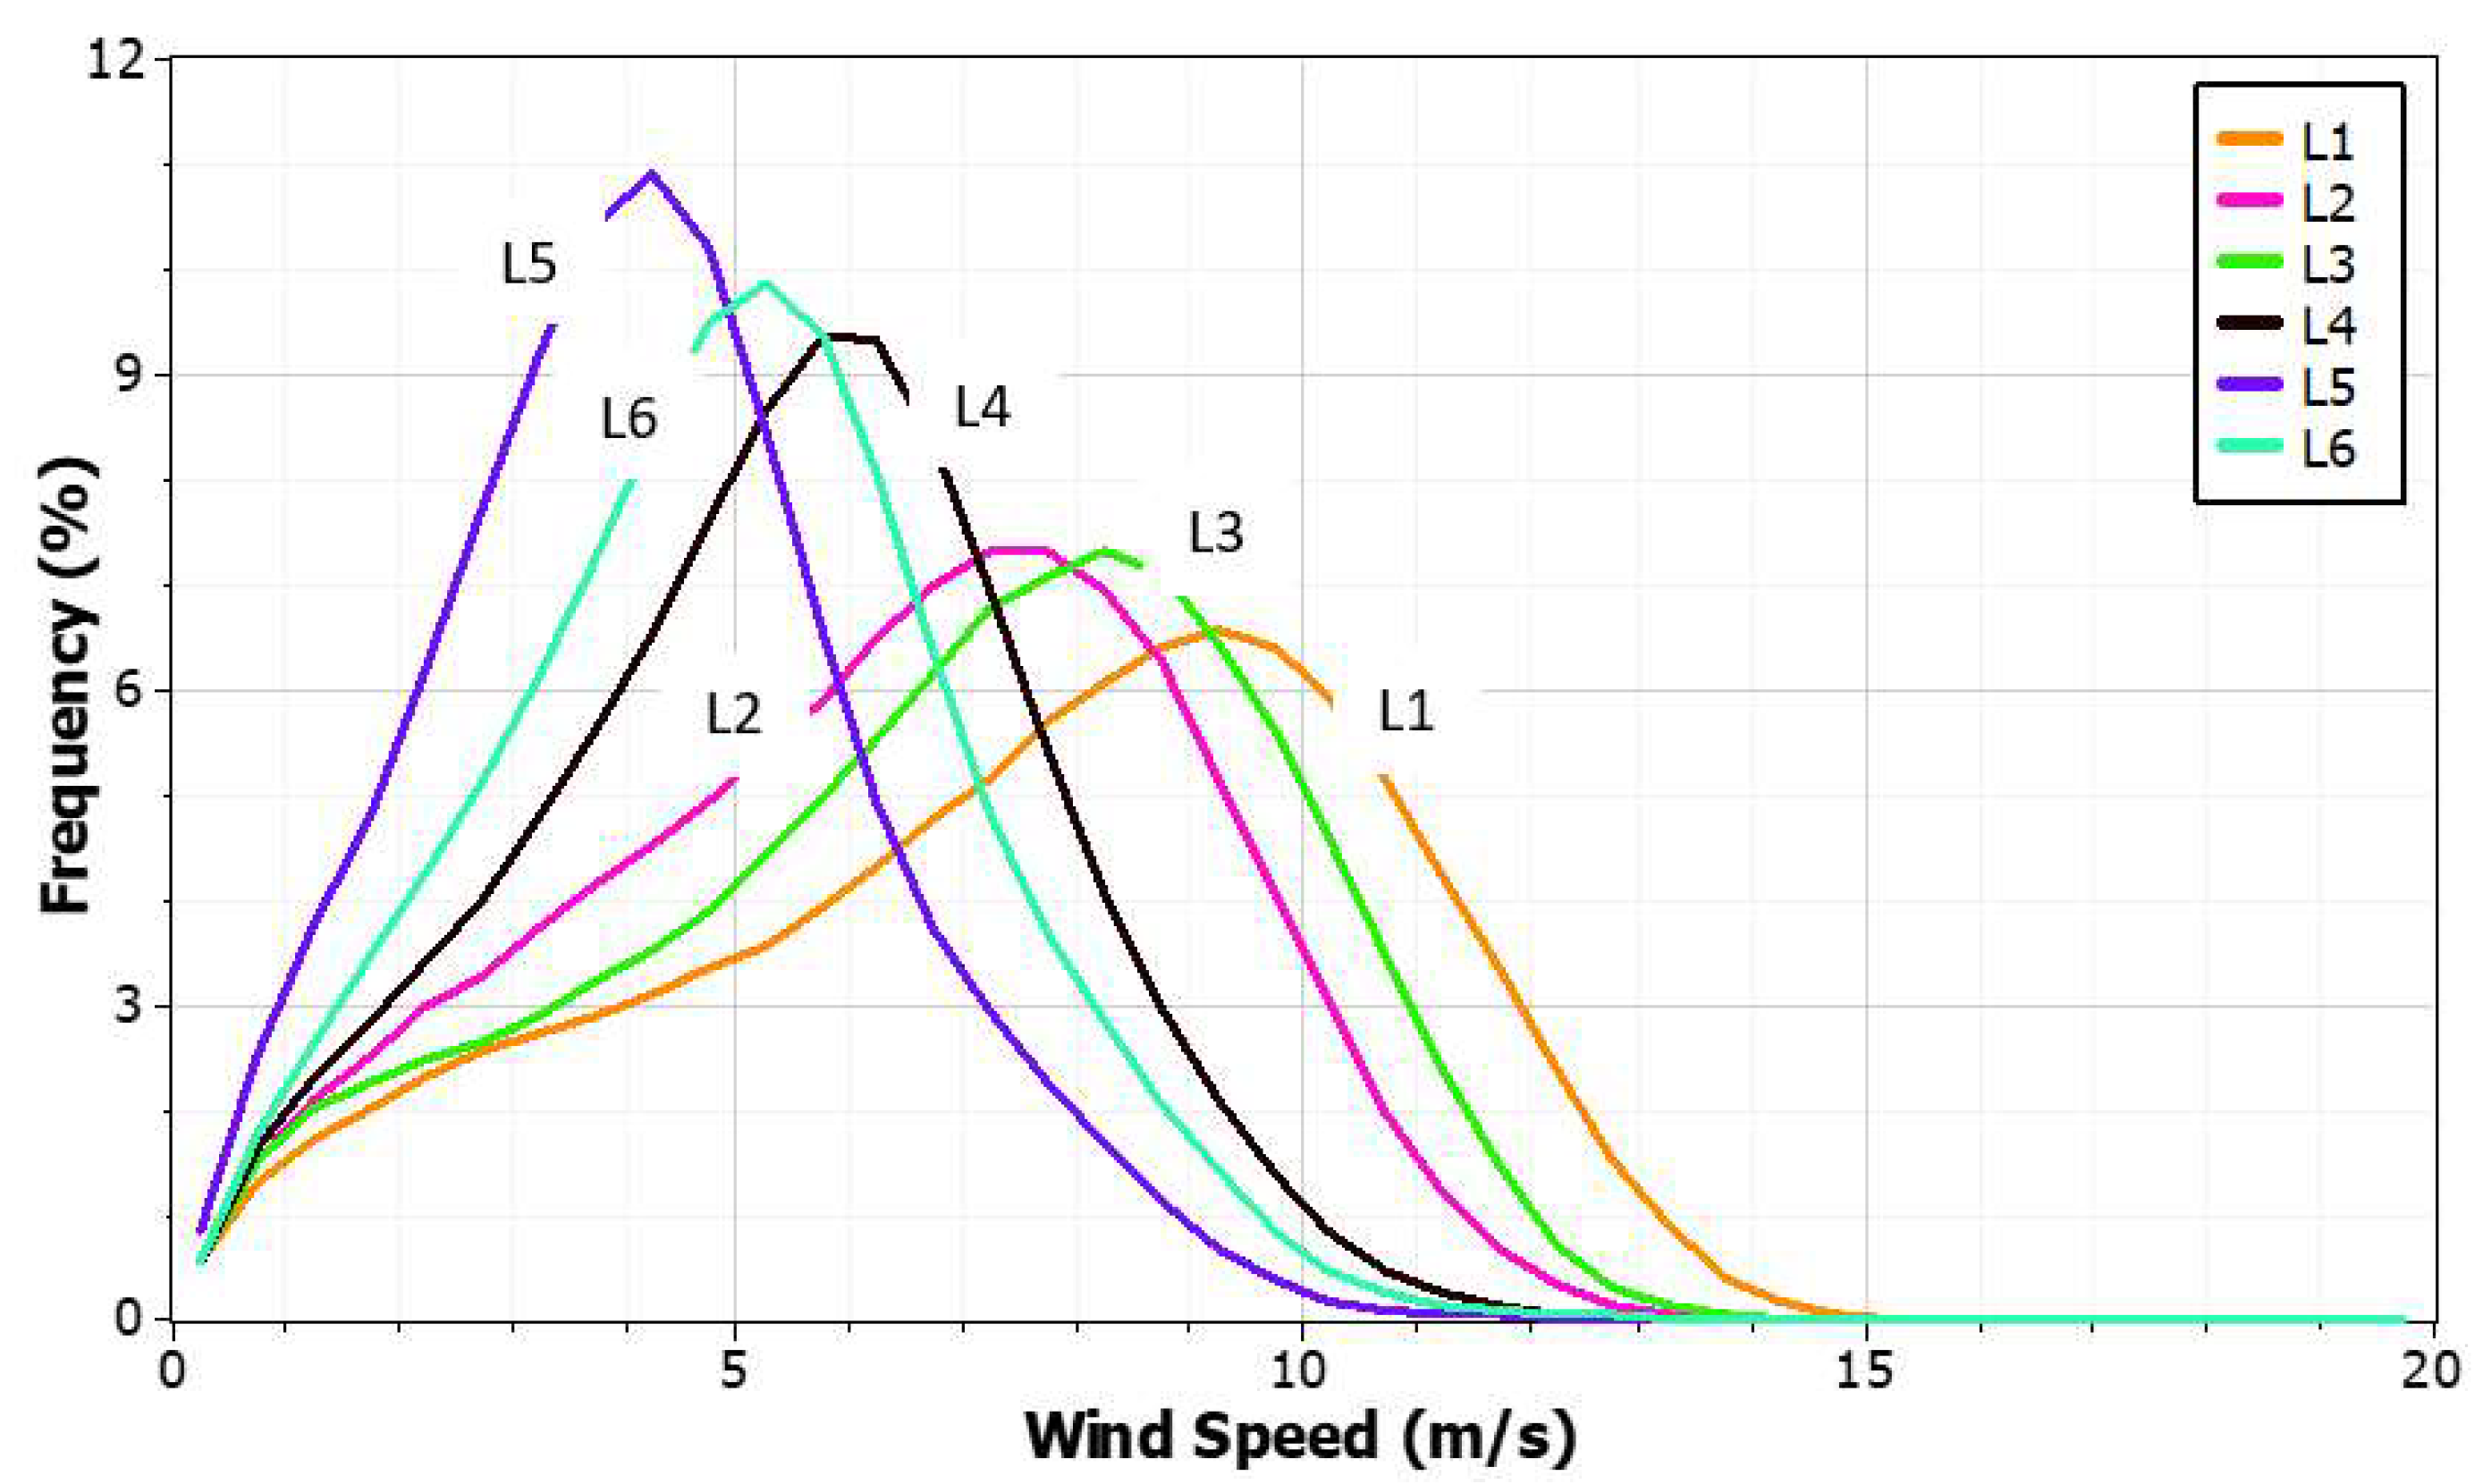
- The long-term mean wind speeds vary between 4.304 m/s and 7.547 m/s corresponding to the L5 and L1 sites, while the respective wind WPD values are estimated to be 77 W/m2 and 370 W/m2. The prevailing wind directions are found to be from the north and northwest. This means that less wind turbulence and wind-veering and backing effects result in less stress on the wind turbine structures, assuring a longer life for the wind turbines.
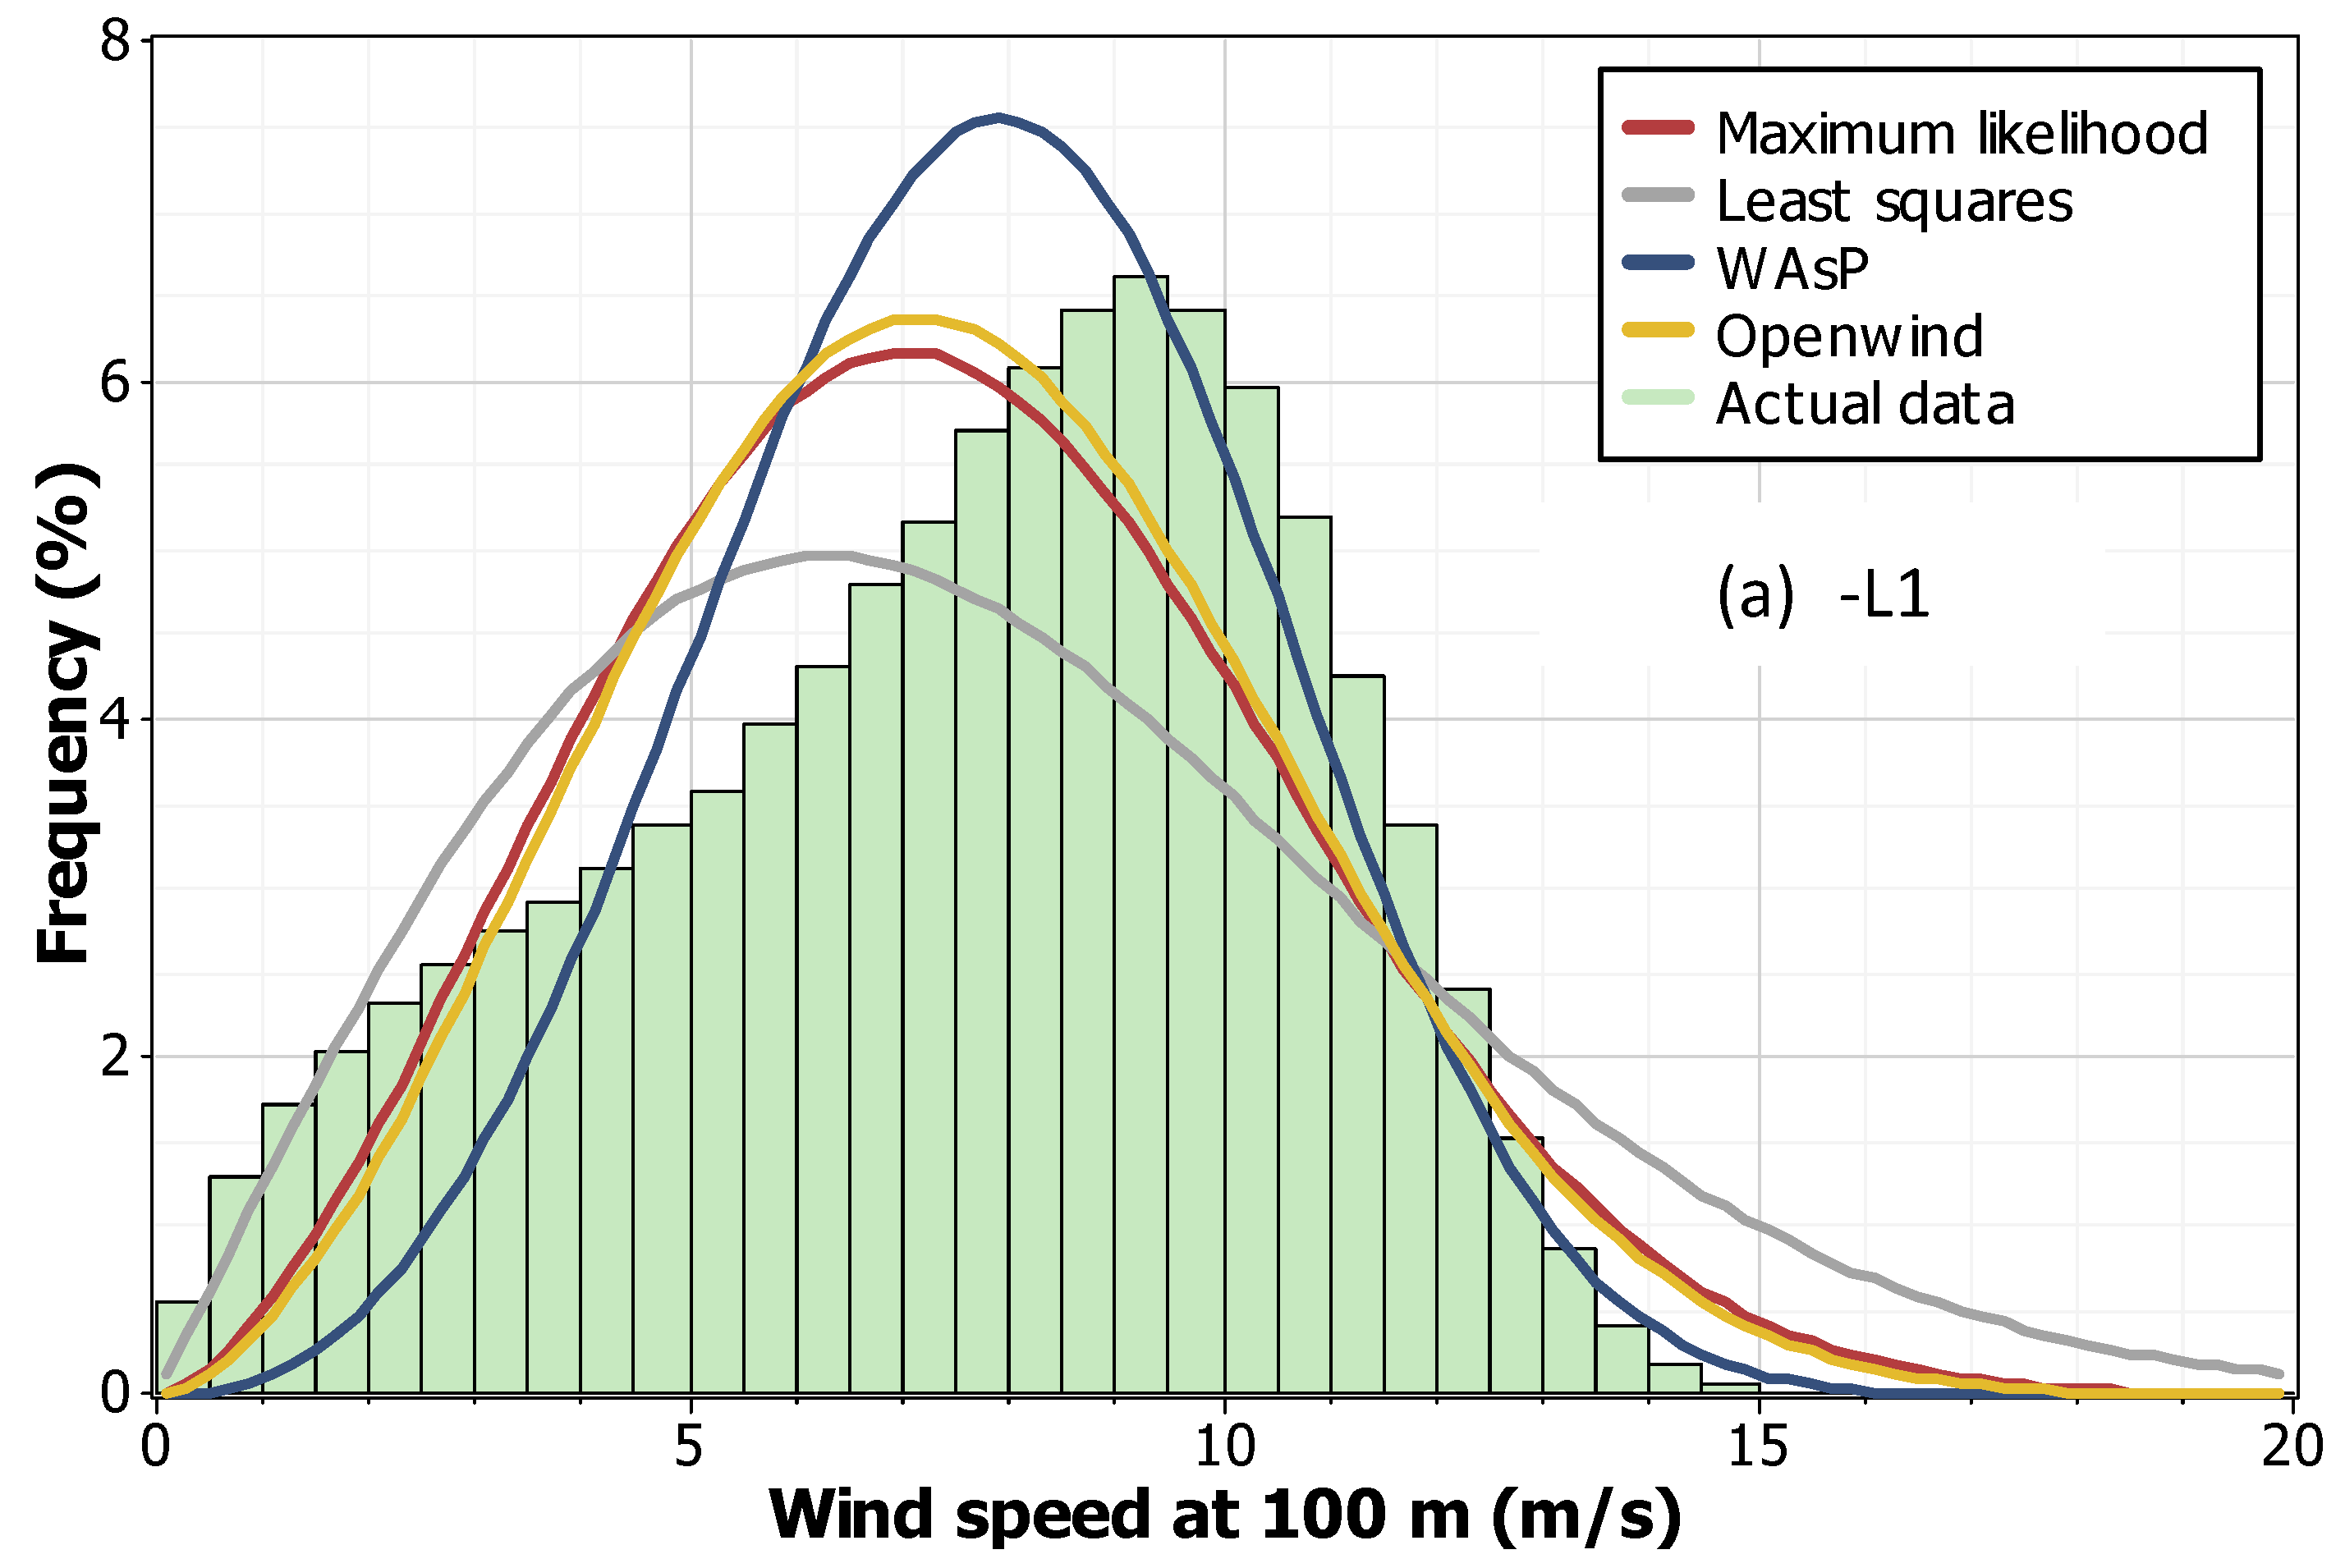
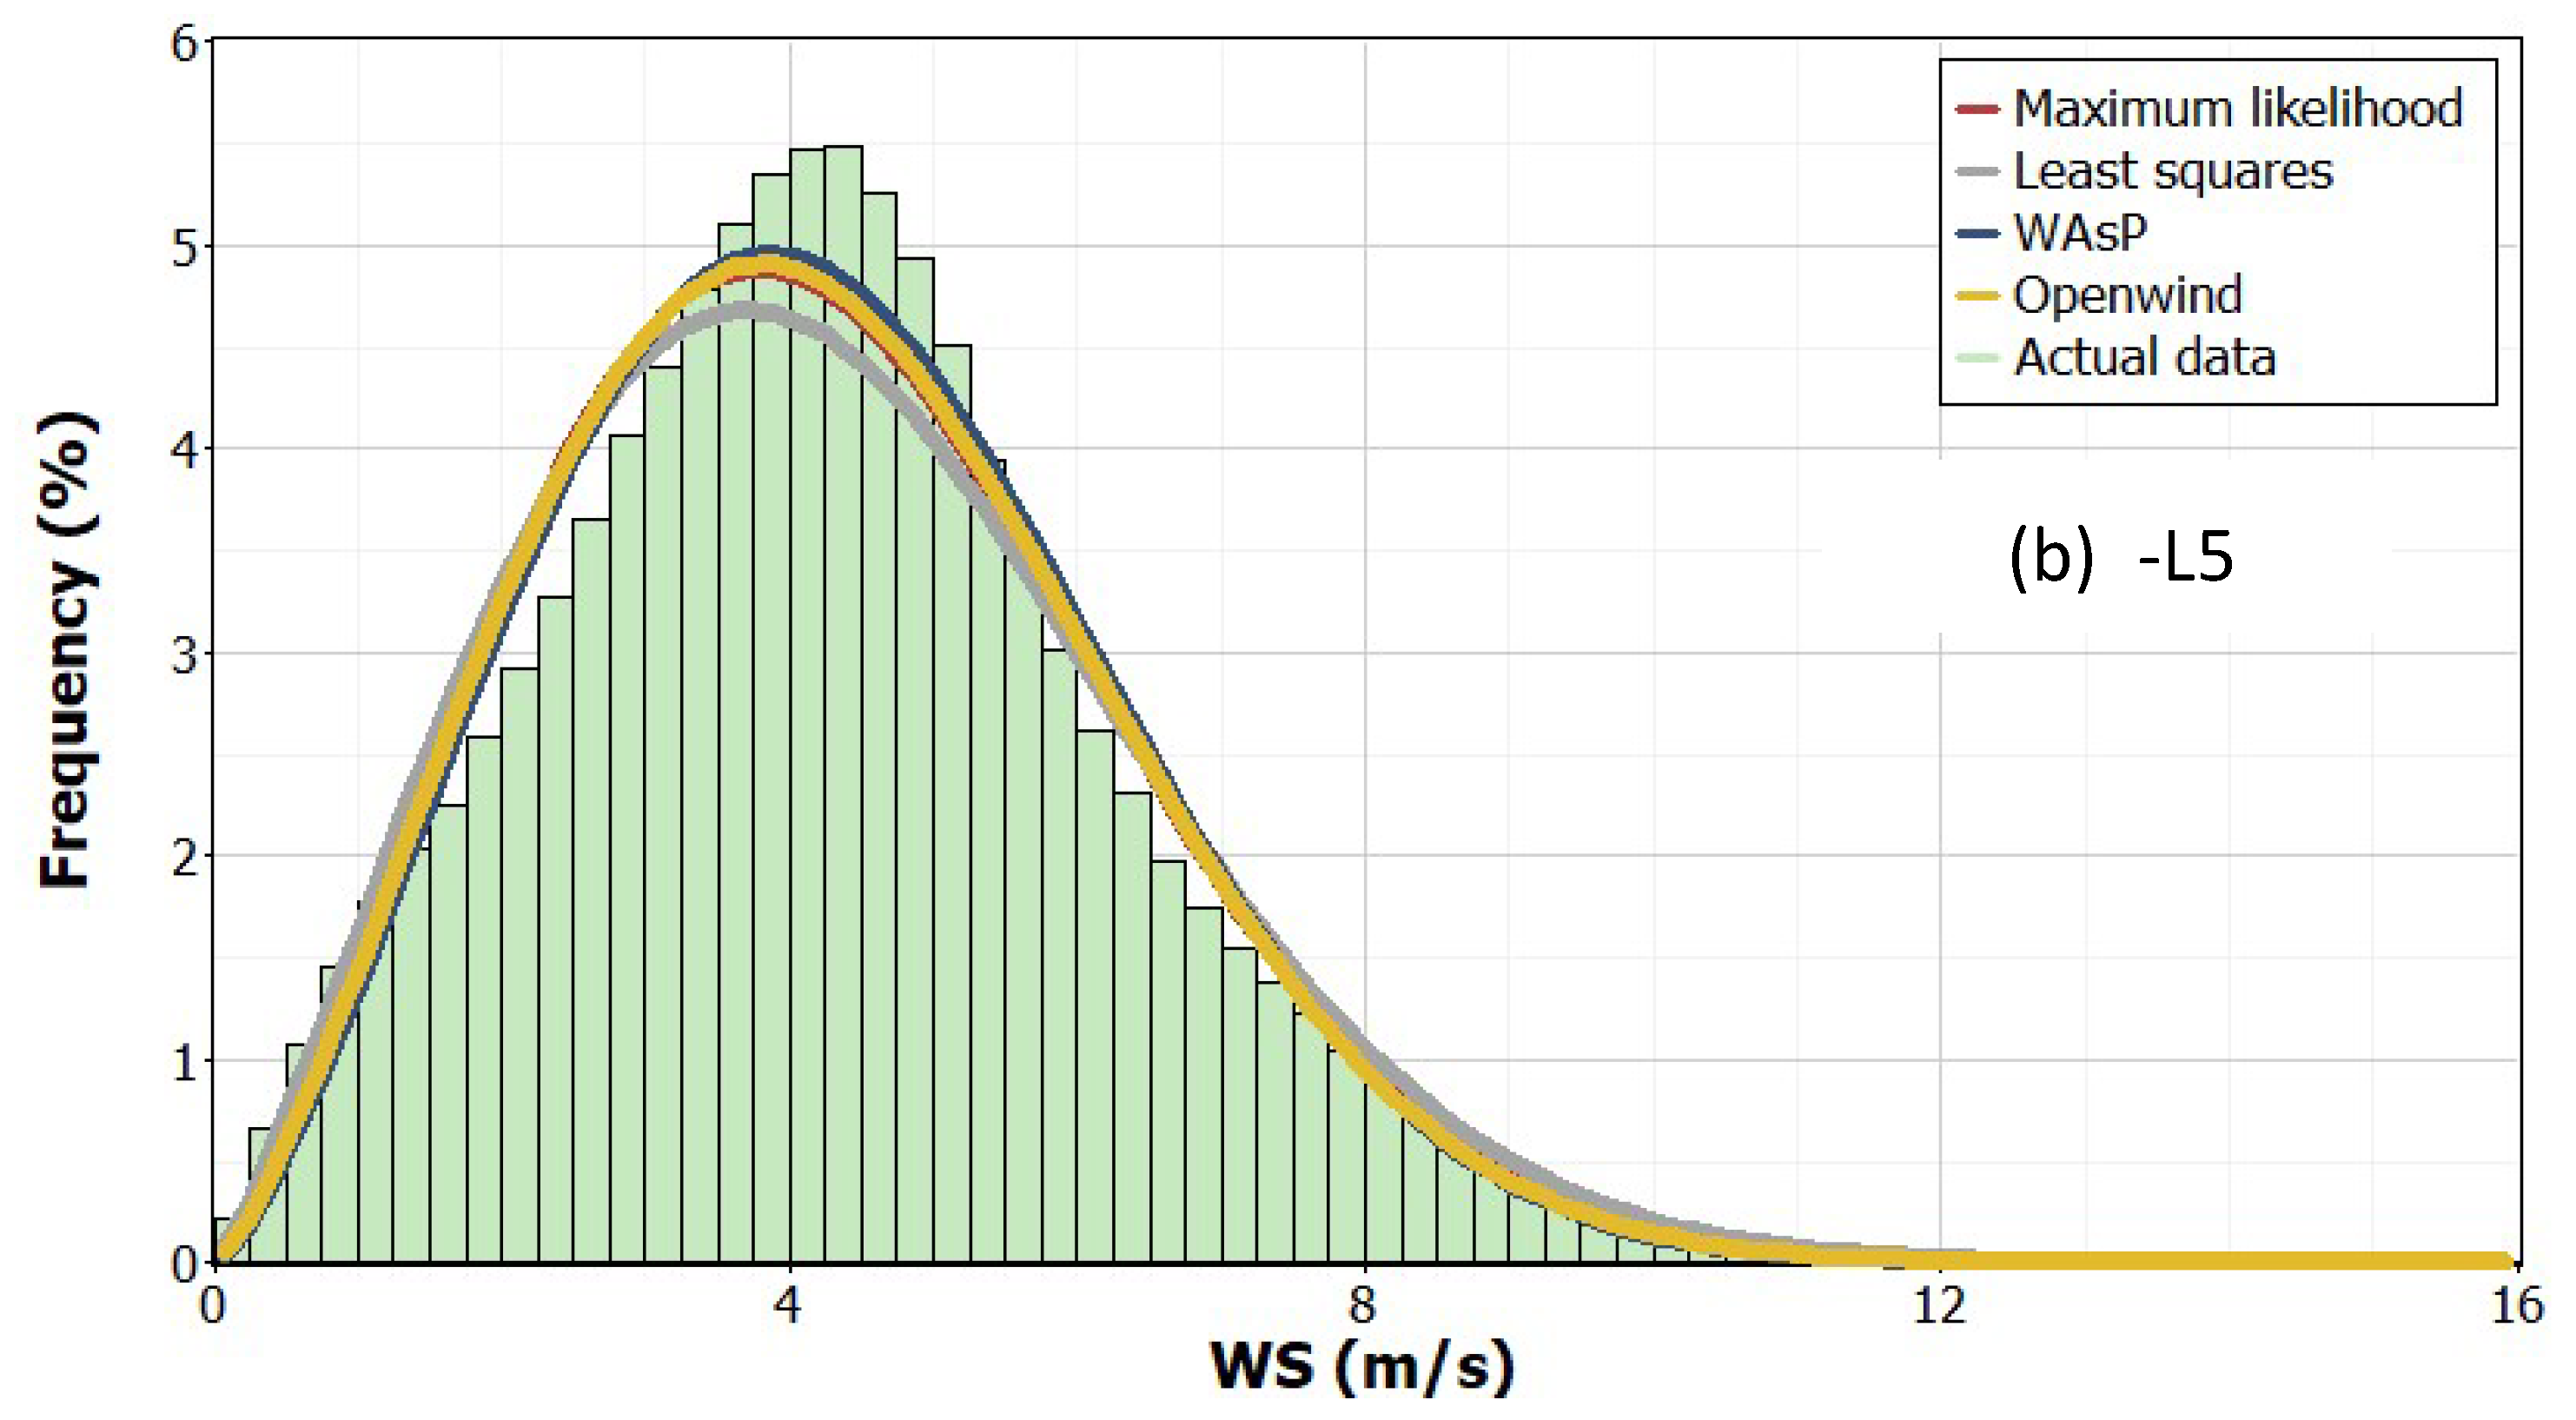
- The Weibull shape and scale parameters ranged between 2.305 (L5) and 2.643 (L3 and L4) and 4.849 m/s (L5) and 8.453 m/s (L1). Similarly, the mean energy content and energy pattern factors were of 677 kWh/m2/yr at L5 and 3240 kWh/m2/yr at L1 and 1.476 at L3 and 1.668 at L5, respectively.
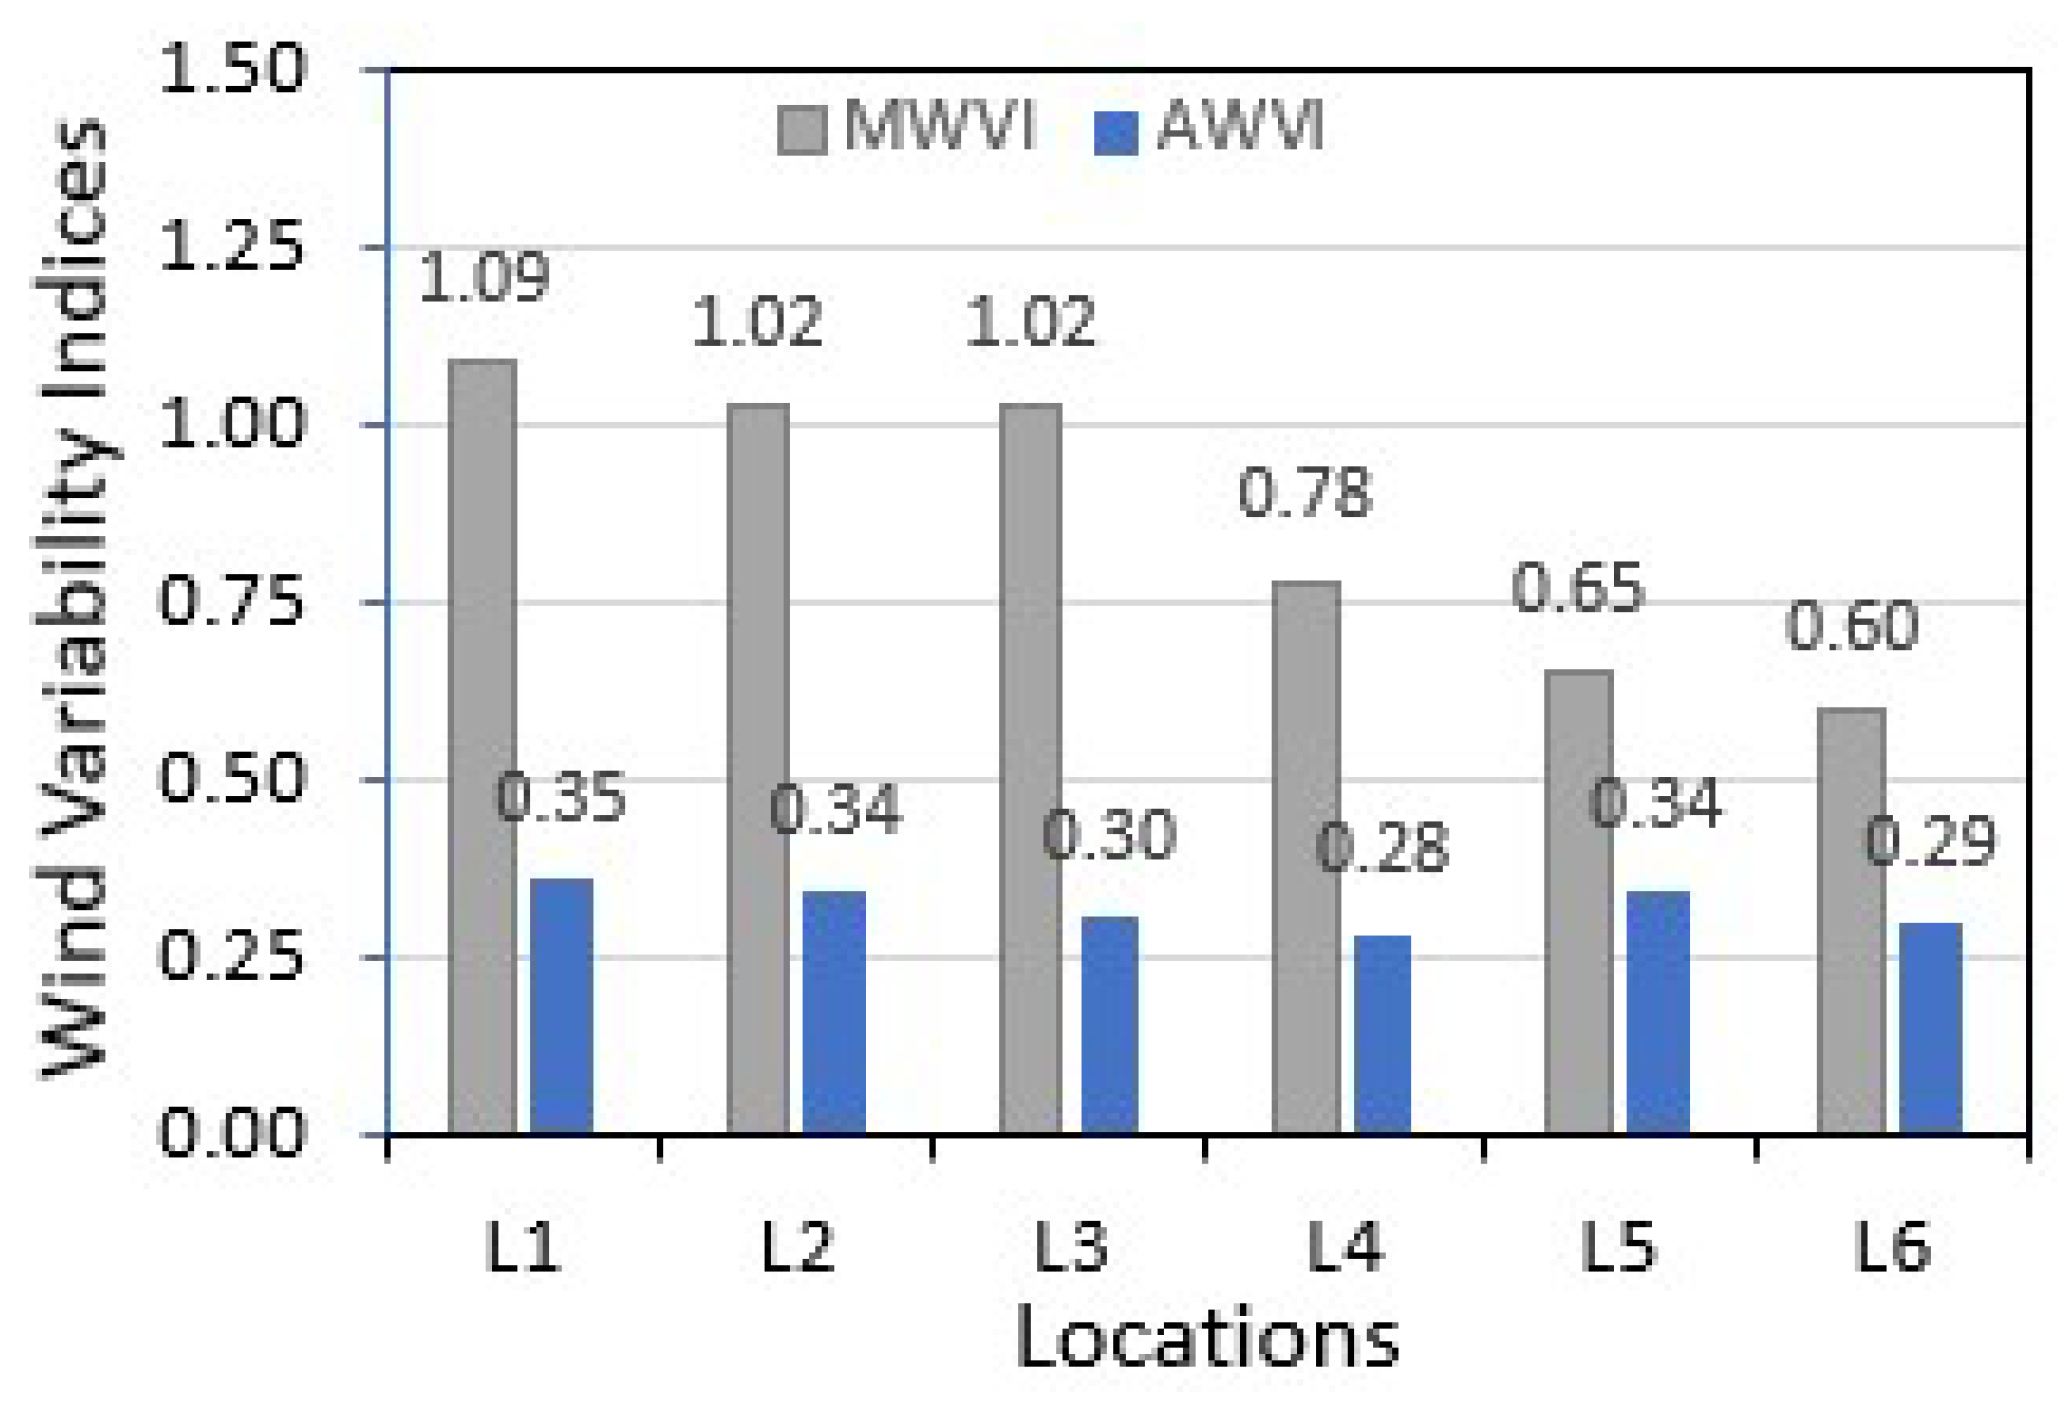
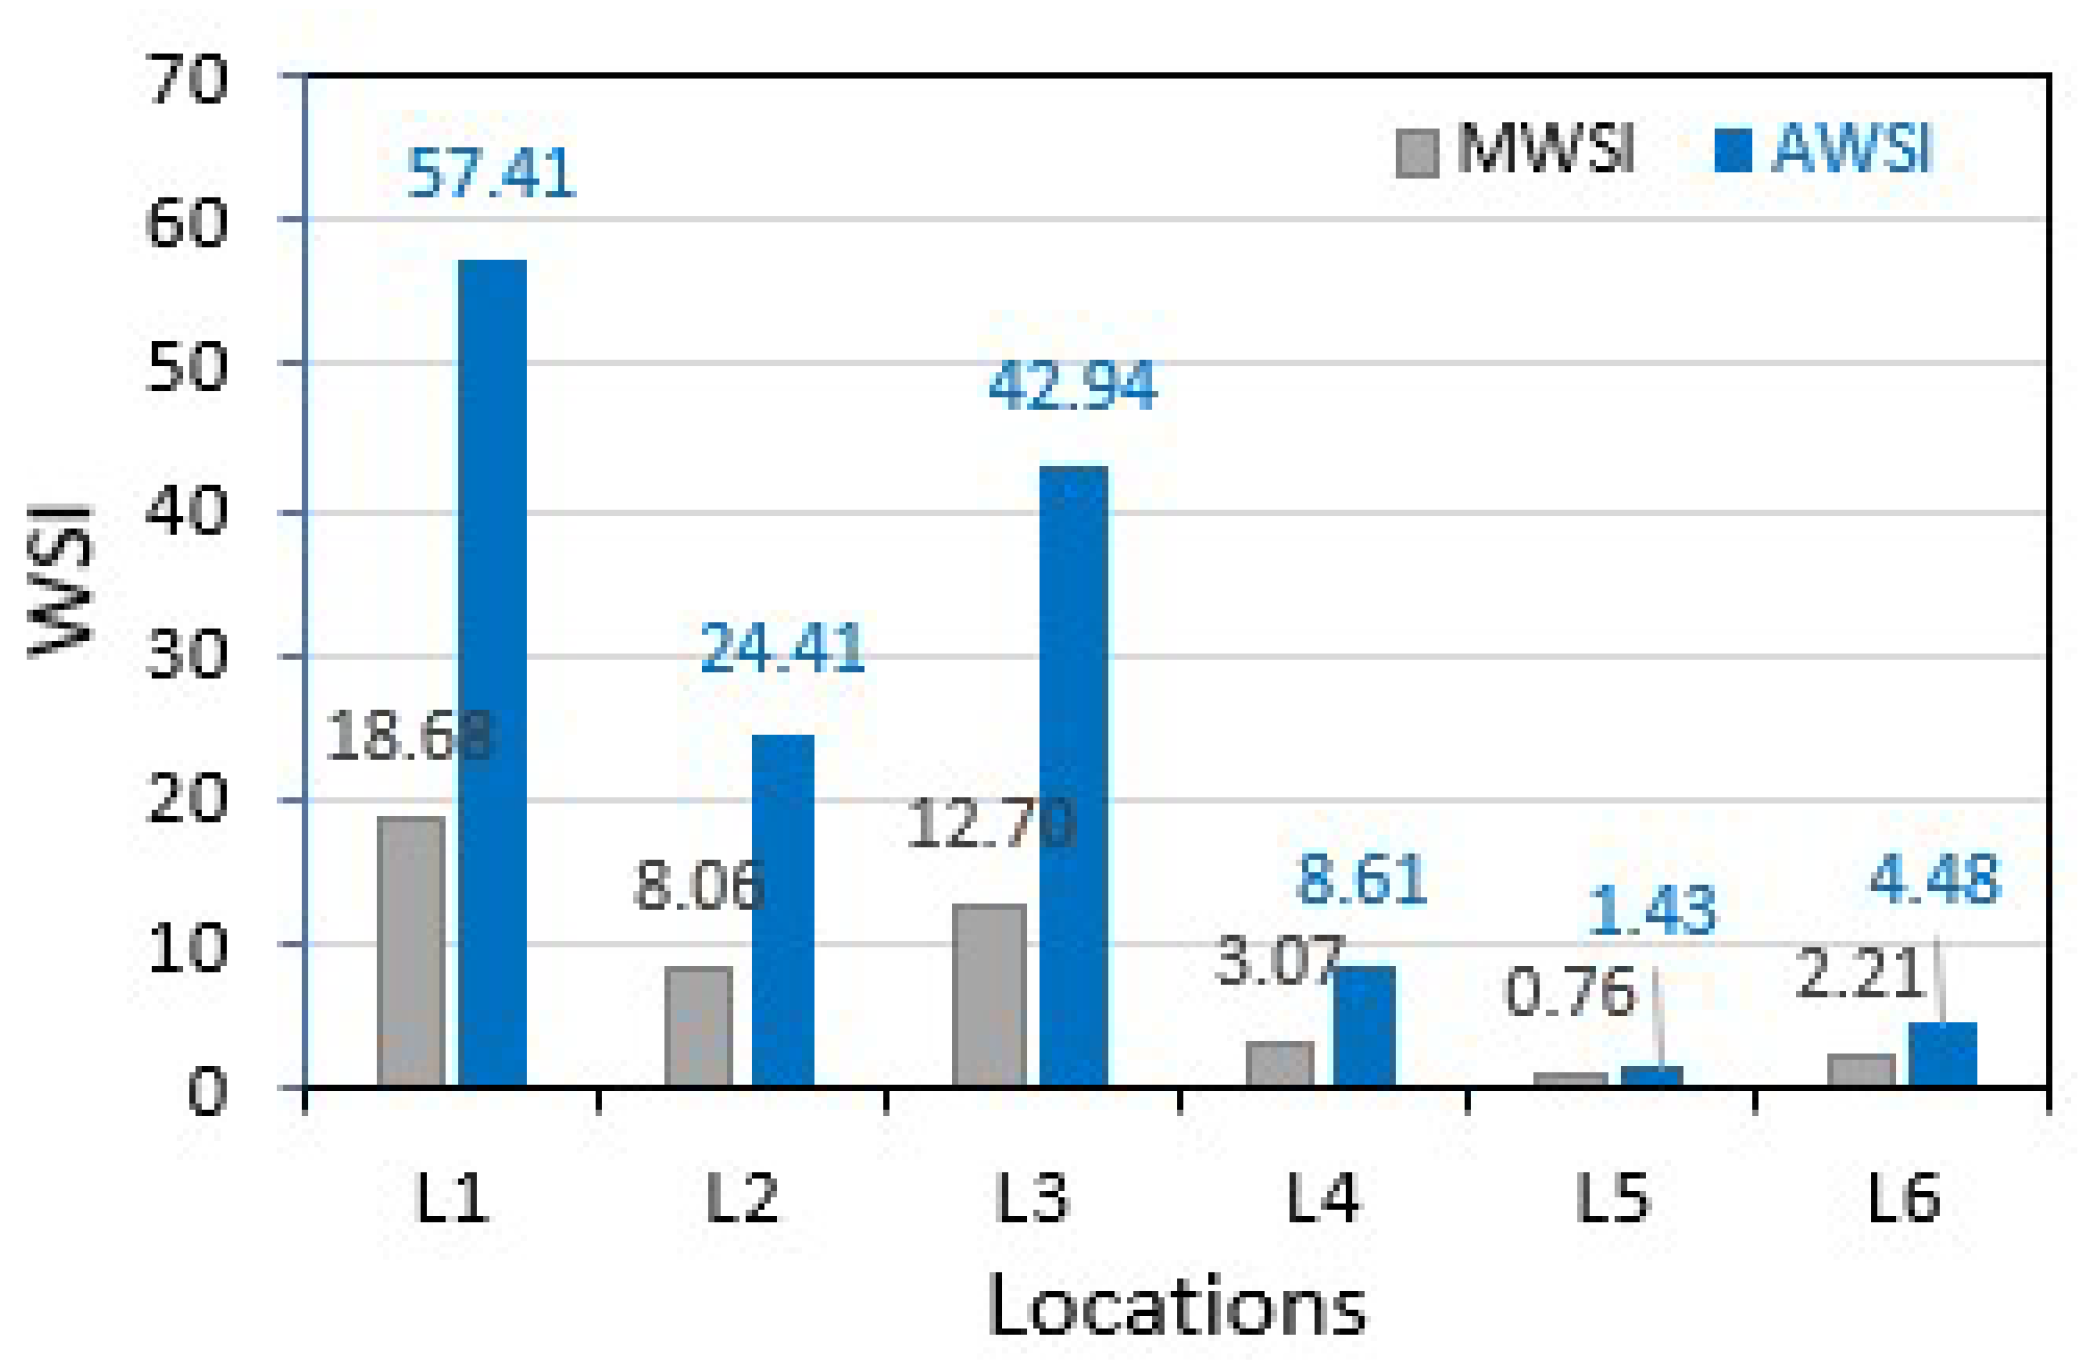
- Lower values of annual and monthly wind variability indices (AWVI and MWVI) are preferred as being representative of the less turbulent nature of the winds, which assures a longer working life for the WTs. In the present case, AWVI varies from 0.28 to 0.35 at L4 and L1, while MWVI varies between 0.60 and 1.09 at the L6 and L1 sites. At potential windy sites (L1, L3, and L2), AWVI and MWVI values are around 0.30 and 1.00, which simply means that winds at these sites are less turbulent and will be good for wind turbines’ longer working life. Finally, higher values of AWSI and MWSI are opted when selecting a potential windy site. In the present case, the highest value of 57.41 is obtained corresponding to the L1 site, while 42.94 and 24.41 correspond to L3 and L2. Similarly, monthly windy site identifier (MWSI) values of 18.68, 12.7, and 8.08 are estimated for the L1, L3, and L2 sites, respectively. These values assure the suitability of sites in order of preference as L1, L2, and L3. The remaining L4 to L6 sites are not suitable compared to the L1 to L3 sites.
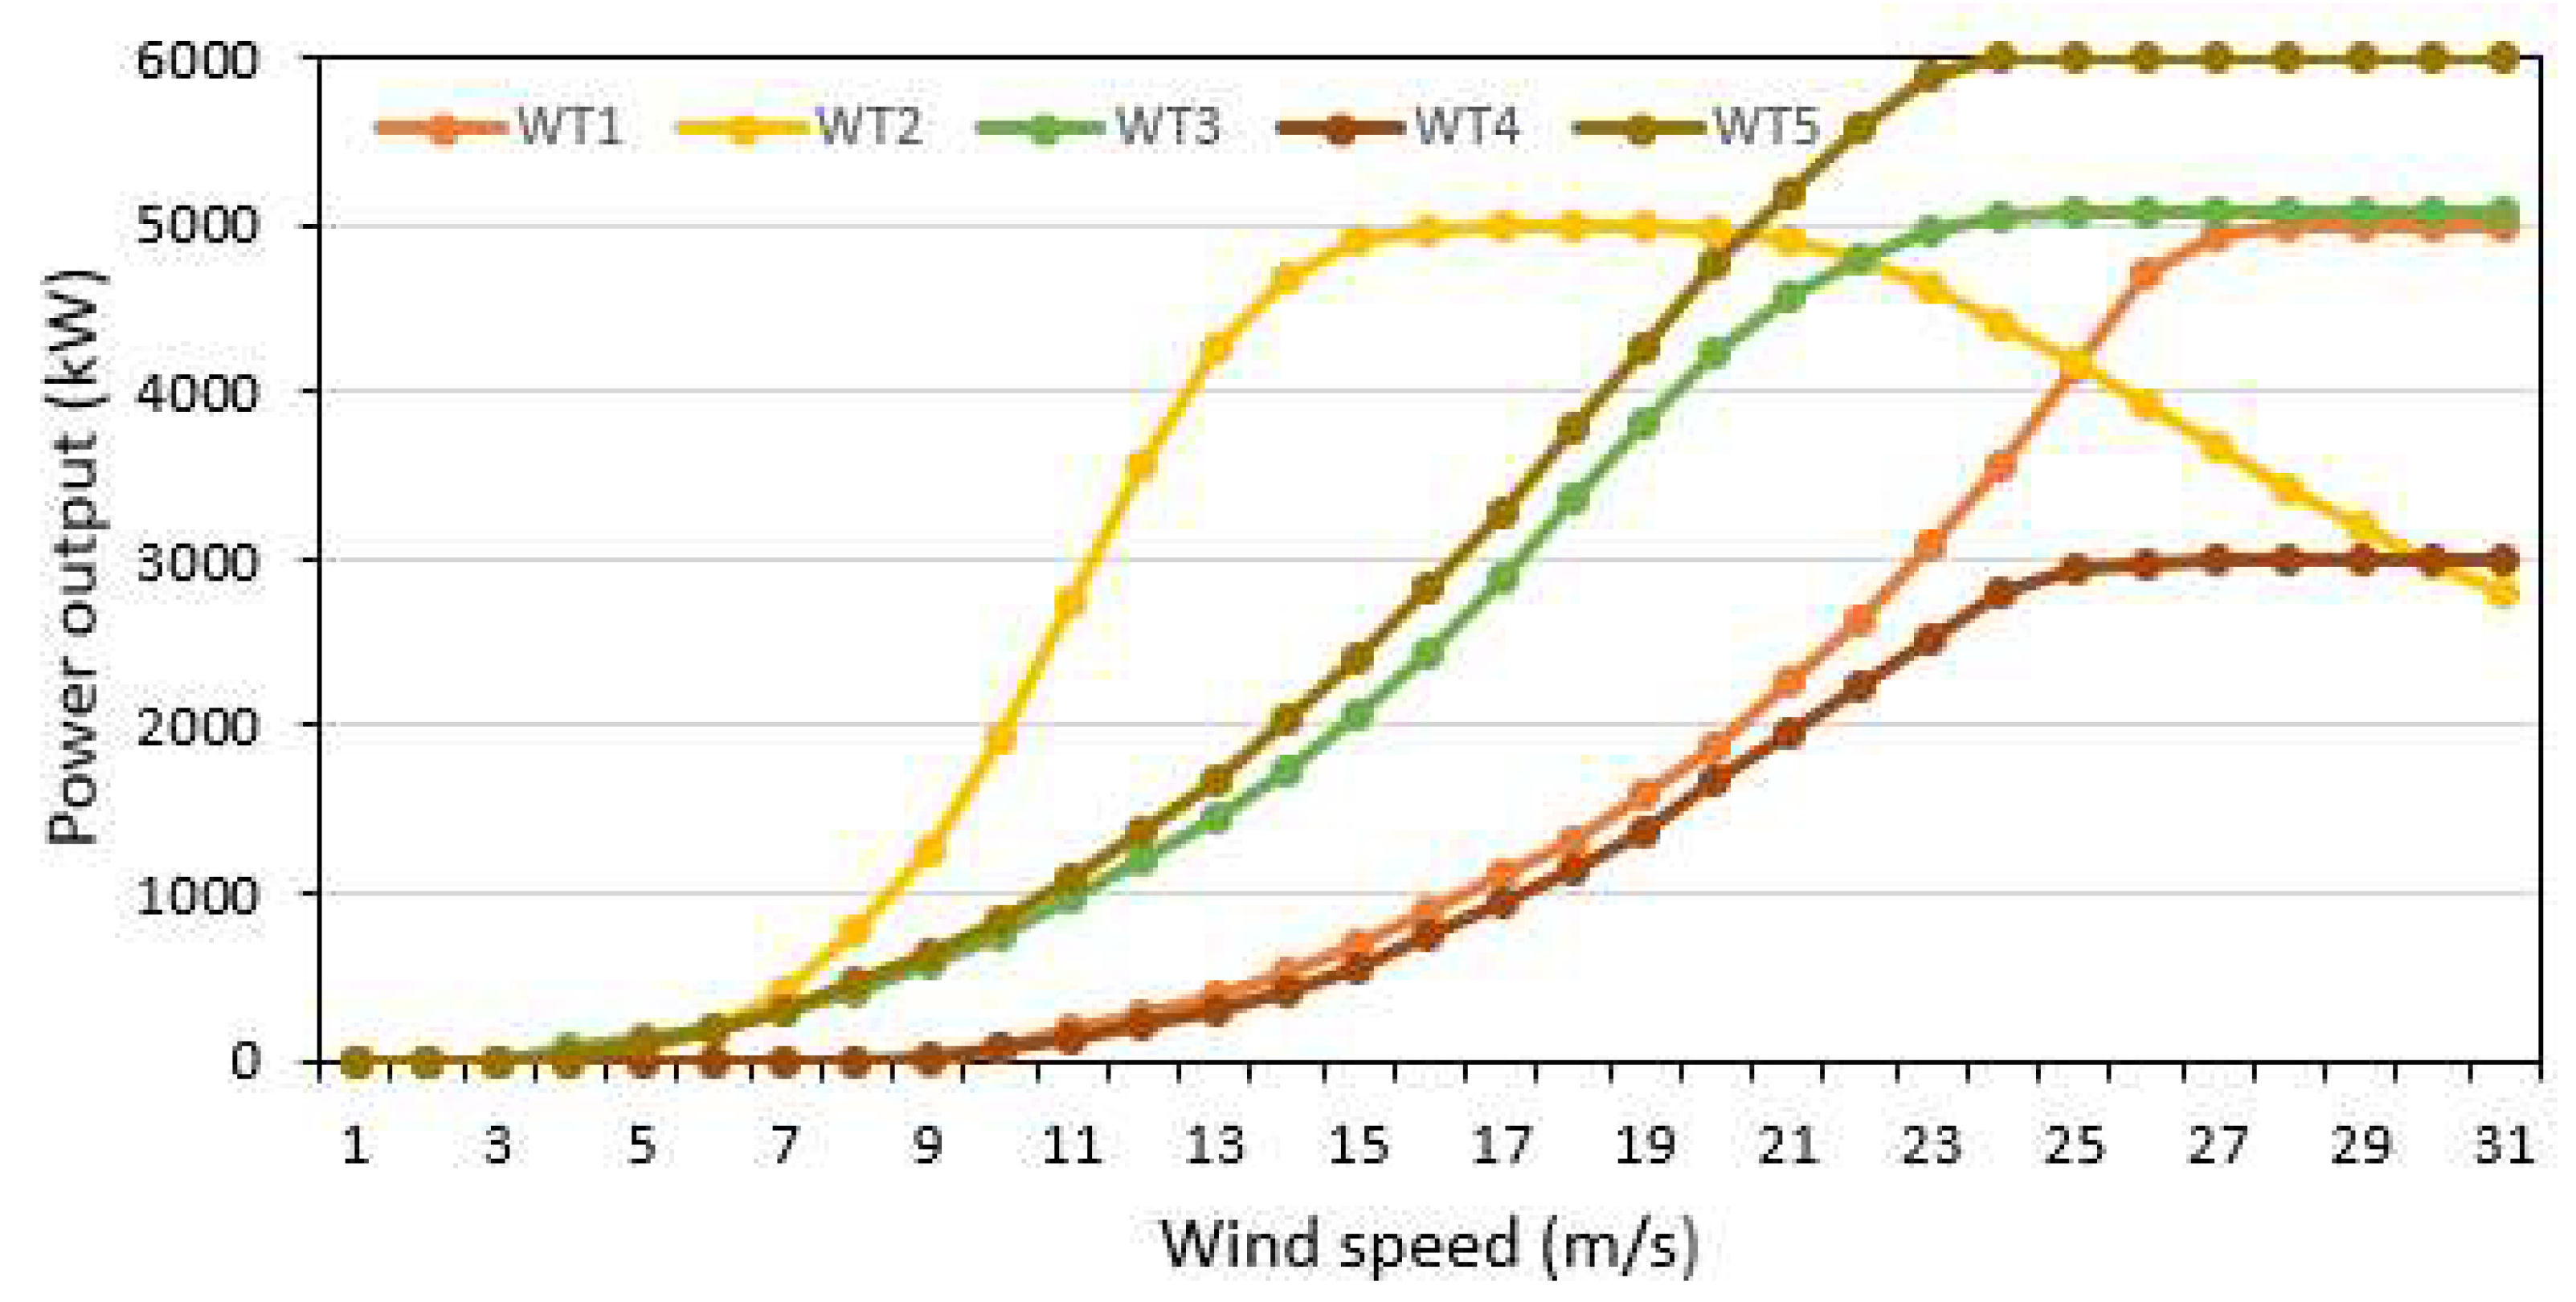
- Higher PCFs of 42.8%, 36.62%, 34.67%, 29.29%, and 29.02% are found at the L1 site corresponding to wind turbines WT4, WT2, WT3, WT5, and WT1, while the minimum of <10% is found at L5. The L3 and L2 sites are rated to be the next best in terms of PCFs of 35.12%, 29.85%, 27.75%, 22.76, 22.19% and 28.85%, 24.38%, 22.52%, 18.13, 17.58 with respect to the order of turbine mentioned above. Based on PCF values, WT4 is proved to be the best performer at all the sites, while WT2 and WT3 are the second and the third best.
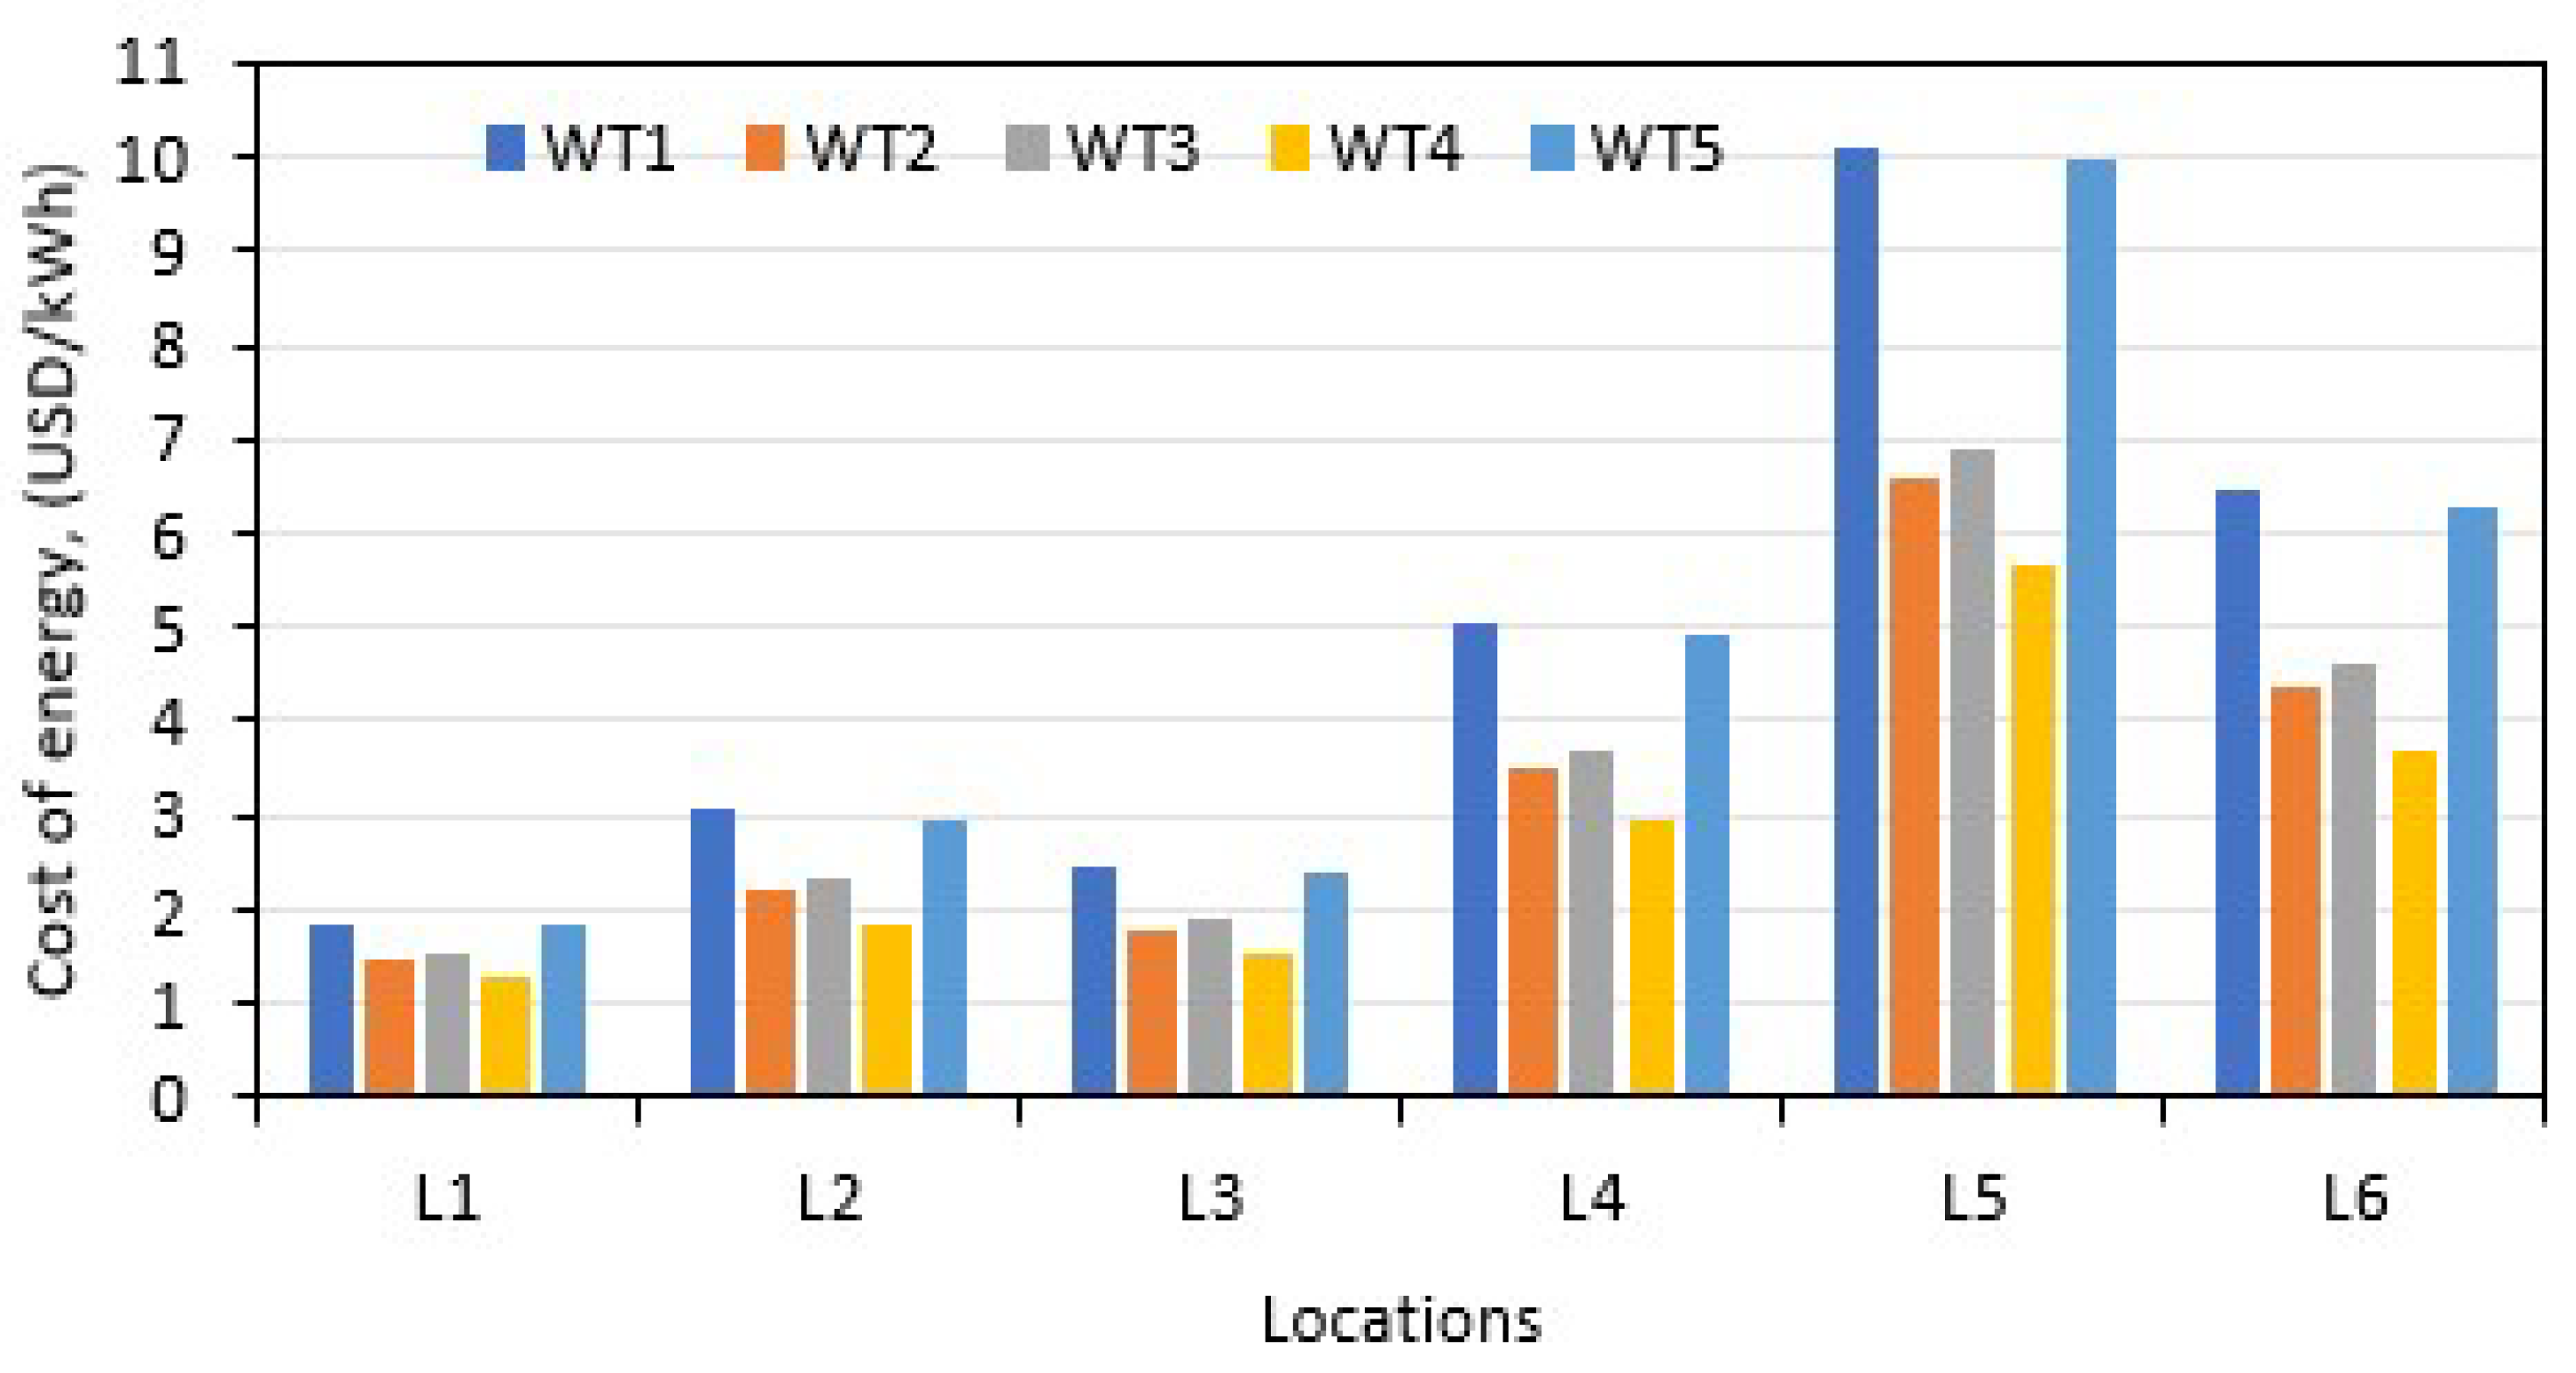
- Based on a weighted average total installation cost of 4720.25 USD/kW, during 2010 to 2021, the LCOE values for the worst and the best cases are found to be 1.274 USD/kWh and 10.120 USD/kWh corresponding to the L1 site with WT4 wind turbine and the L5 site with WT1 turbine. In general, the lowest values of LCOE are registered at L1, the next lowest at L3, and the third at L2. At L4 to L6, the LCOE values are very high and are not recommended.
Author Contributions
Funding
Institutional Review Board Statement
Informed Consent Statement
Data Availability Statement
Acknowledgments
Conflicts of Interest
References
- Yildirim, A. The Technical and Economical Feasibility Study of Offshore Wind Farms in Turkey. Clean Technol. Environ. Policy 2023, 25, 125–142. [Google Scholar] [CrossRef]
- Govindan, K. Pathways to Low Carbon Energy Transition through Multi Criteria Assessment of Offshore Wind Energy Barriers. Technol. Forecast. Soc. Change 2023, 187, 122131. [Google Scholar] [CrossRef]
- Liu, Z.; Wang, H.; Zhou, B.; Yang, D.; Li, G.; Yang, B.; Xi, C.; Hu, B. Optimal Operation Strategy for Wind–Hydrogen–Water Power Grids Facing Offshore Wind Power Accommodation. Sustainability 2022, 14, 6871. [Google Scholar] [CrossRef]
- International Renewable Energy Agency. Renewable Capacity Statistics 2023; IRENA: Masdar City, United Arab Emirates, 2023; ISBN 978-92-9260-525-4. [Google Scholar]
- De Vasconcelos, R.M.; Silva, L.L.C.; González, M.O.A.; Santiso, A.M.; de Melo, D.C. Environmental Licensing for Offshore Wind Farms: Guidelines and Policy Implications for New Markets. Energy Policy 2022, 171, 113248. [Google Scholar] [CrossRef]
- Nian, V.; Liu, Y.; Zhong, S. Life Cycle Cost-Benefit Analysis of Offshore Wind Energy under the Climatic Conditions in Southeast Asia—Setting the Bottom-Line for Deployment. Appl. Energy 2019, 233–234, 1003–1014. [Google Scholar] [CrossRef]
- Yang, X.; Bai, K. Development and Prospects of Offshore Wind Power. In Proceedings of the 2010 World Non-Grid-Connected Wind Power and Energy Conference, Nanjing, China, 5–7 November 2010; pp. 1–4. [Google Scholar]
- Li, J.; Wang, G.; Li, Z.; Yang, S.; Chong, W.T.; Xiang, X. A Review on Development of Offshore Wind Energy Conversion System. Int. J. Energy Res. 2020, 44, 9283–9297. [Google Scholar] [CrossRef]
- Perveen, R.; Kishor, N.; Mohanty, S.R. Off-Shore Wind Farm Development: Present Status and Challenges. Renew. Sustain. Energy Rev. 2014, 29, 780–792. [Google Scholar] [CrossRef]
- Hussein, K.R.; Hussein, A.W.; Hegazy, E.H.; Amin, A.A. Structural Design of a Floating Foundation for Offshore Wind Turbines in Red Sea. In Proceedings of the Analysis and Design of Marine Structures—Proceedings of the 4th International Conference on Marine Structures, MARSTRUCT 2013, Espoo, Finland, 25–27 March 2013; Volume 17, pp. 575–583. [Google Scholar] [CrossRef]
- Guo, Y.; Wang, H.; Lian, J. Review of Integrated Installation Technologies for Offshore Wind Turbines: Current Progress and Future Development Trends. Energy Convers. Manag. 2022, 255, 115319. [Google Scholar] [CrossRef]
- Yu, H.; Yang, X.; Chen, H.; Lou, S.; Lin, Y. Energy Storage Capacity Planning Method for Improving Offshore Wind Power Consumption. Sustainability 2022, 14, 14589. [Google Scholar] [CrossRef]
- El Mokhi, C.; Addaim, A. Optimization of Wind Turbine Interconnections in an Offshore Wind Farm Using Metaheuristic Algorithms. Sustainability 2020, 12, 5761. [Google Scholar] [CrossRef]
- Fernández-Guillamón, A.; Das, K.; Cutululis, N.A.; Molina-García, Á. Offshore Wind Power Integration into Future Power Systems: Overview and Trends. J. Mar. Sci. Eng. 2019, 7, 399. [Google Scholar] [CrossRef]
- Garcia-Novo, P.; Coles, D.; Kyozuka, Y.; Yamada, R.; Moriguchi, H.; Sakaguchi, D. Optimization of a Tidal–Wind–Solar System to Enhance Supply–Demand Balancing and Security: A Case Study of the Goto Islands, Japan. Sustainability 2023, 15, 9147. [Google Scholar] [CrossRef]
- Choi, N.; Kim, B.; Kim, D.; Park, B.; Kim, S.; Lee, B. Grid Connection Studies for Large-Scale Offshore Wind Farms Considering High Penetration of Regional Renewables. Sustainability 2022, 14, 1015. [Google Scholar] [CrossRef]
- Xu, J.; Zhang, R.; Wang, Y.; Yan, H.; Liu, Q.; Guo, Y.; Ren, Y. A New Framework for Assessment of Offshore Wind Farm Location. Energies 2022, 15, 6758. [Google Scholar] [CrossRef]
- Chancham, C.; Waewsak, J.; Gagnon, Y. Offshore Wind Resource Assessment and Wind Power Plant Optimization in the Gulf of Thailand. Energy 2017, 139, 706–731. [Google Scholar] [CrossRef]
- Kalogeri, C.; Galanis, G.; Spyrou, C.; Diamantis, D.; Baladima, F.; Koukoula, M.; Kallos, G. Assessing the European Offshore Wind and Wave Energy Resource for Combined Exploitation. Renew. Energy 2017, 101, 244–264. [Google Scholar] [CrossRef]
- Mahdy, M.; Bahaj, A.B.S.; Alghamdi, A.S. Offshore Wind Energy Potential around the East Coast of the Red Sea, KSA. In Proceedings of the ISES Solar World Congress 2017—IEA SHC International Conference on Solar Heating and Cooling for Buildings and Industry 2017, Proceedings 2017, Abu Dhabi, United Arab Emirates, 29 October–2 November 2017; pp. 2422–2432. [Google Scholar] [CrossRef]
- Robertson, B.; Dunkle, G.; Gadasi, J.; Garcia-Medina, G.; Yang, Z. Holistic Marine Energy Resource Assessments: A Wave and Offshore Wind Perspective of Metocean Conditions. Renew. Energy 2021, 170, 286–301. [Google Scholar] [CrossRef]
- International Renewable Energy Agency. Renewable Power Generation Costs in 2021; IRENA: Masdar City, United Arab Emirates, 2022; ISBN 978-92-9260-452-3. [Google Scholar]
- Nezhad, M.M.; Neshat, M.; Groppi, D.; Marzialetti, P.; Heydari, A.; Sylaios, G.; Garcia, D.A. A Primary Offshore Wind Farm Site Assessment Using Reanalysis Data: A Case Study for Samothraki Island. Renew. Energy 2021, 172, 667–679. [Google Scholar] [CrossRef]
- Da, Z.; Xiliang, Z.; Jiankun, H.; Qimin, C. Offshore Wind Energy Development in China: Current Status and Future Perspective. Renew. Sustain. Energy Rev. 2011, 15, 4673–4684. [Google Scholar]
- Zhang, J.; Wang, H. Development of Offshore Wind Power and Foundation Technology for Offshore Wind Turbines in China. Ocean. Eng. 2022, 266, 113256. [Google Scholar] [CrossRef]
- Gao, X.; Yang, H.; Lu, L. Study on Offshore Wind Power Potential and Wind Farm Optimization in Hong Kong. Appl. Energy 2014, 130, 519–531. [Google Scholar] [CrossRef]
- Patel, R.P.; Nagababu, G.; Kachhwaha, S.S.; Surisetty, V.V.A.K. A Revised Offshore Wind Resource Assessment and Site Selection along the Indian Coast Using ERA5 Near-Hub-Height Wind Products. Ocean. Eng. 2022, 254, 111341. [Google Scholar] [CrossRef]
- Arun Kumar, S.V.V.; Nagababu, G.; Sharma, R.; Kumar, R. Synergetic Use of Multiple Scatterometers for Offshore Wind Energy Potential Assessment. Ocean. Eng. 2020, 196, 106745. [Google Scholar] [CrossRef]
- Rusu, E.; Onea, F. A Parallel Evaluation of the Wind and Wave Energy Resources along the Latin American and European Coastal Environments. Renew. Energy 2019, 143, 1594–1607. [Google Scholar] [CrossRef]
- Contestabile, P.; Di Lauro, E.; Galli, P.; Corselli, C.; Vicinanza, D. OffshoreWind and Wave Energy Assessment around Malè and Magoodhoo Island (Maldives). Sustainability 2017, 9, 613. [Google Scholar] [CrossRef]
- Hernández Galvez, G.; Chuck Liévano, D.; Sarracino Martínez, O.; Lastres Danguillecourt, O.; Dorrego Portela, J.R.; Narcía, A.T.; Saldaña Flores, R.; Pampillón González, L.; Perea-Moreno, A.J.; Hernandez-Escobedo, Q. Harnessing Offshore Wind Energy along the Mexican Coastline in the Gulf of Mexico—An Exploratory Study Including Sustainability Criteria. Sustainability 2022, 14, 5877. [Google Scholar] [CrossRef]
- Al-Hinai, A.; Charabi, Y.; Aghay Kaboli, S.H. Offshore Wind Energy Resource Assessment across the Territory of Oman: A Spatial-Temporal Data Analysis. Sustainability 2021, 13, 2862. [Google Scholar] [CrossRef]
- Baptista, J.; Jesus, B.; Cerveira, A.; Pires, E.J.S. Offshore Wind Farm Layout Optimisation Considering Wake Effect and Power Losses. Sustainability 2023, 15, 9893. [Google Scholar] [CrossRef]
- Görmüş, T.; Aydoğan, B.; Ayat, B. Offshore Wind Power Potential Analysis for Different Wind Turbines in the Mediterranean Region, 1959–2020. Energy Convers. Manag. 2022, 274, 116470. [Google Scholar] [CrossRef]
- Liang, Y.; Ma, Y.; Wang, H.; Mesbahi, A.; Jeong, B.; Zhou, P. Levelised Cost of Energy Analysis for Offshore Wind Farms—A Case Study of the New York State Development. Ocean. Eng. 2021, 239, 109923. [Google Scholar] [CrossRef]
- Martinez, A.; Iglesias, G. Multi-Parameter Analysis and Mapping of the Levelised Cost of Energy from Floating Offshore Wind in the Mediterranean Sea. Energy Convers. Manag. 2021, 243, 114416. [Google Scholar] [CrossRef]
- Früh, W.G. Long-Term Wind Resource and Uncertainty Estimation Using Wind Records from Scotland as Example. Renew. Energy 2013, 50, 1014–1026. [Google Scholar] [CrossRef]
- Cannon, D.J.; Brayshaw, D.J.; Methven, J.; Coker, P.J.; Lenaghan, D. Using Reanalysis Data to Quantify Extreme Wind Power Generation Statistics: A 33 Year Case Study in Great Britain. Renew. Energy 2015, 75, 767–778. [Google Scholar] [CrossRef]
- Gualtieri, G. Reliability of Era5 Reanalysis Data for Wind Resource Assessment: A Comparison against Tall Towers. Energies 2021, 14, 4169. [Google Scholar] [CrossRef]
- Hersbach, H.; Bell, B.; Berrisford, P.; Hirahara, S.; Horányi, A.; Muñoz-Sabater, J.; Nicolas, J.; Peubey, C.; Radu, R.; Schepers, D.; et al. The ERA5 Global Reanalysis. Q. J. R. Meteorol. Soc. 2020, 146, 1999–2049. [Google Scholar] [CrossRef]
- Ramirez Camargo, L.; Gruber, K.; Nitsch, F. Assessing Variables of Regional Reanalysis Data Sets Relevant for Modelling Small-Scale Renewable Energy Systems. Renew. Energy 2019, 133, 1468–1478. [Google Scholar] [CrossRef]
- Winterfeldt, J.; Andersson, A.; Klepp, C.; Bakan, S.; Weisse, R. Comparison of HOAPS, QuikSCAT, and Buoy Wind Speed in the Eastern North Atlantic and the North Sea. IEEE Trans. Geosci. Remote Sens. 2010, 48, 338–348. [Google Scholar] [CrossRef]
- Campos, R.M.; Guedes Soares, C. Assessment of Three Wind Reanalyses in the North Atlantic Ocean. J. Oper. Oceanogr. 2017, 10, 30–44. [Google Scholar] [CrossRef]
- Kim, H.G.; Kim, J.Y.; Kang, Y.H. Comparative Evaluation of the Third-Generation Reanalysis Data for Wind Resource Assessment of the Southwestern Offshore in South Korea. Atmosphere 2018, 9, 73. [Google Scholar] [CrossRef]
- Sharp, E.; Dodds, P.; Barrett, M.; Spataru, C. Evaluating the Accuracy of CFSR Reanalysis Hourly Wind Speed Forecasts for the UK, Using in Situ Measurements and Geographical Information. Renew. Energy 2015, 77, 527–538. [Google Scholar] [CrossRef]
- Wu, S.; Liu, J.; Zhang, G.; Han, B.; Wu, R.; Chen, D. Evaluation of NCEP-CFSv2, ERA5, and CCMP Wind Datasets against Buoy Observations over Zhejiang Nearshore Waters. Ocean. Eng. 2022, 259, 111832. [Google Scholar] [CrossRef]
- Gonçalves, M.; Martinho, P.; Guedes Soares, C. A 33-Year Hindcast on Wave Energy Assessment in the Western French Coast. Energy 2018, 165, 790–801. [Google Scholar] [CrossRef]
- El Khchine, Y.; Sriti, M.; el Kadri Elyamani, N.E. Evaluation of Wind Energy Potential and Trends in Morocco. Heliyon 2019, 5, e01830. [Google Scholar] [CrossRef]
- Kamranzad, B.; Etemad-Shahidi, A.; Chegini, V. Developing an Optimum Hotspot Identifier for Wave Energy Extracting in the Northern Persian Gulf. Renew. Energy 2017, 114, 59–71. [Google Scholar] [CrossRef]
- Hulio, Z.H.; Jiang, W.; Rehman, S. Techno—Economic Assessment of Wind Power Potential of Hawke’s Bay Using Weibull Parameter: A Review. Energy Strategy Rev. 2019, 26, 100375. [Google Scholar] [CrossRef]
- Baseer, M.A.; Meyer, J.P.; Rehman, S.; Alam, M.M. Wind Power Characteristics of Seven Data Collection Sites in Jubail, Saudi Arabia Using Weibull Parameters. Renew. Energy 2017, 102, 35–49. [Google Scholar] [CrossRef]
- Bagiorgas, H.S.; Mihalakakou, G.; Rehman, S.; Al-Hadhrami, L.M. Wind Power Potential Assessment for Three Buoys Data Collection Stations in the Ionian Sea Using Weibull Distribution Function. Int. J. Green Energy 2016, 13, 703–714. [Google Scholar] [CrossRef]
- Bassyouni, M.; Saud, A.G.; Javaid, U.; Awais, M.; Rehman, S.; Abdel-Hamid, S.M.S.; Abdel-Aziz, M.H.; Abouel-Kasem, A.; Shafeek, H. Assessment and Analysis of Wind Power Resource Using Weibull Parameters. Energy Explor. Exploit. 2015, 33, 105–122. [Google Scholar] [CrossRef]
- Rehman, S.; Alam, M.M.; Meyer, J.P.; Al-Hadhrami, L.M. Wind Speed Characteristics and Resource Assessment Using Weibull Parameters. Int. J. Green Energy 2012, 9, 800–814. [Google Scholar] [CrossRef]
- Energy Consumption in Egypt. Available online: https://www.worlddata.info/africa/egypt/energy-consumption.php#:~:text=of%20electric%20energy%20per%20year,an%20average%20of%201%2C343%20kWh (accessed on 17 August 2023).


| Location | Bathymetry | Distance from Coast | ||||
|---|---|---|---|---|---|---|
| Name | Lat, °N | Lon, °E | Lat, °N | Lon, °E | Depth, m | km |
| L1 | 28.80 | 33.00 | 28.804 | 33.0041 | 66 | 18.51 |
| L2 | 29.10 | 32.70 | 29.1041 | 32.7041 | 33 | 3.37 |
| L3 | 29.10 | 33.30 | 29.1041 | 33.0041 | 43 | 32.86 |
| L4 | 29.40 | 32.70 | 29.4041 | 32.7041 | 47 | 14.01 |
| L5 | 29.70 | 32.40 | 29.7041 | 32.4041 | 30 | 2.34 |
| L6 | 29.70 | 32.70 | 29.7041 | 32.6875 | 2 | 0.681 |
| Variable | L1 | L2 | L3 | L4 | L5 | L6 |
|---|---|---|---|---|---|---|
| Latitude (N) | 28.80 | 29.10 | 29.10 | 29.40 | 29.70 | 29.70 |
| Longitude (E) | 33.00 | 32.70 | 33.00 | 32.70 | 32.40 | 32.70 |
| Mean wind speed (m/s) | 7.547 | 6.371 | 6.905 | 5.483 | 4.304 | 5.030 |
| Max wind speed (m/s) | 17.560 | 17.840 | 18.030 | 17.690 | 15.250 | 18.620 |
| CRMC wind speed (m/s) | 8.616 | 7.303 | 7.863 | 6.267 | 5.104 | 5.835 |
| Mean Wind Direction (°) | 341.1 | 340.4 | 342.7 | 350.4 | 341.3 | 357.0 |
| Weibull k | 2.604 | 2.582 | 2.643 | 2.643 | 2.305 | 2.497 |
| Weibull A (m/s) | 8.453 | 7.147 | 7.730 | 6.150 | 4.849 | 5.655 |
| Mean WPD (W/m²) | 370 | 225 | 281 | 142 | 77 | 115 |
| Mean energy content (kWh/m2/yr) | 3240 | 1972 | 2465 | 1241 | 677 | 1003 |
| Energy pattern factor | 1.488 | 1.507 | 1.476 | 1.493 | 1.668 | 1.561 |
| Frequency of calms (%) | 10.58 | 13.07 | 11.66 | 14.89 | 26.1 | 18.01 |
| WPD at 50 m (W/m²) | 276 | 168 | 210 | 106 | 58 | 86 |
| Wind power class | 2 (Marginal) | 1 (Poor) | 2 (Marginal) | 1 (Poor) | 1 (Poor) | 1 (Poor) |
| Mean Temperature (°C) | 21.92 | 21.54 | 22.14 | 21.09 | 21.36 | 20.97 |
| Mean Pressure (kPa) | 100.6 | 100.4 | 100.9 | 99.8 | 100.8 | 99.9 |
| Mean Air Density (kg/m3) | 1.165 | 1.164 | 1.167 | 1.160 | 1.170 | 1.161 |
| WPD frequency occurrences above 250 W/m2 | 183,713 | 207,343 | 137,826 | 174,391 | 63,458 | 23,875 |
| Location | Linear Equation | R2 |
|---|---|---|
| L1 | Y = −0.0062 × WS + 7.6828 | 0.0664 |
| L2 | Y = −0.0046 × WS + 6.4718 | 0.0561 |
| L3 | Y = −0.0054 × WS + 7.0251 | 0.0703 |
| L4 | Y = −0.0032 × WS + 5.5540 | 0.0569 |
| L5 | Y = −0.0021 × WS + 4.3492 | 0.0450 |
| L6 | Y = −0.0019 × WS + 5.0711 | 0.0286 |
| Wind Turbine | Rated Capacity (MW) | Rotor Diameter (m) | Cut-In Speed (m/s) | Rated Speed (m/s) | Cut-Out Speed (m/s) |
|---|---|---|---|---|---|
| WT1 | 5.00 | 116 | 4.0 | 13.0 | 25.0 |
| WT2 | 5.00 | 132 | 3.0 | 15.0 | 30.0 |
| WT3 | 5.75 | 126 | 3.0 | 13.0 | 30.0 |
| WT4 | 3.00 | 112 | 3.0 | 14.0 | 25.0 |
| WT5 | 6.00 | 128 | 3.5 | 12.0 | 30.0 |
| Loss Item | Loss (%) |
|---|---|
| Availability | 3 |
| Wake effect | 5 |
| Turbine performance | 4 |
| Electrical | 2 |
| Environmental | 0 |
| Curtailment | 0 |
| Other | 0 |
| Overall | 13.3053 |
| HH = 120 m | Hub Height | L1 | L2 | L3 | L4 | L5 | L6 |
|---|---|---|---|---|---|---|---|
| WS (m/s) | 7.75 | 6.54 | 7.09 | 5.63 | 4.42 | 5.16 | |
| WT1 | Net Wind Power (MW) | 1.451 | 0.879 | 1.110 | 0.533 | 0.266 | 0.418 |
| WT2 | 1.831 | 1.219 | 1.492 | 0.774 | 0.410 | 0.615 | |
| WT3 | 1.760 | 1.143 | 1.408 | 0.729 | 0.390 | 0.582 | |
| WT4 | 1.269 | 0.866 | 1.054 | 0.553 | 0.287 | 0.437 | |
| WT5 | 1.758 | 1.088 | 1.366 | 0.659 | 0.325 | 0.513 | |
| WT1 | Net AEY (GWh) | 12.710 | 7.699 | 9.719 | 4.669 | 2.332 | 3.661 |
| WT2 | 16.039 | 10.677 | 13.073 | 6.784 | 3.589 | 5.385 | |
| WT3 | 15.413 | 10.013 | 12.338 | 6.384 | 3.412 | 5.100 | |
| WT4 | 11.112 | 7.583 | 9.230 | 4.848 | 2.513 | 3.825 | |
| WT5 | 15.396 | 9.528 | 11.962 | 5.773 | 2.845 | 4.498 | |
| WT1 | Net PCF (%) | 29.02 | 17.58 | 22.19 | 10.66 | 5.32 | 8.36 |
| WT2 | 36.62 | 24.38 | 29.85 | 15.49 | 8.19 | 12.3 | |
| WT3 | 34.67 | 22.52 | 27.75 | 14.36 | 7.67 | 11.47 | |
| WT4 | 42.28 | 28.85 | 35.12 | 18.45 | 9.56 | 14.55 | |
| WT5 | 29.29 | 18.13 | 22.76 | 10.98 | 5.41 | 8.56 | |
| WT1 | Percentage of time at Zero Power | 13.04 | 16.44 | 14.25 | 19.25 | 34.48 | 23.66 |
| WT2 | 5.55 | 6.66 | 6.39 | 7.35 | 11.86 | 8.42 | |
| WT3 | 10.33 | 12.77 | 11.4 | 14.57 | 25.38 | 17.58 | |
| WT4 | 10.27 | 12.71 | 11.33 | 14.48 | 25.21 | 17.47 | |
| WT5 | 10.43 | 12.91 | 11.5 | 14.73 | 25.71 | 17.8 | |
| WT1 | Percentage of time at Rated Power | 1.66 | 0.13 | 0.29 | 0.07 | 0.04 | 0.13 |
| WT2 | 0.04 | 0.00 | 0.03 | 0.01 | 0.00 | 0.02 | |
| WT3 | 0.78 | 0.06 | 0.14 | 0.05 | 0.02 | 0.09 | |
| WT4 | 0.32 | 0.02 | 0.07 | 0.04 | 0.01 | 0.06 | |
| WT5 | 0.74 | 0.06 | 0.14 | 0.05 | 0.02 | 0.09 |
| WTs | Location | L1 | L2 | L3 | L4 | L5 | L6 |
|---|---|---|---|---|---|---|---|
| WT1 | Annual GHG emissions (tons) | 2482.3 | 1503.6 | 1898.2 | 911.9 | 455.5 | 714.9 |
| WT2 | 3132.5 | 2085.3 | 2553.2 | 1324.9 | 700.9 | 1051.7 | |
| WT3 | 3010.1 | 1955.6 | 2409.5 | 1246.8 | 666.3 | 996.1 | |
| WT4 | 2170.3 | 1480.9 | 1802.6 | 946.8 | 490.9 | 746.9 | |
| WT5 | 3006.7 | 1860.9 | 2336.1 | 1127.4 | 555.7 | 878.4 | |
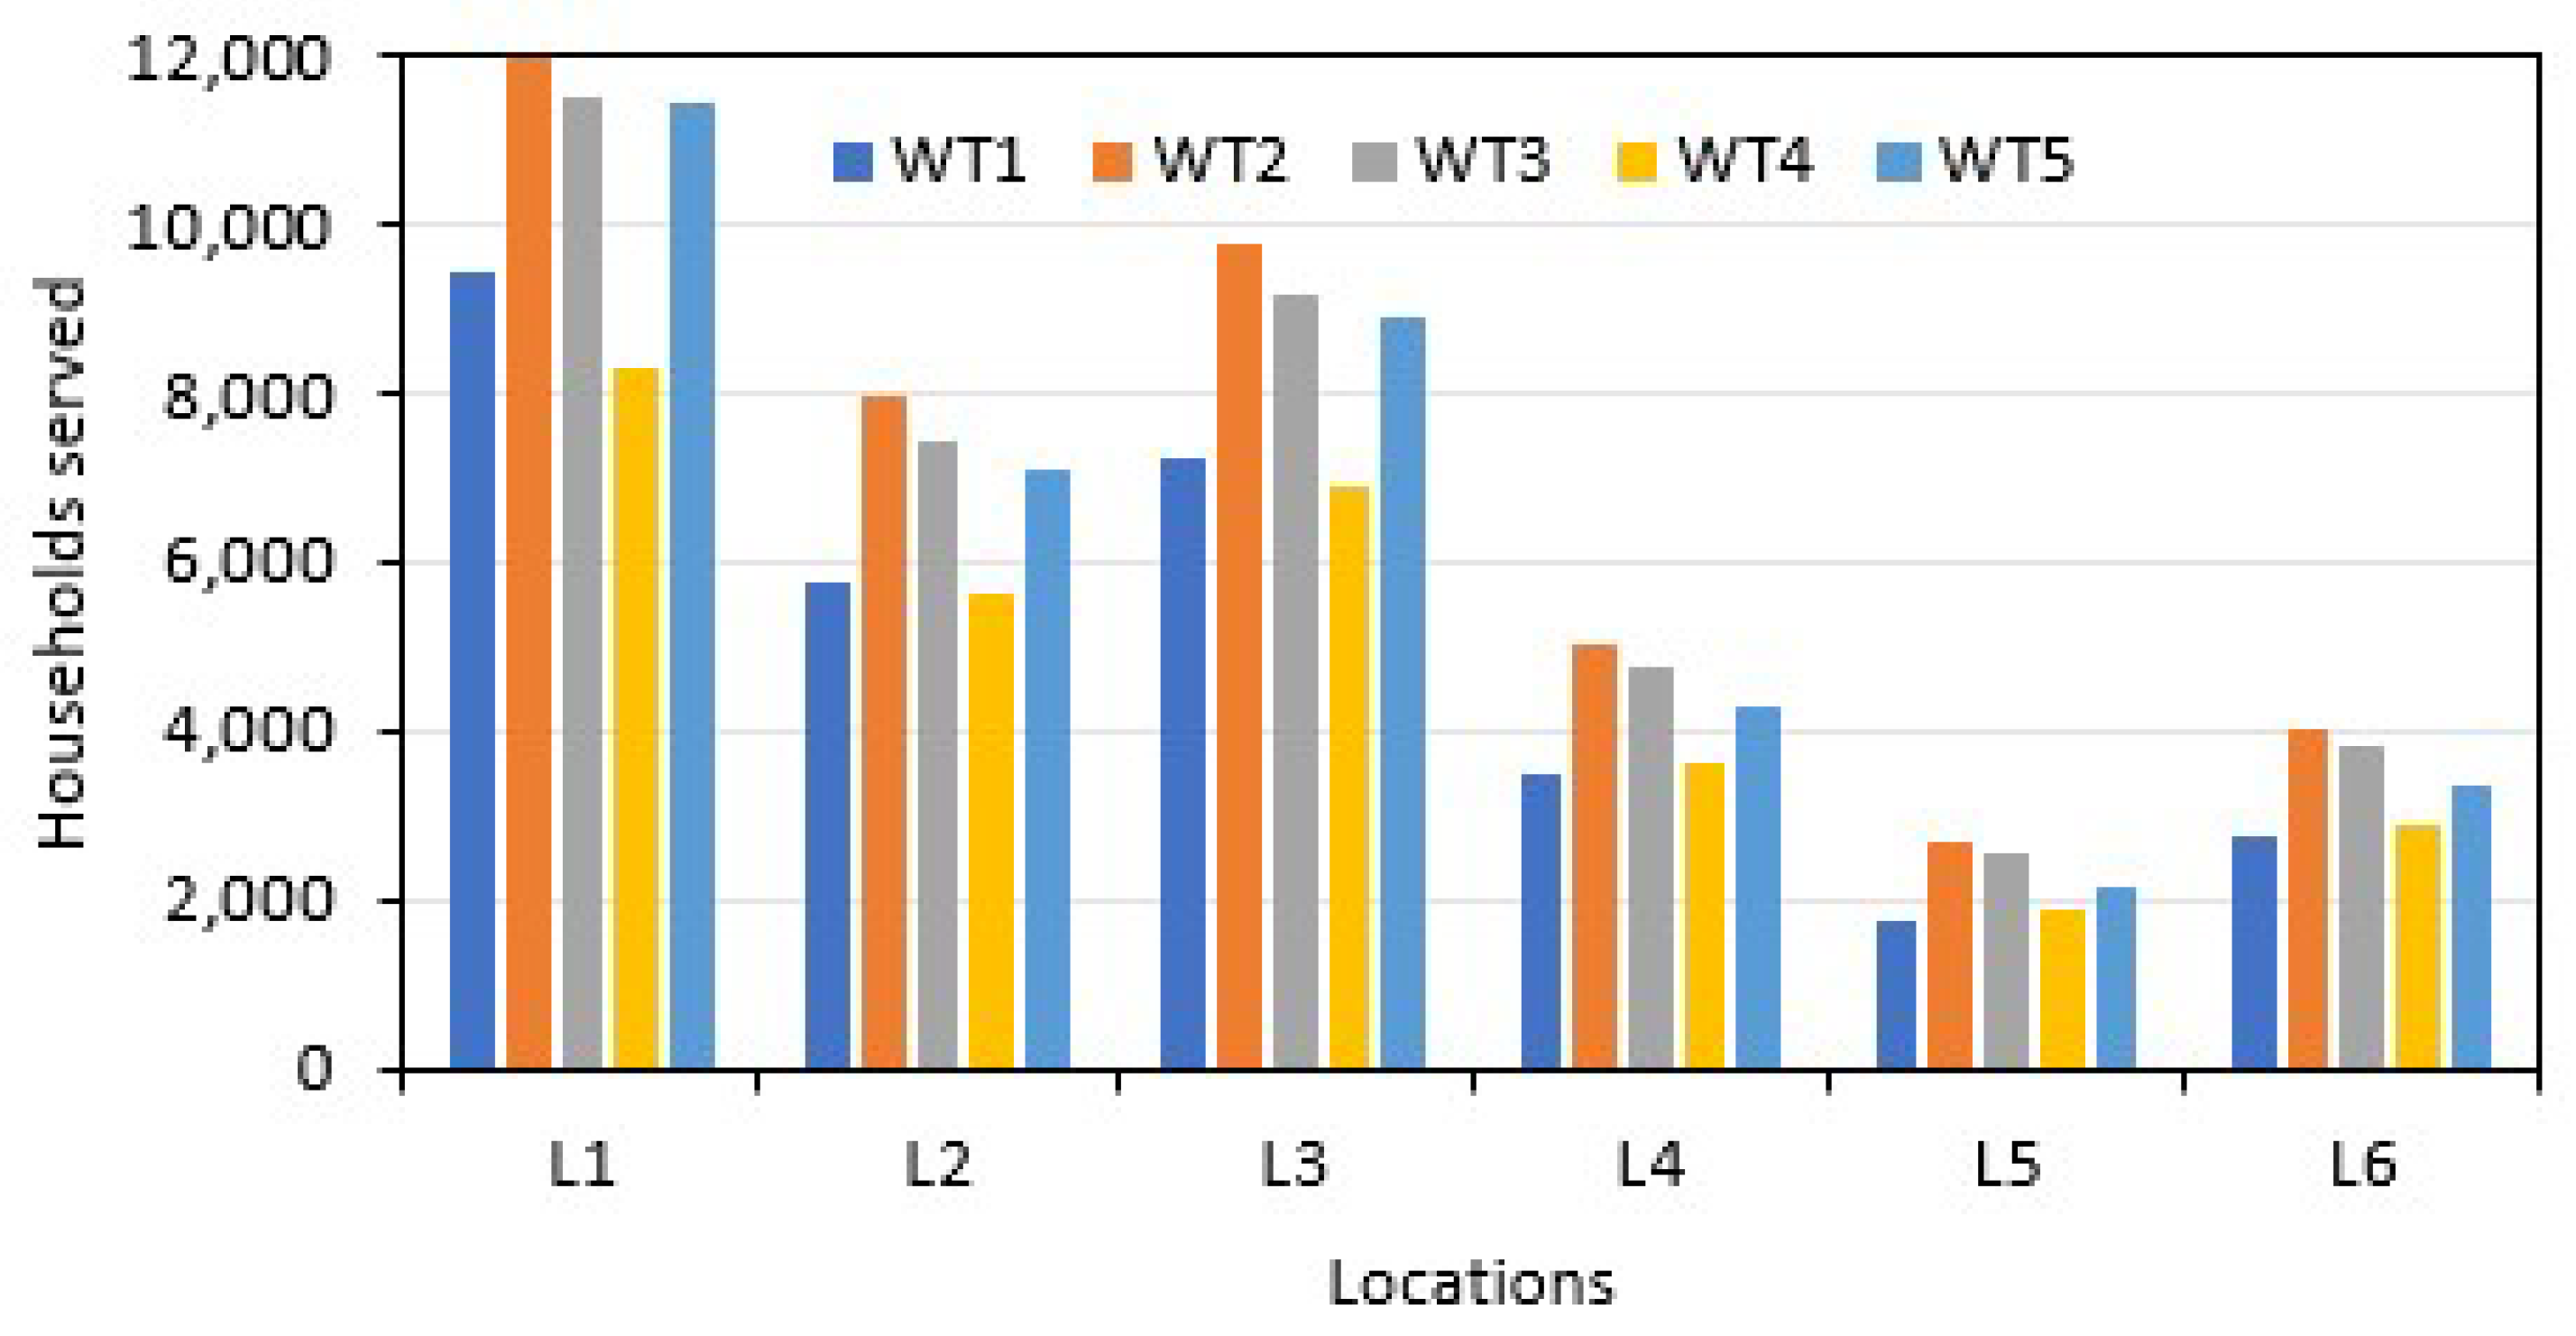
| WT1 | Households served power | 9463 | 5732 | 7236 | 3476 | 1736 | 2725 |
| WT2 | 11,941 | 7949 | 9733 | 5051 | 2672 | 4009 | |
| WT3 | 11,475 | 7455 | 9185 | 4753 | 2540 | 3797 | |
| WT4 | 8273 | 5645 | 6872 | 3609 | 1871 | 2847 | |
| WT5 | 11,462 | 7094 | 8905 | 4298 | 2118 | 3348 | |
| WT1 | Cars and light trucks not used | 455 | 275 | 348 | 167 | 83 | 131 |
| WT2 | 574 | 382 | 468 | 243 | 128 | 193 | |
| WT3 | 551 | 358 | 441 | 228 | 122 | 182 | |
| WT4 | 397 | 271 | 330 | 173 | 90 | 137 | |
| WT5 | 551 | 341 | 428 | 206 | 102 | 161 |
Disclaimer/Publisher’s Note: The statements, opinions and data contained in all publications are solely those of the individual author(s) and contributor(s) and not of MDPI and/or the editor(s). MDPI and/or the editor(s) disclaim responsibility for any injury to people or property resulting from any ideas, methods, instructions or products referred to in the content. |
© 2023 by the authors. Licensee MDPI, Basel, Switzerland. This article is an open access article distributed under the terms and conditions of the Creative Commons Attribution (CC BY) license (https://creativecommons.org/licenses/by/4.0/).
Share and Cite
Rehman, S.; Irshad, K.; Ibrahim, N.I.; AlShaikhi, A.; Mohandes, M.A. Offshore Wind Power Resource Assessment in the Gulf of North Suez. Sustainability 2023, 15, 15257. https://doi.org/10.3390/su152115257
Rehman S, Irshad K, Ibrahim NI, AlShaikhi A, Mohandes MA. Offshore Wind Power Resource Assessment in the Gulf of North Suez. Sustainability. 2023; 15(21):15257. https://doi.org/10.3390/su152115257
Chicago/Turabian StyleRehman, Shafiqur, Kashif Irshad, Nasiru I. Ibrahim, Ali AlShaikhi, and Mohamed A. Mohandes. 2023. "Offshore Wind Power Resource Assessment in the Gulf of North Suez" Sustainability 15, no. 21: 15257. https://doi.org/10.3390/su152115257
APA StyleRehman, S., Irshad, K., Ibrahim, N. I., AlShaikhi, A., & Mohandes, M. A. (2023). Offshore Wind Power Resource Assessment in the Gulf of North Suez. Sustainability, 15(21), 15257. https://doi.org/10.3390/su152115257