Article

Acceptance of Digital Transformation: Evidence from Romania

1
Faculty of Industrial Design and Business Management, “Gheorghe Asachi” Technical University of Iași, 700050 Iași, Romania
2
Faculty of Economics and Business Administration, Alexandru Ioan Cuza University of Iași, 700505 Iași, Romania
*
Author to whom correspondence should be addressed.
Sustainability 2023, 15(21), 15268; https://doi.org/10.3390/su152115268
Submission received: 8 September 2023 / Revised: 20 October 2023 / Accepted: 24 October 2023 / Published: 25 October 2023
(This article belongs to the Special Issue Digital Economy and Sustainable Development)

Abstract

:
The digital transformation (DT) implies designing products and services, to which digital technology is applied, that are adopted and used by customers. However, if people do not accept the new technologies embedded in the innovative products and services, DT will fail. Therefore, getting to know the determinant factors that affect acceptance is necessary, especially during economic turmoil that requires companies to become even more competitive. Moreover, Romania is lagging behind in its digital progress. The aim of this research is to draw upon a previous study on successful DT, analyze personal and social acceptance factors, and empirically verify whether they would affect DT in Romania. We identified from the literature the main factors (behavioral and innovative characteristics) affecting the DT acceptance attitude and adapted the theoretical model to the Romanian context. The study collected data from 123 persons using an online questionnaire and applied a structural equation model to test the theoretical model. The empirical results emphasize that the acceptance attitude of DT is positively associated with individuals’ behavioral factors and innovative characteristics. Moreover, DT acceptance attitude positively impacts both personal and social acceptance of DT. This research provides both theoretical and empirical contributions by adapting the theoretical DT model and testing it for the Romanian context, using personal and social acceptance. These findings are important for managers and policy makers that seek to transform their organizations.

1. Introduction

The digital transformation (DT) implies designing products and services, to which digital technology is applied, that are adopted and used by customers. However, if people do not accept the new technologies embedded in the innovative products and services, DT will fail. Therefore, getting to know the determinant factors that affect acceptance is necessary, especially during the economic turbulence from the cumulative effects of the recent pandemic and the Ukrainian crisis, which has led to great economic instability.
Whilst performing very well on connectivity, on the proportion of female ITC specialists in employment and ITC graduates, there are several indicators Romania is lagging behind. The human capital dimension, integration of digital technology, digital public services, and level of basic digital skills are all very low compared to the EU average [1]. The context of Romania’s performance is important because the European Commission allocates EUR 127 billion through national Recovery and Resilience Plans in order to support the digital transformation. The EU is monitoring member states’ digital progress through the Digital Economy and Society Index (DESI) country profile structured on four key areas: human capital, connectivity, integration of digital technology, and digital public services. Therefore, it is important to explore the factors that foster the acceptance of DT for Romania, as the results of the research may be used by other member states that have an overall low DESI score or are lagging behind in any of its four key areas [1].
Recent studies on the relationship between sustainability and digitalization have investigated the use of the digital transformation for sustainability purposes. Castro et al. [2] focused their research on identifying the ways that sustainability improves through digital transformation. Berger et al. [3] underlined that, at present, digitization is the most significant driver of entrepreneurship and innovation. For companies to grow in a volatile and uncertain environment and to achieve sustainable development, it is essential to pursue digital transformation [4]. Consequently, the sustainability transition can be accelerated through digitization [5].
In the era of digitalization and globalization, to achieve sustainable performance, companies must develop sustainable strategies that will enable them to better cope with limited resources [6]. Such digital technologies must be developed and implemented to enable digital transformation.
Whilst environmental, social, and economic sustainability had been viewed as triple bottom line perspectives, the digital age blurs such boundaries and transcends these dimensions [7]. Digital technologies and the transformations required for their implementation generate, beyond their intended benefits, some unintended positive and negative second-order consequences for society, firms, and individuals ([7], p. 600).
Previous studies focused on individual behavior regarding technology acceptance [8,9,10,11] rather than on social-level change or social acceptance. However, other studies [12,13,14,15] only analyzed social change without researching the DT dimension. This research builds on a previous study [16,17] that focused on both individual and social acceptance of DT. Whilst previous studies analyzed the determinant factors of successful acceptance and use of DT [18,19,20], this research aims to identify and analyze the factors enabling personal and social acceptance of DT in the Romanian context and to empirically test the model using an online survey. The paper seeks to test whether the acceptance attitude of DT is positively associated with individuals’ behavioral factors and innovative characteristics and if DT acceptance positively impacts both personal and social acceptance of DT in the Romanian context.

2. Literature Review and Hypothesis Development

2.1. Digital Transformation

Seeking to better understand the digital transformation, Martin [21] analyzed the literacies of the digital transformation and identified six important dimensions: computer, IT or Information and Communication Technology (ICT), which represents a continuum of knowledge and skills in order of increasing cognitive complexity [22], and technological, information, media, visual, and communication literacy.
Martin [21] highlights that change regarding the use of technology in society is complex and based on human actions and interactions with innovative technologies. Such transformations are neither sudden nor unexpected but a series of transitions on a continuum. The author states that digital transformation is achieved through individual usage of digital technology that will enable creativity and innovation and thus stimulate substantial change within a specific professional or knowledge domain ([21], p. 173).
DT was also defined as the “consumerization of IT” ([23], p. 209) through the changes and evolution required by personal and corporate IT environments to adapt for businesses to take advantage of new opportunities opened by the digital workplace. The author highlights the benefits of four technologies that would synergize through their interaction to enhance workforce productivity and profitability: mobile, big data, cloud computing, and search-based applications, inducing changes to individuals, organizations, and society, as it will impact both personal and organizational cultures ([23], p. 212).
Kane et al. [24] classifies businesses as “mature digital”, which integrate mobile, social, analytics, and cloud technologies, and “less mature”, which use individual digital technologies to solve discrete business problems. They define DT as the means to foster the adoption and use of technology by individuals, employees, and businesses through a change in strategy, culture, talent development, and leadership. These will drive DT through stories, risk acceptance, and better collaboration among people and teams rather than just through technology.
Udovita [25] highlights two important dimensions of DT: “digitization”, which refers to analog to digital conversion of information facilitating the use of digital formats, and “digitalization”, which uses digitization to improve existing goods and services and develop new business models and incorporate IT into the business strategies to exploit new digital opportunities. Her definition of DT includes four key dimensions: go-to-market, engagement, operations, and organizations.
A literature review on DT revealed two main perspectives: organizational and social. The organizational perspective includes corporate focus [26,27,28,29], services [30,31,32,33,34,35,36,37], SMEs from both manufacturing [38,39,40] and services [41,42], and transformation of the organizations’ business models [43,44,45,46] and social perspectives [47,48,49,50], including COVID 19 [51,52,53] and sustainability and CSR [54,55,56,57].
Based on the literature research, we adopted the DT definition used by Kyunghwan et al. ([16], p. 2): “activity in which an organization makes social changes through customer-centered business model improvements using new digital technologies”.

2.2. Model Development

2.2.1. Theory of Diffusion of Innovation (DOI)

The Theory of Diffusion of Innovation defines diffusion as a process of communicating innovation through certain channels over time among members of a social system and innovation as an idea, practice, or object that is perceived to be new by an individual or other unit of adoption. There cannot be diffusion without communication, defined by Rogers ([58], p. 5) as a convergent or divergent two-way process in which participants both create and share information to reach mutual understanding. As diffusion means communicating the latest ideas, this implies some degree of uncertainty and a lack of predictability, as there exist several alternatives with different probabilities of occurrence.
The theory of DOI identifies the factors and their relationship that affect the adoption rate of any innovation within a social system. There are five steps an individual passes through when adopting an innovation ([58], p. 20): knowledge (required to recognize it and understand how it functions), forming an attitude (favorable or not towards it), the decision to accept or reject, implementation (when the user puts innovation to use), and confirmation (when the adopter seeks reinforcement if exposed to conflicting messages about the innovation).
Rogers [58] defines five components of an innovation: relative advantage, compatibility, complexity, trialability, and observability. Relative advantage is a criterion that assesses the perceived degree of innovation being better or more advantageous compared with existing innovations. It can be measured in both economic and non-economic terms such as convenience, social prestige, or satisfaction. Compatibility assesses the potential adopters’ perceived degree of innovation consistency with existing values, needs, and past experiences to be accepted. Complexity measures the potential adopter’s perceived difficulty in understanding and using the innovation. Trialability evaluates whether the potential adopter may experiment with the innovation before adoption, on a limited basis. Observability considers the degree to which others may see the results of the innovation as the adopter is using it.
Further research on the perception of the adoption of an information technology innovation (AITI) had built upon DOI [59] and proposed a model based on eight concepts: voluntariness, relative advantage, compatibility, image, ease of use, result demonstrability, visibility, and trialability ([59], p. 216). Whilst important, the model must also consider that the adoption process is influenced by organizational context, user experience, and demographic characteristics [60]. Habit and risk are key factors that may trigger an individual’s resistance to innovation adoption [61].

2.2.2. Theory of Planned Behavior

Seeking to develop a general theory that would predict, explain, and influence behavior, Ajzen and Fishbein [8] developed the Theory of Reasoned Action (TRA) based on two predictors that influence the intention to perform a behavior: attitude towards the behavior and subjective norms (as social factors that refer to the perceived social pressure of whether or not to perform that behavior). TRA distinguishes two kinds of salient beliefs that influence attitudes toward behavior: behavioral and normative [9,10]. Further research revealed that some of the goals and behaviors were not under complete volitional control, and a new construct had to be included in the theory: perceived behavioral control [11], that is, a person’s perceived ease or difficulty in performing the behavior of interest. Such perceived control over behavior is influenced by both obstacles that may hinder or block access to a desired behavior as well as the facilitating factors, such as information available, skills, opportunities, and other resources that may facilitate and aid the process. This improved theory is the Theory of Planned Behavior (TPB), which facilitates the prediction and understanding of a particular behavior within specific contexts.

2.3. Research Hypotheses

Seeking to analyze the factors that enable DT in Romania, we built on previous research by Kyunghwan et al. [16] and used the same personal and social acceptance framework, to which we added two variables related to behavioral factors, specific for the Romanian context. In the theoretical framework proposed by Kyunghwan et al. [16], digital transformation acceptance attitude (DA) is a mediating factor, not an independent variable. We also assumed that behavioral factors and innovative characteristics will affect acceptance behavior (both personal and social acceptance), but their effect is mediated by DA (Figure 1).

2.3.1. Behavioral Factors

There are four constructs, each with specific items that were generated from literature research [17,58], defining the behavioral factors that affect DT: knowledge, individual innovativeness, self-efficacy, and involvement.
Knowledge represents the first of the five steps of Rogers’ DOI [58]. Without a positive attitude towards innovation, even if someone has the knowledge, he will not adopt it. A communication channel is required to connect someone that has the knowledge to “transfer” it to an individual that does not yet have appropriate knowledge about that innovation. Such diffusion requires time. The concept might also incorporate familiarity, defined as the number of product-related experiences accumulated by the consumer, and expertise, which is the ability to perform product-related tasks successfully ([62], p. 411) and is well-suited for digital technology.
Individual innovativeness describes how likely an individual is expected to belong to a category of early/late adoption of a new digital technology, compared with other members of the social system. It represents the degree to which an individual belongs to one of the five categories of early/late adopter [58], or their willingness to try out any new digital technology ([63], p. 206).
Self-efficacy is a significant direct determinant of behavior, as an individual subjectively judges whether they perceive that they have control over external and internal constraints and can perform a task [64]. It is equivalent to the “perceived ease of use” concept, defined as the belief that using digital technology would be free from physical and mental effort [59]. Self-efficacy as a concept represents the “subjective judgment of an individual who is confident that digital technology can be used easily” (as proposed by [16], p. 4).
Involvement was introduced by Muzafer Sherif in the Psychology of Social Norms [12], where it is linked to the ego as a factor in the activity motivated by basic needs.
Involvement is influenced by three major antecedent factors: characteristics of the person, stimulus, and situation [65]. As a motivational construct, it includes a person’s values, needs, and interest in innovative technologies or situations. The authors simplified their initial scale retaining the interest, need, importance, and meaning of a particular object [60]. Identifying that high involvement is more of a left brain activity and low involvement is associated with right brain activity, Krugman [66] highlights the importance of comparing users according to their degree of involvement. High-involvement users find the quality of arguments presented to them to be a more important determinant of persuasion compared with low-involvement ones [67], which underlines the importance of involvement when conducting a research study.
Beyond Kyunghwan et al.’s concepts [16], our research considered relevant to introduce in the questionnaire two more variables relevant for the Romanian sample: the estimated time used by the respondent to learn about new p/s with DT and whether the respondent wants to use p/s with advanced DT. Considering that involvement with digital technology is of high interest for both people and society, all variables were set up from the perspective of high involvement.
Hypothesis 1.
Knowledge, individual innovativeness, self-efficacy, and involvement have a positive impact on the behavioral factors that affect DT.

2.3.2. Innovative Characteristics

Relative advantage is a criterion people use to assess whether the innovation is perceived to be better than the idea it supersedes ([58], p. 15). It is a perceptual variable that was found to predict consumer adoption better compared with personal characteristics [68]. People will adopt digital technology faster if they perceive it to bring them more advantages compared to traditional technologies. That is, whether it has reduced complexity and is easier to use, whether it is compatible with their values and social norms, whether it may be experimented with on a limited basis, and whether its results are visible to others [58].
Technological innovativeness has a certain degree of benefit or advantage perceived by its adopters in DOI. Its benefits may be rooted in the reduction in uncertainty, as a potential adopter is motivated to exert effort and learn about its anticipated consequences. He or she may also seek the possible efficacy of that innovation in solving a perceived problem [58] by using the latest technology, which is new, original, creative, and different from those that already exist on the market. Ram [69] highlights the importance of perceived newness by the consumer. Regardless of the amount of “newness” introduced by the firm, if it is not perceived by the consumer, he or she will not adopt it. This may not be due to consumer resistance to technological innovation but to the failure of the communication effort to stimulate optimal newness. Digital technology incorporates a great amount of change and many technological innovations.
Hypothesis 2.
Technological innovativeness and relative advantage have a positive impact on the innovative characteristics that affect DT.
Hypothesis 3.
Behavioral factors and innovative characteristics have a positive impact on DT.

2.3.3. Personal and Social Acceptance

Digital transformation cannot be achieved without personal and social acceptance of innovative technologies. The three important technology adoption models are the Technology Acceptance Model (TAM) [70], the Theory of Planned Behavior (TPB) [11], and the Unified Theory of Acceptance and Use of Technology (UTAUT) [60]. Whilst all three models include constructs of both use intention and behavior as indicators of technology acceptance, all have constructs regarding both personal and social acceptance. Therefore, the questionnaire used in this research includes intention (willing and should use) and behavior (use, increase the use) for both personal and social acceptance constructs.

2.3.4. Acceptance Attitude for Digital Transformation (DT)

People’s behaviors are caused by intentions and their actual control (skills/abilities and environmental factors) which are, in turn, influenced by their behavioral, normative, and control beliefs and individual, social, and informational factors ([10], p. 22). Acceptance and use of digital technology is affected by that technology’s perceived usefulness, ease of use, and acceptance [70] on both personal and organizational levels. Therefore, we considered in this study the acceptance attitude of digital transformation as mediating personal or social acceptance.
Hypothesis 4.
Acceptance attitude of digital transformation has a positive impact on personal acceptance.
Hypothesis 5.
Acceptance attitude of digital transformation has a positive impact on social acceptance.

3. Materials and Methods

3.1. Questionnaire

The questionnaire applied for data collection was developed starting from the question list proposed by Kyunghwan et al. [16]. It was completed with two variables relevant for the Romanian context: the estimated time used by the respondent to learn about new p/s with DT and whether the respondent wanted to use p/s with advanced DT. The questionnaire was pretested to ensure that it was properly understood by the respondents.

3.2. Sample

The data were collected through an online survey during May and June 2022 from users across Romania. The questionnaire was created in Google Forms. The research focused on individuals rather than employees of a specific industrial sector or users of a specific digital technology, such as e-commerce. Reaching people from different regions of Romania was significantly difficult in applying probabilistic sampling. Therefore, a mixture of non-probabilistic convenience and snowball sampling methods was used for data collection. The link to the Google Forms questionnaire was distributed using both e-mail and social media (Facebook and WhatsApp).
Overall, 123 completed questionnaires were collected. The structure of the sample according to socio-demographic characteristics is shown in Table 1. The sample is described along a set of demographic variables, such as age, gender, and area of residence, as well as from the perspective of experience and degree of digitalization.
The largest share of respondents (65%) belongs to the age group of 36–55 years. From the gender perspective, the sample is well-balanced (51.2% of respondents are women, and 48.8% of respondents are men). Most of the respondents (34.1%) have between 21 and 30 years of experience. The segment of respondents that consider themselves digitally mature represents more than a quarter of the sample (26.8%). Also, more than a quarter of respondents (29.3%) are not capable of assessing their level of digitalization.

3.3. Method

To obtain a structural model that can be used to confirm the theoretical model, we applied structural equation modeling (SEM) based on partial least squares analysis (PLS) using SmartPLS software (v. 4.0.8.2) [71]. The PLS-SEM approach consists of two models based on covariance structural equation modeling; the measurement model specifies how latent variables (hypothetical constructs) are indicated by the observed variables, and the structural equation model specifies the causal relationship among constructs. The reliability and validity analyses have been applied for testing the measurement model. Moreover, the structural model validation implied the estimation of the path coefficients and their significance. The objective of the algorithm is to maximize the explained variance of the dependent latent variables in the PLS path model [72]. The PLS technique has the capability to model latent constructs under the next two conditions: non-normality and small or medium sample sizes [73].
PLS-SEM has been recently applied in empirical research on digital transformation. Zhang et al. [74] studied the improving role of digital transformation for organizational resilience, while Galindo-Martin et al. [75] analyzed the effects of digital transformation and digital dividends on entrepreneurial activity. The results of Ko et al. [76] reveal the role of business and management commitment to digital innovations and of IT departments in digital transformation. Moreover, using PLS-SEM, Singh et al. [77] highlight that digital transformation is impacted by competitive pressure, IT readiness, organizational mindfulness, and strategic alignment. Korachi and Bounabat [78] used SEM to define and identify a digital transformation strategy. El Hilali et al. [79] applied PLS-SEM and identified the main drivers of companies’ digital transformation (customers, data, and innovation) and their impact on sustainability. Also, Sousa and Rocha [80] used the SEM approach to identify the importance of skills for an effective digital transformation. Nayal et al. [6] investigated, by means of SEM, the relationship between digital transformation, supply chain collaboration and coordination, sustainable development strategy, and collaborative advantages, and their influence on sustainable supply chain firm performance. Jovic et al. [81] have identified that organizational, technological, and environmental factors affect the digitalization of organizations in the maritime transport sector. By applying PLS-SEM, Capusneanu et al. [82] found a positive and significant association between the intention to use Industry 4.0 solutions and the benefits of digital transformation.

3.4. Variables

In this study, we have considered the following major constructs of digital transformation: behavioral factors (BF) and innovative characteristics (IC) that directly influence digital transformation acceptance attitude (DA), which directly influence personal acceptance (PA) and social acceptance (SA).
The measurement items (observed variables) corresponding to each construct (latent variables) are presented in Table 2, along with validity and reliability measures.
The internal consistency of the constructs was tested using Cronbach’s alpha. It measures the degree to which the items quantifying the same concept are consistent [83]. We can conclude that the internal consistency is validated because all the alpha values are above 0.8.
The two-stage analytical approach for SEM consists of the following procedures: the test of the measurement model (validity and reliability of the measures), and then the examination of the structural model [73].

4. Results

4.1. Measurement Model

First, the measurement model was assessed for convergent validity using the following indicators: factor loadings, composite reliability (CR), and average variance extracted (AVE). Table 2 shows that all item loadings surpass the recommended value of 0.6 [84].
Composite reliability values show to what degree the construct indicators explain the latent construct. The CR values exceed the recommended value of 0.7; therefore, the construct indicators are representative of the latent construct.
The average variance extracted reflects the total amount of variance in the indicators accounted for by the latent construct. The AVE values exceed the recommended value of 0.5; therefore, the latent constructs account for an important share of the overall variance in the indicators [73].
Table 3 presents the convergent validity and reliability indicators. For all the constructs, the CR and AVE values are appropriate.
Consequently, the results on the measurement model indicate an adequate level of convergent reliability and validity.

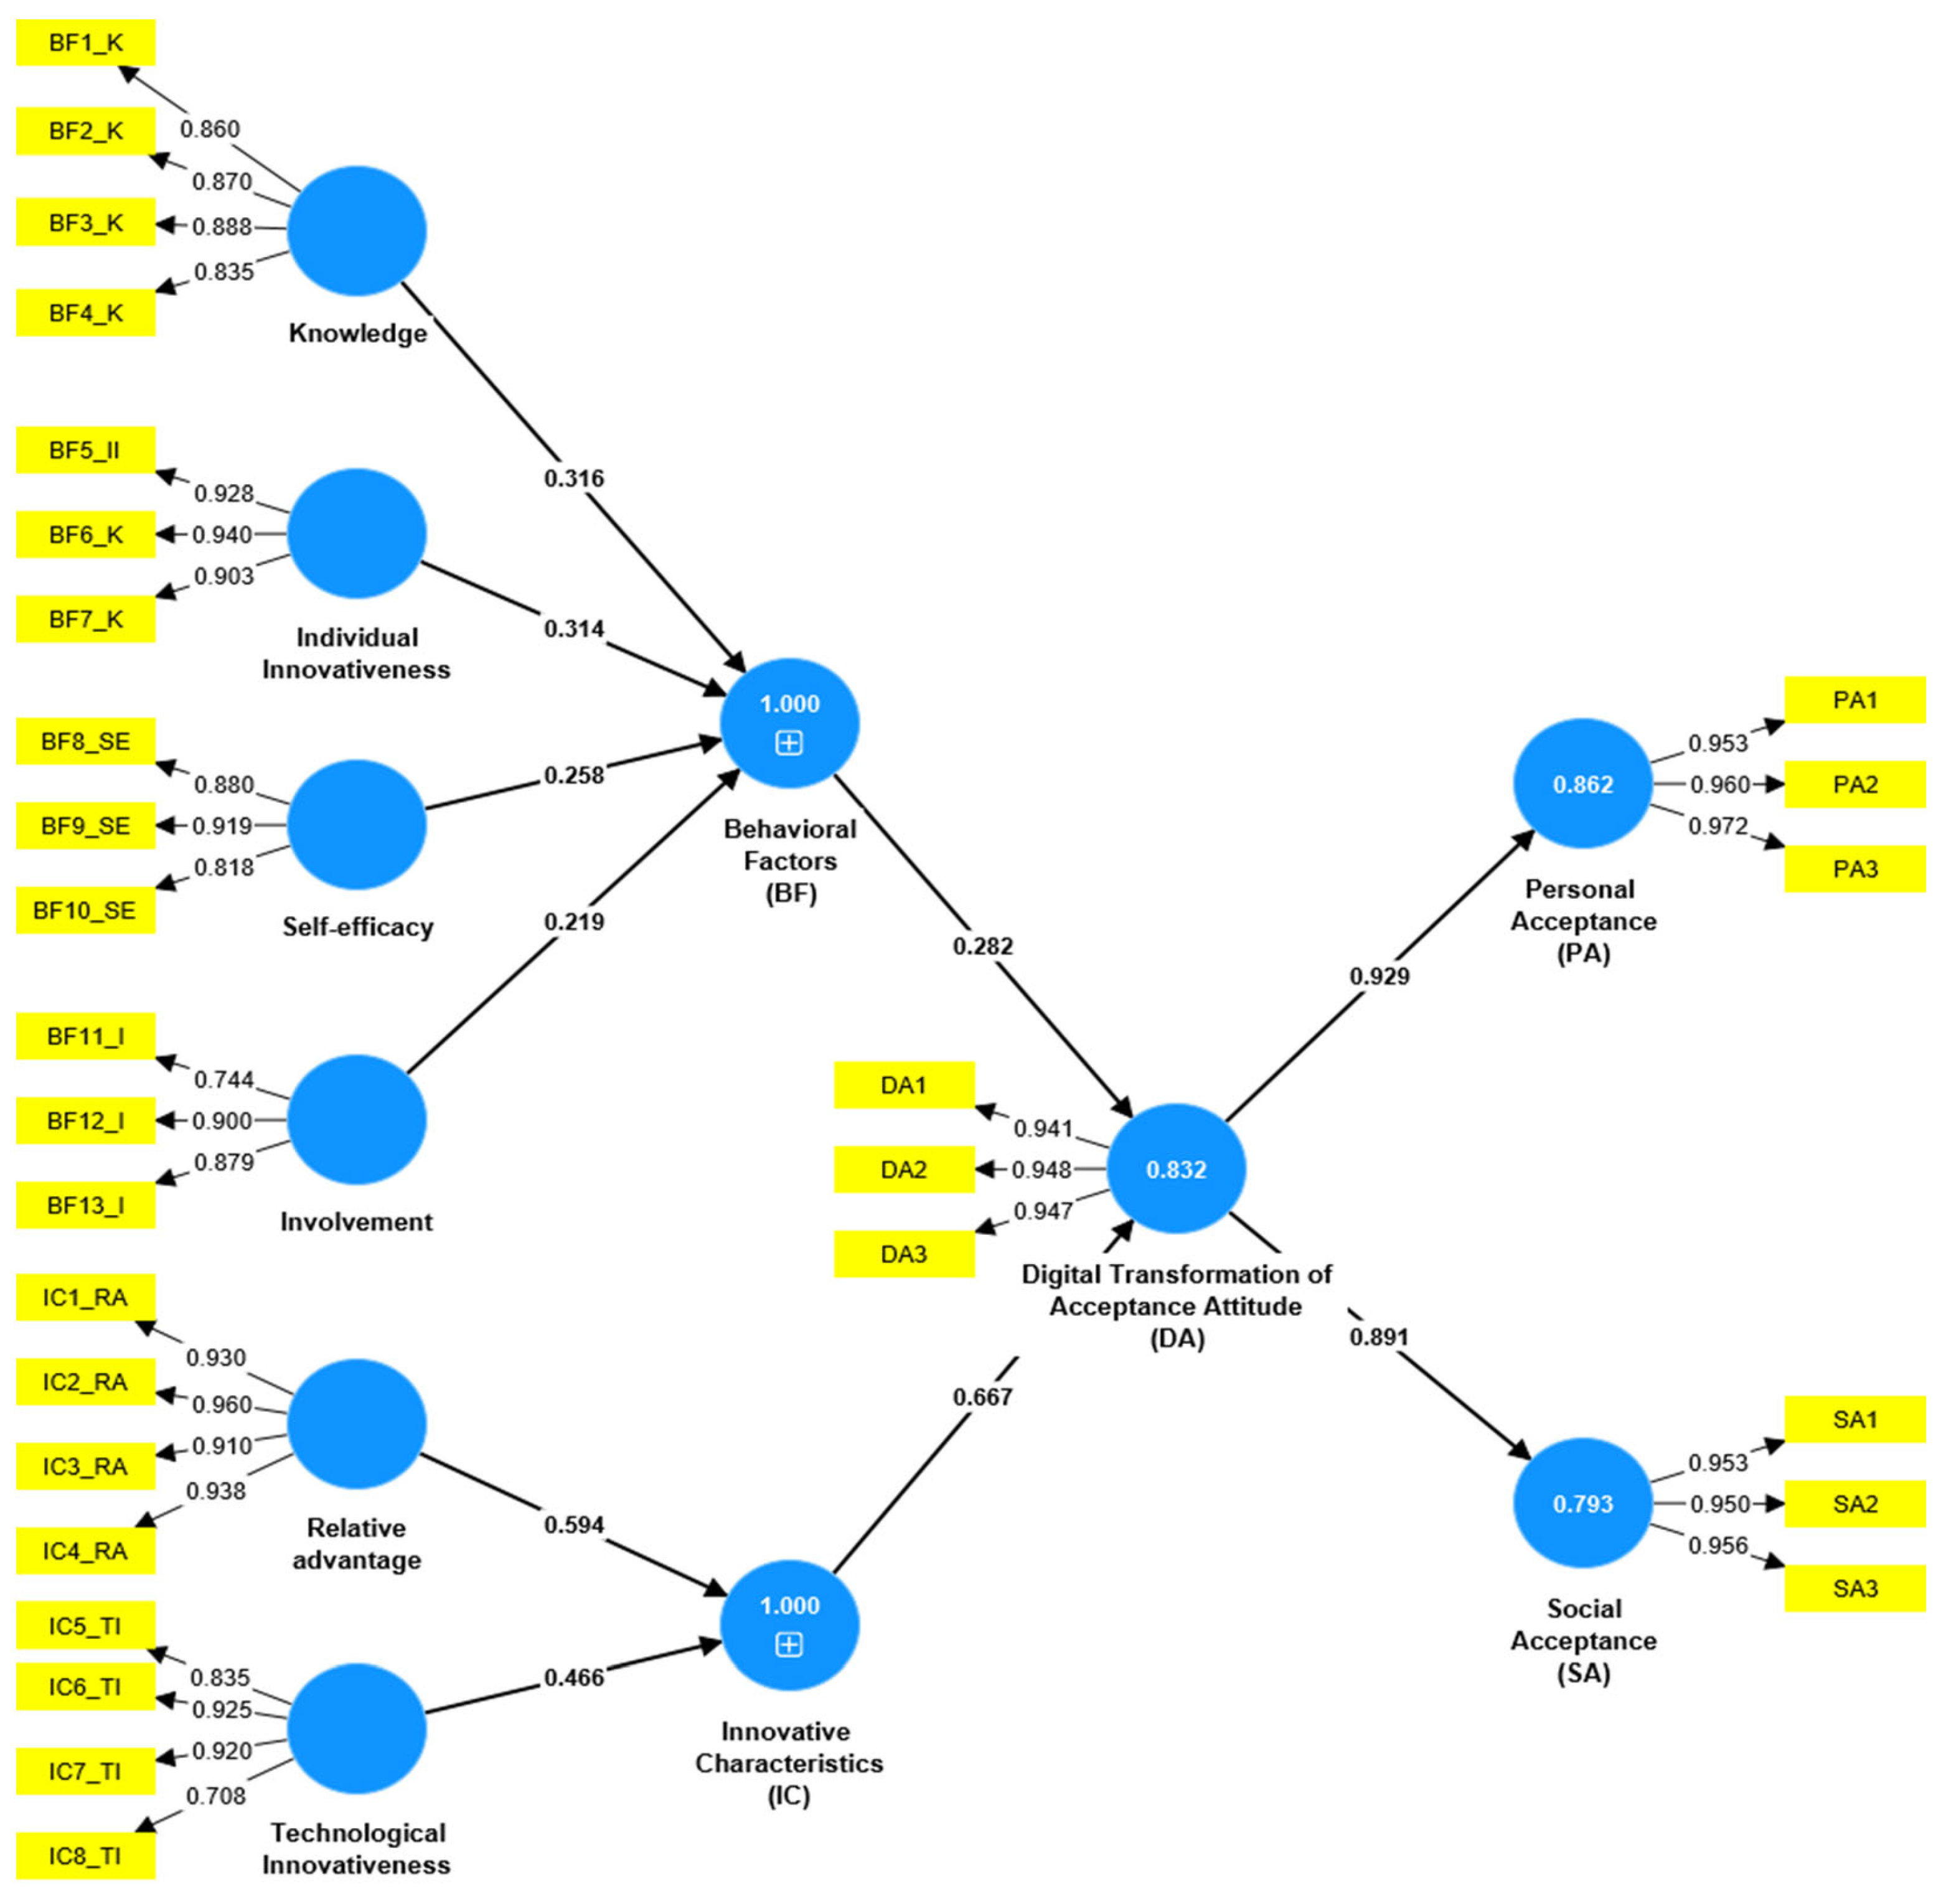
4.2. Structural Model

The results concerning the relationship between latent variables involve the interpretation of the beta estimations, and corresponding t-values, via bootstrapping procedure.
The output of SEM-PLS shows that both BF and IC significantly influence DA (β = 0.282 and β = 0.667, respectively). Moreover, DA affects significantly both PA (β = 0.929) and SA (β = 0.891). Therefore, the research hypotheses are all supported (Table 4).
The structural model is assessed through quality indicators such as R2 and the effect sizes (f2). The R2 values highlight a substantial model [85,86]. BF and IC explain together 83.2% of the variance in DA (R2 = 0.832), while DA explains 86.2% of the variance in PA (R2 = 0.862) and 79.3% of the variance in SA (R2 = 0.793). The values of the effect sizes (f2) show that the BF → DA relationship has a medium effect (f2 > 0.15 for medium effects), while the other relationships have a large effect (f2 > 0.35 for large effects) [85,86].
The results of the structural model are presented in the diagram shown in Figure 2.

5. Discussions

The study aimed to explore the determinant factors affecting personal and social acceptance of DT and to verify empirically the effects of these determinants based on the data regarding Romanian practitioners collected by means of a questionnaire.
Whilst drawing on Kyunghwan et al.’s [16] study, our research adapted the model to the Romanian context, resulting a measurement model that indicates an adequate level of convergent reliability and validity. Our research has brought statistical evidence showing that the projected structural model for evaluating the impact of the determinants of digital transformation is significant for the Romanian context. It also indicated that for a successful DT, ‘social change’ is required by organizations and society along with the adoption of new technology, as also indicated in Kyunghwan et al.’s [16] paper.
The results indicate that all five hypotheses formulated in the study have been validated. All the indicators of the latent variables considered measure well the concepts and are representative of the nine latent constructs.
The path coefficients that explain the relationship between each of the determinants of individuals’ behavioral factors are positive and statistically significant. Therefore, knowledge, individual innovativeness, self-efficacy, and involvement have a positive impact on the behavioral factors that affect DT. Thus, hypothesis H1 is validated.
Also, the path coefficients that explain the relationship between each of the determinants of individuals’ innovative characteristics are positive and statistically significant. Consequently, technological innovativeness and relative advantage have a positive impact on the innovative characteristics that affect persons’ acceptance attitude of DT. Hence, hypothesis H2 is validated.
The path coefficients that quantify the impact of behavioral factors and innovative characteristics are positive and significant. Also, BF and IC explain together 83.2% of the variance in the individuals’ acceptance attitude of DT. Consequently, hypothesis H3 is validated.
These results are consistent with the Theory of Planned Behavior, which states that people’s behavioral factors and innovative characteristics have a direct effect on their acceptance of technology.
The important levels of the variance of the latent variables explained by the considered factors highlight that the structural model is valid. Individuals’ acceptance attitude of DT explains 86.2% of the variance in personal acceptance and 79.3% of the variance in social acceptance. The findings for the path coefficients show statistically significant effects of the acceptance attitude of DT both on PA and SA. Therefore, hypotheses H4 and H5 are both validated.
In addition, we have compared the level of the factors (behavioral factors and innovative characteristics), the acceptance attitude, and consequences of digital transformation (personal and social acceptance) among various groups of respondents defined according to socio-demographic characteristics.
According to age, we have identified a significant difference among the persons aged 56–64 and the other age groups in relation to the acceptance attitude of digital transformation (the probability corresponding to Fisher’s test and post hoc tests is lower than the significance level of 10%). The respondents aged 56–64 have a significantly lower acceptance attitude of digital transformation compared to the respondents in the other age groups.
According to gender, we have noticed that the behavioral factors manifest with a higher intensity in the case of male respondents compared to female respondents (the probability corresponding to Student’s test is smaller than the significance level of 5%).
According to the degree of digitalization, we have observed that the respondents with informative organizational level have lower scores for all the five constructs compared to the groups of respondents with other degrees of digitalization (the probability corresponding to Fisher’s test and post hoc tests is lower than the significance level of 1%). Therefore, respondents with informative organizational level of digitalization show a smaller acceptance attitude of digital transformation and of personal and social acceptance than other groups of respondents.
With respect to area of residence, we have not identified any significant differences in the scores for the five constructs between urban and rural respondents.
Whilst it is very difficult to compare our results to other studies due to our framework based on personal and social acceptance derived from acceptance attitude of digital transformation (see Figure 2), we would like to establish connections with other studies on the acceptance of digital technologies.
Literature research revealed a very small number of studies with Romanian samples, all focused on companies’ digital transformation, but without special focus on acceptance. Căpușneanu et al. [82] seeks to analyze the impact of distinct factors on the intention to use Industry 4.0 processes and solutions that would lead to perceived benefits of digital transformation and employed the same methodology (survey and analysis uses SmartPLS software) as in our study. Vuță et al. [87] focuses on entrepreneurs’ perceptions regarding digital transformation through marketing during difficult times. Their results revealed that the limited resources available to SMEs acted as a barrier towards embracing marketing digital transformation for most of the companies from the sample, even if entrepreneurs have shown an awareness of the major impact that online presence may have on sales. By contrast, all five of our research hypotheses were validated and the results proved that behavioral factors and innovative characteristics have a direct effect on their acceptance of technology, which is consistent with the Theory of Planned Behavior.
There are also several studies [18,19,20,88,89,90] that analyzed the acceptance of digital technologies in specific samples: employees’ acceptance [20,88], young people and citizens [18,19], and consumer’s acceptance [89,91]. Dakduk et al. [88] reported a series of divergent results contrary to other studies, where among other constructs, social influence did not significantly affect low-income consumers’ intention to use digital technologies. One of the possible explanations is national culture [88]. Both Ecuador and Romania are countries that have very high scores on power distance and uncertainty avoidance [89]. The extent to which the less powerful members of institutions and organizations within a country expect and accept that power is distributed unequally represents the power distance, which means that Romanian people accept hierarchical order in which everybody has a place and which needs no further justification [89]. In an organization with strong hierarchy, subordinates are expected to do what they are told; the ideal boss is a benevolent autocrat and there exists inherent inequalities. Thus, in Romania, personal acceptance of technology may be influenced by some of the respondent’s managers and supervisors. An unknown future implies the decision to try to control the future or just let it happen. This means that society deals with ambiguity of the future, representing uncertainty avoidance [89]. Romania as a country with high uncertainty avoidance has a culture where there exists an emotional need for rules (even if these never seems to work), where people have an inner urge to be busy and work hard, where innovation may be resisted, and where security is an important element of individual motivation [89]. Romania also has a moderate individualism score, being considered a collective society. Individualism is the degree of interdependence a society maintains among its members, and Romanians manifest a close long-term commitment to the member group that may include family, extended family, or extended relationships, to which they are loyal, overriding most other societal rules and regulations.
In our study, the results indicate that the path coefficients show statistically significant effects of the acceptance attitude of DT both on personal acceptance and social acceptance (SA), but the SA construct is based on different variables compared to social influence, reported in [88].

6. Conclusions

The paper seeks to investigate the determinant factors that affect the personal and social acceptance of DT, and to empirically verify those effects with a questionnaire data collected from a Romanian sample. The study conducted a theoretical literature review including acceptance, digital transformation, acceptance, Theory of Planned Behavior (TPB), Theory of Diffusion of Innovation (DOI), etc. A research model was developed based on previous research by Kyunghwan et al. [16] that used the same personal and social acceptance framework, to which we added two variables related to behavioral factors, specific for the Romanian context.
The research results contribute to both academic and practical perspectives. For the academic perspective, it adds knowledge on a theoretical model that examined the factors affecting personal and social acceptance of DT. It also applies the methodology used by Kyunghwan et al. [16] for a Romanian sample and provides similar results. The study supports TPB, in showing that the acceptance attitude of DT is positively associated with individuals’ behavioral factors and innovative characteristics.
Our empirical results also showed that DT acceptance positively impacts both personal and social acceptance of DT in the Romanian context, distinguishing between individual and social acceptance, not previously explicitly distinguished, excepting [16]. From a practical perspective, this study offers a valuable perspective on the determinants of a successful DT, by suggesting the determinant factors for DT. Therefore, the research results could be applied by responsible experts in transferring an organization to innovative technology. The main outcomes boost the information on how technology is accepted and disseminated at individual and societal levels.
Our research provides a series of practical implications. On a country level, the degree of digital transformation may be assessed using DESI (Digital Economy and Society Index). As Romania is lagging behind on several indicators, the results may be useful for other countries that have a low overall DESI score or lag behind on some of the indicators. Another practical implication is the use at the country level of the Hofstede Insights, in order to gain access to the country’s position on the six cultural dimensions [89]. Such cultural and individual positioning would provide a better understanding of the mechanisms that would influence the acceptance attitude of digital transformation and subsequently personal and social acceptance.
Although this study provides a number of contributions, there are a few limitations that should be mentioned.
First, the study is based on a small sample (123 respondents) due to the focus of the paper on individuals rather than employees of a specific industrial sector or users of a specific digital technology, such as e-commerce.
The second limitation is due to the difficulties in applying probability sampling techniques, especially when trying to reach people from different regions of Romania. Consequently, a mixture of non-probabilistic convenience and snowball sampling methods was used for data collection.
Third, our survey may be subject to social desirability bias, that is, respondents may have overstated their digital transformation acceptance, either consciously or unconsciously.
Further research should consider other latent variables that have an impact on digital transformation and that may incorporate socially oriented concepts. Multigroup Analysis, which identifies differences among groups of respondents from various industries, should also be applied. Follow-up research may also be conducted with questionnaires using samples from various specific industries.

Author Contributions

Conceptualization, B.R. and I.D.; methodology, S.A. and B.R.; software, C.B.S.; validation, C.B.S.; investigation, I.D.; resources, B.R.; writing—original draft preparation, B.R. and C.B.S.; writing—review and editing, S.A.; supervision, B.R.; project administration, B.R. All authors have read and agreed to the published version of the manuscript.

Funding

This research received no external funding.

Institutional Review Board Statement

Not applicable.

Informed Consent Statement

Not applicable.

Data Availability Statement

The data presented in this study are available on request from the corresponding author.

Conflicts of Interest

The authors declare no conflict of interest.

References

  1. Digital Economy and Society Index (DESI) 2022: Romania. Available online: https://ec.europa.eu/newsroom/dae/redirection/document/88717 (accessed on 1 September 2023).
  2. Castro, G.D.R.; Fernandez, M.C.G.; Colsa, A.U. Unleashing the convergence amid digitalization and sustainability towards pursuing the Sustainable Development Goals (SDGs): A holistic review. J. Clean. Prod. 2021, 280, 122204. [Google Scholar] [CrossRef]
  3. Berger, E.S.; Von Briel, F.; Davidsson, P.; Kuckertz, A. Digital or Not—The Future of Entrepreneurship and Innovation: Introduction to the Special Issue. J. Bus. Res. 2021, 125, 436–442. [Google Scholar] [CrossRef]
  4. Xu, J.; Yu, Y.; Zhang, M.; Zhang, J.Z. Impacts of digital transformation on eco-innovation and sustainable performance: Evidence from Chinese manufacturing companies. J. Clean. Prod. 2023, 393, 136278. [Google Scholar] [CrossRef]
  5. George, G.; Schillebeeckx, S.J.D. Digital transformation, sustainability, and purpose in the multinational enterprise. J. World Bus. 2022, 57, 101326. [Google Scholar] [CrossRef]
  6. Nayal, K.; Raut, R.D.; Yadav, V.S.; Priyadarshinee, P.; Narkhede, B.E. The impact of sustainable development strategy on sustainable supply chain firm performance in the digital transformation era. Bus. Strategy Environ. 2022, 31, 845–859. [Google Scholar] [CrossRef]
  7. Bohnsack, R.; Bidmon, C.M.; Pinkse, J. Sustainability in the digital age: Intended and unintended consequences of digital technologies for sustainable development. Bus. Strategy Environ. 2022, 31, 599–602. [Google Scholar] [CrossRef]
  8. Ajzen, I.; Fishbein, M. Understanding Attitudes and Predicting Social Behavior; Prentice Hall: New York, NY, USA, 1980. [Google Scholar]
  9. Ajzen, I.; Madden, T.J. Prediction of Goal-Directed Behavior: Attitudes, Intentions, and Perceived Behavioral Control. J. Exp. Soc. Psychol. 1986, 22, 453–474. [Google Scholar] [CrossRef]
  10. Fishbein, M.; Ajzen, I. Predicting and Changing Behavior: The reasoned Action Approach; Psychology Press, Taylor and Francis Group: New York, NY, USA, 2010. [Google Scholar]
  11. Ajzen, I. The Theory of Planned Behavior. Organ. Behav. Hum. Decis. Process. 1991, 50, 179–211. [Google Scholar] [CrossRef]
  12. Sherif, M. The Psychology of Social Norms; Harper & Brothers: New York, NY, USA, 1936. [Google Scholar]
  13. Balázsi, A.; Riechers, M.; Hartel, T.; Leventon, J.; Fischer, J. The impacts of social-ecological system change on human-nature connectedness: A case study from Transylvania, Romania. Land Use Policy 2019, 89, 104232. [Google Scholar] [CrossRef]
  14. Vaduva, S.; Echevarria-Cruz, S.; Takacs, J., Jr. The economic and social impact of a university education upon the development of the Romanian tourism industry. J. Hosp. Tour. Manag. 2020, 27, 100270. [Google Scholar] [CrossRef]
  15. Mitrica, B.; Damian, N.; Grigorescu, I.; Mocanu, I.; Dumitrascu, M.; Persu, M. Out-migration and social and technological marginalization in Romania. Regional disparities. Technol. Forecast. Soc. Change 2022, 175, 121370. [Google Scholar] [CrossRef]
  16. Kyunghwan, O.; Hyeongseog, K.; Youngjin, C.; Seogjun, L. Determinants for Successful Digital Transformation. Sustainability 2022, 14, 1215. [Google Scholar] [CrossRef]
  17. Son, S.Y.; Moon, J.W.; Yang, K.M.; Kim, S.Y.; Park, C.H.; Hong, E.Y.; Lee, H.J.; Song, D.S.; Park, Y.L.; Jang, M.J.; et al. Study on the Advancement and Determinants of the Social Acceptability Model of Intelligent Information Technology: Cooperative Study of the Economic and Humanities Society 19-41-02; Korea Information Society Development Institute (KISDI): Deoksan-eup, Republic of Korea, 2019; Available online: https://www.kisdi.re.kr/report/view.do?key=m2101113024153&arrMasterId=3934560&masterId=3934560&artId=552164 (accessed on 20 September 2022).
  18. Ruiz-Herrera, L.G.; Valencia-Arias, A.; Gallegos, A.; Benjumea-Arias, M.; Flores-Siapo, E. Technology acceptance factors of e-commerce among young people: An integration of the technology acceptance model and theory of planned behavior. Heliyon 2023, 9, e16418. [Google Scholar] [CrossRef]
  19. Macht, J.; Klink-Lehmann, J.; Hartmann, M. Don’t forget the locals: Understanding citizens’ acceptance of bio-based technologies. Technol. Soc. 2023, 74, 102318. [Google Scholar] [CrossRef]
  20. Höyng, M.; Lau, A. Being ready for digital transformation: How to enhance employees’ intentional digital readiness. Comput. Hum. Behav. Rep. 2023, 11, 100314. [Google Scholar] [CrossRef]
  21. Martin, A. Digital Literacy and the “Digital Society”. In Digital Literacies Concepts, Policies and Practices; Lankshear, C., Knobel, M., Eds.; Peter Lang Publishing: New York, NY, USA, 2008; Volume 30, pp. 151–176. [Google Scholar]
  22. ICT Literacy Panel. Digital Transformation A Framework for ICT Literacy; Educational Testing Service: Princeton, NJ, USA, 2002. [Google Scholar]
  23. White, M. Digital workplaces: Vision and reality. Bus. Inf. Rev. 2012, 29, 205–214. [Google Scholar] [CrossRef]
  24. Kane, G.C.; Palmer, D.; Phillips, A.N.; Kiron, D.; Buckley, N. Strategy, not Technology, Drives Digital Transformation. MIT Solan Manag. Rev. Deloitte Univ. Press 2015, 14, 1–25. [Google Scholar]
  25. Udovita, P.V.M.V.D. Conceptual Review on Dimensions of Digital Transformation in Modern Era. Int. J. Sci. Res. Publ. 2020, 10, 520–529. [Google Scholar] [CrossRef]
  26. AlNuaimi, B.K.; Singh, S.K.; Ren, S.; Budhwar, P. Mastering digital transformation: The nexus between leadership, agility, and digital strategy. J. Bus. Res. 2022, 145, 636–648. [Google Scholar] [CrossRef]
  27. Niu, Y.; Wen, W.; Wang, S.; Li, S. Breaking barriers to innovation: The power of digital transformation. Financ. Res. Lett. 2023, 51, 103457. [Google Scholar] [CrossRef]
  28. Weber, E.; Büttgen, M.; Bartsch, S. How to take employees on the digital transformation journey: An experimental study on complementary leadership behaviors in managing organizational change. J. Bus. Res. 2022, 143, 225–238. [Google Scholar] [CrossRef]
  29. Montero Guerra, J.M.; Danvila-del-Valle, I.; Suarez, M.M. The impact of digital transformation on talent management. Technol. Forecast. Soc. Change 2023, 188, 122291. [Google Scholar] [CrossRef]
  30. Scupola, A.; Mergel, I. Co-production in digital transformation of public administration and public value creation: The case of Denmark. Gov. Inf. Q. 2022, 39, 101650. [Google Scholar] [CrossRef]
  31. Busulwa, R.; Pickering, M.; Mao, I. Digital transformation and hospitality management competencies: Toward an integrative framework. Int. J. Hosp. Manag. 2022, 102, 103132. [Google Scholar] [CrossRef]
  32. D’Ambra, J.; Akter, S.; Mariani, M. Digital transformation of higher education in Australia: Understanding affordance dynamics in E-Textbook engagement and use. J. Bus. Res. 2022, 149, 283–295. [Google Scholar] [CrossRef]
  33. Hasfeld, K.H.J.; Hussein, B.; Rauzy, A.R. Government inter-organizational, digital transformation projects: Five key lessons learned from a Norwegial case study. Procedia Comput. Sci. 2021, 196, 910–919. [Google Scholar] [CrossRef]
  34. Jayawardena, C.; Ahmad, A.; Valeri, M.; Jaharadak, A.A. Technology acceptance antecedents in digital transformation in hospitality industry. Int. J. Hosp. Manag. 2023, 108, 103350. [Google Scholar] [CrossRef]
  35. Irani, Z.; Abril, R.M.; Weerakkody, V.; Omar, A.; Sivarajah, U. The impact of legacy systems on digital transformation in European public administration: Lesson learned from a multi case analysis. Gov. Inf. Q. 2022, 40, 101784. [Google Scholar] [CrossRef]
  36. Dionisio, M.; Jorge de Souza Junior, S.; Paula, F. The role of digital transformation in improving the efficacy of healthcare: A systematic review. J. High Technol. Manag. Res. 2023, 34, 1–15. [Google Scholar] [CrossRef]
  37. Gasco-Hernandez, M.; Nasi, G.; Cucciniello, M.; Hiedemann, A.M. The role of organizational capacity to foster digital transformation in local governments: The case of three European smart cities. Urban Gov. 2022, 2, 236–246. [Google Scholar] [CrossRef]
  38. Silva, R.P.; Saraiva, C.; Mamede, H.S. Assessment of organizational readiness for digital transformation in SMEs. Procedia Comput. Sci. 2022, 204, 362–369. [Google Scholar] [CrossRef]
  39. Battistoni, E.; Gitto, S.; Murgia, G.; Campisi, D. Adoption paths of digital transformation in manufacturing SME. Int. J. Prod. Econ. 2023, 255, 108675. [Google Scholar] [CrossRef]
  40. Tuukkanen, V.; Wolgsjo, E.; Rusu, L. Cultural Values in Digital Transformation in a Small Company. Procedia Comput. Sci. 2022, 196, 3–12. [Google Scholar] [CrossRef]
  41. Gouveia, F.D.; São Mamede, H. Digital Transformation for SMES in the Retail Industry. Procedia Comput. Sci. 2022, 204, 671–681. [Google Scholar] [CrossRef]
  42. Malodia, S.; Mishra, M.; Fait, M.; Papa, A.; Dezi, L. To digit or to head? Designing digital transformation journey of SMEs among digital self-efficacy and professional leadership. J. Bus. Res. 2023, 157, 113547. [Google Scholar] [CrossRef]
  43. Samper, M.G.; Sukier, H.B.; Palencia, D.B.; Molina, R.I.R.; Alfaro, K.B.; Sanchez, Y.S.; Sarmiento, A.C.F. Digital transformation of business models: Influence of operation and trade variables. Procedia Comput. Sci. 2022, 203, 565–569. [Google Scholar] [CrossRef]
  44. Ghosh, S.; Hughes, M.; Hodgkinson, I.; Hughes, P. Digital transformation of industrial businesses: A dynamic capability approach. Technovation 2022, 113, 102414. [Google Scholar] [CrossRef]
  45. Reuschl, A.J.; Deist, M.K.; Maalaoui, A. Digital transformation during a pandemic: Stretching the organizational elasticity. J. Bus. Res. 2022, 144, 1320–1332. [Google Scholar] [CrossRef]
  46. Mann, G.; Karanasios, S.; Breidbach, C.F. Orchestrating the digital transformation of a business ecosystem. J. Strateg. Inf. Syst. 2022, 31, 101733. [Google Scholar] [CrossRef]
  47. Wang, Q.; Hu, A.; Tian, Z. Digital transformation and electricity consumption: Evidence from the Broadband China pilot policy. Energy Econ. 2022, 115, 106346. [Google Scholar] [CrossRef]
  48. Skare, M.; de Obesso, M.d.l.M.; Ribeiro-Navarrete, S. Digital transformation and European small and medium enterprises (SMEs): A comparative study using digital economy and society index data. Int. J. Inf. Manag. 2023, 68, 102594. [Google Scholar] [CrossRef]
  49. Liu, Z.; Zhou, J.; Li, J. How do family firms respond strategically to the digital transformation trend: Disclosing symbolic cues or making substantive changes? J. Bus. Res. 2023, 155, 113395. [Google Scholar] [CrossRef]
  50. Fernandez-Vidal, J.; Perotti, F.A.; Gonzalez, R.; Gasco, J. Managing digital transformation: The view from the top. J. Bus. Res. 2022, 152, 29–41. [Google Scholar] [CrossRef]
  51. Zuzaku, A.; Abazi, B. Digital Transformation in the Western Balkans as an Opportunity for Managing Innovation in Small and Medium Businesses—Challenges and Opportunities. IFAC Pap. Online 2022, 55, 60–65. [Google Scholar] [CrossRef]
  52. Raimo, N.; De Turi, I.; Albergo, F.; Vitolla, F. The drivers of the digital transformation in the healthcare industry: An empirical analysis in Italian hospitals. Technovation 2022, 102558, 102558. [Google Scholar] [CrossRef]
  53. Kováčikova, K.; Remencova, T.; Sedlackova, A.N.; Novak, A. The impact of Covid-19 on the digital transformation of the airports. Transp. Res. Procedia 2022, 64, 84–89. [Google Scholar] [CrossRef]
  54. Okorie, O.; Russell, J.; Cherrington, R.; Fisher, O.; Charnley, F. Digital transformation and the circular economy: Creating a competitive advantage from the transition towards Net Zero Manufacturing. Resour. Conserv. Recycl. 2023, 189, 106756. [Google Scholar] [CrossRef]
  55. Tuyen, B.Q.; Anh, D.V.P.; Mai, N.P.; Long, T.Q. Does corporate engagement in social responsibility affect firm innovation? The mediating role of digital transformation. Int. Rev. Econ. Financ. 2023, 84, 292–303. [Google Scholar] [CrossRef]
  56. Pacolli, M. Importance of Change Management in Digital Transformation. IFAC Pap. Online 2022, 55, 276–280. [Google Scholar] [CrossRef]
  57. Zhong, X.; Ren, G. Independent and joint effects of CSR and CSI on the effectiveness of digital transformation for transition economy firms. J. Bus. Res. 2023, 156, 113478. [Google Scholar] [CrossRef]
  58. Rogers, E.M. Diffusion of Innovations, 3rd ed.; The Free Press: New York, NY, USA, 1983. [Google Scholar]
  59. Moore, G.C.; Benbasat, I. Development of an Instrument to Measure the Perceptions of Adopting an Information Technology Innovation. Inf. Syst. Res. 1991, 2, 192–222. [Google Scholar] [CrossRef]
  60. Venkatesh, V.; Morris, M.G.; Davis, G.B.; Davis, F.D. User Acceptance of Information Technology: Toward a Unified View. MIS Q. 2003, 27, 425–478. [Google Scholar] [CrossRef]
  61. Seth, J.N.; Stellner, W.H. Psychology of Innovation Resistance: The Less Developed Concept (LDC) in Diffusion Research; College of Commerce and Business Administration, University of Illinois at Urbana-Champaign: Urbana-Champaign, IL, USA, 1979. [Google Scholar]
  62. Alba, J.W.; Hutchinson, W.J. Dimensions of Consumer Expertise. J. Consum. Res. 1987, 13, 411–454. [Google Scholar] [CrossRef]
  63. Agarwal, R.; Prasad, J. A Conceptual and Operational Definition of Personal Innovativeness in the Domain of Information Technology. Inf. Syst. Res. 1988, 9, 204–215. [Google Scholar] [CrossRef]
  64. De Vries, H.; Dijkstra, M.; Kuhlman, P. Self-efficacy: The third factor besides attitude and subjective norm as a predictor of behavioural intentions. Health Educ. Res. 1988, 3, 273–282. [Google Scholar] [CrossRef]
  65. Zaichkowsky, J.L. The Personal Involvement Inventory: Reduction, Revision, and Application to Advertising. J. Advert. 1994, XXIII, 59–70. [Google Scholar] [CrossRef]
  66. Krugman, H.E. Memory Without Recall, Exposure Without Perception. J. Advert. Res. 2000, 40, 50–54. [Google Scholar] [CrossRef]
  67. Petty, R.E.; Cacioppo, J.T. Involvement and Persuasion: Traditions Versus Integration. Psychol. Bull. 1990, 10, 367–374. [Google Scholar] [CrossRef]
  68. Ostlund, L.E. Perceived Innovation Attributes as Predictors of Innovativeness. J. Consum. Res. 1974, 1, 23–29. [Google Scholar] [CrossRef]
  69. Ram, S. A Model of Innovation Resistance. Adv. Consum. Res. 1987, 14, 208–212. [Google Scholar]
  70. Davis, F.D. Perceived Usefulness, Perceived Ease of Use, and User Acceptance of Information Technology. MIS Q. 1989, 13, 319–340. [Google Scholar] [CrossRef]
  71. Ringle, C.M.; Wende, S.; Becker, J.-M. SmartPLS 4. Oststeinbek: SmartPLS, 31 08 2022. Available online: https://www.smartpls.com/ (accessed on 22 January 2023).
  72. Hair, J.F.; Ringle, C.M.; Gudergan, S.P.; Fischer, A.; Nitzl, C.; Menictas, C. Partial least squares structural equation modeling-based discrete choice modeling: An illustration in modeling retailer choice. Bus. Res. 2019, 12, 115–142. [Google Scholar] [CrossRef]
  73. Hair, J.F.; Ringle, C.M.; Sarstedt, M. Editorial—Partial Least Squares Structural Equation Modeling: Rigorous Applications, Better Results and Higher Acceptance. Long Range Plan. 2013, 46, 1–12. [Google Scholar] [CrossRef]
  74. Zhang, J.; Long, J.; von Schaewen, A.M.E. How does digital transformation improve organizational resilience?—Findings from PLS-SEM and fsQCA. Sustainability 2021, 13, 11487. [Google Scholar] [CrossRef]
  75. Galindo-Martín, M.Á.; Castaño-Martínez, M.S.; Méndez-Picazo, M.T. Digital transformation, digital dividends and entrepreneurship: A quantitative analysis. J. Bus. Res. 2019, 101, 522–527. [Google Scholar] [CrossRef]
  76. Ko, A.; Fehér, P.; Kovacs, T.; Mitev, A.; Szabó, Z. Influencing factors of digital transformation: Management or IT is the driving force? Int. J. Innov. Sci. 2021, 14, 1–20. [Google Scholar] [CrossRef]
  77. Singh, S.; Sharma, M.; Dhir, S. Modeling the effects of digital transformation in Indian manufacturing industry. Technol. Soc. 2021, 67, 101763. [Google Scholar] [CrossRef]
  78. Korachi, Z.; Bounabat, B. General approach for formulating a digital transformation strategy. J. Comput. Sci 2020, 16, 493–507. [Google Scholar]
  79. El Hilali, W.; El Manouar, A.; Idrissi, M.A.J. Reaching sustainability during a digital transformation: A PLS approach. Int. J. Innov. Sci. 2020, 12, 52–79. [Google Scholar] [CrossRef]
  80. Sousa, M.J.; Rocha, Á. Digital learning: Developing skills for digital transformation of organizations. Future Gener. Comput. Syst. 2019, 91, 327–334. [Google Scholar] [CrossRef]
  81. Jović, M.; Tijan, E.; Vidmar, D.; Pucihar, A. Factors of Digital Transformation in the Maritime Transport Sector. Sustainability 2022, 14, 9776. [Google Scholar] [CrossRef]
  82. Căpușneanu, S.; Mateș, D.; Tűrkeș, M.C.; Barbu, C.-M.; Staraș, A.-I.; Topor, D.I.; Stoenică, L.; Fűlöp, M.T. The Impact of Force Factors on the Benefits of Digital Transformation in Romania. Appl. Sci. 2021, 11, 2365. [Google Scholar] [CrossRef]
  83. Hair, J.F.; Hult, G.T.M.; Ringle, C.M.; Sarstedt, M. A Primer on Partial Least Squares Structural Equation Modeling (PLS-SEM), 2nd ed.; Sage Publications Inc.: Thousand Oaks, CA, USA, 2017. [Google Scholar]
  84. Chin, W.W.; Peterson, R.A.; Brown, P.S. Structural equation modelling in marketing: Some practical reminders. J. Mark. Theory Pract. 2008, 16, 287e298. [Google Scholar] [CrossRef]
  85. Cohen, J. Statistical Power Analysis for the Behavioral Sciences, 2nd ed.; Lawrence Erlbaum Associates, Inc.: Hillsdale, NJ, USA, 1988. [Google Scholar]
  86. Benitez, J.; Henseler, J.; Castillo, A.; Schuberth, F. How to perform and report an impactful analysis using partial least squares: Guidelines for confirmatory and explanatory IS research. Inf. Manag. 2020, 57, 103168. [Google Scholar] [CrossRef]
  87. Vuță, D.R.; Nichifor, E.; Chitu, I.B.; Brătucu, G. Digital Transformation—Top Priority in Difficult Times: The Case Study of Romanian Micro-Enterprises and SMEs. Sustainability 2022, 14, 10741. [Google Scholar] [CrossRef]
  88. Dakduk, S.; Santalla-Banderali, Z.; Siqueira, J.R. Acceptance of mobile commerce in low-income consumers: Evidence from an emerging economy. Helyon 2020, 6, e05451. [Google Scholar] [CrossRef]
  89. Hofstede Insights, 2023, Romania. Available online: https://www.hofstede-insights.com/country-comparison-tool?countries=romania (accessed on 1 October 2023).
  90. Kitsios, F.; Giatsidis, I.; Kamariotou, M. Digital Transformation and Strategy in the Banking Sector: Evaluating the Acceptance Rate of E-Services. J. Open Innov. Technol. Mark. Complex. 2021, 7, 204. [Google Scholar] [CrossRef]
  91. Kuah, A.T.H.; Wang, P. Circular Economy and consumer acceptance: An exploratory study in East and Southeast Asia. J. Clean. Prod. 2020, 247, 119097. [Google Scholar] [CrossRef]
Figure 1. Theoretical model of the digital transformation.
Sustainability 15 15268 g001
Figure 2. Structural model of digital transformation.
Sustainability 15 15268 g002
Table 1. Sample description (n = 123).
Socio-Demographic CharacteristicValuesPercent
Age<259.8
25–3510.6
36–4527.6
46–5537.4
56–656.5
>658.1
GenderMale51.2
Female48.8
Area of residenceUrban90.2
Rural9.8
Degree of digitalizationInformative org. level2.4
Informative Social Media17.9
Conceptual understanding11.4
Average12.2
Digitally mature26.8
Do not know29.3
Table 2. Constructs and corresponding measurements items.
Constructs
Items
LoadingsAVECronbach’s Alpha
Behavioral Factors (BF) 0.6210.948
KnowledgeI am well aware of the pros and cons of products or services to which DT is applied. (BF1_K)0.753
I am well aware of products or services to which digital technology is applied. (BF2_K)0.777
I can explain to others about a product or service to which digital technology is applied. (BF3_K)0.816
I am confident in solving problems related to products or services to which digital technology is applied. (BF4_K)0.833
Individual
innovativeness
I usually use products with new technology before anyone else. (BF5_II)0.882
I try to use products or services with advanced technology first. (BF6_II)0.816
I tend to inform people around me about products with new technology. (BF7_II)0.745
Self-efficacyI think I can use DT more easily than others. (BF8_SE)0.800
I think I can accumulate knowledge about digital technology in a relatively short time. (BF9_SE)0.840
I am confident in using DT. (BF10_SE)0.558
InvolvementI am interested in innovative new DT. (BF11_I)0.727
Please estimate how much time/week would you use to learn about new p/s with DT? (BF12_I)0.884
Do you want to use p/s with advanced DT. (BF13_I)0.757
Innovative Characteristics (IC) 0.7100.940
Relative advantageDT is likely to be more useful than existing technology. (IC1_RA)0.885
Using DT will be more convenient than using existing technology. (IC2_RA)0.901
DT is more reliable compared to existing technology. (IC3_RA)0.863
DT will be better compared to existing technology. (IC4_RA)0.923
Technological
innovativeness
I think DT is made with the latest technology. (IC5_TI)0.778
DT is innovative. (IC6_TI)0.860
DT is original, creative, and novel. (IC7_TI)0.844
DT differs greatly from existing technology. (IC8_TI)0.659
Acceptance Attitude of Digital Transformation (DA) 0.8940.941
Acceptance Attitude of DTI think positively about using products or services with DT applied. (DA1)0.947
I feel good about using products or services with DT. (DA2)0.948
I am actively in of the use of products or services to which DT is applied. (DA3) 0.941
Personal Acceptance (PA) 0.9740.925
Personal
acceptance
I am willing to use a product or service with DT applied. (PA1)0.960
If I have a chance, I will use products or services with DT applied. (PA2)0.972
I will continue to use products or services with DT applied in the future. (PA3)0.953
Social Acceptance (SA) 0.9080.950
Social
acceptance
DT and related products or services should be used more actively in our society. (SA1)0.953
DT and related products or services should be used in more diverse areas of our society. (SA1)0.956
We need to gradually increase the use of DT in our society. (SA1)0.950
Table 3. Validity and reliability indicators.
ConstructCronbach’s AlphaComposite
Reliability (rho_a)
Composite
Reliability (rho_c)
Average Variance Extracted (AVE)
Behavioral Factors (BF)0.9480.9540.9550.621
Knowledge0.8860.8860.9210.746
Individual innovativeness0.9140.9160.9460.854
Self-efficacy0.8440.8440.9060.763
Involvement0.7990.8400.8800.712
Innovative Characteristics (IC)0.9400.9470.9510.710
Relative advantage0.9520.9530.9650.874
Technological innovativeness0.8700.8850.9130.725
Digital Transformation Acceptance Attitude (DA)0.9410.9410.9620.894
Personal Acceptance (PA)0.9590.9600.9740.925
Social Acceptance (SA)0.9500.9500.9670.908
Table 4. Path coefficients and hypothesis validation.
HypothesisRelationshipPath
Coefficient
T Statisticsp-ValuesDecisionf2
H1Indiv. Innov. → BF0.31412.4260.000Supported265.450
H1Involv → BF0.21919.5140.000Supported148.026
H1Knowledge → BF0.31620.1050.000Supported307.318
H1Self. efic. → BF0.25814.3110.000Supported167.346
H2Rel adv → IC0.59429.9830.000Supported136,947.164
H2Tech Inov → IC0.46628.5430.000Supported84,292.345
H3BF → DA0.2822.8790.004Supported0.154
H3IC → DA0.6677.5590.000Supported0.861
H4DA → PA0.92942.0660.000Supported6.272
H5DA → SA0.89128.4950.000Supported3.834
Disclaimer/Publisher’s Note: The statements, opinions and data contained in all publications are solely those of the individual author(s) and contributor(s) and not of MDPI and/or the editor(s). MDPI and/or the editor(s) disclaim responsibility for any injury to people or property resulting from any ideas, methods, instructions or products referred to in the content.

